Final report for GNE18-168
Project Information
Nitrogen is a major problem for sustainable agriculture. Crops, with the exception of legumes, have to use inorganic or organic N from the soil, and often additional N amendments are needed to increase crop yields. Converting to no-tillage has been suggested as a way to more sustainably farm, however, N2O emissions are higher in recently converted no-till compared to conventionally tilled plots. However, earlier research speculated that after ~ 10 years of no-till, no-till should result in lower N2O emissions. In agricultural soils, N2O is produced through denitrification and nitrification processes. In our study, we aimed to understand how 40 years of long-term tillage influence N2O production and microbial communities associated with denitrification and nitrate ammonification. We chose to include nitrate ammonification because this microbial pathway competes with denitrification for available nitrate (NO3-). We measured N2O in the corn and soybean entry of this long-term tillage trial and took rhizosphere and bulk soil samples to quantify denitrifier and nitrate ammonifier abundances. We found that chisel-disking had the highest cumulative N2O emissions, followed by no-till, while moldboard ploughing had the lowest cumulative emissions. Moldboard ploughing had higher abundances of N2O-reducing genes compared to no-till, which may indicate a greater reduction of N2O to N2 in the moldboard plow treatments. Over the growing season, denitrifier and nitrate ammonifier genes decreased in abundances, which would correlate with lower N2O emissions.
Challenges that we faced when conducting this project included an unusually wet late-summer and fall in 2018. We were unable to take field measurements from mid July-early August because of rain and saturated soil conditions. We had hoped to measure N2O following harvesting of the corn but we could not put the heavy harvesting equipment on the saturated no-till plots, so we had to wait to harvest until the ground was frozen (mid December). We had also hoped to include samples from cover crops but since we were unable to harvest corn early, it was impossible to plant a cover crop.
We also faced challenges in the lab with quantifying gene abundances. This step took longer than we anticipated and required a lot of troubleshooting. Fortunately, we were able to quantify the genes and include those in this study.
Objective 1: Investigate the effects of different long-term (40 years) tillage practices on crop N capture.
Objective 2: Determine how different long-term tillage practices affect N2O emissions.
Objective 3: Investigate the effects of tillage, crop, and growth stage on bacterial communities in the bulk and rhizosphere soils of corn and soybean entries.
Objective 4: Evaluate how the microbial communities associated with nitrate ammonification and denitrification change across tillage, crop, and soil compartment.
Objective 5: Evaluate how the microbial communities associated with nitrate ammonification and denitrification change across corn or soybean growth stages, tillage, and soil compartment.
Expected outcome: Bacterial gene quantities for nirS/nirK will be sensitive to tillage practices, bulk versus rhizosphere soils, and dependent on crop type.
The overall objective of this project is to determine how long-term no till agriculture impacts microbial N dynamics of soils and ultimately crop N uptake in a corn-soybean-small grain rotation.
In the northeast, dairies and smaller farms that produce a diverse range of crops dominate the region. Dairies are of particular importance because of the large amounts of manure that are produced from the cows. Most if not all of the manure will get applied to fields to grow crops and forage for their animals. To better conserve their soils and to increase soil health, farmers in the northeast are adopting no-till and cover cropping practices and there is a need to conserve N from manure and legume cover crops, rather than lose it to leaching, run-off or gaseous emissions.
This proposal addresses the need to understand how no-till affects the activities and kinds of microorganisms that carry out soil N cycling processes. It has been hypothesized that over time (20+ years), the lower bulk density, water-holding capacity, and increased SOM expected for no-till soils (Linn and Doran, 1984; Guzha, 2004) will lead to lower soil redox values (Clay et al., 1990) and ultimately lower N2O emissions. Initially (during the first 10 years of no-till), N2O emissions are expected to be higher compared to plowed soils (Baggs et al., 2003; Singurindy et al., 2009; Regina and Alakukku, 2010; Mangalassery et al., 2014). Over the next ten years, emissions ae expected to become comparable (Grandy et al., 2006), and then lower than plowed soils after 20 years (Six et al., 2004). These projections are not supported by other studies such as the one by Oorts et al. (2007) showing that 30 years of no-till still showed higher N2O emissions. This is perhaps due to infrequent N2O sampling (Singurindy et al., 2009; Nugroho et al., 2015). Therefore, this project is designed to measure N2O with higher frequency, especially following field operations including cover crop termination, ploughing or chisel/disking, fertilization, and crop harvest, as well as after rainfall events.
It is unclear how tillage will affect NA in these systems, as there are no published studies that have focused on this specifically. However, it has been hypothesized that systems that have higher moisture, higher SOM, and lower redox status may stimulate NA competition (Rütting et al., 2011). Therefore, it follows that no-till systems may provide conditions conducive to increasing NA activity (Bhowmik et al., 2017) and promoting the growth of bacteria known to carry out NA (Ceja-Navarro et al., 2010). Similarly, crop rhizospheres may provide excellent conditions for increased NA due to the increased C from root exudates, lower oxygen availability due to heterotrophic respiration, and abundance of microbes that can carry out NA like rhizobia (Rütting et al., 2011).
With the rise of no-till and increased diversity of cropping systems, it is clear that research needs to be performed to identify the most sustainable agricultural practices. Promoting tighter plant-microbe N cycling through NA and N2O consumption is important for not only the environment but also for farmers, as increasing the efficiency of the soil N cycle will result in lower quantities of fertilization and increase the profitability of farming in the northeast.
Research
Site Description and Experimental Design
Samples for this experiment were collected from a long-term tillage experiment at the Larson E. Russell Agricultural Research Center, Rock Springs, Pennsylvania (USA). This tillage experiment was first established in 1978 and was in continuous corn until 2004 when it was repeated with a corn-soybean-small grain & cover crop 3-year rotation. Samples for this experiment were collected in 2018 and 2019 in the corn (variety Pioneer P0506AM) and soybean entries, approximately 40 and 41 years after experimental establishment. Corn was planted on Mary 29th, 2018 and soybean was planted on June 12th, 2019. Corn was fertilized with an initial amendment of 4 gallons of N-P-K 10-34-0 plus 150 lbs of 21-0-0-24 at planting and side dressed with 40 gallons of 30% UAN on July 3rd, 2018.
Of the tillage practices included in the experiment, we sampled the no-till (NT), chisel/disk (CD), and moldboard plow (MP) treatments. Depth of tillage for the CD plots was between 20-25 cm and 30-35 cm for MP. After primary tillage, a secondary disking was used for both CD and MP plots at a depth of 10 cm. These tillage treatments were in a randomized complete block design with four replications. High rainfall in 2019 resulted in flooding of two of the treatments in block 1, therefore, block 1 was not sampled in 2019.
Bulk Soil and Rhizosphere Sampling
Paired bulk soil samples and rhizosphere samples were collected in the spring and summer of 2018 and 2019 across all three tillage treatments. Samples were taken from corn at three different vegetative growth stages to include V3/4, V5/6, and V9/10 on 6/14/2018, 7/3/2018, and 7/13/2018, respectively. Sets of samples from 2019 were taken from the Soybean entries and included sampling of Soybean at V2, V3, and R1 and were collected on 7/7/19, 7/23/19, and 7/31/19, respectively. Soil samples were collected with a 19 mm diameter soil sampler at a depth of 0-15 cm at 12 locations across each plot. Similarly, 12 plants were dug up to collect root samples. Roots were shaken in the field to remove non-rhizosphere soil. Each set of 12 samples were homogenized and a portion of the samples were stored at -80C for molecular analysis, while the rest were stored at 4C. Soil moisture was assessed by drying wet soil and calculating the percent of water lost.
Approximately 0.25 g of soil was used for DNA extractions with the Qiagen PowerSoil DNeasy Extraction kit. Following extraction, DNA yield and quality were assessed using a Thermo Scientific NanoDrop spectrophotometer. Quantitative PCR (qPCR) was used to quantify the concentration of denitrifiers, N2O consumer and nitrate ammonifiers in each sample. Genes quantified include nirK and nirS for denitrifiers, nosZI and noszII for N2O consumers, and nrfA for nitrate ammonifiers. Additionally, 16S rRNA communities were quantified. Amplification was performed on an Applied Biosystems ABI 7500 real-time thermo cycler. Nitrogen cycling marker genes were normalized based on 16S rRNA genes (nirK gene copies / 16S rRNA gene copies) to assess the relative abundance of N cycling genes compared to total bacterial communities.
Additional analyses with DNA extracts were performed to sequence the bacterial communities of the rhizosphere and bulk soils sampled. Extracted DNA was amplified with 16S rRNA gene primers and sequenced on an Illumina MiSeq sequencer at the Genomics Core Facility, Penn State, PA. Sequences were processed and quality filtered using R and following the dada2 pipeline.
Aboveground biomass samples were kept from the rhizosphere sampling of corn and soybean. These plant tissues were oven dried and ground. Total nitrogen (N) and carbon (C) were assessed on a CHNS analyzer.
N2O Emissions and Soil Sampling
Gaseous emissions of N2O were measured across the with a fourier-transform infrared spectrometer (FTIR) in the field. Measurements were continuously taken for approximately five minutes at each plot. To quantify the amount of nitrogen loss from these systems, N2O was converted to gN-N2O/ha/day by multiplying the slope (N2O measurements over the five-minute interval) by the time of measurments, to get ppm N2O, then multiplying ppm N2O by constants, 1.94 and 1459.87.
Composite bulk soils samples (10/plot) were also collected at the time of N2O measurements. A portion of the soil was air-dried and the other half was stored at 4C. Air-dried soil samples were ground to 2 mm and approximately 2.5 g of soil was used to measure labile carbon using the permanganate oxidizable carbon (POXC) fraction method. Inorganic nitrogen analysis to include measurement of NH4 and NO3 were performed following extraction with 2 M KCl. Soil temperature and soil moisture measurements were taken at a depth of 7.5 cm.
Statistics
All analyses were performed in R and R studio. Total C and N from aboveground plant tissue were assessed using linear mixed effects models to account for a random Block effect. Permutational multivariate analysis of variances (PERMANOVA) were performed to assess how 1) N cycling gene profiles and 2) bacterial communities changed across Tillage, Crop, and Growth Stage. Linear mixed effects models were also used to assess individual N gene abundances and alpha-diversity of the bacterial communities.
To supplement the objectives and analyses that were performed, soil fertility was assessed from samples collected in May of 2018 and 2019. Results of the soil fertility can be found in Table 1.
Table 1. Mean average soil fertility results across the three tillage treatments in 2018 (4 blocks sampled) and 2019 (3 blocks sampled).
|
Tillage |
Year |
pH |
Ca (ppm) |
Cu (ppm) |
K (ppm) |
Mg (ppm) |
P (ppm) |
S (ppm) |
Zn (ppm) |
Acidity |
CEC |
K% |
Mg% |
Ca% |
|
NT |
2018 |
6.29 |
1061.30 |
1.03 |
61.75 |
98.25 |
27.50 |
9.28 |
1.2 |
3.10 |
9.38 |
1.68 |
8.70 |
56.40 |
|
CD |
2018 |
6.50 |
1102.45 |
1.03 |
67.00 |
127.00 |
27.25 |
9.68 |
1.25 |
2.83 |
9.58 |
1.80 |
11.05 |
57.80 |
|
MP |
2018 |
6.56 |
1208.85 |
1.08 |
76.00 |
148.00 |
22.75 |
8.48 |
1.05 |
2.05 |
9.50 |
2.03 |
12.33 |
62.88 |
|
NT |
2019 |
6.44 |
1288.60 |
1.07 |
67.33 |
128.67 |
26.67 |
8.87 |
1.17 |
1.87 |
9.57 |
1.77 |
11.10 |
66.87 |
|
CD |
2019 |
6.64 |
1215.10 |
1.13 |
70.67 |
218.67 |
21.67 |
9.00 |
1.27 |
2.63 |
10.73 |
1.63 |
16.57 |
56.53 |
|
MP |
2019 |
6.96 |
1385.30 |
1.37 |
117.00 |
293.00 |
15.33 |
7.53 |
0.93 |
1.13 |
10.77 |
2.67 |
21.20 |
63.27 |
Objective 1: Investigate the effects of different long-term (40 years) tillage practices on crop N capture.
Results: Total carbon in the corn and soybean tissues was not different across tillage or crop, while total nitrogen and C:N ratios were different between the two variables. Total N was higher in the NT tillage treatment (3.50 ± 0.13) compared to MP (3.19 ± 0.15) and CD (3.23 ± 0.13) in the soybean entry but no differences were observed in the corn entry. Ratios of C to N were higher in the MP (12.14 ± 0.23) treatment compared to NT (11.64 ± 0.50) in the soybean year. Values for total N, C and C:N ratios averaged across sampling date and tillage are presented in table 2.
Table 2. Total N, total C, and C:N ratios across sampling date and tillage treatment. Values shown are mean averages with standard errors presented in ().
|
Total N mean |
Total N std. error |
Total C mean |
Total C std. err |
C:N mean |
C:N std. err |
||
|
7.3.18 |
NT |
3.46 |
0.17 |
37.86 |
1.45 |
10.97 |
0.33 |
|
CD |
3.55 |
0.11 |
36.86 |
2.03 |
10.38 |
0.46 |
|
|
MP |
3.65 |
0.04 |
38.03 |
0.87 |
10.44 |
0.33 |
|
|
7.13.18 |
NT |
2.70 |
0.08 |
41.03 |
0.06 |
15.22 |
0.41 |
|
CD |
2.86 |
0.11 |
41.58 |
0.32 |
14.62 |
0.57 |
|
|
MP |
2.86 |
0.10 |
41.03 |
0.18 |
14.40 |
0.55 |
|
|
7.7.19 |
NT |
3.35 |
0.18 |
39.42 |
0.15 |
11.82 |
0.68 |
|
CD |
3.13 |
0.18 |
37.16 |
1.72 |
11.89 |
0.50 |
|
|
MP |
2.76 |
0.30 |
34.95 |
2.90 |
12.74 |
0.38 |
|
|
7.23.19 |
NT |
3.95 |
0.11 |
39.98 |
1.22 |
10.17 |
0.58 |
|
CD |
3.57 |
0.25 |
40.21 |
1.11 |
11.35 |
0.52 |
|
|
MP |
3.29 |
0.16 |
39.31 |
0.60 |
11.98 |
0.45 |
|
|
7.31.19 |
NT |
3.20 |
0.12 |
41.31 |
0.22 |
12.94 |
0.44 |
|
CD |
3.00 |
0.13 |
41.07 |
0.22 |
13.73 |
0.53 |
|
|
MP |
3.50 |
0.01 |
40.98 |
0.29 |
11.70 |
0.09 |
Objective 2: Determine how different long-term tillage practices affect N2O emissions.
Results: Nitrous oxide emissions were assessed in the corn entry (2018) and soybean entry (2019) of the three-year rotation in the long-term tillage experiment. Across the entire experiment, the CD resulted in the greatest loss of N2O with 15071.711 gN-N2O ha-1 emissions over the 28 days of measurements. Emissions in the NT were half of those in the CD treatment, while emissions in the MP treatment were half of those from the NT treatment (Table 3). Emissions of N2O in the corn year accounted for more than 95% of the N2O emitted across the two years of sampling.
Table 3. Untransformed gN-N2O ha-1 day-1 emissions from 11 samples collected in the corn entry and 17 collected in the soybean entry.
|
|
|
CD |
MP |
NT |
Total gN-N2O ha-1 |
|
Corn & Soybean |
Mean daily averages |
150.72 (67.95) |
30.95 (6.50) |
77.33 (51.18) |
86.33 (28.49) |
|
|
Total (n=28) |
15071.71 |
3095.38 |
7732.84 |
25899.93 |
|
Corn |
Mean daily averages |
331.05 (151.01) |
60.08 (13.38) |
161.91 (115.74) |
184.35 (63.84) |
|
|
Total (n=11) |
14566.19 |
2643.45 |
7124.17 |
24333.82 |
|
Soybean |
Mean daily averages |
9.03 (1.35) |
8.22 (1.60) |
10.99 (3.02) |
9.38 (1.22) |
|
|
Total (n= 17) |
505.52 |
451.93 |
608.66 |
1566.11 |
Results indicated that Tillage did not have a significant effect on N2O emissions, but Crop year did and the interaction between Tillage and Crop year was trending (p = 0.09). Gas emissions in the corn year were higher than those from the soybean year, 0.58 ± 0.08 gN-N2O ha-1 day-1 compared to -0.45 ± 0.06 gN-N2O ha-1 day-1. These values had been transformed to meet model assumptions using the ordered quantile technique.
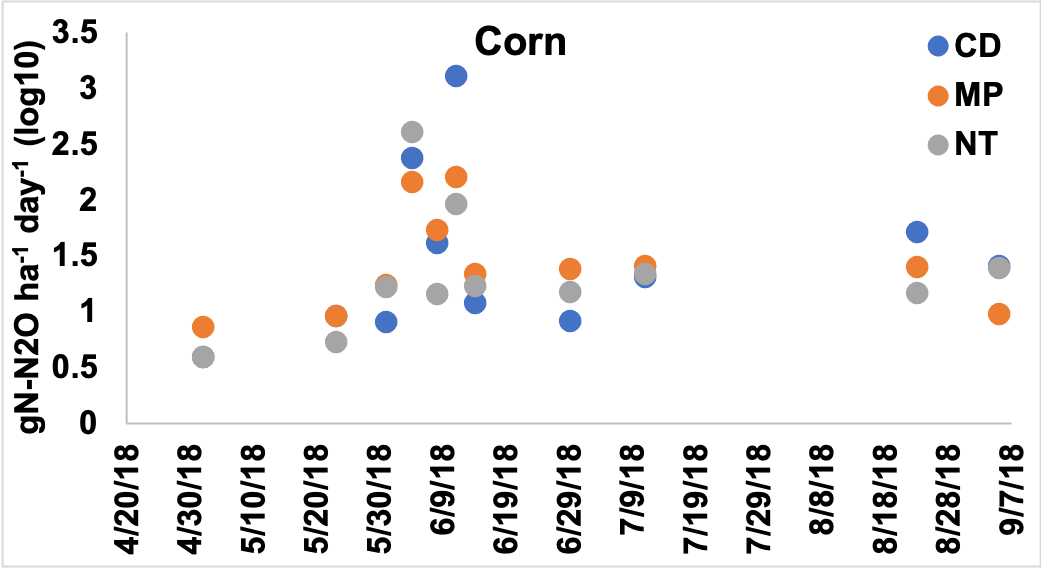
Figure 1. Emissions of N2O presented as log 10 transformed gN-N2O ha-1 day-1 across the tillage treatments in the corn year. Primary tillage occurred on May 23rd, secondary tillage occurred on May 28th, and corn was planted on May 29th. Fertilizer was added at planting and added again on July 3rd.
To assess whether tillage had an effect on N2O emissions across the corn and soybean years, separate models were created for corn and soybean to include the variables Tillage and Sampling Date. In the corn year, date was significant but Tillage and the interaction between the variables were not significant. Emissions in early-mid June were higher than those sampled in May and in July and later. Overall, CD had higher total emissions across the 11 sampling days, followed by NT, while MP had the lowest N2O emissions.
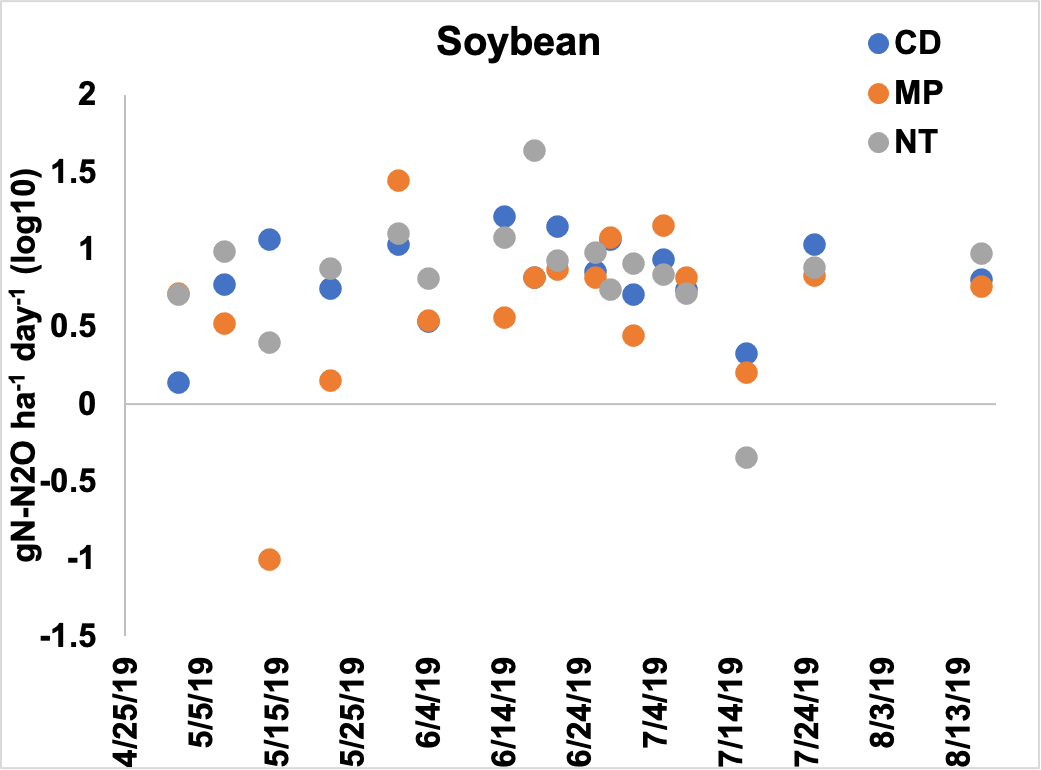
Figure 2. Emissions of N2O presented as log 10 transformed gN-N2O ha-1 day-1 across the tillage treatments in the soybean year. Primary tillage occurred on May 2nd, secondary tillage occurred on May 8th, and soybean was planted on June 12th.
Emissions of N2O in the soybean entry were different by sampling date and the interaction between sampling date and tillage treatment (p <0.05). On the May 8th, NT had higher emissions than MP and on May 14th CD had higher emissions from MP (Figure 2). On May 31st, MP had higher emissions than NT and on June 18th NT had higher emissions than either CD or MP. Across the sampling dates, NT had the greatest amount of N2O loss, followed by CD and MP (Table 3).
As an additional assessment, we looked at covariances between N2O emissions and ancillary data collected. Daily loss of N2O was negatively correlated with NH4+ and positively correlated with the day before precipitation, NO3-, total inorganic N, POXC, and soil moisture (Table 4). Out of all of the variables included, gN-N2O ha-1 day-1was most strongly correlated with soil moisture (R2 = 0.50) and NO3- (R2 = 0.48).
Table 4. Spearman correlations between soil variables, mean daily air temperature (MDTemp), and day before precipitation (DBPrecip). All correlation coefficients presented signify significant correlations between two variables.
|
NH4 |
SoilTemp |
MDTemp |
DBPrecip |
NO3 |
TIN |
POXC |
SoilMoisture |
gN-N2O ha day |
|
|
NH4 |
- |
-0.17 |
0.22 |
0.40 |
-0.16 |
-0.30 |
-0.22 |
||
|
SoilTemp |
- |
0.2 |
0.27 |
0.12 |
0.14 |
||||
|
MDTemp |
- |
-0.13 |
0.31 |
0.18 |
0.41 |
||||
|
DBPrecip |
- |
0.38 |
0.37 |
0.32 |
|||||
|
NO3 |
- |
0.86 |
0.15 |
0.37 |
0.48 |
||||
|
TIN |
- |
0.20 |
0.28 |
||||||
|
POXC |
- |
0.19 |
0.12 |
||||||
|
SoilMoisture |
- |
0.50 |
|||||||
|
gN N2O ha day |
- |
||||||||
Objective 3: Investigate the effects of tillage, crop, and growth stage on bacterial communities in the bulk and rhizosphere soils of corn and soybean entries.
Results: Rhizosphere and bulk soils were dominated by Acidobacteria and Proteobacteria (Table 5). Soybean rhizospheres had the highest abundance of Proteobacteria, ranging from 57-72% of the bacterial communities. Differences in communities were further assessed to determine how composition and alpha-diversity was impacted by tillage, crop, and soil compartment.
Table 5. Mean average relative abundances of the top 10 most abundant Phyla. Abundances are averaged cross crop growth stages and separated by soil compartment. Standard errors are presented in ().
|
|
Phyla |
Corn V3/4 |
Corn V5/6 |
Corn V8/9 |
Soy V2 |
Soy V3 |
Soy R1 |
Total mean abundance |
|
Bulk |
Acidobacteriota |
0.14 (0.01) |
0.27 (0.03) |
0.27 (0.02) |
0.34 (0.02) |
0.30 (0.02) |
0.29 (0.03) |
0.27 (0.01) |
|
Actinobacteriota |
0.13 (0.010 |
0.03 (0.01) |
0.07 (0.02) |
0.03 (0.01) |
0.03 (0.01) |
0.04 (0.01) |
0.05 (0.01) |
|
|
Bacteroidota |
0.02 (0.00) |
0.07 (0.01) |
0.06 (0.01) |
0.08 (0.01) |
0.06 (0.01) |
0.08 (0.01) |
0.06 (0.00) |
|
|
Crenarchaeota |
0.13 (0.01) |
0.08 (0.01) |
0.10 (0.01) |
0.08 (0.01) |
0.12 (0.02) |
0.07 (0.01) |
0.10 (0.01) |
|
|
Firmicutes |
0.01 (0.00) |
0.02 (0.01) |
0.01 (0.01) |
0.00 (0.00) |
0.00 (0.00) |
0.02 (0.02) |
0.01 (0.00) |
|
|
Gemmatimonadota |
0.02 (0.00) |
0.04 (0.01) |
0.04 (0.01) |
0.04 (0.01) |
0.04 (0.01) |
0.04 (0.01) |
0.04 (0.00) |
|
|
Myxococcota |
0.05 (0.00) |
0.02 (0.00) |
0.03 (0.00) |
0.03 (0.00) |
0.04 (0.01) |
0.03 (0.01) |
0.03 (0.00) |
|
|
Planctomycetota |
0.02 (0.00) |
0.02 (0.00) |
0.02 (0.00) |
0.03 (0.00) |
0.03 (0.00) |
0.03 (0.01) |
0.02 (0.00) |
|
|
Proteobacteria |
0.33 (0.01) |
0.35 (0.06) |
0.28 (0.02) |
0.25 (0.02) |
0.22 (0.02) |
0.29 (0.03) |
0.29 (0.01) |
|
|
Verrucomicrobiota |
0.09 (0.01) |
0.07 (0.01) |
0.07 (0.01) |
0.07 (0.01) |
0.07 (0.01) |
0.06 (0.01) |
0.07 (0.00) |
|
|
Rhizosphere |
Acidobacteriota |
0.20 (0.01) |
0.25 (0.02) |
0.25 (0.01) |
0.06 (0.01) |
0.17 (0.02) |
0.18 (0.03) |
0.20 (0.01) |
|
Actinobacteriota |
0.10 (0.02) |
0.06 (0.01) |
0.05 (0.01) |
0.05 (0.01) |
0.04 (0.01) |
0.05 (0.01) |
0.06 (0.00) |
|
|
Bacteroidota |
0.10 (0.01) |
0.08 (0.02) |
0.10 (0.01) |
0.08 (0.02) |
0.08 (0.01) |
0.06 (0.01) |
0.09 (0.01) |
|
|
Crenarchaeota |
0.05 (0.01) |
0.10 (0.01) |
0.09 (0.01) |
0.01 (0.00) |
0.02 (0.00) |
0.03 (0.00) |
0.05 (0.00) |
|
|
Firmicutes |
0.02 (0.02) |
0.00 (0.00) |
0.00 (0.00) |
0.06 (0.03) |
0.04 (0.01) |
0.04 (0.01) |
0.02 (0.00) |
|
|
Gemmatimonadota |
0.02 (0.00) |
0.03 (0.01) |
0.03 (0.00) |
0.00 (0.00 |
0.01 (0.00) |
0.02 (0.01) |
0.02 (0.00) |
|
|
Myxococcota |
0.03 (0.00) |
0.02 (0.00) |
0.02 (0.00) |
0.00 (0.00) |
0.01 (0.00) |
0.01 (0.00) |
0.02 (0.00) |
|
|
Planctomycetota |
0.02 (0.00) |
0.02 (0.00) |
0.03 (0.00) |
0.00 (0.00) |
0.01 (0.00) |
0.01 (0.00) |
0.02 (0.00) |
|
|
Proteobacteria |
0.36 (0.03) |
0.31 (0.01) |
0.29 (0.02) |
0.72 (0.03) |
0.57 (0.04) |
0.57 (0.05) |
0.43 (0.02) |
|
|
Verrucomicrobiota |
0.06 (0.01) |
0.07 (0.01) |
0.11 (0.01) |
0.02 (0.00) |
0.03 (0.01) |
0.02 (0.00) |
0.06 (0.01) |
Community compositions were affected by tillage, crop, and the soil compartment (bulk or rhizosphere) (Table 6). Composition in the NT treatment were different than those observed in the MP treatment but composition in the CD treatment were not different than either the NT or MP treatments. When comparing composition by Crop x Soil Compartment, all groups had unique compositions (corn bulk, corn rhizosphere, soybean bulk, and soybean rhizosphere Figure 1A).
Table 6. Beta- and Alpha-diversity results from multivariate (beta-diversity) and univariate (alpha-diversity) analyses using data from both corn and soybean years to assess the impact of Crop identity, Tillage, and Type (Soil Compartment) on community diversity. Beta-diversity was assessed with PERMANOVA and alpha-diversity was assessed using linear mixed effect models. Values shown are the R2 for PERMANOVAs and F-values from linear modeling and significant values (p <0.05) are marked with an asterisk (*).
|
|
Beta-diversity |
Alpha-diversity |
||
|
Diversity metric |
Bray-Curtis ASV-level |
Shannon Diversity |
Richness |
Evenness |
|
Crop |
0.03* |
0.20 |
0.59 |
2.57 |
|
Till |
0.02* |
3.45* |
4.34* |
0.03 |
|
Type |
0.03* |
2.07 |
0.08 |
14.36* |
|
Crop*Till |
0.01 |
0.05 |
0.08 |
0.79 |
|
Crop*Type |
0.03* |
0.06 |
0.49 |
6.55* |
|
Till*Type |
0.01 |
0.44 |
0.56 |
4.73* |
|
Crop*Till*Type |
0.01 |
0.22 |
0.03 |
0.84 |
Alpha-diversity was also different across tillage, soil compartment, and the interactions between the variables (Table 6). Both Shannon diversity and richness were lower in the NT treatments compared to MP (Figure 3B-C). Evenness was lower in the bulk soils of CD and MP treatments compared to the paired rhizosphere soils (Figure 3D). Soybean rhizospheres had a higher evenness than the corn rhizospheres and the paired bulk soils from the soybean entry (Figure 3E).

Figure 3. Community diversity across Crop, Tillage, Soil Compartment and their interactions. Beta-diversity of samples grouped by Crop x Soil Compartment (A). Alpha-diversity estimates between Tillage including Shannon Diversity (B), Richness (C), Evenness across Tillage x Soil Compartment (D) and Evenness by Crop x Soil Compartment (E). Lowercase letters in panel A indicate significant differences between groups, while horizontal lines above the boxplots indicate significant differences between groups for panels B-E.
Community diversity also changed across crop growth stages. Tillage also influenced community diversity across the corn growth stages, while soil compartment (bulk or rhizosphere) had a large influence on community composition across the soybean growth stages (Table 7). Differences in community composition across the corn growth stages was most different in the early growth stage, V3/4 (Figure 4A). Pairwise differences are shown in Table 8. Alpha-diversity was also different across the growth stages and influenced by tillage treatments. Shannon diversity and Richness were lower in CD compared to MP at growth stage V3/4 but was higher in CD compared to NT at growth stage V8/9 (Figure 4B-C). Evenness was lowest in the rhizospheres in the NT treatment at stage V5/6 compared to the other two growth stages and the paired bulk soils (Figure 4D).
Table 7. Multivariate (beta-diversity) and univariate (alpha-diversity) results from PERMANOVAs and linear mixed effects models using either 2018 (corn) or 2019 (soybean) data to assess the impact of growth stage on community diversity. Values shown are the R2 for PERMANOVAs and F-values from linear modeling and significant values (p <0.05) are marked with an asterisk (*).
|
|
|
Beta-Diversity |
Alpha-Diversity |
||
|
|
Diversity metric |
Bray-Curtis ASV-level |
Shannon Diversity |
Richness |
Evenness |
|
Corn |
Stage |
0.03* |
0.59 |
0.04 |
6.54* |
|
Till |
0.04* |
2.29 |
2.89 |
0.35 |
|
|
Type |
0.02* |
1.26 |
0.69 |
1.17 |
|
|
Stage x Tillage |
0.06 |
4.56* |
3.16* |
2.92* |
|
|
Stage x Type |
0.03* |
0.79 |
1.79 |
3.74* |
|
|
Tillage x Type |
0.03 |
0.36 |
0.66 |
1.08 |
|
|
Stage x Tillage xType |
0.06* |
1.56 |
1.40 |
3.66* |
|
|
Soybean |
Stage |
0.04 |
4.05* |
2.06 |
5.61* |
|
Till |
0.04 |
2.81 |
3.53* |
0.67 |
|
|
Type |
0.12* |
2.83 |
0.14 |
24.06* |
|
|
Stage x Tillage |
0.07 |
0.83 |
1.10 |
2.37 |
|
|
Stage x Type |
0.04 |
11.92* |
8.81* |
5.07* |
|
|
Tillage x Type |
0.03 |
0.76 |
0.28 |
5.64* |
|
|
|
Stage x Tillage xType |
0.07 |
2.03 |
2.13 |
0.83 |
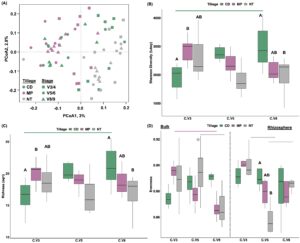
Figure 4. Community diversity of samples collected from corn entries across Growth Stage, Tillage, Soil Compartment and their interactions. Beta-diversity of samples grouped by Growth Stage x Tillage (A). Alpha-diversity estimates across the interaction between Growth Stage x Tillage for Shannon Diversity (B), Richness (C), and Growth Stage x Tillage x Soil Compartment (D). Horizontal lines indicate differences within Tillage treatments across Growth Stage and uppercase letters indicate differences within Growth Stages across Tillage practices in panels B-D.
Table 8. Results from pairwise PERMANOVAs comparing community composition across Corn Growth Stage xTillage x Soil Compartment. Values presented at the p-values and significant values are in bold (p <0.05). Asterisks(*) next to Growth Stages in the Columns indicate a difference in community structure between the paired rhizosphere and bulk soils from that growth stage. Blank spaces indicate that the two sample sets were not compared (i.e. CD V3/4 was not compared to MP V5/6).
|
|
CD 3/4* |
CD 5/6 |
CD 8/9 |
MP 3/4* |
MP 5/6 |
MP 8/9 |
NT 3/4* |
NT 5/6 |
NT 8/9 |
|
|
|
Bulk |
CD 3/4 |
- |
0.02 |
0.04 |
0.03 |
0.38 |
Rhizosphere |
||||
|
CD 5/6 |
0.04 |
- |
0.229 |
0.353 |
0.17 |
||||||
|
CD 8/9 |
0.06 |
0.62 |
- |
0.58 |
0.03 |
||||||
|
MP 3/4 |
0.03 |
- |
0.05 |
0.03 |
0.03 |
||||||
|
MP 5/6 |
0.55 |
0.03 |
- |
0.54 |
0.72 |
||||||
|
MP 8/9 |
0.24 |
0.03 |
0.69 |
- |
0.07 |
||||||
|
NT 3/4 |
0.02 |
0.03 |
- |
0.17 |
0.05 |
||||||
|
NT 5/6 |
0.102 |
0.03 |
0.03 |
- |
0.05 |
||||||
|
NT 8/9 |
0.02 |
0.21 |
0.25 |
0.19 |
- |
Community diversity was also different across the soybean growth stages but soil compartment had the largest influence in community diversity. Community compositions were different between the bulk and rhizosphere soils (Figure 5A). Soybean rhizospheres at R1 had higher Shannon diversity, richness, and evenness compared to the earlier growth stages. Alpha-diversity increased in the rhizosphere samples from V2-R1 and rhizospheres at R1 had higher alpha-diversities compared to the paired bulk soils (Figure 5B-D). Richness was highest in the MP tillage compared to NT treatment and bulk soils in CD and MP tillage treatments had lower evenness compared to the paired rhizosphere soils (Figure 5E-F).

Figure 5. Community diversity of samples collected from soybean entries across Growth Stage, Tillage, Soil Compartment and their interactions. Beta-diversity of samples colored by Soil Compartment (A). Alpha-diversity estimates across the interaction between Growth Stage x Soil Compartment for Shannon Diversity (B), Richness (C), and Evenness (D) and Richness across Tillage practices (E) and Evenness across Tillage x Soil Compartment (F). Horizontal lines above boxplots indicate significant differences between sample groups, while asterisks above boxplots indicate differences between bulk and rhizosphere soil.
Objective 4: Evaluate how the microbial communities associated with nitrate ammonification and denitrification change across tillage, crop, and soil compartment.
Results: When assessing the abundances of all five N cycling genes across the variables, crop and tillage had a significant impact (Table 9). Abundances of N marker genes in the NT treatments were different from MP treatments (p < 0.05), while MP and CD (p = 0.07) and CD and NT treatments (p = 0.36) were not different. Samples separated along the x-axis in the RDA were most correlated with nirK abundances, while those separated along the y-axis were most correlated with nosZI and nosZII abundances (Figure 6A).
Table 9. Results multivariate analyses performed with all N cycling gene percent abundances and linear mixed effect models for individual N genes. Values shown are R2 for the multivariate analysis with Adonis and F-values for the linear models and significant variables are denoted with an asterisk (*).
|
Variable(s) |
Multivariate |
nirS |
nirK |
nosZI |
nosZII |
nrfA |
Nir:NosZ |
nrfA:Nir |
|
Crop |
0.08* |
0.51 |
0.23 |
2.42 |
0.12 |
3.44 |
0.28 |
0.54 |
|
Till |
0.06* |
50.86* |
8.88* |
8.43* |
12.38* |
1.27 |
3.52* |
5.50* |
|
Type |
0.02 |
0.02 |
2.24 |
2.72 |
4.91* |
1.08 |
0.00 |
0.09 |
|
Crop*Tillage |
0.02 |
2.68 |
0.17 |
2.21 |
0.82 |
1.13 |
0.23 |
1.14 |
|
Crop*Type |
0.01 |
10.50* |
0.01 |
0.11 |
17.57* |
6.46* |
1.86 |
8.65* |
|
Tillage*Type |
0.01 |
0.53 |
1.03 |
1.43 |
0.63 |
0.24 |
0.54 |
0.35 |
|
Crop*Tillage*Type |
0.01 |
0.13 |
0.24 |
0.28 |
2.33 |
0.09 |
0.69 |
0.53 |
Relative abundances of dentrifier and nitrate ammonifier genes were affected by either Tillage and/or Crop xSample Compartment. All N cycling genes and ratios were affected by Tillage, with the exception of nrfA (Table 9). Soils sampled from the MP tillage treatment had higher abundances of nirS compared to either CD or NT, while CD also had higher nirS abundances compared to NT and MP also had higher abundances of nirK compared to CD and NT (Figure 6B-C). Similarly, MP and CD had higher nosZI abundances compared to NT and MP had higher nosZIIcompared to either CD or NT (Figure 6D-E). Ratios of Nir:NosZ were higher in MP compared to NT but ratios of nrfA:Nir were higher in NT compared to MP (Figure 6F-G).
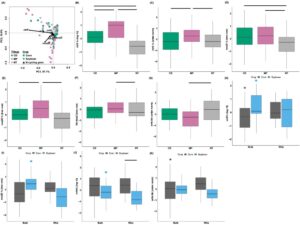
Figure 6. Denitrifier and nitrate ammonifier gene cycling profiles and individual N cycling gene abundances from corn and soybean entries. Multivariate analysis of N cycling genes from the two crop entries using an RDA (A). Individual N cycling gene quantities across Tillage including nirS (B), nirK (C), nosZI (D), nosZII (E), Nir:NosZ (F), and nrfA:Nir (G) and across Crop x Soil Compartment to include nirS (H), nosZI (I), nrfA (J), and nrfA:Nir (K). Horizontal lines above boxplots indicate significant differences between sample groups, while asterisks above boxplots indicate differences between bulk and rhizosphere soil.
Nitrogen cycling gene abundances that were different between the interaction of Crop x Soil compartment were nirS, nosZII, nrfA, and nrfA:Nir. Soybean bulk soils had higher nirS abundances compared to Soybean rhizosphere soils but Corn rhizosphere soils had higher nirS than Corn bulk soils (Figure 6H). Soybean bulk soils also had higher nosZIIand nrfA compared to Soybean rhizosphere soils (Figure 6I-J). Corn rhizospheres had higher percentage of nrfAcompared to Soybean rhizospheres (Figure 6J). Ratios of nrfA:Nir were higher in the Corn rhizospheres compared to the paired bulk soils (Figure 6K).
Objective 5: Evaluate how the microbial communities associated with nitrate ammonification and denitrification change across corn or soybean growth stages, tillage, and soil compartment.
Results: Genes associated with denitrification and nitrate ammonification were different across growth stage, tillage, and soil compartment (Table 10). Growth Stage alone accounted for nearly 50% of the variation in the N cycling profiles. Samples separated along the x-axis of the RDA were most correlated with nirK abundances, while samples along the y-axis were most correlated with nosZII abundances (Figure 7A). Bulk soils sampled from the Corn entry at growth stage V3/4 had different N cycling gene profiles than the rhizospheres sampled at this stage, and the bulk soils sampled at the other two growth stages. Corn rhizospheres sampled at V3/4 were different than rhizospheres sampled at V5/6 and V5/6 had different profiles compared to V8/9. Samples collected at the V3/4 growth stage from CD treatments had a different N cycling profile than CD sampled at V5/6 and V8/9 and V5/6 was also different than V8/9. This pattern was observed for MP and NT, as well. At growth stage V3/4 MP had a different N cycling profile compared to NT and MP had a different N cycling profile compared to both CD and NT at growth stage V5/6 (see Figure 8 to see which pairs of samples had different N cycling profiles in the Corn entries).
Table 10. Results from multivariate analyses performed with all N cycling gene percent abundances and univariate analyses performed with linear mixed effect models for individual N genes. Values shown are R2 for the multivariate analysis with Adonis and F-values for the linear models and significant variables are denoted with an asterisk (*).
|
Crop |
Variable |
Multivariate |
nirS |
nirK |
nosZI |
nosZII |
nrfA |
Nir:NosZ |
nrfA:Nir |
|
Corn |
Stage |
0.48* |
34.66* |
90.62* |
27.31* |
36.08* |
17.00* |
89.78* |
10.73* |
|
Till |
0.07* |
32.26* |
6.33* |
6.99* |
8.33* |
0.06 |
3.84* |
5.64* |
|
|
Type |
0.02 |
11.80* |
1.32 |
2.56 |
4.52* |
1.56 |
4.42* |
5.50* |
|
|
Stage x Tillage |
0.10* |
0.54 |
1.20 |
1.40 |
1.51 |
0.24 |
2.82* |
0.39 |
|
|
Stage x Type |
0.07* |
3.95* |
17.44* |
3.53* |
10.25* |
7.35* |
8.14* |
1.91 |
|
|
Tillage x Type |
0.02 |
1.08 |
0.19 |
0.89 |
3.39* |
0.19 |
0.43 |
0.05 |
|
|
|
Stage x Tillage x Type |
0.03 |
1.02 |
1.07 |
3.13* |
4.32* |
1.00 |
0.92 |
0.72 |
|
Soybean |
Stage |
0.09* |
2.24 |
0.40 |
2.11 |
6.42* |
2.07 |
0.74 |
5.54* |
|
Till |
0.12* |
33.49* |
12.39* |
6.31* |
8.37* |
2.69 |
1.29 |
1.66 |
|
|
Type |
0.07* |
4.24* |
3.63* |
1.04 |
17.89* |
7.30* |
1.08 |
4.58* |
|
|
Stage x Tillage |
0.03 |
3.45* |
7.94* |
1.06 |
1.73 |
1.71 |
1.13 |
0.79 |
|
|
Stage x Type |
0.07 |
8.42* |
2.48 |
0.60 |
7.77* |
7.01* |
1.05 |
5.06* |
|
|
Tillage x Type |
0.03 |
0.12 |
3.23 |
1.23 |
1.30 |
0.22 |
0.02 |
0.76 |
|
|
Stage x Tillage x Type |
0.05 |
0.70 |
0.29 |
2.05 |
0.24 |
0.84 |
1.17 |
1.04 |
Individual N cycling genes from the Corn entry were different across Growth Stage (nrfA:Nir) Tillage (nirS and nirK, nrfA:Nir), Soil Compartment (nrfA:Nir), and the interactions between Stage x Tillage (Nir:NosZ), Stage x Soil Compartment (nirS, nirK, nrfA, Niir:NosZ), and the three-way interaction between Stage x Tillage x Soil Compartment (nosZI and nosZII; Table 10). Samples taken from the MP treatment had higher abundances of both nirS and nirK and CD had higher abundances of nirS compared to NT (Figure 7B-C). In contrast, the NT treatment had higher ratios of nrfA:Nir compared to samples from the MP treatment (Figure 7D). Ratios of nrfA:Nir were highest at the last growth stage, V8/9 and was elevated in the rhizosphere compared to bulk soils (Figure 7E-F).
Corn sampled at V3/4 had higher abundances of nirS in the rhizosphere compared to bulk soils and the rhizospheres sampled at V5/6 had higher nirS compared to those sampled at V8/9 (Figure 7G). Bulk soils collected at V3/4 had lower abundances of nirS compared to bulk soils collected at the other two stages (Figure 7G). Samples collected earlier in the season all had elevated levels of nirK, nrfA, and Nir:NosZ ratios, as abundances dropped throughout the growing season (Figure 7H-J).
Abundances of both genes associated with N2O reduction were different between Corn growth Stage x Tillage x Soil Compartment (Table 10). Bulk soils from CD and NT tillage treatments at growth stage V3/4 had higher abundances of nosZI compared to bulk soils from the other growth stages (Figure 7K). Rhizospheres sampled at Corn V3/4 from CD had higher abundances of nosZI compared to CD from stage V8/9. Bulk soils from NT had higher abundances of nosZI compared to rhizosphere soils at V3/4 growth stage but bulk soils from CD at V5/6 had lower nosZI compared to the paired rhizospheres. Bulk soils from NT treatments at V5/6 had lower nosZI compared to MP bulk soils. Rhizospheres sampled from NT had lower nosZI abundances compared to CD during Corn 3/4 and 5/6 (Figure 7K).
Bulk soils collected from Corn V5/6 from the MP treatment had higher nosZII abundances compared to those from Corn V3/4 and V8/9, and V8/9 had higher nosZII abundances compared to V3/4 (Figure 7L). Similarly, bulk soils from V5/6 from the NT treatment had higher nosZII abundances compared to both othe growth stages. Bulk soils sampled from the MP treatment at V5/6 and V8/9 had higher abundances of nosZII compared to CD and NT treatments. Rhizosphere soils collected from the V5/6 growth stage had higher nosZII abundances in the MP treatment compared to those from other growth stages and CD from V5/6 also had higher abundances of nosZII compared to CD form V8/9 (Figure 7L).
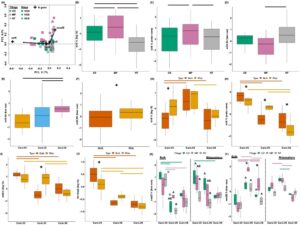
Figure 7. Denitrifier and nitrate ammonifier gene cycling profiles and individual N cycling gene abundances from the corn entry (2018). Multivariate analysis of N cycling genes from the corn entry using an RDA (A). Individual N cycling gene quantities across Tillage to include nirS (B), nirK (C), nrfA:Nir (D), across Growth Stages to include nrfA:Nir (E), across Soil Compartment to include nrfA:Nir (F), across Crop x Soil Compartment to include nirS (G), nirK (H), nrfA(I), and Nir:NosZ (K), and across Growth Stage x Tillage x Soil Compartment to include nosZI (K) and nosZII (L). Horizontal lines above boxplots indicate significant differences between sample groups, while asterisks above boxplots indicate differences between bulk and rhizosphere soil. Uppercase letters indicate differences between Tillage treatments within a Growth Stage.
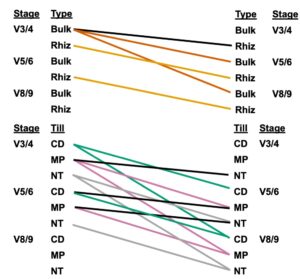
Figure 8. Pairwise comparisons of the N cycling profiles in the corn entry across Growth Stage x Soil Compartment and Growth Stage x Tillage. Lines connecting groups of samples indicate that the N cycling profiles differed between those groups (Pairwise PERMANOVAs, p <0.05).
Abundances of N cycling genes in the soybean entry were affected by Stage, Tillage, and Soil Compartment but no there were no interaction effects (Table 10). Of these, Tillage had the highest R2 (12), followed by Stage (R2= 9) and Type (R2 = 7). Samples taken from the MP tillage treatment had different N cycling profiles compared to both the CD and NT treatments (pairwise PERMANOVA, p <0.05). Pairwise tests did not show a significant difference between Stage after adjusted p-values. Samples separated along the x-axis in the RDA were driven by nosZII, while the samples separated along the y-axis were driven by nosZI (Figure 9A).
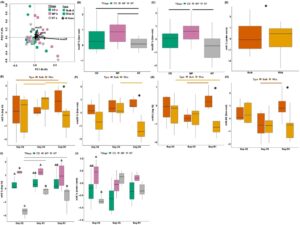
Figure 9. Denitrifier and nitrate ammonifier gene cycling profiles and individual N cycling gene abundances from soybean entries (2019). Multivariate analysis of N cycling genes from the soybean entry using an RDA (A). Individual N cycling gene quantities across Tillage including nosZI (B) and nosZII (C), across Soil Compartment to include nirK(D), across Growth Stage x Soil Compartment to include nirS (E), nosZII (F), nrfA (G), and nrfA:Nir (H), and across Growth Stage x Tillage to include nirS (I) and nirK (J). Horizontal lines above boxplots indicate significant differences between sample groups, while asterisks above boxplots indicate differences between bulk and rhizosphere soils.
Individual N cycling genes from the Soybean entry were different between Tillage (nosZI and nosZII), Soil Compartment (nirK), and the interactions between Stage x Tillage (nirS and nirK), and Stage x Soil Compartment (nirS, nosZII, nrfA, nrfA:Nir; Table 10). Abundances of nosZI were lower in the NT treatment compared to either CD or MP treatments and nosZII was highest in the MP treatments compared to either CD or NT treatments (Figure 9B-C). Bulk soils from the Soybean entry had higher abundances of nirK compared to rhizosphere soils (Figure 9D).
Rhizospheres of Soybean at growth stage R1 had lower nirS, nosZII, nrfA, and nrfA:Nir ratios compared to the paired bulk soil samples (Figure 9E-H). Abundance of nirS peaked in the rhizospheres at stage V3 and in the bulk soils at stage R1 (Figure 9E). Rhizospheres at V3 also had higher nosZII compared to stage R1 (Figure 9F). Rhizospheres at V2 had the highest relative abundances of nrfA genes, while bulk soils from R1 had the highest nrfA abundances (Figure 9G). Bulk soils from R1 also had the highest ratio of nrfA:Nir (Figure 9H).
Samples collected from the NT treatment had lower abundances of nirS compared to MP and/or CD treatments at all growth stages sampled (Figure 9I). Chisel-disk also had lower nirS compared to MP treatments (Figure 9I). No-till treatments at V2 had the lowest nirS abundances compared to the other no-till treatments sampled at V3 and R1 (Figure 9I). No-till treatments at V2 also had lower nirK abundances compared to MP (Figure 9J).
Discussion
The overarching goal of this research project was to determine how long-term tillage practices impact microbial nitrogen cycling dynamics to include denitrification and nitrate ammonification and N2O emissions in a corn-soybean-small grain rotation. Tillage treatments varied in the amount of physical disturbance to the soil profile and included moldboard plow (MP), which was the most physically disruptive tillage, chisel-disk (CD), which was moderately disruptive, and no-till (NT), which was minimally disruptive. These tillage treatments have been in place since 1978, approximately 40 years since the first year of samples taken for this study. We sampled two crop entries, corn and soybean, in a three-year crop of corn-soybean-small gram + winter cover crop. Measurements of N2O emission was assessed from May-September in 2018 during the corn year and 2019 in the soybean year. Denitrifier and nitrate ammonifier marker genes were assessed from rhizosphere and bulk soils collected at three different growth stages for corn and soybean entries.
Total N2O emissions captured over the 28 days of sampling in 2018 and 2019 indicated higher N2O emissions from the CD treatment, followed by the NT treatment, and the lowest N2O from the MP treatment. This pattern was mostly driven by N2O emissions in the corn entry, as more than 95% of the total N2O emissions captured across the 28 sampling dates were from the corn year, despite having more sampling dates in the soybean year. Average daily emissions were ~ one order of magnitude higher in the corn entry compared to the soybean entry.
We found that 16S rRNA communities and N cycling genes were different across tillage treatments, particularly between the MP and NT treatments. Corn and soybean had different community compositions and N cycling profiles, while abundances of individual N genes were different between the crops and soil compartment (bulk versus rhizosphere). Community composition and N cycling gene profiles also changed across crop growth stages, but was dependent on tillage practices and/or soil compartments.
Tillage and crop management influence on N2O emissions
Tillage had a significant impact on N2O emissions in the soybean entry but was dependent on the date of sampling. Across all 17 sampling dates in the soybean entry, NT had the highest total N2O emissions, followed by CD and then MP had the lowest total loss. Long-term NT also had higher N2O emissions compared to conventionally tilled plots in a faba bean entry (Badagliacca et al., 2018). In a continuous corn cropping system and corn-soybean rotation, N2O emissions were higher in the long-term MP and CD treatments compared to NT (Ussiri et al., 2009; Omonode et al., 2011). While no differences in NT and MP have been observed in other long-term tillage studies (Plaza-Bonilla et al., 2014; Grandy et al., 2006).
While no differences were observed in the daily emissions measured, total N2O emissions across the 11 sampling dates were twice as high in the CD compared to NT treatment and MP had lower emissions than either CD or NT. In contrast to our findings, MP was shown to have the highest N2O emissions compared to CD and NT but this study included the use of a nitrification inhibitor, which would greatly influence microbial N cycling dynamics in soil (Omonode and Vyn, 2019). Considering the conflicting results of long-term tillage practices on N2O emissions, it would seem that other factors may have a greater impact on N2O emissions in these systems.
Crop rotations have been shown to have a greater impact on N2O emissions than tillage treatments when comparing CD and NT in long-term field trials in Illinois, US (Behnke et al., 2018) and Brazil (Bayer et al., 2015). While we did not observe a difference between tillage treatments when assessing both corn and soybean years together, we did find an impact of tillage in the soybean year. Total losses and daily averages of N2O emissions in the corn year were much greater than those from the soybean year. Other studies have found that N fertilization has a greater impact on N2O emissions than tillage treatment, which would agree with our findings (Pelster et al., 2011). Corn entries were fertilized with N and no differences in tillage was observed, while additional N was not added to the soybean entries and differences in tillage were observed.
Long-term tillage impacts on diversity and denitrifiers and nitrate ammonifiers abundances
Our next objective was to determine if long-term tillage treatments influenced the 16S rRNA community diversity and N cycling genes associated with denitrification and nitrate ammonification. Moldboard ploughing turns the top 20-30 cm of soil over and increases soil heterogeneity, CD mixes the soil and residues, and residues sit on the top of soils under NT. Chisel-disking was sampled as an ‘intermediate’ between MP and NT treatments. When assessing both crop entries together, Shannon Diversity, Richness, and beta-diversity were different between MP and NT but CD is not different than either MP or NT. A recent study also assessed community dynamics of bulk soils in a long-term tillage and fertilization study that included moldboard ploughing (MP) and no-till (NT) and samples were collected approximately 45 years after treatment establishment (Srour et al., 2020). Similar to our study, bacterial alpha-diversity was found to be higher in the MP treatments and community composition was different between the two tillage practices (Srour et al., 2020).
Denitrifier and nitrate ammonifier gene abundances were different across tillage practices with NT having lower relative abundances of nirS, nirK, nosZI, nosZII, and Nir:NosZ compared to MP and/or CD. These results were not in agreement with previous results from another long-term tillage treatment that found higher nirS and nosZI genes in NT compared to MP treatments (Melero et al., 2011). In another long-term tillage treatment, no differences in nirKabundances were observed between CD, NT, and MP tillage treatments, despite measuring higher N2O emissions from the NT treatment (Tellez-Rio et al., 2015a). In the same cropping system but different crop entry (vetch) N2O emissions and nirK was highest in the CD treatment, while NT and MP had similar annual total N2O losses and nirK abundances (Tellez-Rio et al. 2015b). Abundances of nirK were also found to be higher under CD compared to MP in another long-term tillage study (Krauss et al., 2017). Disagreements in results between our study ant the studies mentioned are possibly due to how genes were analyzed, relative abundances based no 16S rRNA gene copies compared to N gene copies g-1 dry weight soil, and the fact that only bulk soils were analyzed in the other studies.
Crop effects on community diversity and denitrifier and nitrate ammonifiers
Another objective of this study was to determine if crop entry, within a long-term tillage experiment, had an effect on 16S rRNA community diversity and N cycling genes associated with denitrification and nitrate ammonification. Several studies have suggested that long-term management practices may have a larger impact and even eclipse the influence of crop species on soil microbiomes (Buckley and Schmidt, 2001, 2003; Jangid et al., 2011). Both alpha-diversity and community composition were affected by tillage, but crop and the interaction between crop x soil compartment were also important factors shaping the soil microbiome in this study. Other studies have not found differences in alpha-diversity or community composition between corn and soybean but these only included bulk soil samples (Chamberlain et al., 2020; Smith et al., 2016). Rhizosphere samples from Alfalfa and Soya bean grown in a glasshouse showed differences in alpha-diversity and community composition, while no differences in management practices were included in the study (Xiao et al., 2017). Our results indicate that crop species can influence 16S rRNA communities, but soil compartment must be taken into consideration, as the differences in communities are most discernible in the rhizosphere.
Rhizosphere dynamics also influenced denitrifier and nitrate ammonifier gene abundances, as genes were not different across crop but were different when soil compartment was also taken into consideration. Rhizospheres of barley and sunflower did not have different abundances of denitrifier genes when compared to eachother but did have different gene abundances compared to bulk soils in a growth chamber experiment (Graf et al., 2016). Abundances of nosZI were higher in the rhizospheres, while nosZII and nirK were higher in bulk soils, and nirS was higher in one of the two bulk soils sampled (Graf et al., 2016). Soybean rhizospheres sampled in this study had lower abundances of nirS, nosZII, and nrfA compared to the paired bulk soils and/or Corn rhizospheres. These differences in gene abundances are likely driven by differences in exudation patterns expected for different plant species (Berg et al., 2009).
Community diversity and denitrifier and nitrate ammonifier abundances across growth stages
Our final objective of this study was to better understand how 16S rRNA communities and denitrifier and nitrate ammonifier gene abundances change during the growth of corn and soybean. Changes to community composition and alpha-diversity of corn and soybean have been assessed previously (Sugyiyama et al., 2014; Cavaglieri et al., 2009; Xu et al., 2009; Hsiao et al., 2019; Zhang et al., 2012) but not in the context of long-term management practices like tillage. In one other long-term tillage experiment, NT treatment appeared to result in a more stable community composition over sampled growth stages of wheat compared to MP (Wang et al., 2020). This was in contrast to what we observed in the samples taken from both corn and soybean, where corn samples followed similar patterns in composition between the tillage treatments and soybean samples were less effected by tillage. Selection strength of rhizosphere microbial communities has been demonstrated to differ between crop species (Tkacz et al., 2015; Berendsen et al., 2012) and plant selection and management have been shown to synergistically shape rhizosphere communities (Schmidt et al., 2019). Samples from the corn entry showed a consistent effect of growth stages x management, while soybean samples were more effected by growth stages x soil compartment, suggesting a stronger effect on plant selection in the soybean compared to corn 16S rRNA communities.
Plant selection has also been shown to influence denitrification gene abundances, as differences in gene abundances have been observed between rhizosphere and bulk soils (Ai et al., 2017; Hou et. Al., 2018). By sampling at different growth stages of two crops, we were able to further identify potential ‘hot moments of denitrification. During corn growth, the highest ratios of Nir:NosZ were found in the growth stage V3/4, which was also higher in the bulk soil compared to rhizosphere soil. Tillage treatments influenced the relative abundances of NosZ genes across corn growth stages and Nir genes were impacted by tillage and growth stages in the soybean entry. Soybean rhizospheres at the last growth stage (R1) had lower quantifies of nirS, nosZII, and nrfA compared to the paired bulk soils and at least one of the two previous growth stages. Overall soybean rhizospheres had higher abundances of nirK compared to bulk soils. Our results reinforce a management x plant selection interaction effect on N cycling gene abundances proposed by Schmidt et al. (2019). It should be noted that this study and the study by Schmidt et al. (2019) were both comparing management strategies that have been in place for over 20 years.
Bibliography
Ai, C., Liang, G., Sun, J., Wang, X., Zhou, W. 2012. Responses of extracellular enzyme activities and microbial community in both the rhizosphere and bulk soil to long-term fertilization practices in a fluvo-aquic soil. Geoderma, 173, pp.330-338.
Badagliacca, G., Benítez, E., Amato, G., Badalucco, L., Giambalvo, D., Laudicina, V.A. and Ruisi, P., 2018. Long-term no-tillage application increases soil organic carbon, nitrous oxide emissions and faba bean (Vicia faba L.) yields under rain-fed Mediterranean conditions. Science of the Total Environment, 639, pp.350-359.
Bayer, C., Gomes, J., Zanatta, J.A., Vieira, F.C.B., de Cássia Piccolo, M., Dieckow, J. and Six, J., 2015. Soil nitrous oxide emissions as affected by long-term tillage, cropping systems and nitrogen fertilization in Southern Brazil. Soil and Tillage research, 146, pp.213-222.
Behnke, G.D., Zuber, S.M., Pittelkow, C.M., Nafziger, E.D. and Villamil, M.B., 2018. Long-term crop rotation and tillage effects on soil greenhouse gas emissions and crop production in Illinois, USA. Agriculture, Ecosystems & Environment, 261, pp.62-70.
Berg, G., Smalla, K. 2009. Plant species and soil type cooperatively shape the structure and function of microbial communities in the rhizosphere. FEMS microbiology ecology, 68(1), pp.1-13.
Buckley, D. H., Schmidt, T. M. 2001. The structure of microbial communities in soil and the lasting impact of cultivation. Microbial Ecology, 42, pp.11– 21.
Cavaglieri, L., Orlando, J., Etcheverry, M. 2009. Rhizosphere microbial community structure at different maize plant growth stages and root locations. Microbiological Research, 164(4), pp.391-399.
Chamberlain, L.A., Bolton, M.L, Cox, M.S., Suen, G., Conley, S.P., Ané, J.M. 2020. Crop rotation, but not cover crops, influenced soil bacterial community composition in a corn-soybean system in southern Wisconsin. Applied Soil Ecology, 154, p.103603
Graf, D.R., Zhao, M., Jones, C.M., Hallin, S. 2016. Soil type overrides plant effect on genetic and enzymatic N2O production potential in arable soils. Soil Biology and Biochemistry, 100, pp.125-128.
Grandy, A.S., Loecke, T.D., Parr, S. and Robertson, G.P., 2006. Long‐term trends in nitrous oxide emissions, soil nitrogen, and crop yields of till and no‐till cropping systems. Journal of environmental quality, 35(4), pp.1487-1495.
Hou, S., Ai, C., Zhou, W., Liang, G., He, P. 2018. Structure and assembly cues for rhizospheric nirK-and nirS-type denitrifier communities in long-term fertilized soils. Soil Biology and Biochemistry, 119, pp.32-40.
Hsiao, C.J., Sassenrath, G.F., Zeglin, L.H., Hettiarachchi, G.M. and Rice, C.W., 2019. Temporal variation of soil microbial properties in a corn–wheat–soybean system. Soil Science Society of America Journal, 83(6), pp.1696-1711.
Jangid, K., Williams, M. A., Franzluebbers, A. J., Schmidt, T. M., Coleman, D. C., Whitman, W. B. 2011. Land‐use history has a stronger impact on soil microbial community composition than aboveground vegetation and soil properties. Soil Biology and Biochemistry, 43, pp. 2184– 2193.
Krauss, M., Krause, H.M., Spangler, S., Kandeler, E., Behrens, S., Kappler, A., Mäder, P., Gattinger, A. 2017. Tillage system affects fertilizer-induced nitrous oxide emissions. Biology and Fertility of Soils, 53(1), pp. 49-59.
Melero, S., Pérez-de-Mora, A., Murillo, J.M., Buegger, F., Kleinedam, K., Kublik, S., Vanderlinden, K., Moreno, F., Schloter, M. 2011. Denitrification in a vertisol under long-term tillage and no-tillage management in dryland agricultural systems: key genes and potential rates. Applied Soil Ecology, 47(3), pp. 221-225.
Omonode, R.A., Smith, D.R., Gál, A. and Vyn, T.J., 2011. Soil nitrous oxide emissions in corn following three decades of tillage and rotation treatments. Soil Science Society of America Journal, 75(1), pp.152-163.
Omonode, R.A. and Vyn, T.J., 2019. Tillage and Nitrogen Source Impacts on Relationships between Nitrous Oxide Emission and Nitrogen Recovery Efficiency in Corn. Journal of environmental quality, 48(2), pp.421-429.
Pelster, D.E., Larouche, F., Rochette, P., Chantigny, M.H., Allaire, S. and Angers, D.A., 2011. Nitrogen fertilization but not soil tillage affects nitrous oxide emissions from a clay loam soil under a maize–soybean rotation. Soil and Tillage Research, 115, pp.16-26.
Plaza-Bonilla, D., Álvaro-Fuentes, J., Arrúe, J.L. and Cantero-Martínez, C., 2014. Tillage and nitrogen fertilization effects on nitrous oxide yield-scaled emissions in a rainfed Mediterranean area. Agriculture, ecosystems & environment, 189, pp.43-52.
Schmidt, J.E., Kent, A.D., Brisson, V.L. and Gaudin, A.C., 2019. Agricultural management and plant selection interactively affect rhizosphere microbial community structure and nitrogen cycling. Microbiome, 7(1), pp.1-18.
Smith, C.R., Blair, P.L., Boyd, C., Cody, B., Hazel, A., Hedrick, A., Kathuria, H., Khurana, P., Kramer, B., Muterspaw, K. and Peck, C., 2016. Microbial community responses to soil tillage and crop rotation in a corn/soybean agroecosystem. Ecology and Evolution, 6(22), pp.8075-8084.
Sugiyama, A., Ueda, Y., Zushi, T., Takase, H., Yazaki, K. 2014. Changes in the bacterial community of soybean rhizospheres during growth in the field. PLoS one, (9)6, p.e100709
Srour, A.Y., Ammar, H.A., Subedi, A., Pimentel, M., Cook, R.L., Bond, J., Fakhoury, A.M. 2020. Microbial communities associated with long-term tillage and fertility treatments in a corn-soybean cropping system. Frontiers in Microbiology, 11, p.1363.
Tellez-Rio, A., García-Marco, S., Navas, M., López-Solanilla, E., Tenorio, J.L., Vallejo, A. 2015a. N2O and CH4emissions from a fallow–wheat rotation with low N input in conservation and conventional tillage under a Mediterranean agroecosystem. Science of the Total Environment, 508, pp.85-94.
Tellez-Rio, A., García-Marco, S., Navas, M., López-Solanilla, E., Rees, R.M., Tenorio, J.L., Vallejo, A. 2015b. Nitrous oxide and methane emissions from a vetch cropping season are changed by long-term tillage practices in a Mediterranean agroecosystem. Biology and Fertility of Soils, 51(1), pp.77-88.
Tkacz, A., Cheema, J., Chandra, G., Grant, A., Poole, P.S. 2015. Stability and succession of the rhizosphere microbiota depends upon plant type and soil composition. The ISME Journal, 9(11), pp.2349-2359.
Ussiri, D.A., Lal, R. and Jarecki, M.K., 2009. Nitrous oxide and methane emissions from long-term tillage under a continuous corn cropping system in Ohio. Soil and Tillage Research, 104(2), pp.247-255.
Wang, Z., Li, Y., Li, T., Zhao, D. and Liao, Y., 2020. Tillage practices with different soil disturbance shape the rhizosphere bacterial community throughout crop growth. Soil and Tillage Research, 197, p.104501.
Xiao, X., Chen, W., Zong, L., Yang, J., Jiao, S., Lin, Y., Wang, E., Wei, G. 2017. Two cultivated legume plants reveal the enrichment process of the microbiome in the rhizocompartments. Molecular Ecology, 26(6), pp. 1641-1651
Xu, Y., Wang, G., Jin, J., Liu, J., Zhang, Q., Liu, X. 2009. Bacterial communities in soybean rhizosphere in response to soil type, soybean genotype, and their growth stage. Soil Biology and Biochemistry, 41(5), pp.919-925.
Zhang, B., He, H., Ding, X., Zhang, X., Zhang, X., Yang, X., Filley, T.R. 2012. Soil microbial community dynamics over a maize (Zea mays L.) growing season under conventional-and no-tillage practices in a rainfed agroecosystem. Soil and Tillage Research, 124, pp.153-160.
The main findings of this research project were as follows:
- Chisel-disking resulted in the highest cumulative N2O emissions from two years of data collection that included a corn and soybean entry in a three-year corn-soybean-small grain rotation
- Emissions of N2O were 10 fold higher in the corn entry compared to the soybean entry
- Community diversity of rhizosphere and bulk soils was most dissimilar between the MP and NT treatments, with fewer differences observed between MP and CD or NT and CD
- Nitrogen cycling gene abundances were lowest the NT treatment
- Tillage had a stronger effect on N cycling genes in the corn entry, while soil compartment (bulk or rhizosphere) had a stronger effect in the soybean entry
- Dentirifier and nitrate ammonifier genes decreased in abundance during corn and soybean growth
Based on the results from this study, long-term no-till does result in lower total N2O emissions compared to chisel-disk but higher emissions than moldboard plow. This could be explained by increased nosZ genes in the MP treatment compared to NT, which would indicate a greater potential for N2O reduction in the MP treatments. Considering the inconsistency in results from long-term tillage practices on N2O emissions, future research should include ancillary analyses of other potential contributing factors. Crop rotations, N fertilization, climatic conditions, soil physicochemical properties should be incorporated.
Furthermore, the increased production of N2O in the corn year compared to soybean year is likely due to the addition of N fertilizer to the corn. In this field study, N was added at planting and then again as a side-dress. Ultimately, timing N fertilizer applications with plant N uptake has been and continues to be studied, as over applying N or adding N when plant uptake would be low will result in more N loss.
Education & outreach activities and participation summary
Participation summary:
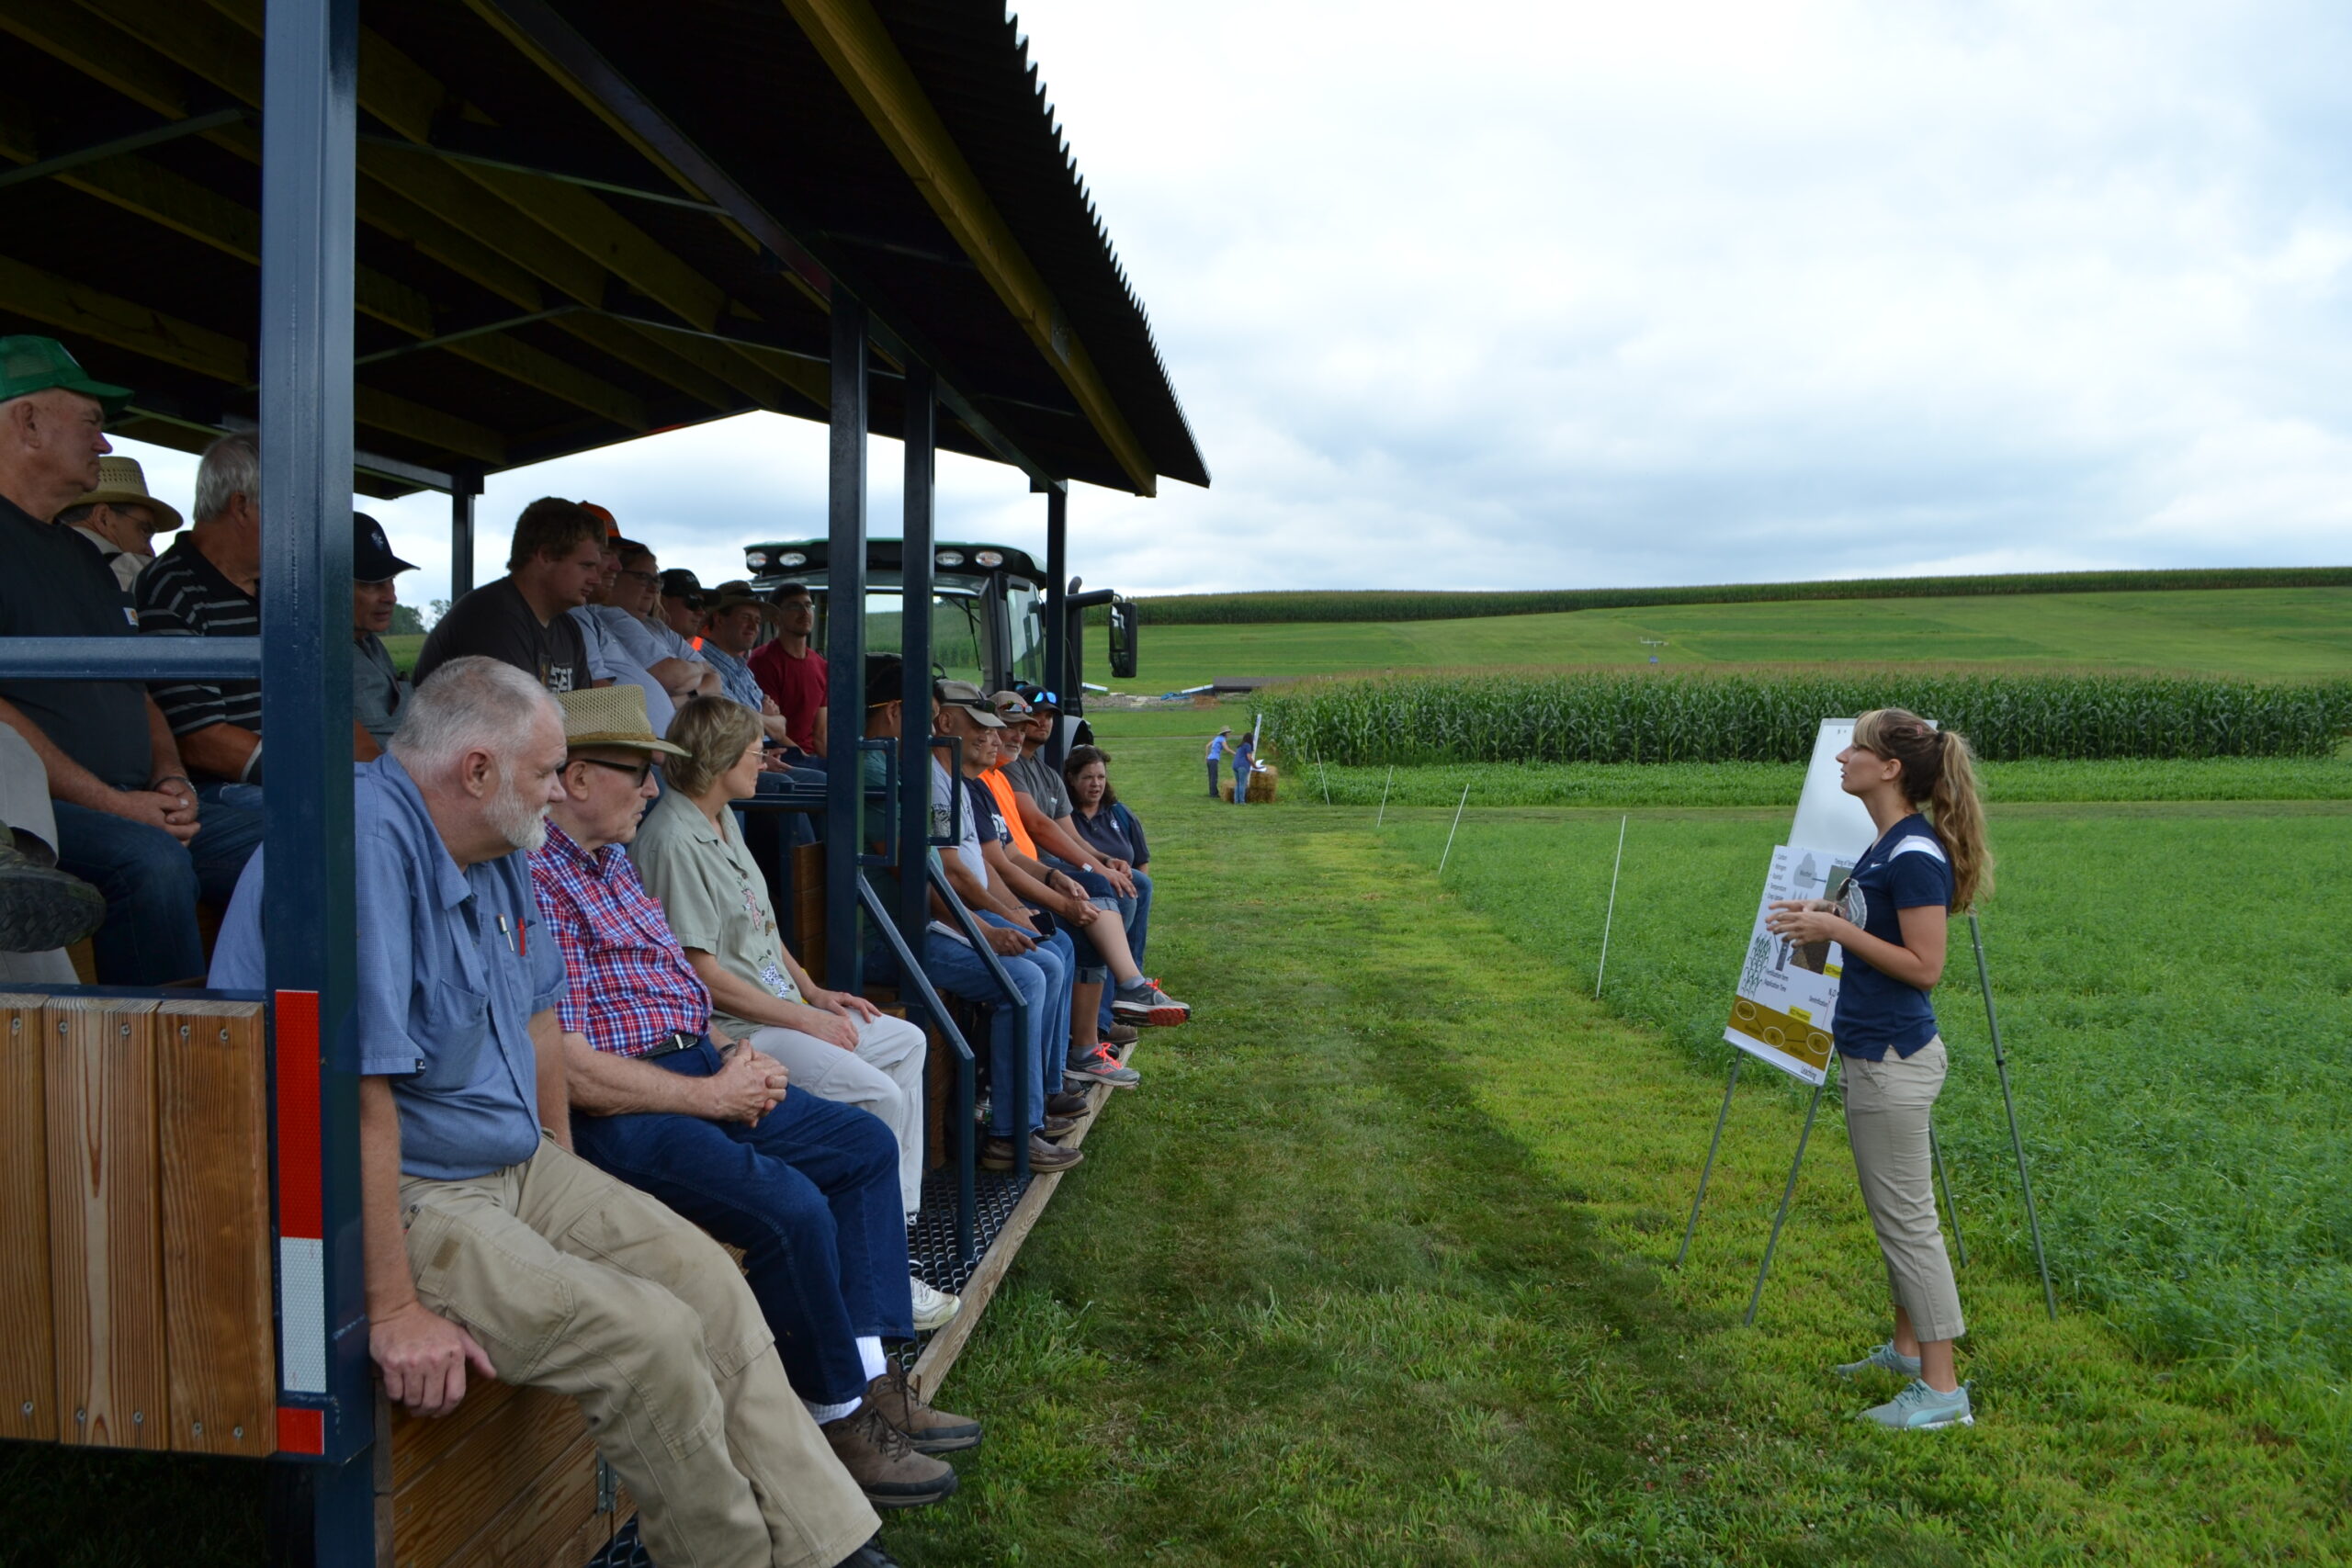
In August, 2018, our Sustainable Dairy Cropping Systems team held a 2-day field tour.
Day 1 included nutrient management plan writers, as well as commercial manure haulers and brokers.
Day 2 included Dairy and Grain farmers, as well as agricultural service providers and educators interested in soil conservation.
I presented my research on N2O emissions from soils with different tillage histories on both days.
Scientific Presentations of Tillage Results:
Mara Cloutier*, Sjoerd Duiker, Mary Ann Bruns, 2019, Microbial N dynamics affected by tillage and root exudation, Gamma Sigma Delta Symposium, Penn State
Mara Cloutier*, Sjoerd Duiker, Mary Ann Bruns, 2019, Microbial N dynamics affected by tillage and root exudation, Environmental Chemistry and Microbiology Student Symposium, Penn State
Mara Cloutier*, Sjoerd Duiker, Mary Ann Bruns, 2019, Microbial N dynamics affected by tillage and root exudation, Soil Science Society of America International Soils Meeting
Mara Cloutier*, Sjoerd Duiker, Mary Ann Bruns 2018, Assessing effects of tillage on soil microbial N dynamics and crop N uptake in a 40-year experiment, 21st Penn State Plant Biology Symposium: Wild and Tamed Phytobiomes
Publications in Preparation:
Emission of N2O in a 40-year tillage experiment is dependent on tillage treatment and crop entry, Mara Cloutier, Sjoerd Duiker, Mary Ann Bruns
Tillage management and plant selection affect rhizosphere microbial community diversity and nitrogen cycling genes, Mara Cloutier, Tiffanie Alcaide, Sjoerd Duiker, Mary Ann Bruns
Project Outcomes
This project provides both a fundamental and applied aspect to how long-term tillage practices can impact nitrogen cycling dynamics and potential loss of N2O. Tillage, in combination with other management practices associated with different crop entries, appears to impact N2O emissions and denitrification. The results from this project provide much needed information about how denitrification and N2O emissions change over 40 + years of no-till, reduced till, and conventional till.
My knowledge of sustainable agriculture has increased since beginning this project. I've learned a lot about tillage practices and how there are positives and negatives for using no-till or reduced till compared to conventional tillage. Furthermore, I have been collaborating with other academics who are more educated on sustainable agriculture and different strategies that farmers are using in the northeast to achieve sustainability. Through this project, I was able to build communication skills and communicate my research findings to non-academics and extension specialists. I also learned some new analytical techniques, including quantitative PCR, which I used to quantify the copy numbers of genes involved in denitrification and nitrate ammonification. I plan to take a post-doctoral position at a USDA-ARS in Oregon working on sustainable agriculture and climate change. This NESARE project has helped me to develop the necessary soft and analytical skills that will make me a successful researcher in my future position.
Having clear communication between myself, the project PI, and the farm workers was essential and difficult to maintain at some points. Access to appropriate instruments and tools was also key for the success of this project. We had hoped to include sampling of cover crops but we were not able to harvest corn early enough to plant a cover crop. This was due to the incredibly wet late summer and fall that we experienced in 2018. Furthermore, additional sampling to assess how denitrification and nitrate ammonification genes change after the vegetative growth stages and after harvesting would be essential to understand how nitrogen cycling changes over the entire growing season.