Final report for GNE18-180
Project Information
Pennsylvania anchors the Mid-Atlantic and Northeast fruit industry, growing 23% of the region’s 2 billion pound (~$500 million) annual apple production (USDA-NASS 2018). Pennsylvania apple growers have been reporting increased losses from the summer fungal disease called bitter rot, a problem also plaguing growers in the surrounding states of the Mid-Atlantic and Northeast. Since bitter rot was historically a disease found mostly south of the Maryland-Ohio-river-valley-line (Roberts, Farmers Bulletin 938, USDA 1935), most management recommendations are based on southern research, much of which has not been experimentally tested in the Mid-Atlantic and Northeast. Recognizing the need for applied research on bitter rot, the State Horticultural Society of Pennsylvania funded a state-wide survey to identify the Colletotrichum spp. causing bitter rot and to test them for fungicide resistance. What was still needed, and what was funded by this NE-SARE grant, was information on the sources and timing of infections to inform cultural controls and the timing of effective fungicide applications.
Management of bitter rot needs to start with practical cultural controls that reduce the amount of spores being dispersed in orchards. Building on the knowledge that infected fruit mummies in the tree canopy are major infection sources, we asked whether tossing the infected apples to the orchard floor to decay eliminates them as an infection source. Since complete removal of infected apples from the orchard is impractical for most growers we compared the degradation of bitter rot infected apples on herbicide treated tree rows to grassed drive row middles, to see if tossing infected apples onto the grass is an effective management option. We identified the microbes that succeed the Colletotrichum fungi and continue the degradation of infected apples with metagenomic amplicon sequencing, a technique that sequences microbial DNA ”fingerprints” to identify the microbial population, including the Colletotrichum species that cause bitter rot and the other competing microbes.
Apple with bitter rot degraded slightly faster in grassed drive row middles than on weed and grass free herbicide treated tree rows, but the difference was insignificant. The biggest difference was between apples with bitter rot that mummified and remained in the tree canopy and those on the ground, with Colletotrichum fungi persisting much longer in the mummified apples that remained in the tree canopy. Mummified apples were partially dried out, and lower moisture appeared to be the biggest reason those apples degraded slower than the ones on the ground. Across all samples, the other fungi that succeeded the Colletotrichum fungi were primarily various species of yeasts.
Less disease pressure reduces the need for fungicides and their associated environmental and health risks, be it the persistence of synthetic fungicides or the buildup of organic products such as copper. Most farmers spray fungicide (organic or conventional) cover sprays at regular intervals, but some still struggle to control bitter rot. Standard advice in this situation is to rotate fungicide modes of action and shorten the spray interval. However, this is a shot in the dark without knowing when spores are being dispersed. Knowing the timing of spore dispersal is complicated by the life cycle of Colletotrichum species that cause bitter rot, as this life cycle includes a dormant period after the initial infection during which the infection is present but indistinguishable to the naked eye. Rot that appears close to or after harvest may have started at any point during the growing season.
We addressed the question of timing of infection in two ways. First, we determined when spores were being dispersed in the orchard by setting out spore traps, and detected the fungi that cause bitter rot with a technique called q-PCR. Q-PCR detects and quantifies specific microbes by detecting DNA specific to those microbes. Spores were trapped throughout the growing season in and under orchard trees, including non-fungicide treated trees and trees that received standard fungicide applications, and in nearby forests. Second, it has been discovered that freezing (and thereby killing) and incubating immature apples with dormant infections causes (or allows) the infection to grow and become obvious. During the growing season immature apples were picked at regular intervals and tested for dormant infections, allowing us to determine when the dormant infections started.
To our surprise, we discovered that Colletotrichum spores were being dispersed from the time the leaves emerged in the spring until the leaves dropped in the fall, and that more spores were being dispersed in the forest than in the orchards. Subsequent testing of leaves in both the orchards and the forest convinced us that this Colletotrichum species was actually primarily a leaf endophyte, and only secondarily a fruit pathogen. However, patterns of bitter rot in orchards and the limited distances that spores are dispersed from their source indicate that forests are not regular sources of the spores that infect apples, and that most spore cycling occurs with orchards and even within individual trees. Our testing of immature apples indicated that fruits are susceptible throughout the season.
While there were no direct changes in farmer’s practices as a result of this research, this research did emphasize the importance of practices that most farmers were already doing, such as removing diseased apple from the tree canopy, and applying protectant fungicides throughout the growing season. It also explained why bitter rot is found in nearly all orchards, as the causal fungi are very common in the general environment. It mostly provided new information on the biology and ecology of the Colletotrichum fungi that cause bitter rot, which will guide future research on the integrated management of bitter rot of apple.
1. Determine the sources and major infection periods of Colletotrichum spp. (bitter rot fungi) in PA apple orchards. Determine if Colletotrichum spp. spore sources are on outer bud scales, in the tree canopy, splashed up from the orchard floor, or from nearby forested areas, and the timing and quantity of spore dispersal from those sources. Detect the timing and incidence of dormant infections in apples throughout the season.
2. Track the degradation of infected apples and reduction of Colletotrichum spp. on the orchard floor and the successional microbes driving that degradation. Quantify the reduction of bitter rot fungi in decaying apples on the orchard floor, comparing weed-free tree rows with grassed row middles. Determine successional fungal species in infected apples, comparing weed-free tree rows with grassed row middles.
Pennsylvania anchors the Mid-Atlantic and Northeast fruit industry, growing 23% of the region’s 2 billion pound (~$500 million) annual apple production (USDA-NASS 2018). Pennsylvania apple growers are experiencing increased losses from the summer fungal disease called bitter rot, a problem also plaguing growers in the surrounding states of the Mid-Atlantic and Northeast. Since bitter rot was historically a disease found mostly south of the Maryland-Ohio-river-valley-line (Roberts, Farmers Bulletin 938, USDA 1935), most management recommendations are based on southern research, much of which has not been experimentally tested in the Mid-Atlantic and Northeast. Recognizing the need for applied research on bitter rot, the State Horticultural Society of Pennsylvania is funding a state-wide survey identifying the Colletotrichum spp. causing bitter rot and testing them for fungicide resistance. What is still needed, and what is being funded by this NE-SARE grant, is information on the sources and timing of infections to inform cultural controls and the timing of effective fungicide applications.
This project will contribute to the understanding of the disease cycle of bitter rot of apple, and will inform management decisions that will reduce the disease pressure and allow for targeted application of control products. Reduced control product usage has potential to reduce environmental impact and will improve farm profitability.
Cooperators
- (Researcher)
Research
Approach and methods
The experiments listed below are taking place at Penn State University’s Fruit Research and Extension Center (FREC) located in the heart of Pennsylvania’s apple growing region at 290 University Drive, Biglerville PA 17307, and at Hollabaugh Bros., Inc. Fruit Farm & Market, 545 Carlisle Road, Biglerville, PA 17307.
1. Determine the sources and major infection periods of Colletotrichum (bitter rot fungi) in PA apple orchards.
Since the only Colletotrichum spp. isolated from bitter rot apples at FREC have been C. fioriniae of the C. acutatum species complex, our molecular detection (q-PCR) methods were focused on C. fioriniae.
Determine if bitter rot fungi overwinter on outer bud scales.
Apple buds were collected during dormancy and assessed for the presence of Colletotrichum species on outer bud scales by incubating them in warm moist conditions and observing them for growth of Colletotrichum species. Approximately 100 apple buds per season will be tested. Data analysis is simple presence/absence of bitter rot fungi and will be shown as a percentage of buds tested.
Determine if spore sources are mostly in the tree canopy, splashed up from the orchard floor, or from nearby forested areas, and the timing and quantity of spore dispersal from those sources.
Trapping of rain-splashed spores
Rain-splashed spore traps were constructed with Falcon® 225 mL polypropylene conical centrifuge tubes (Corning INC, Corning NY) and household grade 5 in. plastic funnels by drilling a hole in the centrifuge tube cap, inserting the funnel, and gluing them together. The centrifuge tube could then be unscrewed from the funnel and replaced as needed. A wire sink strainer was placed in the funnel to keep out large debris. The spore traps were placed in apple orchards and forested woodlots, all on Penn State’s Fruit Research and Extension Center (FREC) in Biglerville and Arendtsville PA.
The orchard spore traps were located two per tree in and under the canopy, about 50 cm and 2 m off the ground, both within a meter of the trunk. All trees were on semi-dwarfing rootstock. A single ‘Honeycrisp’ tree in 2018 and a ‘Honeycrisp’ and a ‘Rome’ tree in 2019 and 2020 had C. fioriniae bitter-rot-infected apples hung in onion bags in the tops of the trees during bloom to maximize disease pressure, and had no fungicides applied during the season. A ‘Honeycrisp’, a ‘Rome’, and a ‘Delicious’ tree in 2018 and a ‘Honeycrisp’ and a ‘Delicious’ tree in 2019 and 2020 were non-inoculated and had no fungicide treatments. Two ‘Gala’ and 3 ‘Honeycrisp’ trees in 2018, 2019, and 2020 were non-inoculated and received standard fungicide treatments as recommended for commercial orchards.
Two of the forested woodlot spore traps were located in a successional forest that was meadow in the early 1990s, and consisted of deciduous trees about 10-12 meters high with trunks 10-20 cm in diameter. The other 3 traps were in a mature mostly deciduous forest woodlot with tree-trunk diameters up to 80 cm. The traps were hung in wire hoops on wooden posts about 1 meter off the ground.
Spores were collected within 24 hours after a rain, no more than once a week, and only after sufficient rainfall to fill the bottles at least 1/4 full. After processing of the sample, bottles were hand-washed with soap and bleach in warm water. Before reattachment of a clean bottle funnels were cleaned by spraying with 1% (0.05% NaClO) bleach solution.
Detection and quantification of spores
DNA extraction
The volume of water in each bottle was recorded, and the bottles centrifuged in a 2-step process in an Eppendorf 5810R centrifuge (Eppendorf North America, Hauppauge NY). The steps consisted of 8 min. at 4,000 rcf, decanting of all but 20-30 mL of water in a process that often dislodged the pellet, then a second centrifugation of 8 min. at 4,000 rcf and decanting of the remaining water.
DNA was extracted from the pellet using the NucleoSpin Soil DNA extraction kit (Macherey Nagel, Bethlehem, PA) with the following modifications. For step 1, 500 mL of buffer SL2 was pipetted into the centrifuge tube and used to dislodge the pellet, which was transferred with pipette to the bead tube. After addition of Enhancer SX in step 2, the sample was lysed by using a Macherey Nagel bead tube holder attached to a Vortex Genie (Scientific Industries, Bohemia NY) at max speed for 12 min. The rest of the DNA extraction followed protocol, which was finished by eluting the purified DNA with 50 µl of buffer SE. A negative control (no initial pellet) was included in every DNA extraction to check for contaminated reagents.
Detection and quantification with q-PCR
DNA primers for a C. fioriniae specific Sybr-Green based q-PCR assay were designed using Primer3 and NCBI primer BLAST software, targeting introns in the GAPDH and β-tubulin genes. The GAPDH primers were GD_fior_F1 5'-GATTGGGCTCGTTGTTGTAATG-3' and GD_fior_R1 5'-GGCCTGTGATGATTGTCTGT-3', while the β-tubulin primers were Bt_fior_F1 5'-GCGTGTATGTCACTTTGTCCT-3' and Bt_fior_R1 5'-GGAAGTGCCGTTGTACCTG-3'. Primers were synthesized by Integrated DNA Technologies (Skokie, IL), and the PCR plates and optically clear strip caps were from VWR (Radnor, PA). The q-PCR master mix was Bio-Rad’s SsoAdvanced™ Universal SYBR® Green Supermix and the assay was run on a Bio-Rad C1000 thermocycler with the CFX96 detection system (Bio-Rad Laboratories Inc., Hercules CA). Cycle perimeters were 98°C for 3 min and 40 cycles of 98°C for 10s and 60°C for 30s, followed by a melt curve from 65°C to 95°C in 0.5C increments.
Spores were also detected and quantified using the C. acutatum-species-complex (which includes C. fioriniae) specific methods of Debode et al. (2009). Briefly, it is a TaqMan (Thermo Fisher Scientific, Waltham MA) based assay with a FAM-QSY probe that is specific to the C. acutatum species complex. Primers were synthesized by Integrated DNA Technologies (Skokie, IL), and the PCR plates and optically clear strip caps were from VWR (Radnor, PA). PCR conditions were 2 min at 50°C, followed by 40 cycles of 15 s at 95°C and 30 s at 60°C.
A standard curve was created by counting 3 separate suspensions of C. fioriniae spores with a hemocytometer, taking a calculated 1 x 10⁷ spores from each suspension and extracting DNA using the method described above. The 3 samples were analyzed with the q-PCR assay for variation, and then combined into a single sample and serially diluted 10-fold from 1 x 10⁷ to 1 x 10³ conidia equivalents. DNA standards of 1 x 10⁷, 1 x 10⁶, 1 x 10⁴, and 1 x 10³ were added to each q-PCR run as an internal standard to equate cycle number to conidia number. All samples were run in duplicate and the mean average obtained.
Q-PCR baseline correction and quantification thresholds were set automatically by the BioRad software and conidia equivalents were automatically calculated by the software based on the Cq value and the internal standard curve. Results were exported to a spreadsheet where the conidia equivalents were divided by the mL of water in the spore-trap to normalize to units of conidia/mL of rainwater, which were then log10 transformed for statistical analysis. Statistical comparison of conidia numbers by location was done in SAS software using PROC GLM followed by a Tukey’s highly significant difference (HSD) means separation test (SAS Corporation, Cary NC).
Detect the timing and incidence of dormant infections in apples using the freezing method.
An orchard block of Honeycrisp apples at the Fruit Research and Extension Center that experienced minimal bitter rot disease pressure in 2018 was used to find the period of greatest apple susceptibility to bitter rot. Weekly applications of Mancozeb (3 lb/acre) and Captan (2.5 lb/acre) in 2019 and Captan (2 lb/acre) in 2020, were used to limit infection outside of select 2-week periods throughout the season. Both years the orchard block was divided into 10 treatment blocks.
Starting at bloom, select treatment blocks had a 2-week gap in the fungicide program during which apples with bitter rot that were sporulating were hung in the tree canopy to induce heavy infection pressure during that time. The no-fungicide/ heavy infection periods were applied to successive treatment blocks from bloom to harvest. Immature apples were harvested immediately before and after the infection period and tested for dormant infections using the surface disinfestation-freezing-incubation method. In this method, apples were surface disinfested with 75% ethanol and 10% (0.5% NaClO) bleach, placed in a -20C freezer overnight to kill the apple, then incubated in a humid container at room temperature for several weeks and observed for orange masses of conidia that are diagnostic of Colletotrichum. Fruit were collected at harvest and rated for infection. Non-infected fruit incubated at room temperature and rated 2 weeks later for post-harvest rots.
2. Track persistence of Colletotrichum (bitter rot fungi) and microbial succession in infected apples on the orchard floor.
Quantify the reduction of Colletotrichum spp. in decaying apples on the orchard floor and track the degradation and successional fungal species in infected apples, comparing weed-free tree rows with the grassed row middles and diverse plant communities.
Treatments: Honeycrisp Apples with bitter rot were placed on the orchard floor at harvest in the weed/grass-free tree row, the adjacent grassed drive rows, and in a nearby pollinator block planted to diverse plant species. Three replications were done of each location (weed-free tree row, grassed drive row, diverse plant plot). The apples were placed in a grid so that the apples were at least a foot apart. Each apple was weighed at placement and its location recorded. The apples with bitter rot were either wound-inoculated with C. fioriniae mycelia, or were naturally infected and came from trees that had been inoculated with C. fioriniae conidia early in the summer.
Sample collection: Approximately once a month unless the ground was frozen, starting at placement in early October, four apples from each replication were collected and weighed. For one collection time in 2018 and all the collection times in 2019, three samples of four apples with bitter rot that remained hanging in the tree canopies were also collected. The apples were placed in a Waring Laboratory blender (Dynamics Corp. of Amer., New Hartford, CT) and blended to slurry. Up to 400 ml of water was added to the sample as needed for blending. About 40 ml of the sample was placed in labeled Eppendorf tubes and stored in a -20°C freezer for future DNA extraction. Approximately 150 g of the sample was put on a paper plate, weighed, placed in a drying oven for several days until crisp, and weighed again. The percent dry matter of the sample was calculated from the wet and dry sample weights, and the corrected percent dry matter of the sampled apples was calculated based on the weight of the four apples and the weight of the added water.
DNA extraction: The mg of wet material from each sample needed to obtain 50 mg (2018 samples) or 25 mg (2019 samples) of dry matter was calculated based on the percent moisture in each sample, and placed into bead tubes of the NucleoSpin Soil DNA extraction kit (Macherey Nagel, Bethlehem, PA). Because some samples were high in moisture and contained excess liquid, all of the bead tubes with samples were centrifuged for 10 minutes at 16,000 rcf and the liquid decanted to make room for DNA extraction reagents.
DNA extraction was performed with the NucleoSpin Soil kit with the following modifications. For step 1, 500 mL of buffer SL2 was pipetted into the centrifuge tube and after addition of Enhancer SX in step 2, the sample was lysed by using a Macherey Nagel bead tube holder attached to a Vortex Genie (Scientific Industries, Bohemia NY) at max speed for 12 min. The rest of the DNA extraction followed protocol, which was finished by a two-step DNA elution in 50 µl of buffer SE for a total of 100 µl purified DNA. A negative control (no initial sample) was included in every DNA extraction to check for contaminated reagents.
Quantification with q-PCR: C. fioriniae DNA was detected and quantified using the C. acutatum-species-complex (which includes C. fioriniae) specific methods of Debode et al. (2009). Briefly, it is a TaqMan (Thermo Fisher Scientific, Waltham MA) based assay that is specific to the C. acutatum species complex. Primers were synthesized by Integrated DNA Technologies (Skokie, IL), and the PCR plates and optically clear strip caps were from VWR (Radnor, PA). The assay was run on a Bio-Rad C1000 thermocycler with the CFX96 detection system (Bio-Rad Laboratories Inc., Hercules CA) to 40 cycles. A standard curve was created by counting 3 separate suspensions of C. fioriniae spores with a hemocytometer, taking a calculated 1 x 10⁷ spores from each suspension and extracting DNA using the NucleoSpin Soil kit described above. The 3 samples were analyzed with the q-PCR assay for variation, and then combined into a single sample and serially diluted 10-fold from 1 x 10⁷ to 1 x 10³ conidia equivalents. DNA standards of 1 x 10⁷, 1 x 10⁶, 1 x 10⁴, and 1 x 10³ were added to each q-PCR run as an internal standard to equate cycle number to conidia number. All samples were run in triplicate and the mean average obtained.
Q-PCR baseline correction and quantification thresholds were set automatically by the BioRad software and conidia equivalents were automatically calculated by the software based on the Cq value and the internal standard curve. Results were exported to an Excel (Microsoft, Redmond, WA) spreadsheet for summarizing and graphing. Results from 2018 were divided by two, because twice as much starting material had been used in DNA extraction.
Metagenomic sequencing: PCR was performed on an Eppendorf Mastercycler (Eppendorf North America, Enfield, CT) thermocycler using Thermo Fisher DreamTaq Green 2X master mix, 0.5 µM primers, and 1 µl of template DNA in a20 µl reaction. Primers were ITS1F (Gardes & Bruns 1993) and 58A2R (Martin & Rygiewicz 2005) with linker and adapter regions for Illumina sequencing (ITS1F-Illu 5'-TCGTCGGCAGCGTCAGATGTGTATAAGAGACAGCTTGGTCATTTAGAGGAAGTAA-3', 58A2R-Illu 5'-GTCTCGTGGGCTCGGAGATGTGTATAAGAGACAGCTGCGTTCTTCATCGAT-3') PCR conditions were 94°C for 5 min: 35 cycles of 94°C for 30s, 45°C for 30s, and 72°C for 45s, with a final elongation for 5 min. Five µl of the PCR products was run on a 1% agarose gel electrophoresis to check for amplification. The remaining PCR product was send to Penn State’s Genomics core facility (University Park, PA) for metagenomic amplicon sequencing. Penn State performed the second round of PCR to attach the rest of the Illumina adapter and sample indexes, made an approximately equimolar pool of the libraries and sequenced them on an Illumina MiSeq using 250 x 250 paired sequencing.
ITS sequencing data analysis: Raw demultiplexed fungal ITS gene data were processed using the Quantitative Insights into Microbial Ecology pipeline (QIIME 2 version 2020.2.0) (Bolyen et al. 2019). Briefly, paired-ended ITS sequences were imported then trimmed to the primer locations using ITSxpress (Rivers et al. 2018) and denoised using DADA2 (Callahan et al. 2016). Taxonomy was classified using the classify-sklearn qiime feature classifier against the UNITE database (version 8.2) (Abarenkov et al. 2020) at the single nucleotide threshold (Amplicon Sequence Variant; ASV). ASV’s with less than 41 counts were removed (0.001%) and rarefied to 10,693 sequences per sample. Data was summarized at different taxonomic levels using the qiime taxa barplot command. The fungal genera were further grouped into the morphological groups of either yeast or filamentous fungi, and summarized in a barplot.
Literature Cited:
Abarenkov, K., Zirk, A., Piirmann, T., Pöhönen, R., Ivanov, F., Nilsson, R. H., et al. 2020. UNITE QIIME release for Fungi. Version 04.02.2020. UNITE Community.
Bolyen, E., Rideout, J. R., Dillon, M. R., Bokulich, N. A., Abnet, C. C., Al-Ghalith, G. A., et al. 2019. Reproducible, interactive, scalable and extensible microbiome data science using QIIME 2. Nat. Biotechnol. 37.
Børve, J., and Stensvand, A. 2017. Colletotrichum acutatum occurs asymptomatically on apple leaves. Eur. J. Plant Pathol. 147:943–948.
Callahan, B. J., McMurdie, P. J., Rosen, M. J., Han, A. W., Johnson, A. J. A., and Holmes, S. P. 2016. DADA2: High-resolution sample inference from Illumina amplicon data. Nat. Methods. 13.
Carbone, I., and Kohn, L. M. 1999. A method for designing primer sets for speciation studies in filamentous ascomycetes. Mycologia. 91:553–556.
Debode, J., Van Hemelrijck, W., Baeyen, S., Creemers, P., Heungens, K., and Maes, M. 2009. Quantitative detection and monitoring of Colletotrichum acutatum in strawberry leaves using real-time PCR. Plant Pathol. 58:504–514.
Doyle, V. P., Oudemans, P. V, Rehner, S. A., and Litt, A. 2013. Habitat and host indicate lineage identity in Colletotrichum gloeosporioides s.l. from wild and agricultural landscapes in North America. PLoS One. 8.
Everett, K. R., Pushparajah, I. P. S., Timudo, A., Ah Chee, A., Scheper, R. W. A., Shaw, P. W., et al. 2018. Infection criteria , inoculum sources and splash dispersal pattern of Colletotrichum acutatum causing bitter rot of apple in New Zealand. Eur. J. Plant Pathol.
Gardes, M., and Bruns, T. D. 1993. ITS primers with enhanced specificity for basidiomycetes, application to the identification of mycorrihiza and rusts. Mol. Ecol. 2:113–118.
Garfinkel, A., and Chastagner, G. 2018. Identification of peony diseases in the Pacific Northwest and Alaska 2018.
Hu, M.-J., Grabke, A., and Schnabel, G. 2015. Investigation of the Colletotrichum gloeosporioides species complex causing peach anthracnose in South Carolina. Plant Dis. 99:797–805.
Kumar, S., Stecher, G., Li, M., Knyaz, C., and Tamura, K. 2018. MEGA X: Molecular evolutionary genetics analysis across computing platforms. Mol. Biol. Evol. 35:1547–1549.
Marcelino, J. a P., Gouli, S., Parker, B. L., Skinner, M., Schwarzberg, L., and Giordano, R. 2009. Host plant associations of an entomopathogenic variety of the fungus, Colletotrichum acutatum, recovered from the elongate hemlock scale, Fiorinia externa. J. Insect Sci. 9:1–11.
Martin, K. J., and Rygiewicz, P. T. 2005. Fungal-specific PCR primers developed for analysis of the ITS region of environmental DNA extracts. BMC Microbiol. 5.
Mertely, J. C., and Legard, D. E. 2004. Detection, isolation, and pathogenicity of Colletotrichum spp. from strawberry petioles. Plant Dis. 88:407–412.
O’Donnell, K., and Cigelnik, E. 1997. Two divergent intragenomic rDNA ITS2 types within a monophyletic lineage of the fungus Fusarium are nonorthologous. Mol. Phylogenet. Evol. 7:103–116.
Rhoads, A. F., and Block, T. A. 2007. The Plants of Pennsylvania: an Illustrated Manual. University of Pennsylvania Press.
Rivers, A. R., Weber, K. C., Gardner, T. G., Liu, S., and Armstrong, S. D. 2018. ITSxpress: Software to rapidly trim internally transcribed spacer sequences with quality scores for marker gene analysis. F1000Research. 7.
Rojas, E. I., Rehner, S. A., Samuels, G. J., Van Bael, S. A., Herre, E. A., Cannon, P., et al. 2010. Colletotrichum gloeosporioides s.l. associated with Theobroma cacao and other plants in Panamá: multilocus phylogenies distinguish host-associated pathogens from asymptomatic endophytes. Mycologia. 102:1318–1338.
Schneider, C. A., Rasband, W. S., and Eliceiri, K. W. 2012. NIH Image to ImageJ: 25 years of image analysis. Nat. Methods. 9:671–675.
Sogonov, M. V, Castlebury, L. A., Rossman, A. Y., Mejía, L. C., and White, J. F. 2008. Leaf-inhabiting genera of the Gnomoniaceae, Diaporthales. Stud. Mycol. 62:1–79.
Stephenson, S. A., Green, J. R., Manners, J. M., and Maclean, D. J. 1997. Cloning and characterisation of glutamine synthetase from Colletotrichum gloeosporioides and demonstration of elevated expression during pathogenesis on Stylosanthes guianensis. Curr. Genet. 31:447–454.
Swofford, D. L. 2003. PAUP*4.0: Phylogenetic Analysis Using Parsimony (*and Other Methods). Sinauer Associates, Sunderland Massachusetts.
Templeton, M. D., Rikkerink, E. H. A., Solon, S. L., and Crowhurst, R. N. 1992. Cloning and molecular characterization of the glyceraldehyde-3-phosphate dehydrogenase-encoding gene and cDNA from the plant pathogenic fungus Glomerella cingulata. Gene. 122:225–230.
Toju, H., Tanabe, A. S., Yamamoto, S., and Sato, H. 2012. High-coverage ITS primers for the DNA-based identification of ascomycetes and basidiomycetes in environmental samples. PLoS One. 7.
Weir, B. S., Johnston, P. R., and Damm, U. 2012. The Colletotrichum gloeosporioides species complex. Stud. Mycol. 73:115–180.
White, T. J., Bruns, S., Lee, S., and Taylor, J. 1990. Amplification and direct sequencing of fungal ribosomal RNA genes for phylogenetics. In PCR Protocols: A Guide to Methods and Applications, New York: Academic Press, p. 315–322.
Research results and discussion:
1. Determine the sources and major infection periods of Colletotrichum (bitter rot fungi) in PA apple orchards.
Determine if bitter rot fungi overwinter on outer bud scales
Apple twigs with approximately 75 buds were collected from ‘Honeycrisp’ block on March 19th 2019, and incubated on a wire rack in a plastic tub with wet paper towel in the bottom. The twigs were individually visually checked for orange C. fioriniae indicative of C. fioriniae on May 9th. There was abundant black rot on most of the twigs, along with occasional Phomopsis and unidentified mycelia. The only spore mass that even resembled C. fioriniae turned out to be Fusarium when observed under the microscope. No Colletotrichum spores were observed. The tubs had been placed in front of the ventilation unit and needed to be frequently re-moistened. Whether this intermittent drying had any impact on Colletotrichum sporulation is unknown.
In 2018 we had found Colletotrichum infections on a few buds that comprised less than 1% of the total. Since we only tested about 75 buds in 2019, we might have missed that low incidence of infection. It is also entirely possible that other saprophytic fungi overwhelmed the Colletotrichum infections. In personal communication with other scientists, we learned that plating of outer bud scales on ½ strength PDA agar might be a better detection method. In 2017 we had vigorously surface disinfested buds and then plated the bud scales and found no Colletotrichum. It is possible that Colletotrichum only survives on outer and not inner bud scales, and our vigorous surface disinfestation killed any Colletotrichum that was present.
Determine if spore sources are mostly in the tree canopy, splashed up from the orchard floor, or from nearby forested areas, and the timing and quantity of spore dispersal from those sources
Both C. fioriniae specific primer sets targeting the GAPDH and β-tubulin genes produced good amplification of both the standard curve samples and environmental samples (Figure 1a and 1c). In environmental samples with high spore concentrations the melt curve looked clean (Figure 1b). However, at lower concentrations, most environmental samples had secondary peaks that can indicate non-specific binding (Figure 1d). While not all secondary peaks are actual indicators of non-specific binding, samples with secondary peaks should be run on an agarose gel to confirm a single product (https://www.idtdna.com/pages/education/decoded/article/interpreting-melt-curves-an-indicator-not-a-diagnosis). Since secondary peaks in a Sybr-Green based assay would raise red flags for most peer reviewers, and since running every sample on agarose gel to confirm a single product is time-consuming, it was decided to go with the more specific (and also more expensive) TaqMan probe based assay.
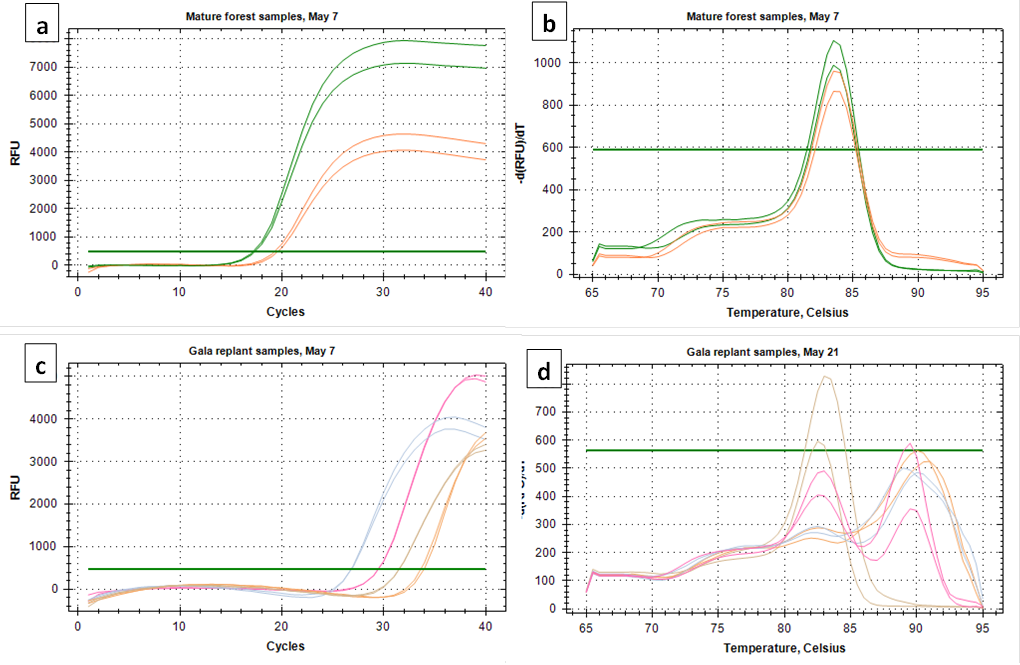
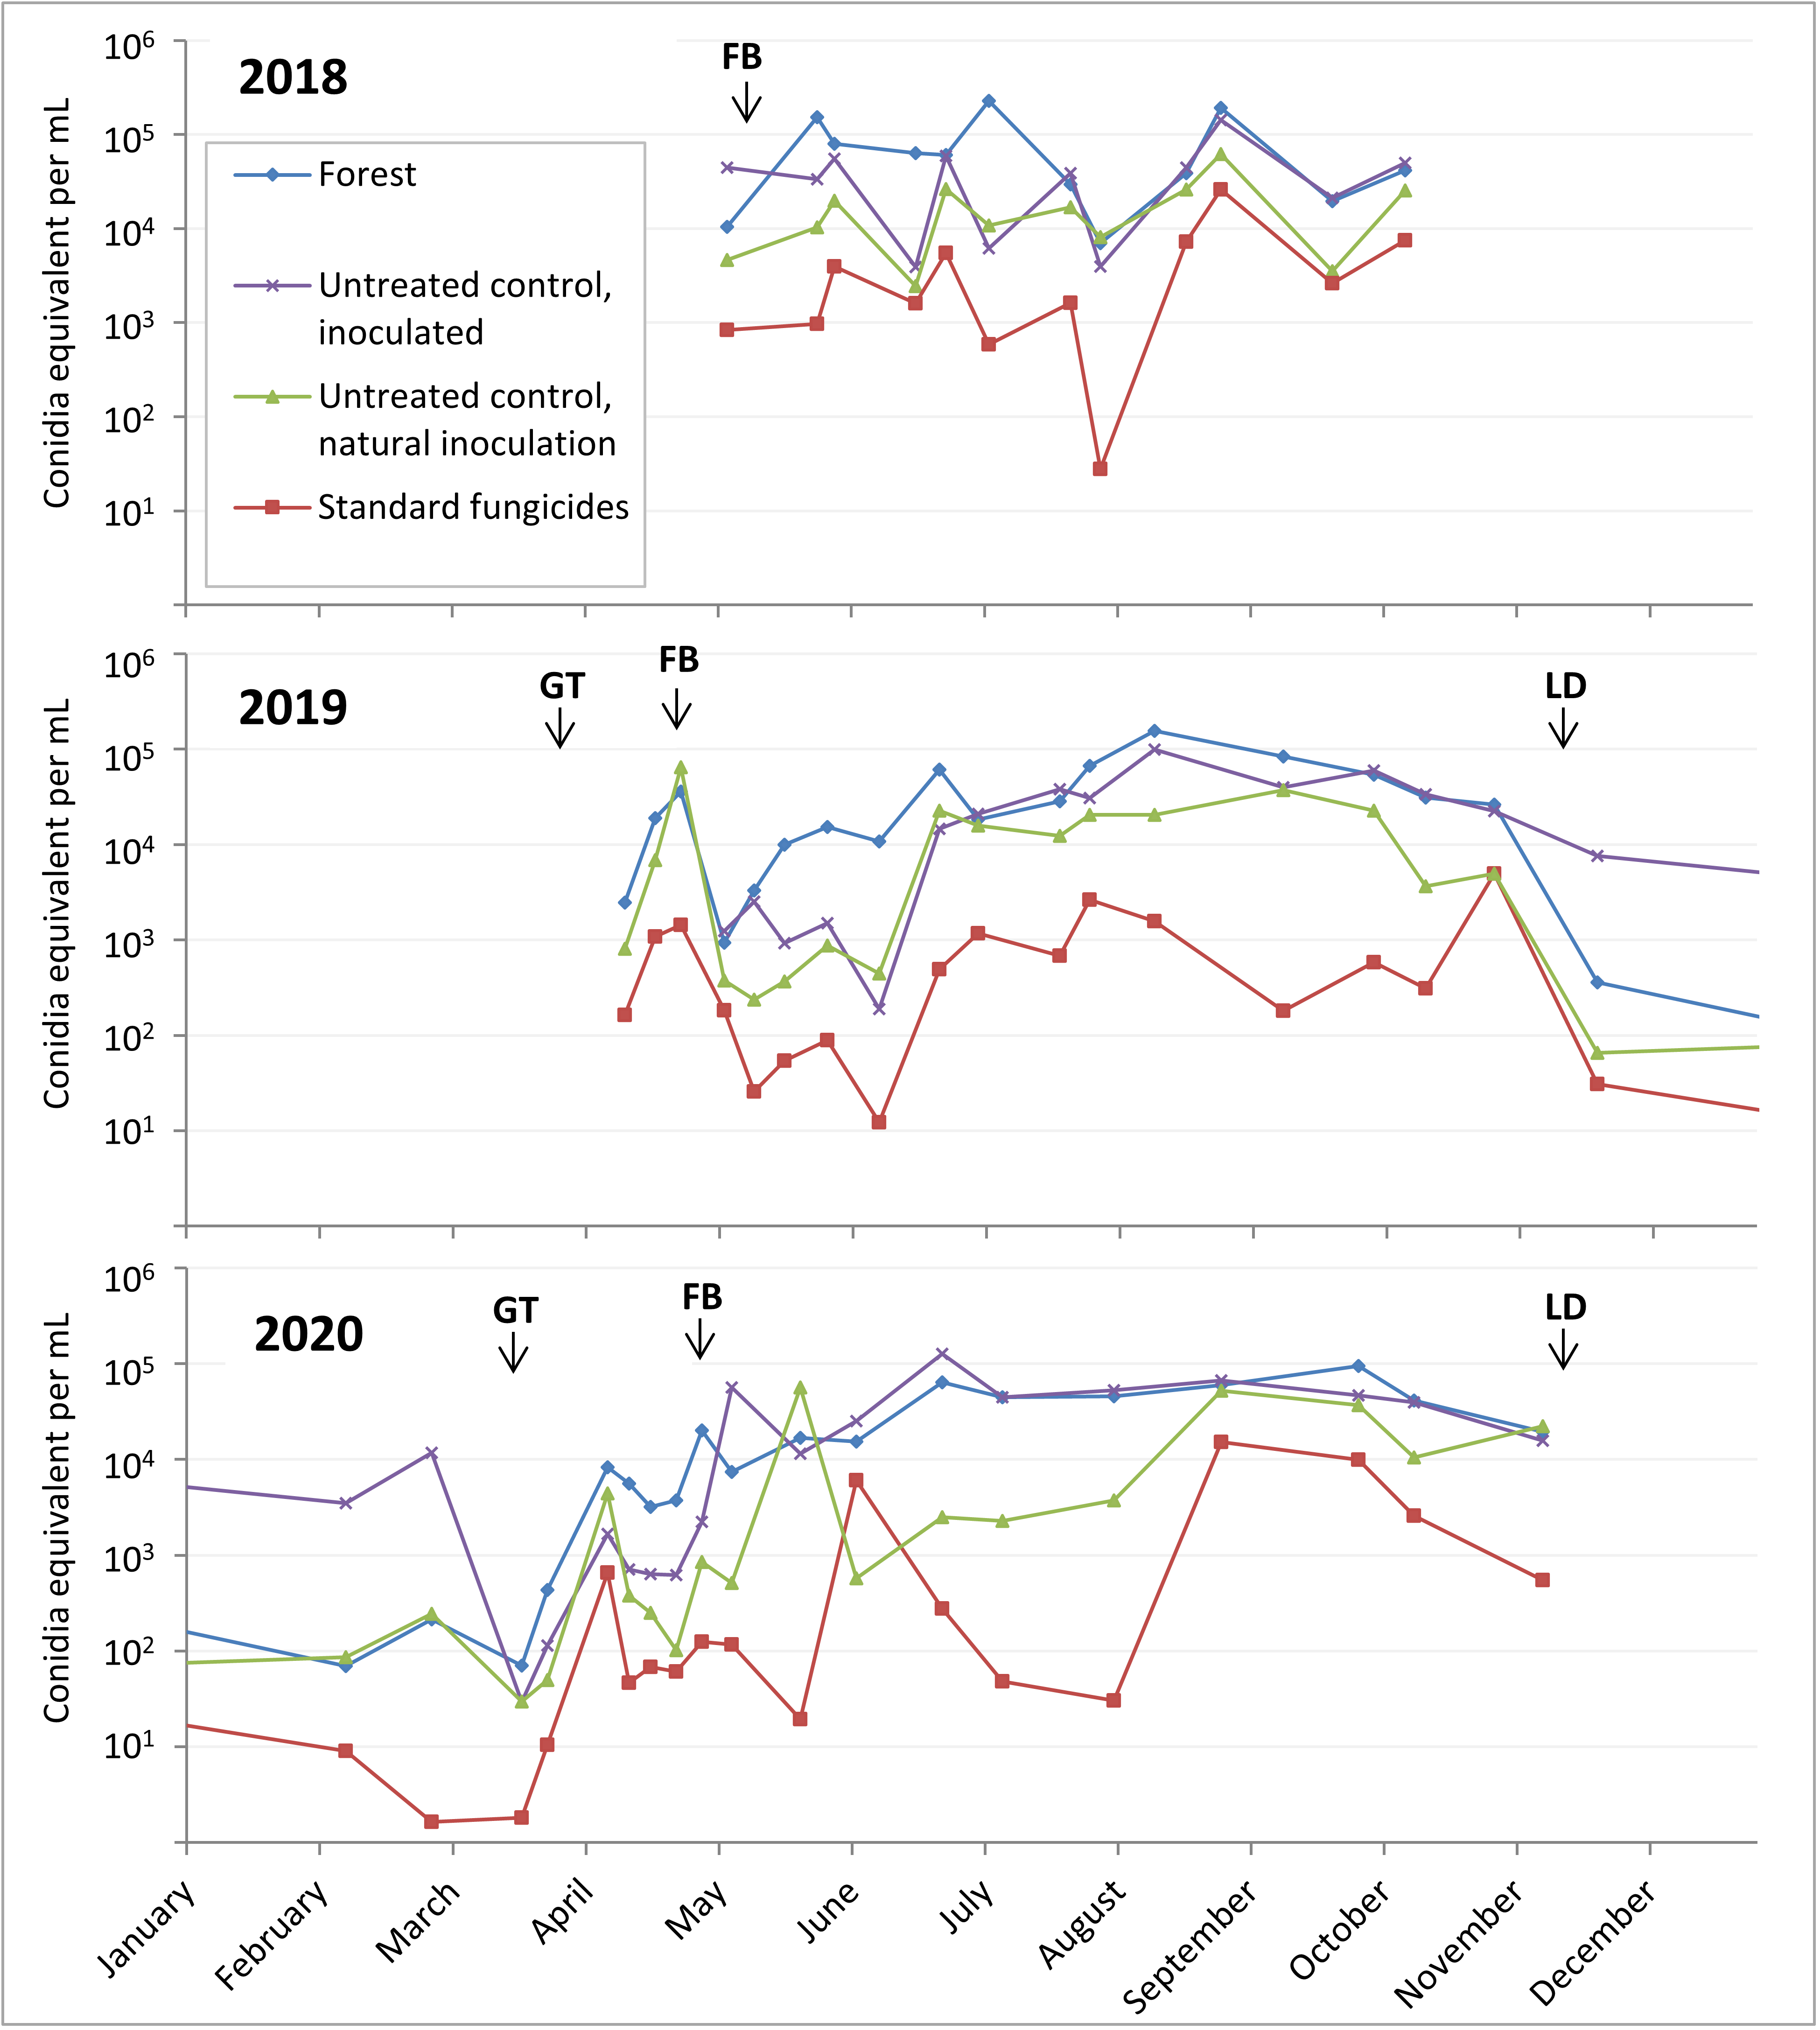
After considering the time and money it would take to design and test a TaqMan assay that is specific to C. fioriniae, it was decided to go with the C. acutatum species-complex specific assay of Debode et al (2009). While this assay could hypothetically detect any or all of the 20-odd species within the C. acutatum species complex, it would most likely detect only or mostly C. fioriniae, since that is the only species within the C. acutatum species complex that we have found in our orchards at Penn State FREC. Spore trap samples collected in 2018 before the start of this project funding were also analyzed with the assay from Debode et al (2009). Spores were collected 16 times from May through October in 2018, 19 times from April through November in 2019, and 19 times from February through November in 2020. Two out of the 16 collections in 2018 were removed from analysis due to contamination with copper sulfate that had been added as an experimental biocide, and 2 of the 2018 and 1 of the 2019 collections were removed from analysis because of contamination in the untreated control DNA extraction sample. This left 12 collections in 2018, 18 collections in 2019, and 19 collections in 2020, all at 23 locations (5 forest, 18 orchard).
Some samples were missing from these collection timepoints due to spills, broken bottles, etc. Samples that were above the range of the standard curve were counted as the maximum standard curve value of 107 conidia equivalent per sample. The 1060 samples showed spores are dispersed throughout the growing season (Figure 2). The start of high numbers of spores in the spring coincides with bud break and leaf formation, while the decline of spore dispersal in the fall coincides with leaf drop (Figure 2). The forest and untreated inoculated apple tree spore traps had the highest spore counts, while the fungicide treated apple spore traps had the lowest counts. These results showing spore dispersion throughout the season is somewhat bad news for management of bitter rot, as it indicates that fungicide applications will also have to be season long.
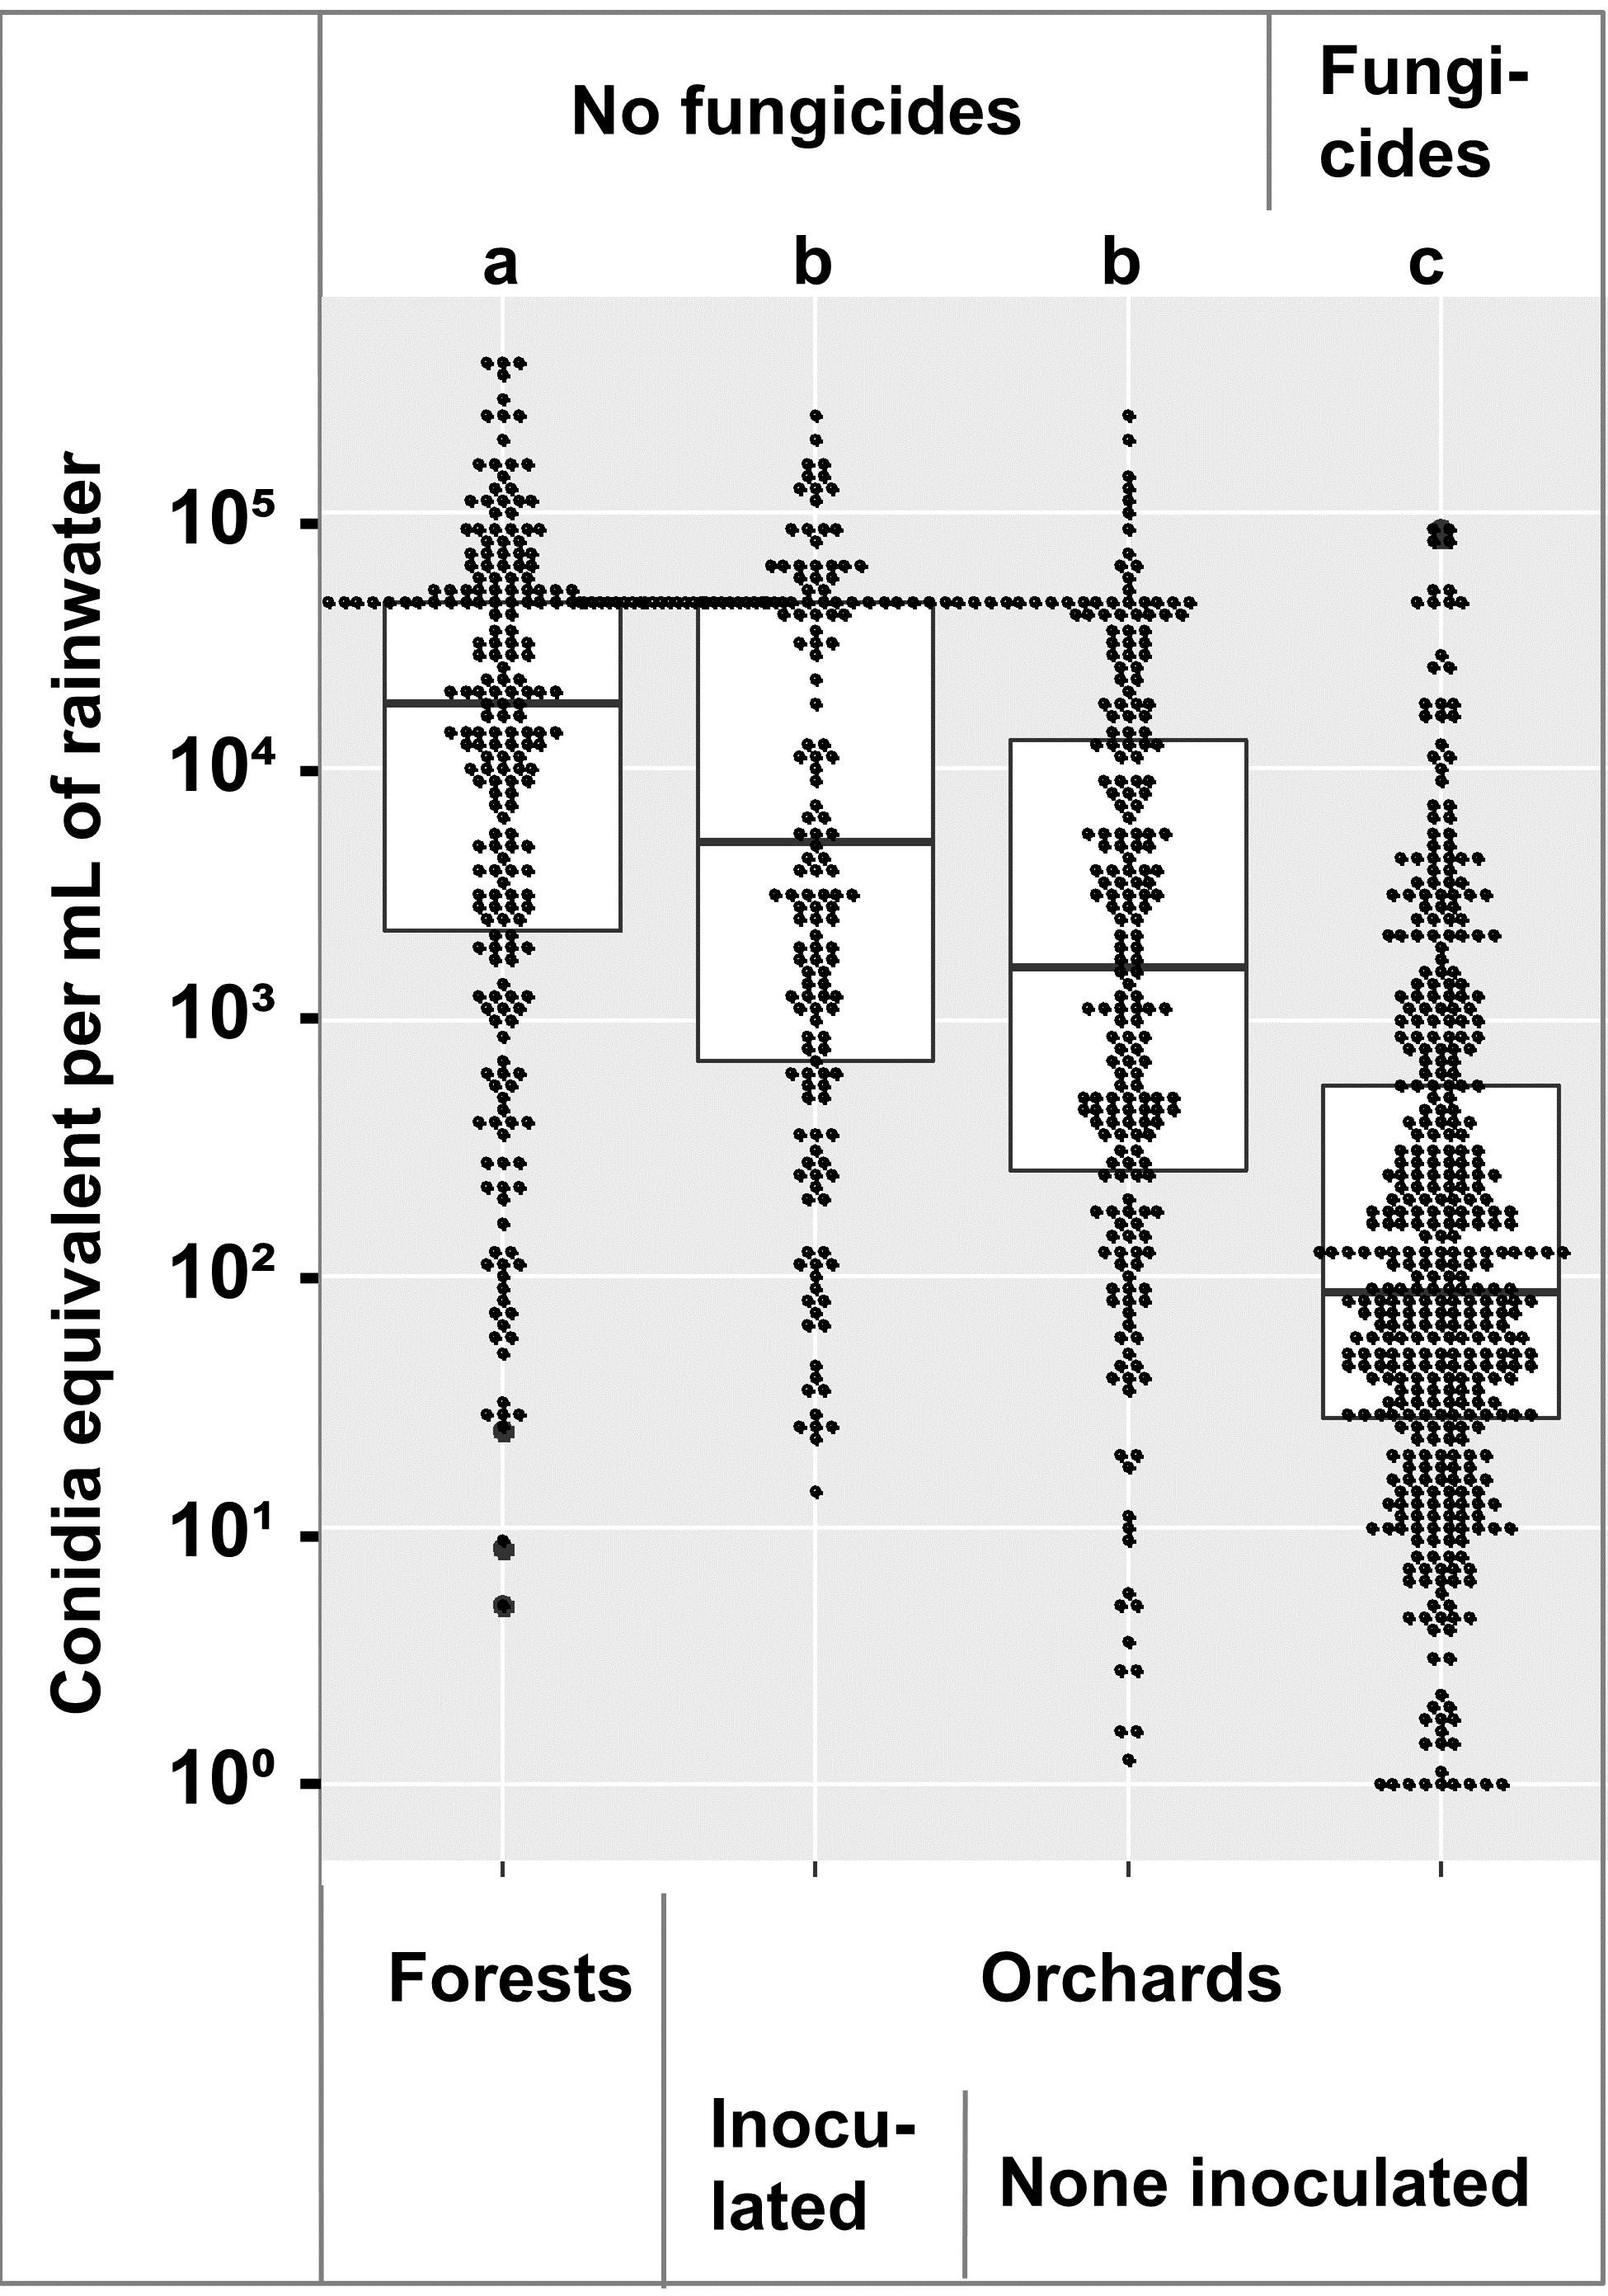
Comparison of the conidia equivalents across 2018, 2019, and 2020 showed that within the orchard, fungicide treated trees had lower numbers that untreated trees, and the numbers in the forest were higher than the orchard (Figure 3). An ANOVA followed by a Tukey-Kramer test showed the forest samples had more spores than the orchard samples, and the fungicide treated orchard samples had less than the untreated samples at α = 0.01 (Figure 3).
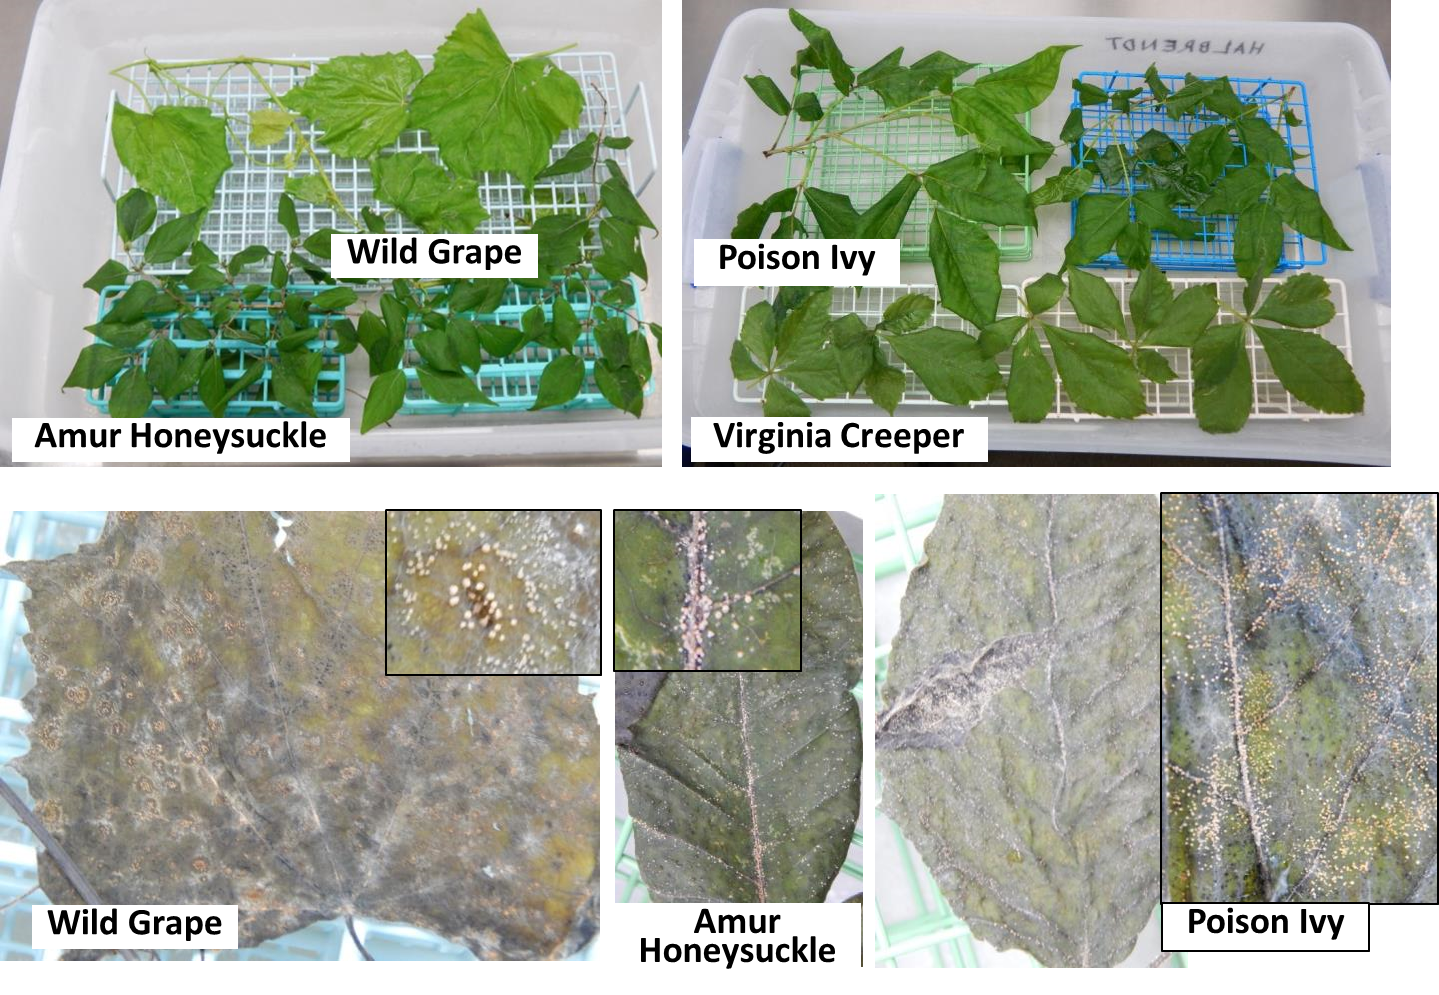
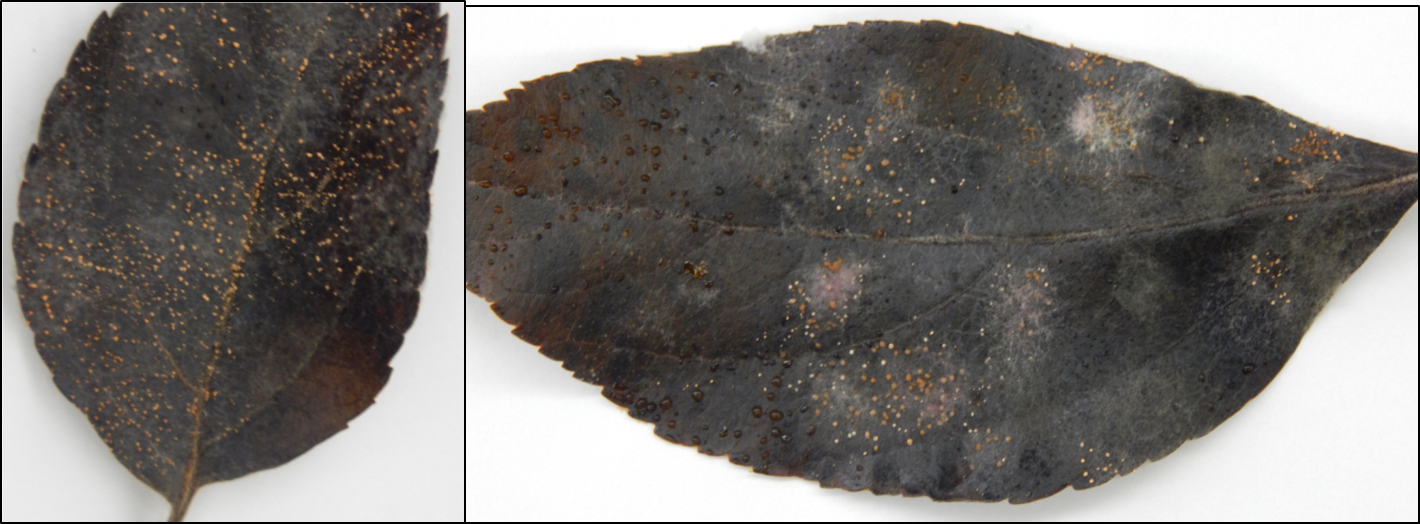
The finding that more spores are being dispersed in the forest than in the orchard was unexpected. This led to the question of where in the forest the spores were coming from. Based on earlier findings that C. fioriniae can be an endophyte in various broadleaf forest plants (Marcelino et al. 2009), the leaves of several forest understory plants were collected, and a freezing method based on Børve & Stensvand (2017) and Mertely & Legard (2004) was used to detect endophytic Colletotrichum species infections in leaves. Leaves were surface disinfested by submersion in 70% ethanol to break the water surface tension, rinsed in deionized water, submersed in 10% (0.5% NaClO) bleach for 40s, rinsed in deionized water, submersed in 70% ethanol for 20s, and rinsed again in deionized water. They were then placed on a rack in a plastic tub (Figure 4, top) with wet paper towel to maintain high humidity, frozen solid in a -20 or -80 freezer to kill the leaves, and incubated at room temperature (21-23C) for two weeks to allow endophytic fungi to sporulate. Deionized water was sprayed on the leaves as needed to maintain moist conditions. The results were abundant orange Colletotrichum conidia masses on many of the leaves (Figure 4, bottom). A few pure fungal cultures were obtained from these spore masses, and sequencing of intron 1 of the GAPDH gene (using primers GDF1 5’-GCCGTCAACGACCCCTTCATTGA-’3 and GDR1 5’-GGGTGGAGTCGTACTTGAGCATGT-’3 (Templeton et al. 1992)) showed that the sequences were identical to those from C. fioriniae from apple. Apple leaves were then also tested, and a number of which also produced abundant orange Colletotrichum conidia masses (Figure 5).
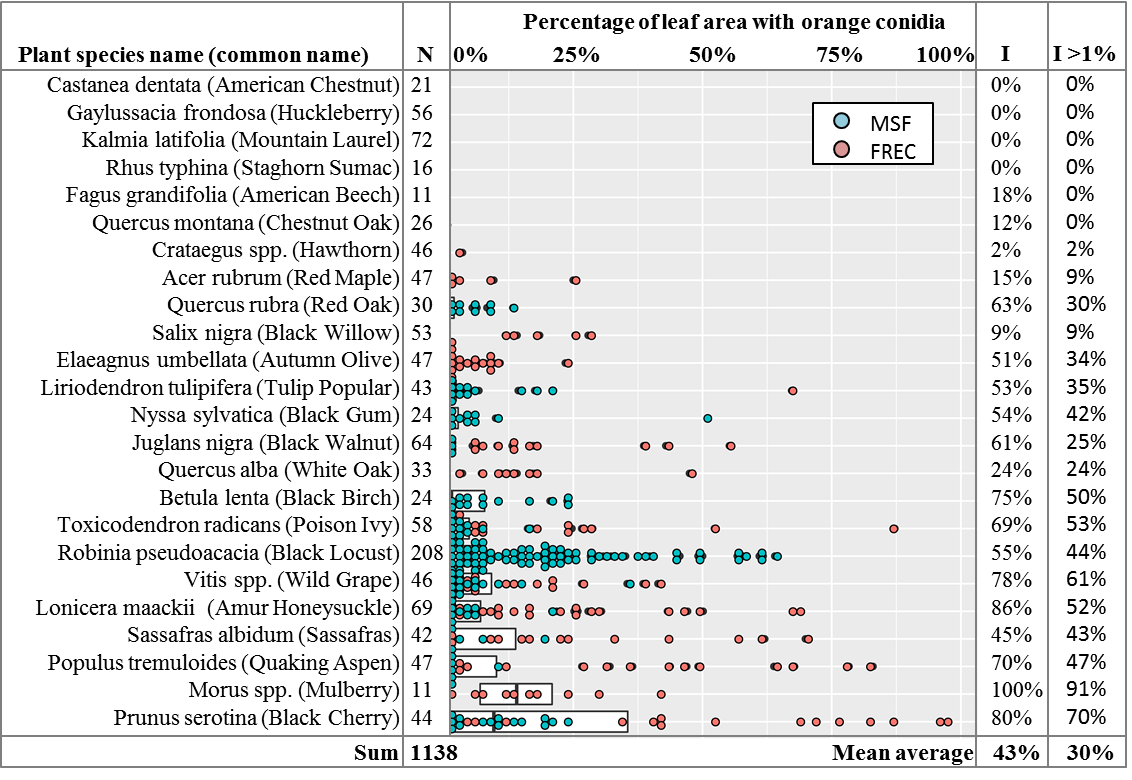
To make sure this wasn’t just a rare, localized occurrence, in 2019 over 1,138 leaves of 24 forest plant species were collected during the months of June to September from the orchard and forested area surrounding the spore traps at FREC, and from the nearby Michaux State Forest (MSF), mostly within a kilometer of N 40.034086, W -77.342036. Permit number SFRA-1920 was obtained from the Bureau of Forestry of the Pennsylvania Department of Natural Resources for the collection of leaves from MSF. This area of MSF was heavily logged in the 1800s and saw commercial activity up to the 1970s, but has been forested since then, and is at least 4 straight-line kilometers from the nearest agricultural fields. Plant species were identified based on morphology as per Rhoads & Block (2007).
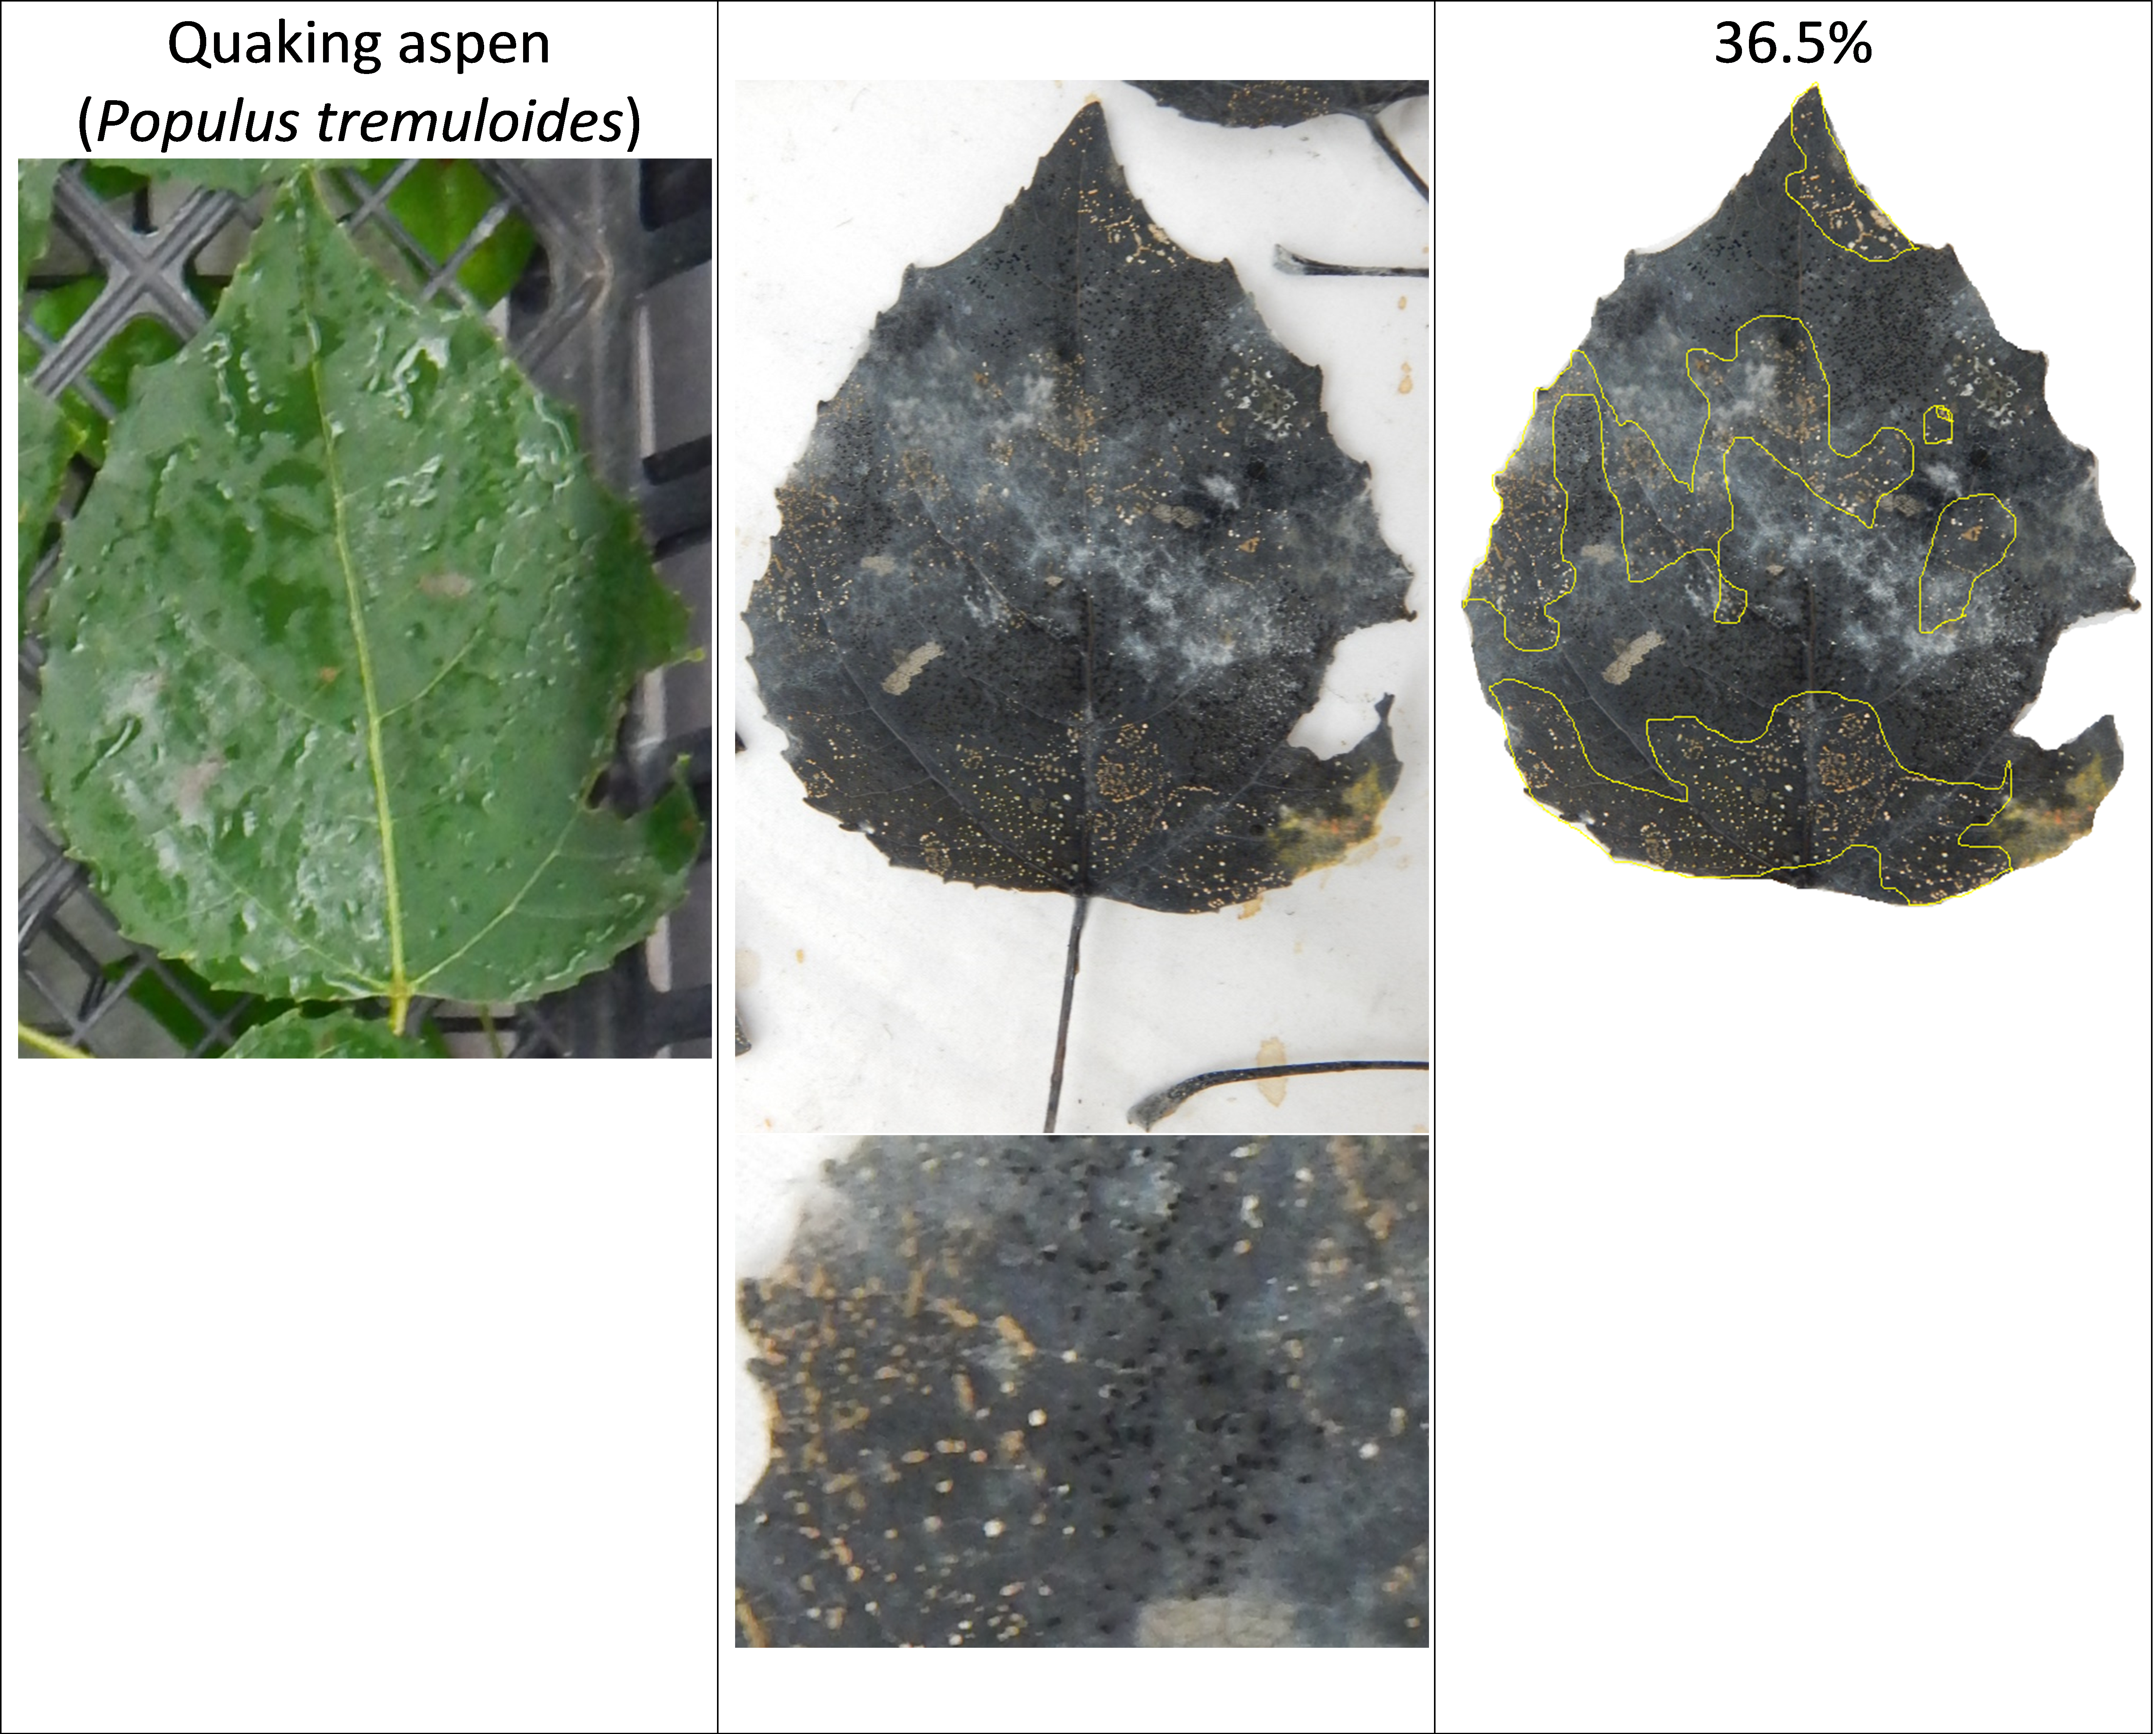
The leaves were tested via the freezing method described above. After incubation, photographs were taken of the leaves for calculation of % leaf surface area covered by orange spore masses. Using ImageJ software (Schneider et al. 2012), the outline of the leaf was manually traced and the pixels of leaf area obtained. The area containing orange spore masses was then traced to obtain the pixels of leaf area with orange spores and divided by the total leaf area to obtain a percentage of leaf area with orange spores (Figure 6). The overall results showed orange conidial masses on 43% of leaves, and quantification of spore mass area showed 30% of leaves had more than 1% leaf area with orange spores, with high variability among plant species (Figure 7). Levene’s test of variances of leaf area with orange spores by plant species showed they were not equal (p < 0.0001) and the general linear model in SAS showed that location, plant species, and the interaction of location and plant species were all highly significant predictors of percent leaf area with orange spores, with p-values of < 0.001. Given the in-equality of variances and the difficulties of separating the effects of location and location-plant species interactions from the effect of plant species alone, no means separation test based on plant species was performed. The results are instead shown as a dot-plot of percent leaf area with orange spores arranged by plant species, where every leaf with more than 1% leaf area with orange spores is shown as an individual dot (Figure 7).
This confirmed that Colletotrichum species are abundant as leaf endophytes both in farm woodlots and large forests, and raised the question of which Colletotrichum species these are. To answer that, 97 orange conidial masses were randomly selected from leaves of 20 plant species and the conidial masses streaked onto a Petri dish of ½ strength PDA (Potato Dextrose Agar, Difco, Franklin Lakes NJ). The resulting fungal growths were single-spore or hyphal-tip isolated to form genetically uniform fungal cultures. DNA was extracted from cultures with the NucleoSpin Microbial kit (Macherey Nagel, Bethlehem, PA) and intron 1 of the GAPDH gene was sequenced. After it was observed that many leaves also had areas of black spores, such as those in the Aspen photo in Figure 6, four black spored cultures were obtained for identification and comparison. The non-Colletotrichum fungal cultures were identified by sequencing the ITS gene using primers ITSF_KY02 5’-CTTGGTCATTTAGAGGAAGTAA-’3 (Toju et al. 2012) and ITS4 5’-TCCTCCGCTTATTGATATGCCAG-’3 (White et al. 1990).
Amplification, sequencing, and phylogenetic analysis of the GAPDH gene revealed that 87 isolates clustered with C. fioriniae, 2 with C. nymphaeae, 2 by themselves but closest to C. salix, and 3 by themselves but closest to C. aenigma. Three orange spored isolates that did not amplify with GAPDH were identified with ITS as Gnomoniopsis paraclavulata. Of the 4 black spored isolates, one amplified with GAPDH and matched C. fioriniae, while ITS identified the others as Diaporthe (Phomopsis) spp. and Pestalotiopsis spp. (Table 1). The most likely explanation for the single black-spored isolate that was identified as C. fioriniae (FREC121, Table 1) is that since it was from a leaf that had both orange and black conidia, and few C. fioriniae conidia were inadvertently plated out with the black conidia for single-spore isolation, and one of them was randomly or subconsciously selected. The 3 non-Colletotrichum orange-spored isolates were identified with ITS as Gnomoniopsis paraclavulata. These 3 isolates came from MSF from the closely related white and chestnut oaks. G. paraclavulata is described as living on white oak leaves, with orange conidia masses and conidia shapes nearly identical to those of Colletotrichum, although the conidia are distinctly smaller (Sogonov et al. 2008). Since C. fioriniae was also isolated from leaves of white and chestnut oaks, it should be assumed that a certain percentage of the leaf area with orange spores shown in Figure 7 of these 2 plant species is from G. paraclavulata. The identity of the black-spored isolates as Diaporthe (Phomopsis) spp. and Pestalotiopsis spp. makes sense, as these are widely distributed and well known leaf endophytes. The main result though, was that most of the isolates were C. fioriniae (figure 8).
Table 1: Source information on endophytic isolates from FREC and MSF used in this paper. Includes necrotrophic isolates from fruits for comparison. |
||||||||
|
Isolate |
Host scientific name |
Host Common Name |
Host organ |
Collection date |
Location type |
Notes |
Species |
|
|
FREC81 |
Malus domestica |
Apple |
Fruit |
Fall 2016 |
Orchard |
|
C. fioriniae |
|
|
FREC82 |
Malus domestica |
Apple |
Fruit |
Fall 2016 |
Orchard |
|
C. fioriniae |
|
|
FREC83 |
Malus domestica |
Apple |
Fruit |
Fall 2016 |
Orchard |
|
C. fioriniae |
|
|
FREC84 |
Toxicodendron radicans |
Poison Ivy |
Leaf |
14-Jun-18 |
Forest |
|
C. fioriniae |
|
|
FREC85 |
Toxicodendron radicans |
Poison Ivy |
Leaf |
14-Jun-18 |
Forest |
Koch’s Postulates performed on apple |
C. fioriniae |
|
|
FREC86 |
Toxicodendron radicans |
Poison Ivy |
Leaf |
14-Jun-18 |
Forest |
|
C. fioriniae |
|
|
FREC87 |
Toxicodendron radicans |
Poison Ivy |
Leaf |
14-Jun-18 |
Forest |
|
C. fioriniae |
|
|
FREC88 |
Vitis sp. |
Wild Grape |
Leaf |
14-Jun-18 |
Forest |
Koch’s Postulates performed on apple |
C. fioriniae |
|
|
FREC89a |
Vitis sp. |
Wild Grape |
Leaf |
14-Jun-18 |
Forest |
|
C. fioriniae |
|
|
FREC89b |
Vitis sp. |
Wild Grape |
Leaf |
14-Jun-18 |
Forest |
|
C. fioriniae |
|
|
FREC90 |
Lonicera maackii |
Amur Honeysuckle |
Leaf |
14-Jun-18 |
Forest |
Koch’s Postulates performed on apple |
C. fioriniae |
|
|
FREC91 |
Prunus persica |
Peach 'John Boy' |
Fruit |
24-Aug-18 |
Orchard |
|
C. fioriniae |
|
|
FREC92 |
Prunus persica |
Peach 'John Boy' |
Fruit |
24-Aug-18 |
Orchard |
Koch’s Postulates performed on apple |
C. fioriniae |
|
|
FREC93 |
Prunus persica |
Peach 'John Boy' |
Fruit |
24-Aug-18 |
Orchard |
|
C. fioriniae |
|
|
FREC94 |
Pyrus communis |
Pear 'Bartlett ' |
Fruit |
24-Aug-18 |
Orchard |
Koch’s Postulates performed on apple |
C. fioriniae |
|
|
FREC95 |
Pyrus communis |
Pear 'Bartlett ' |
Fruit |
24-Aug-18 |
Orchard |
|
C. fioriniae |
|
|
FREC96 |
Vitis hybrid |
Grape 'Vidal' |
Fruit |
1-Oct-18 |
Vineyard |
|
C. nymphaeae |
|
|
FREC97 |
Vitis hybrid |
Grape 'Vidal' |
Fruit |
1-Oct-18 |
Vineyard |
|
C. nymphaeae |
|
|
FREC98 |
Vitis hybrid |
Grape 'Vidal' |
Fruit |
1-Oct-18 |
Vineyard |
Koch’s Postulates performed on apple |
C. fioriniae |
|
|
FREC99 |
Vitis hybrid |
Grape 'Vidal' |
Fruit |
1-Oct-18 |
Vineyard |
|
C. fioriniae |
|
|
FREC100 |
Vitis hybrid |
Grape 'Vidal' |
Fruit |
1-Oct-18 |
Vineyard |
|
C. nymphaeae |
|
|
FREC101 |
Vitis hybrid |
Grape 'Vidal' |
Fruit |
1-Oct-18 |
Vineyard |
|
C. fioriniae |
|
|
FREC102 |
Vitis sp. |
Wild Grape |
Leaf |
9-Jul-19 |
Forest |
|
C. fioriniae |
|
|
FREC103 |
Vitis sp. |
Wild Grape |
Leaf |
9-Jul-19 |
Forest |
|
C. fioriniae |
|
|
FREC104 |
Vitis sp. |
Wild Grape |
Leaf |
9-Jul-19 |
Forest |
|
C. fioriniae |
|
|
FREC105 |
Sassafras albidum |
Sassafras |
Leaf |
9-Jul-19 |
Forest |
|
C. fioriniae |
|
|
FREC106 |
Sassafras albidum |
Sassafras |
Leaf |
9-Jul-19 |
Forest |
|
C. fioriniae |
|
|
FREC107 |
Acer rubrum |
Red Maple |
Leaf |
9-Jul-19 |
Forest |
|
C. fioriniae |
|
|
FREC108 |
Populus tremuloides |
Quaking Aspen |
Leaf |
9-Jul-19 |
Forest |
|
C. fioriniae |
|
|
FREC109 |
Populus tremuloides |
Quaking Aspen |
Leaf |
9-Jul-19 |
Forest |
|
C. fioriniae |
|
|
FREC110 |
Prunus serotina |
Black Cherry |
Leaf |
9-Jul-19 |
Forest |
|
C. fioriniae |
|
|
FREC111 |
Prunus serotina |
Black Cherry |
Leaf |
9-Jul-19 |
Forest |
|
C. fioriniae |
|
|
FREC112 |
Lonicera maackii |
Amur Honeysuckle |
Leaf |
9-Jul-19 |
Forest |
|
C. fioriniae |
|
|
FREC113 |
Toxicodendron radicans |
Poison Ivy |
Leaf |
9-Jul-19 |
Forest |
|
C. fioriniae |
|
|
FREC114 |
Toxicodendron radicans |
Poison Ivy |
Leaf |
9-Jul-19 |
Forest |
|
C. fioriniae |
|
|
FREC115 |
Toxicodendron radicans |
Poison Ivy |
Leaf |
9-Jul-19 |
Forest |
Black spore tendrils |
Pestalotiopsis sp.? |
|
|
FREC116 |
Vitis sp. |
Wild Grape |
Leaf |
27-Aug-19 |
Forest |
|
C. fioriniae |
|
|
FREC117 |
Populus tremuloides |
Quaking Aspen |
Leaf |
27-Aug-19 |
Forest |
|
C. fioriniae |
|
|
FREC118 |
Quercus rubra |
Red Oak |
Leaf |
27-Aug-19 |
Forest |
|
C. fioriniae |
|
|
FREC119 |
Sassafras albidum |
Sassafras |
Leaf |
27-Aug-19 |
Forest |
|
C. fioriniae |
|
|
FREC120 |
Sassafras albidum |
Sassafras |
Leaf |
27-Aug-19 |
Forest |
|
C. fioriniae |
|
|
FREC121 |
Quercus alba |
White Oak |
Leaf |
27-Aug-19 |
Forest |
Black spore tendrils |
C. fioriniae |
|
|
FREC122 |
Quercus alba |
White Oak |
Leaf |
27-Aug-19 |
Forest |
|
C. fioriniae |
|
|
FREC123 |
Quercus alba |
White Oak |
Leaf |
27-Aug-19 |
Forest |
|
C. fioriniae |
|
|
FREC124 |
Liriodendron tulipifera |
Tulip Popular |
Leaf |
27-Aug-19 |
Forest |
Leaf pale green at time of isolation and covered with fuzzy white mycelia |
C. fioriniae |
|
|
FREC125 |
Liriodendron tulipifera |
Tulip Popular |
Leaf |
27-Aug-19 |
Forest |
|
C. fioriniae |
|
|
FREC126 |
Prunus serotina |
Black Cherry |
Leaf |
27-Aug-19 |
Forest |
|
C. fioriniae |
|
|
FREC127 |
Prunus serotina |
Black Cherry |
Leaf |
27-Aug-19 |
Forest |
|
C. fioriniae |
|
|
FREC128 |
Acer rubrum |
Red Maple |
Leaf |
27-Aug-19 |
Forest |
|
C. fioriniae |
|
|
FREC129 |
Acer rubrum |
Red Maple |
Leaf |
27-Aug-19 |
Forest |
|
C. fioriniae |
|
|
FREC130 |
Lonicera maackii |
Amur Honeysuckle |
Leaf |
27-Aug-19 |
Forest |
|
C. fioriniae |
|
|
FREC131 |
Lonicera maackii |
Amur Honeysuckle |
Leaf |
27-Aug-19 |
Forest |
|
C. fioriniae |
|
|
FREC132 |
Toxicodendron radicans |
Poison Ivy |
Leaf |
27-Aug-19 |
Forest |
|
C. fioriniae |
|
|
FREC133 |
Quercus alba |
White Oak |
Leaf |
4-Sep-19 |
Forest |
|
C. fioriniae |
|
|
FREC134 |
Fagus grandifolia |
American Beech |
Leaf |
4-Sep-19 |
Forest |
|
C. fioriniae |
|
|
FREC135 |
Fagus grandifolia |
American Beech |
Leaf |
4-Sep-19 |
Forest |
|
C. fioriniae |
|
|
FREC136 |
Fagus grandifolia |
American Beech |
Leaf |
4-Sep-19 |
Forest |
|
C. fioriniae |
|
|
FREC137 |
Robinia pseudoacacia |
Black Locust |
Leaf |
4-Sep-19 |
Forest |
|
C. fioriniae |
|
|
FREC138 |
Robinia pseudoacacia |
Black Locust |
Leaf |
4-Sep-19 |
Forest |
|
C. nymphaeae |
|
|
FREC139 |
Morus sp. |
Mulberry |
Leaf |
4-Sep-19 |
Fence row |
|
C. sp.indet.C |
|
|
FREC140 |
Morus sp. |
Mulberry |
Leaf |
4-Sep-19 |
Fence row |
|
C. sp.indet.C |
|
|
FREC141 |
Castanea sp. |
Chestnut |
Leaf |
4-Sep-19 |
Forest |
|
C. fioriniae |
|
|
FREC142 |
Juglans nigra |
Black Walnut |
Leaf |
4-Sep-19 |
Fence row |
|
C. sp.indet.C |
|
|
FREC143 |
Juglans nigra |
Black Walnut |
Leaf |
4-Sep-19 |
Fence row |
|
C. fioriniae |
|
|
FREC144 |
Juglans nigra |
Black Walnut |
Leaf |
4-Sep-19 |
Fence row |
|
C. fioriniae |
|
|
FREC145 |
Salix nigra |
Black Willow |
Leaf |
4-Sep-19 |
Forest |
|
C. salicis |
|
|
FREC146 |
Salix nigra |
Black Willow |
Leaf |
4-Sep-19 |
Forest |
|
C. salicis |
|
|
FREC147 |
Elaeagnus umbellata |
Autumn Olive |
Leaf |
4-Sep-19 |
Forest |
|
C. fioriniae |
|
|
FREC148 |
Elaeagnus umbellata |
Autumn Olive |
Leaf |
4-Sep-19 |
Forest |
|
C. fioriniae |
|
|
FREC149 |
Elaeagnus umbellata |
Autumn Olive |
Leaf |
4-Sep-19 |
Forest |
|
C. fioriniae |
|
|
FREC150 |
Solanum lycopersicum |
Tomato |
Fruit |
16-Sep-19 |
Garden |
Grad house garden |
C. fioriniae |
|
|
MSF1 |
Toxicodendron radicans |
Poison Ivy |
Leaf |
12-Aug-18 |
Forest |
|
C. fioriniae |
|
|
MSF2 |
Toxicodendron radicans |
Poison Ivy |
Leaf |
12-Aug-18 |
Forest |
Koch’s Postulates performed on apple |
C. fioriniae |
|
|
MSF3 |
Toxicodendron radicans |
Poison Ivy |
Leaf |
12-Aug-18 |
Forest |
|
C. fioriniae |
|
|
MSF4 |
Toxicodendron radicans |
Poison Ivy |
Leaf |
12-Aug-18 |
Forest |
|
C. fioriniae |
|
|
MSF5 |
Toxicodendron radicans |
Poison Ivy |
Leaf |
12-Aug-18 |
Forest |
|
C. fioriniae |
|
|
MSF6 |
Toxicodendron radicans |
Poison Ivy |
Leaf |
4-Sep-19 |
Forest |
|
C. fioriniae |
|
|
MSF7 |
Toxicodendron radicans |
Poison Ivy |
Leaf |
4-Sep-19 |
Forest |
|
C. fioriniae |
|
|
MSF8 |
Quercus montana |
Chestnut Oak |
Leaf |
4-Sep-19 |
Forest |
|
C. fioriniae |
|
|
MSF9 |
Quercus montana |
Chestnut Oak |
Leaf |
4-Sep-19 |
Forest |
|
C. fioriniae |
|
|
MSF10 |
Quercus montana |
Chestnut Oak |
Leaf |
4-Sep-19 |
Forest |
|
Gnomoniopsis paraclavulata |
|
|
MSF11 |
Sassafras albidum |
Sassafras |
Leaf |
4-Sep-19 |
Forest |
|
C. fioriniae |
|
|
MSF12 |
Sassafras albidum |
Sassafras |
Leaf |
4-Sep-19 |
Forest |
|
C. fioriniae |
|
|
MSF13 |
Sassafras albidum |
Sassafras |
Leaf |
4-Sep-19 |
Forest |
|
C. fioriniae |
|
|
MSF14 |
Robinia pseudoacacia |
Black Locust |
Leaf |
4-Sep-19 |
Forest |
|
C. fioriniae |
|
|
MSF15 |
Robinia pseudoacacia |
Black Locust |
Leaf |
4-Sep-19 |
Forest |
|
C. fioriniae |
|
|
MSF16 |
Robinia pseudoacacia |
Black Locust |
Leaf |
4-Sep-19 |
Forest |
|
C. fioriniae |
|
|
MSF17 |
Quercus rubra |
Red Oak |
Leaf |
4-Sep-19 |
Forest |
|
C. fioriniae |
|
|
MSF18 |
Quercus rubra |
Red Oak |
Leaf |
4-Sep-19 |
Forest |
|
C. fioriniae |
|
|
MSF19 |
Quercus rubra |
Red Oak |
Leaf |
4-Sep-19 |
Forest |
|
C. fioriniae |
|
|
MSF20 |
Quercus alba |
White Oak |
Leaf |
4-Sep-19 |
Forest |
|
Gnomoniopsis paraclavulata |
|
|
MSF21 |
Quercus alba |
White Oak |
Leaf |
4-Sep-19 |
Forest |
|
Gnomoniopsis paraclavulata |
|
|
MSF22 |
Nyssa sylvatica |
Black Gum |
Leaf |
4-Sep-19 |
Forest |
|
C. fioriniae |
|
|
MSF23 |
Nyssa sylvatica |
Black Gum |
Leaf |
4-Sep-19 |
Forest |
|
C. fioriniae |
|
|
MSF24 |
Nyssa sylvatica |
Black Gum |
Leaf |
4-Sep-19 |
Forest |
|
C. fioriniae |
|
|
MSF25 |
Betula lenta |
Black Birch |
Leaf |
4-Sep-19 |
Forest |
|
C. fioriniae |
|
|
MSF26 |
Betula lenta |
Black Birch |
Leaf |
4-Sep-19 |
Forest |
|
C. fioriniae |
|
|
MSF27 |
Prunus serotina |
Black Cherry |
Leaf |
4-Sep-19 |
Forest |
|
C. fioriniae |
|
|
MSF28 |
Vitis sp. |
Wild Grape |
Leaf |
4-Sep-19 |
Forest |
|
C. fioriniae |
|
|
MSF29 |
Vitis sp. |
Wild Grape |
Leaf |
4-Sep-19 |
Forest |
|
C. fioriniae |
|
|
MSF30 |
Prunus serotina |
Black Cherry |
Leaf |
4-Sep-19 |
Forest |
|
C. fioriniae |
|
|
MSF31 |
Prunus serotina |
Black Cherry |
Leaf |
4-Sep-19 |
Forest |
|
C. fioriniae |
|
|
MSF32 |
Populus tremuloides |
Quaking Aspen |
Leaf |
4-Sep-19 |
Forest |
|
C. nymphaeae |
|
|
MSF33 |
Populus tremuloides |
Quaking Aspen |
Leaf |
4-Sep-19 |
Forest |
|
C. fioriniae |
|
|
MSF34 |
Populus tremuloides |
Quaking Aspen |
Leaf |
4-Sep-19 |
Forest |
|
C. fioriniae |
|
|
MSF35 |
Populus tremuloides |
Quaking Aspen |
Leaf |
4-Sep-19 |
Forest |
Black spore tendrils |
Diaporthe sp. |
|
|
MSF36 |
Liriodendron tulipifera |
Tulip Popular |
Leaf |
4-Sep-19 |
Forest |
|
C. fioriniae |
|
|
MSF37 |
Liriodendron tulipifera |
Tulip Popular |
Leaf |
4-Sep-19 |
Forest |
|
C. fioriniae |
|
|
MSF38 |
Juglans nigra |
Black Walnut |
Leaf |
4-Sep-19 |
Forest |
Black spore tendrils |
Pestalotiopsis sp. |
|
|
MSF39 |
Juglans nigra |
Black Walnut |
Leaf |
4-Sep-19 |
Forest |
|
C. fioriniae |
|
|
MSF40 |
Juglans nigra |
Black Walnut |
Leaf |
4-Sep-19 |
Forest |
|
C. fioriniae |
|
|
MSF41 |
Juglans nigra |
Black Walnut |
Leaf |
4-Sep-19 |
Forest |
|
C. fioriniae |
|
|
MSF42 |
Lonicera maackii |
Amur Honeysuckle |
Leaf |
4-Sep-19 |
Forest |
|
C. fioriniae |
|
|
MSF43 |
Lonicera maackii |
Amur Honeysuckle |
Leaf |
4-Sep-19 |
Forest |
|
C. fioriniae |
|
|
MSF44 |
Lonicera maackii |
Amur Honeysuckle |
Leaf |
4-Sep-19 |
Forest |
|
C. fioriniae |
|

To confirm identity to species, a subset of 13 C. fioriniae isolates, both C. nymphaea isolates, both C. salix isolates and 2 isolates that resemble C. aenigma, along with isolates from fruit and reference isolates from other studies were chosen for multilocus sequence analysis using additional 4 to 7 genes. For isolates in the C. acutatum species complex the genes were Tub2, calmodulin, and GS using primers T1 5’AACATGCGTGAGATTGTAAGT’3 (O’Donnell & Cigelnik 1997) and TubR1 5’-TTCTGGACGTTGCGCATCTG-’3 (Hu et al. 2015), CL1C 5’-GAATTCAAGGAGGCCTTCTC-’3 and CL2C 5’-CTTCTGCATCATGAGCTGGAC-’3 (Weir et al. 2012), and GSF1 5’-ATGGCCGAGTACATCTGG-’3 and GSR1 5’-GAACCGTCGAAGTTCCAGGAA-’3 (Stephenson et al. 1997) respectively. For isolates in the C. gloeosporioides species complex the additional genes ApMat and APN2 were used with primers CgDL_F6 5’-AGTGGAGGTGCGGGACGTT-’3 and CgMAT1_F2 5’-TGATGTATCCCGACTACCG-’3, and ColDL-F3 5’-GGGAGAAGCGAACATACCA-’3 and CgDL-R1 5’-GCCCGACGAGCAGAGGACGTAGTC-’3, respectively (Rojas et al. 2010). For a few unresolved isolates the actin gene was also sequenced using primers Act512F 5’-ATGTGCAAGGCCGGTTTCGC-’3 and Act783R 5’-TACGAGTCCTTCTGGCCCAT-’3 (Carbone & Kohn 1999).
PCR conditions were denaturation at 94C for 5 min followed by 35 cycles of denaturation at 94C for 30s, annealing at 55C for all genes except APN2 and Actin (58C) for 30s, elongation at 72C for 30s for GAPDH, 45s for Actin, 60s for calmodulin, GS, and ITS, 80s for ApMat, and 120s for Tub2, with a final elongation of 72C for 7 min. The PCR product was purified and sequenced by Eurofins Genomics (Louisville, KY). DNA sequences were concatenated with CodonCode Aligner 7.0 (Centerville MA), aligned with MEGA (Kumar et al. 2018), manually checked for accuracy, and trimmed to uniform lengths. Individual genes were BLAST searched on GenBank to match with previously described species, sequences of the type strains were added to the DNA alignments. A maximum parsimony phylogeny of concatenated genes was created with PAUP version 4 (Swofford 2003) using heuristic search, keeping optimal trees only, starting trees for branch swapping by stepwise addition and swapping on best only, using random stepwise addition with 10 reps, 0 seed, and holding 1 tree at each step, and branch swapping with the TBR algorithm using a reconnection limit of 8 and swapping on best trees only, followed by a bootstrap analysis to 1,000 replicates.
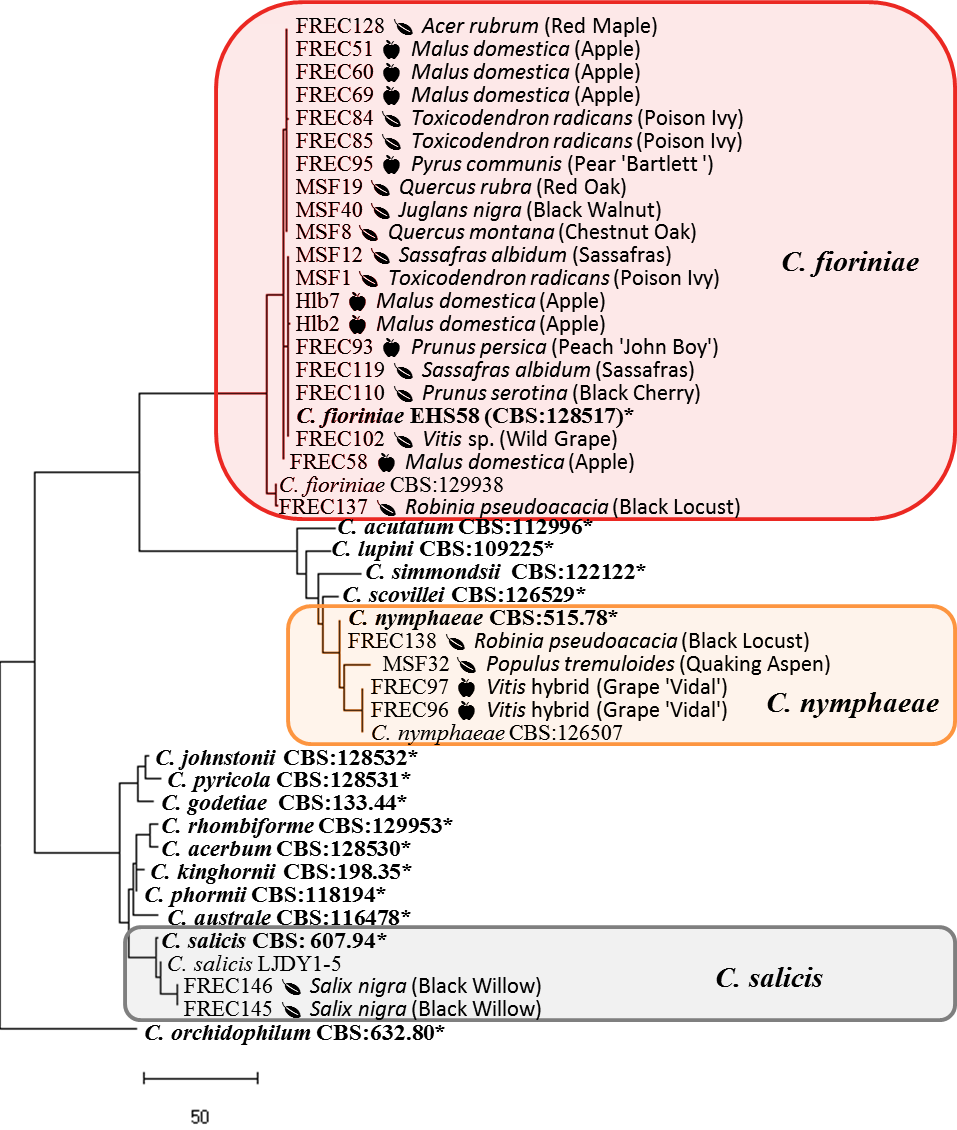
The phylogeny of the isolates in the C. acutatum species complex showed that the C. fioriniae and C. nymphaeae isolates from plant leaves are indistinguishable from those isolates from fruits, in some cases having 100% sequence identity across the 4 genes (figure 9). Isolates FREC145 and FREC146, while genetically distinct, were closest to C. salix. Isolates FREC139 and FREC142 grouped with and yet remained distinct from a clade that contained C. aenigma, C. hebeiense, and C. conoides (data not shown). BLAST search of each gene found 100% identity at the GAPDH loci to unidentified isolate CT03 from Peony leaves (Garfinkel & Chastagner 2018) and at the ApMat and APN2 loci to unidentified isolate Coll887 from diseased cranberry fruit (Doyle et al. 2013). Doyle et al. 2013 designated Coll887 as C. sp.indet.C., so we designated our matching species likewise.
To evaluate the ability of these isolates to cause bitter rot in apple, Koch’s postulates were performed on 7 C. fioriniae isolates that had previously been isolated from the fruits of grape, peach, and pear, and from the leaves of Amur honeysuckle, poison ivy (from both FREC and MSF) and wild grape. ‘Golden Delicious’ apples were surface disinfested by spraying with 70% ethanol and air drying, a ~5x5 mm wound was made in the surface of the apple at its equator, mycelial plugs of the isolates were placed in the wound, and incubated for 2 weeks at 25°C and 24 hour photoperiod. Lesions were measured and photographed, and fungal colonies were isolated from the outer edge of the lesion. The fungal colonies were identified to species by sequencing of the intron in the GAPDH gene as described above.
After wound inoculation the 7 C. fioriniae isolates all created typical bitter rot symptoms in the ‘Golden Delicious’ apples. The fungi isolated from the edge of the necrotic lesion resembled C. fioriniae in culture, and DNA extraction and amplification of the GAPDH gene showed 100% sequence identity to the original isolates.
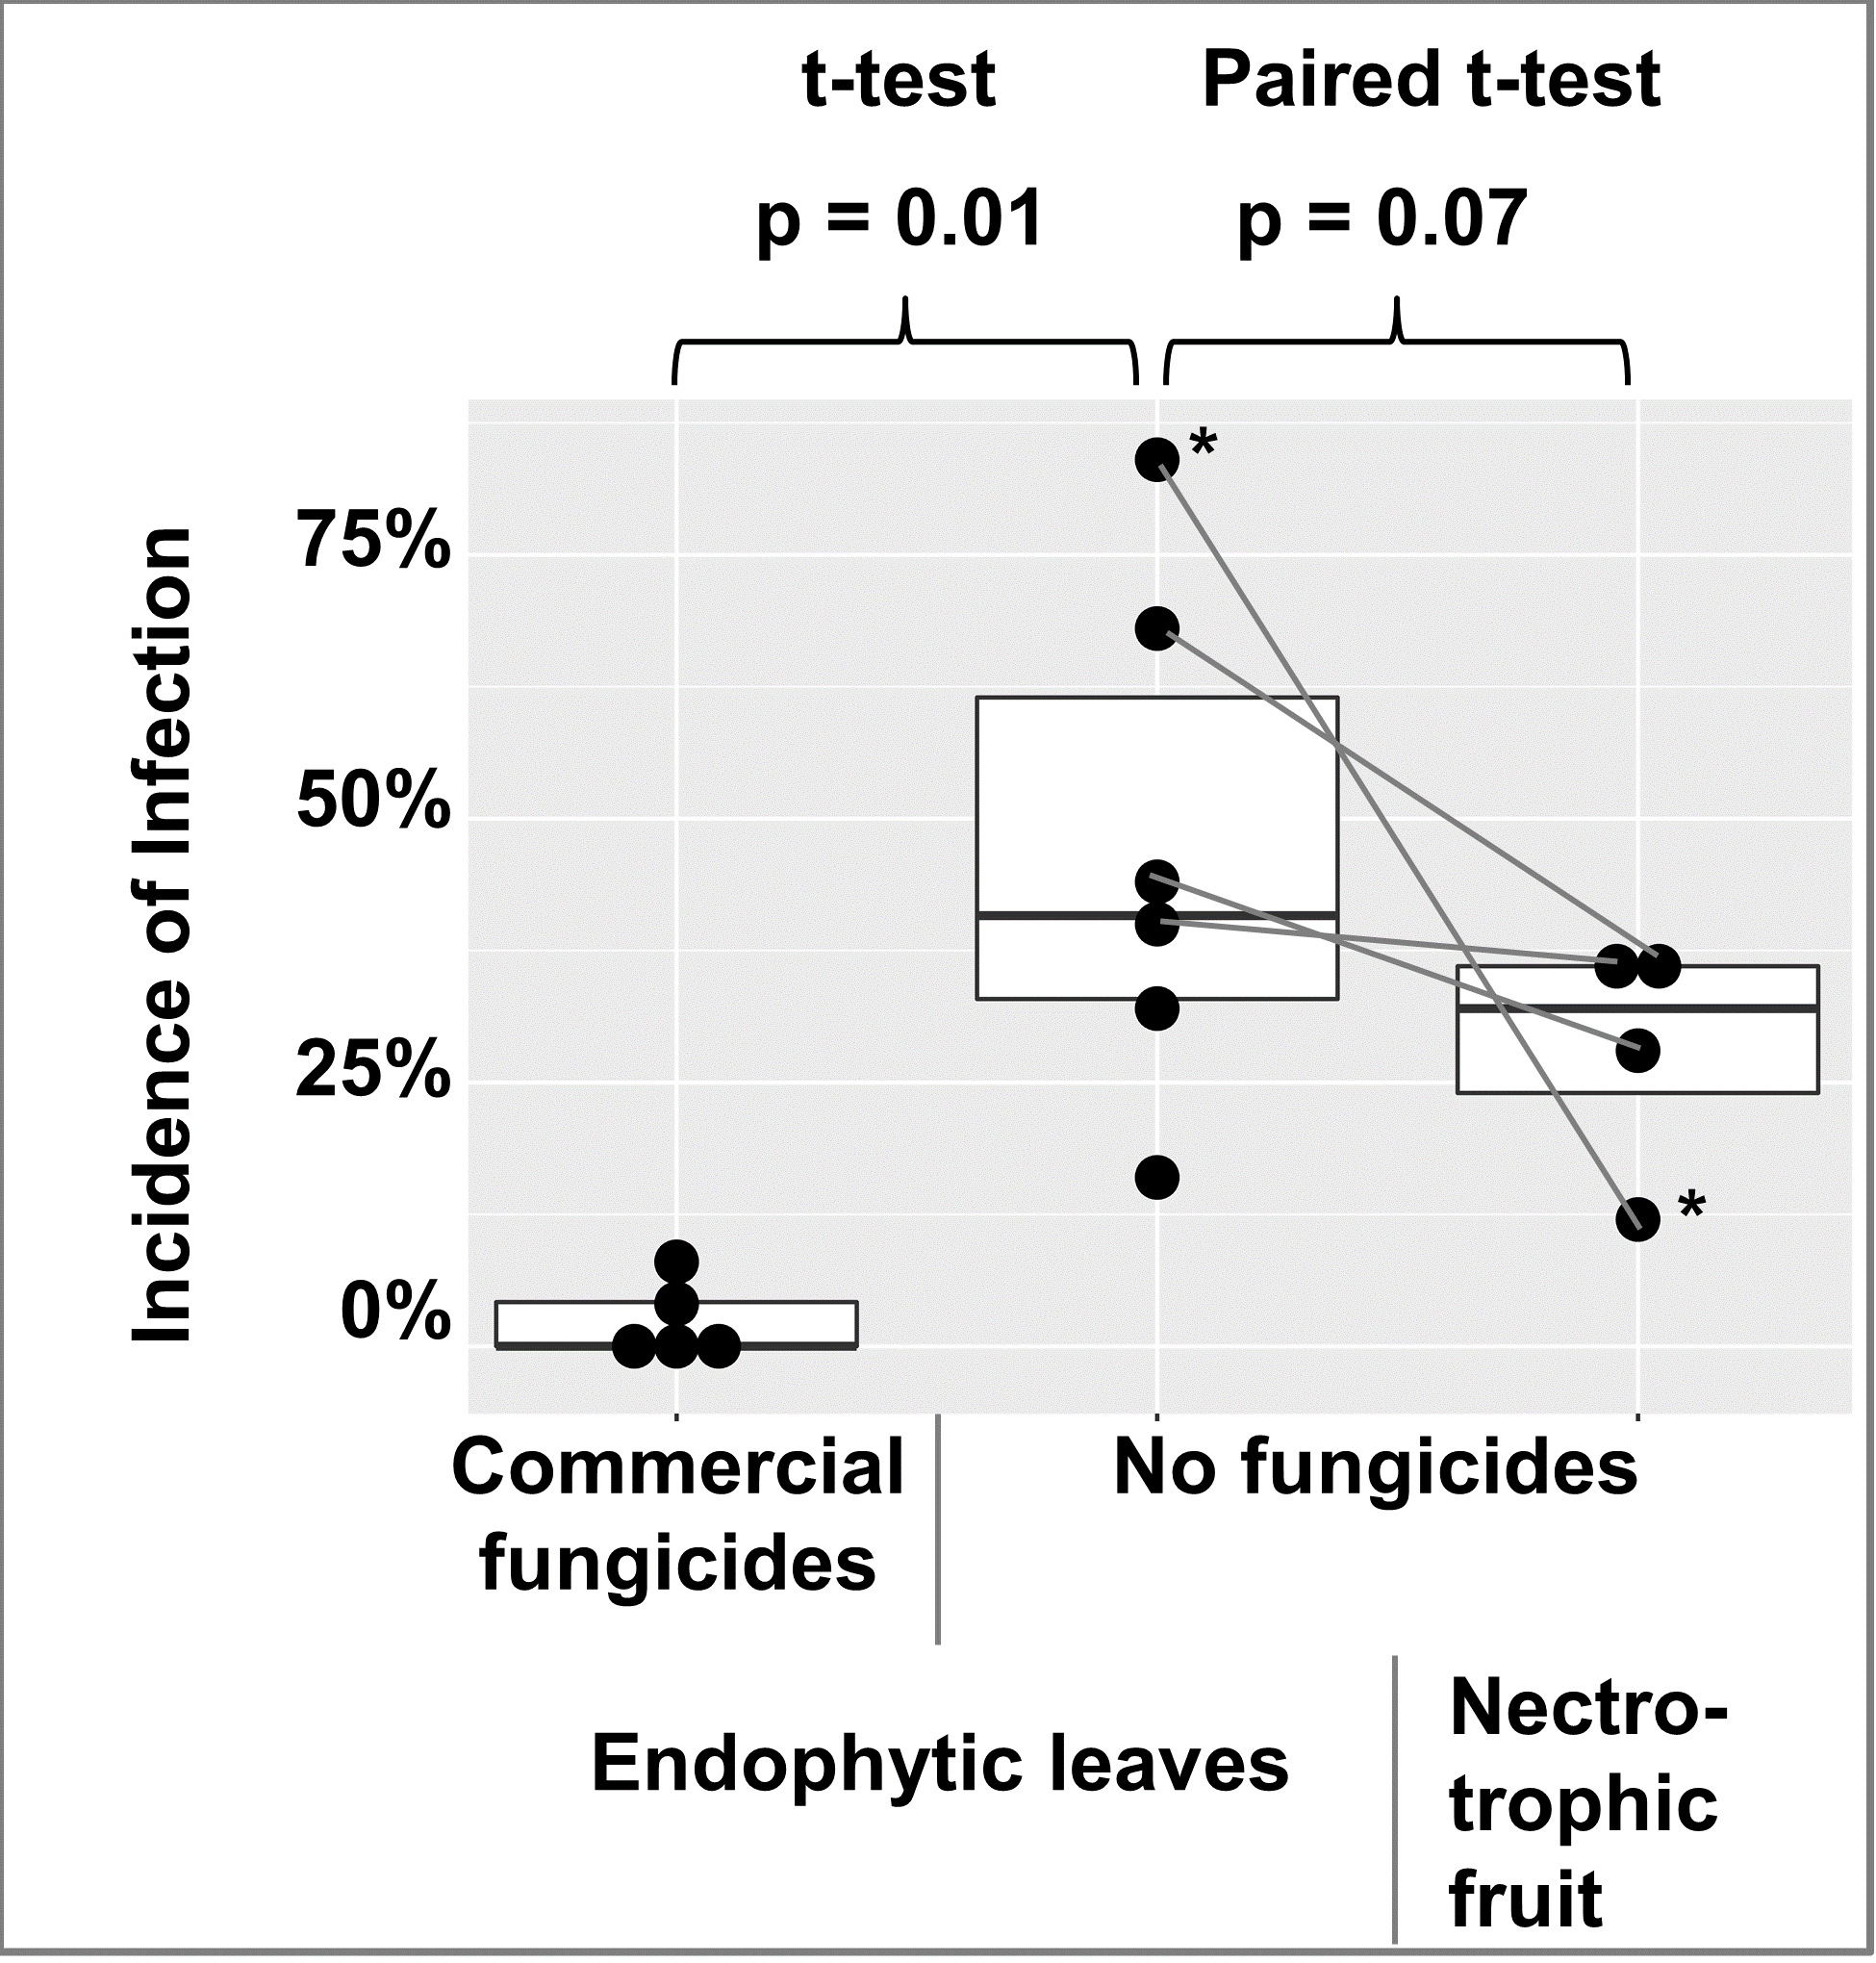
To check for the abundance of endophytic infections in apple leaves, leaves were collected from 2 commercially fungicide treated trees and 1 untreated tree in 2018, and 3 commercially fungicide treated trees and 5 untreated trees in 2019. A few leaves of trees with fungicide treatments had endophytic infections, while endophytic infections were abundant in leaves of untreated trees (Figure 10). For 4 of the untreated trees in 2019, bitter rot incidence was obtained from 25 randomly selected apples at harvest and one month post-harvest and recorded as cumulative incidence. When compared with Student’s t-test, fungicide vs. non-fungicide treated leaves were different at p = 0.01, and a paired t-test of the 4 trees with both leaf and fruit data were different at p = 0.07 (figure 10).
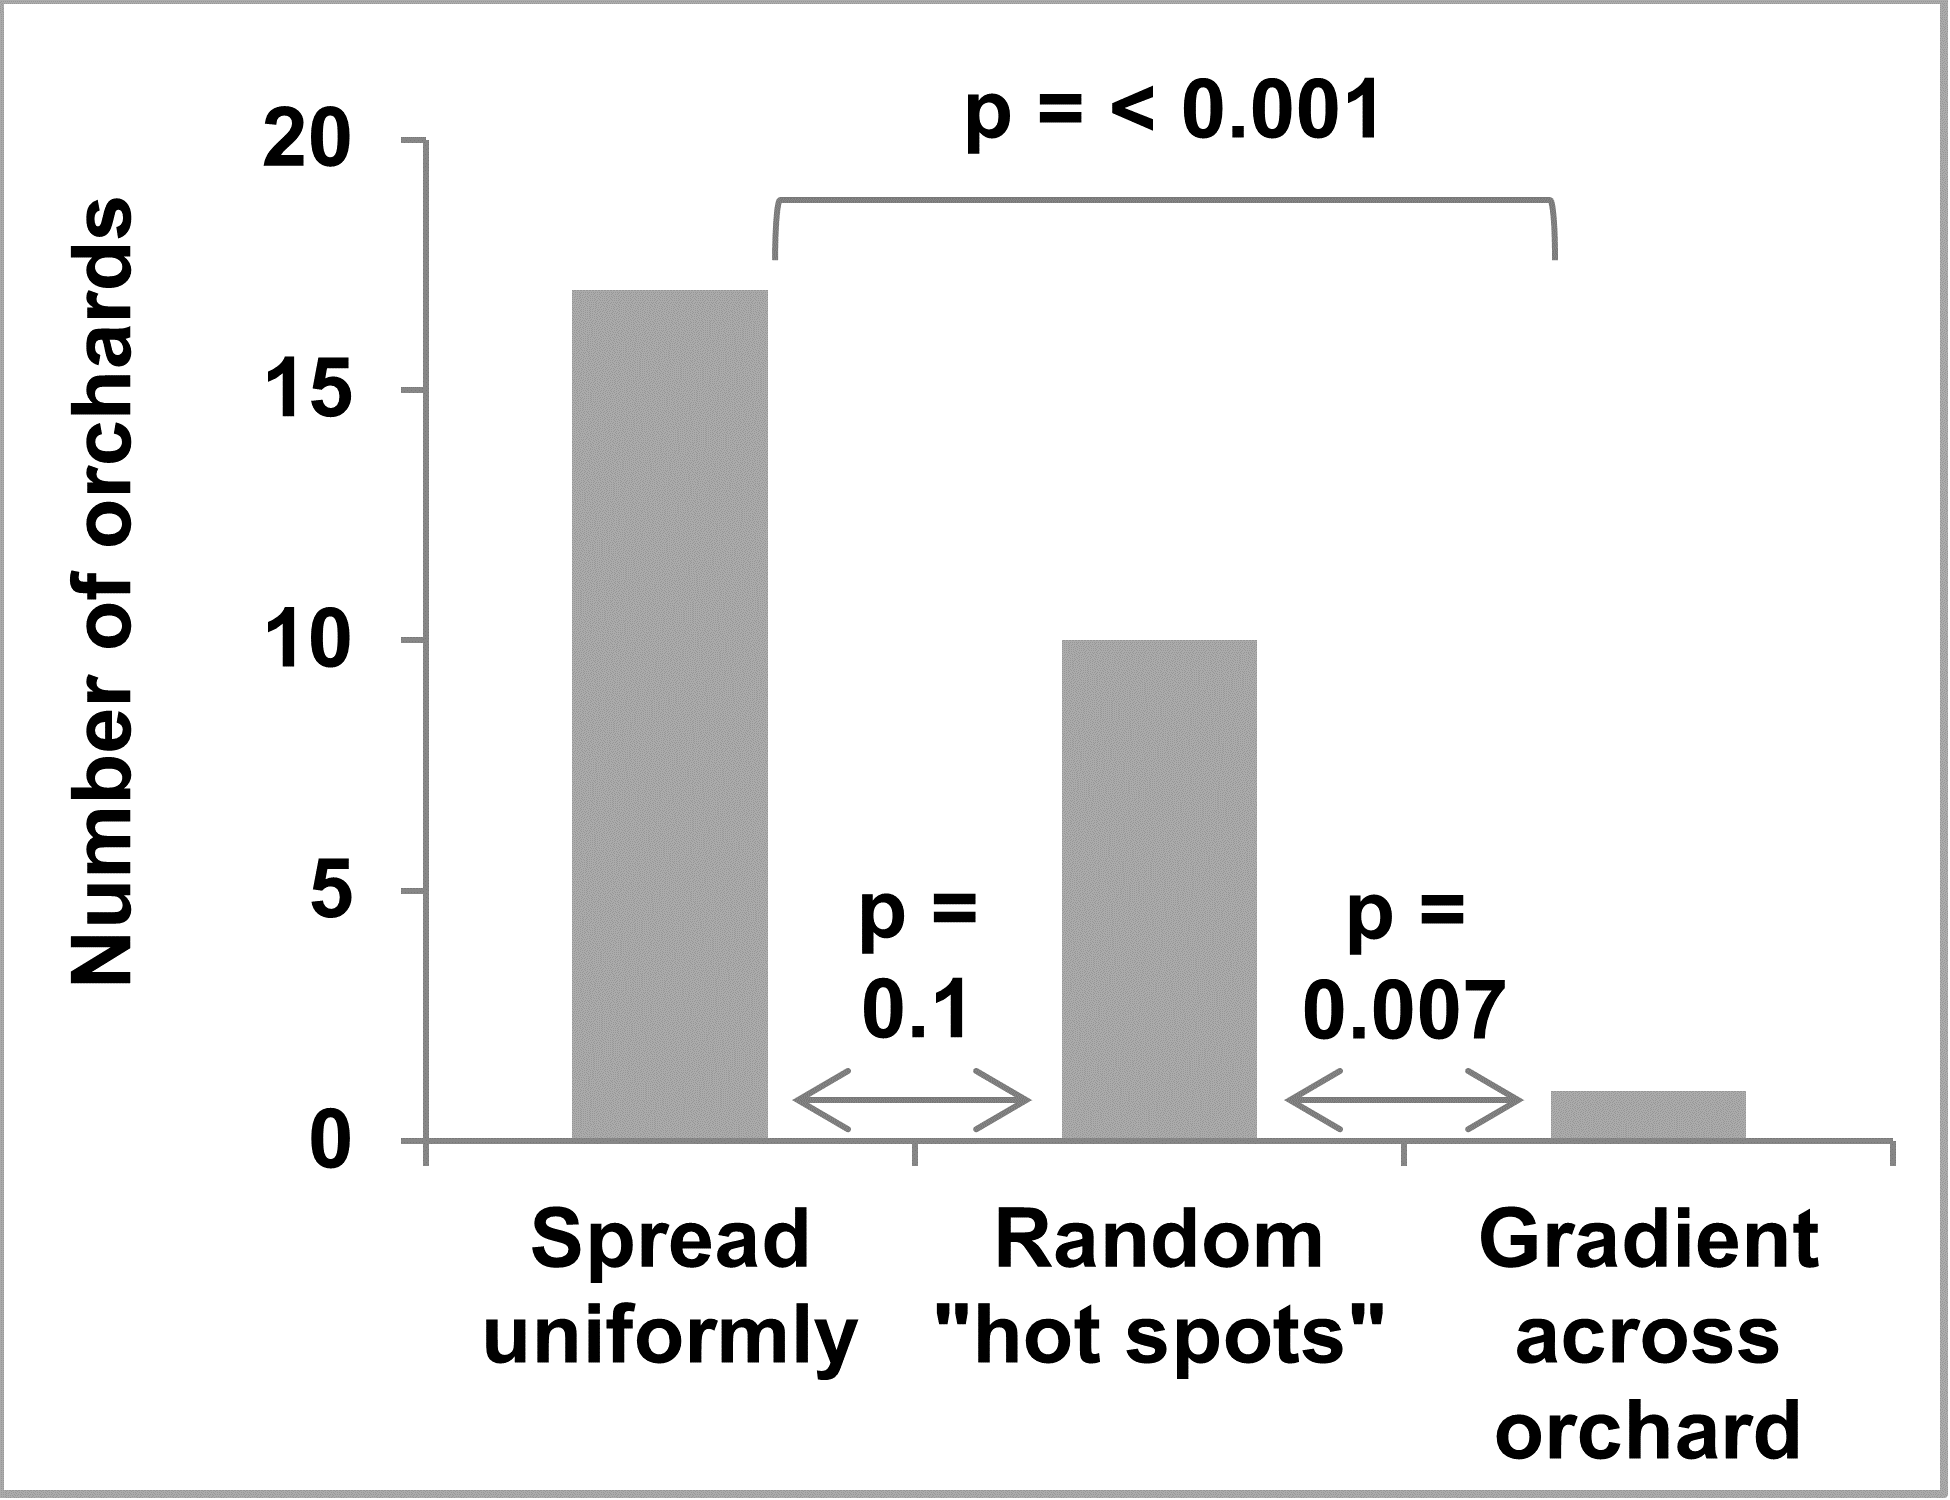
These results indicate that the C. fioriniae strains that are common as leaf endophytes are identical to the C. fioriniae strains that are causing bitter rot of apple. This raises the question of whether forests and/or fence rows adjacent to orchards are sources of inoculum in orchards. If this were the case, we hypothesized that bitter rot incidence would be higher in the area of the orchard closest to the forest, with decreasing bitter rot incidence farther away. While we did not test this directly on the research farm, we surveyed apple growers, asking them about the patterns of bitter they see in their orchards. The grower survey was distributed in 2019 to apple growers through email, and in paper form at Penn State winter tree fruit meetings. Participants were asked to check a box if any forest or fence-row tree were growing within 1,000 feet of their apple orchard and if the pattern of bitter rot in orchards was uniformly distributed, a gradient, or in random “hot spots”.
Of the 27 apple growers that filled out the survey on bitter rot distribution, 16 reported having forest and/or fence row trees within 1,000 feet of their orchard. A clear majority report bitter rot was either uniformly distributed or in “hot spots” with only one reporting a gradient across the orchard (Figure 11). The grower that reported a gradient also checked the boxes for uniformly distributed and “hot spots” and did not report forest and/or fence row trees within 1,000 feet of the orchard.
Given the evidence discussed above, we propose an infection cycle for C. fioriniae in the forest (Figure 12). It assumes that reproduction is dominated by asexually produced, rains-plashed conidia. Endophytic infections in leaves are hypothesized to be the main site for infections throughout the growing season. In fruit bearing plants, maturing infected fruits are also a factor. Buds, fruit mummies, fruit scars, and cankers serving as overwintering sites. This infection cycle is similar to previously published infection cycles (Everett et al. 2018) but with a greater emphasis on endophytic infections in leaves. It is also an infection cycle and not necessarily a disease cycle, only becoming a disease cycle on plants that are stressed or have susceptible fruits.
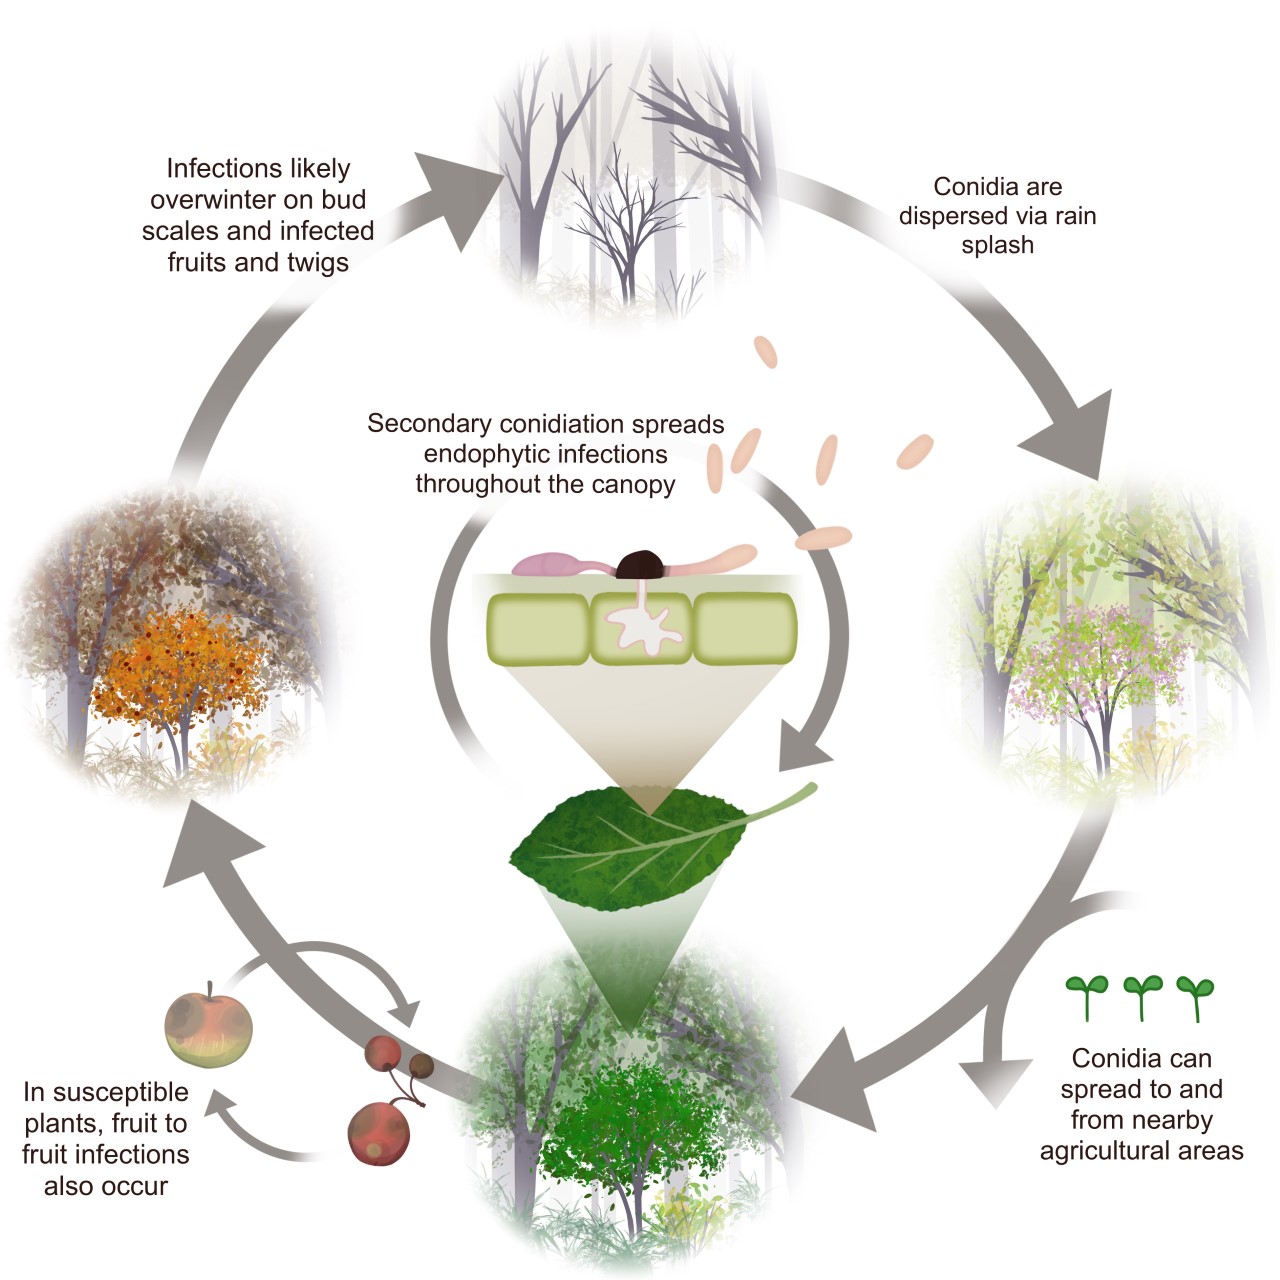
This hypothesized infection cycle has several implications for C. fioriniae as a plant pathogen. Since it is endemic in the forest canopy, eradication from nearby areas would be impractical. However, the spatial limitations of rain-splash dispersal mean that forests are not regular sources of inoculum and likely only serve as initial inoculum sources during extreme rain and wind events, after which C. fioriniae becomes established in the agricultural area. This also lessens the risk of spreading fungicide resistance, since the source of inoculum is from non-fungicide treated areas. The abundance of endophytic leaf infections on agricultural plants means that eliminating weeds as potential inoculum sources may have minimal effect, since most of the inoculum is coming from endophytic infection in the host plant itself. There could be a potential for early season fungicide applications to reduce the amount of endophytic leaf infections as a way to reduce inoculum throughout the season. Finally, given that C. fioriniae is an endophyte on many plants for which is has not been identified as a pathogen, it appears that genetic resistance to necrotrophic infections is widespread, and that breeding for genetic resistance in agricultural plants may be the best long-term management strategy.
It should be reiterated that the proposed infection cycle is a hypothesis, to be tested and adjusted as more research results become available. The results presented in this research inform our management of C. fioriniae as a plant pathogen, and our understanding of its ecological role in forests. It adds to the growing body of evidence that the main ecological role of C. fioriniae is as a leaf endophyte of numerous broadleaf plants.
Detect the timing and incidence of dormant infections in apples using the freezing method.
Incidence of infection and bitter rot in 2019 was low overall, with no clearly defined period during which apples were resistant to infection (Figure 13). In 2020 only Captan was applied as a protectant fungicide instead of both Captan and Mancozeb as in 2019, and bitter rot incidence was higher overall, although final bitter rot incidence was still below 20% in all treatments (Figure 13). The results from this two-year study suggested there might be slight differences in apple susceptibility to bitter rot throughout the season, but that there is no period during which apples are resistant. Consequently, growers have to remain vigilant and apply fungicides to highly susceptible cultivars throughout the growing season, especially during warm wet weather.
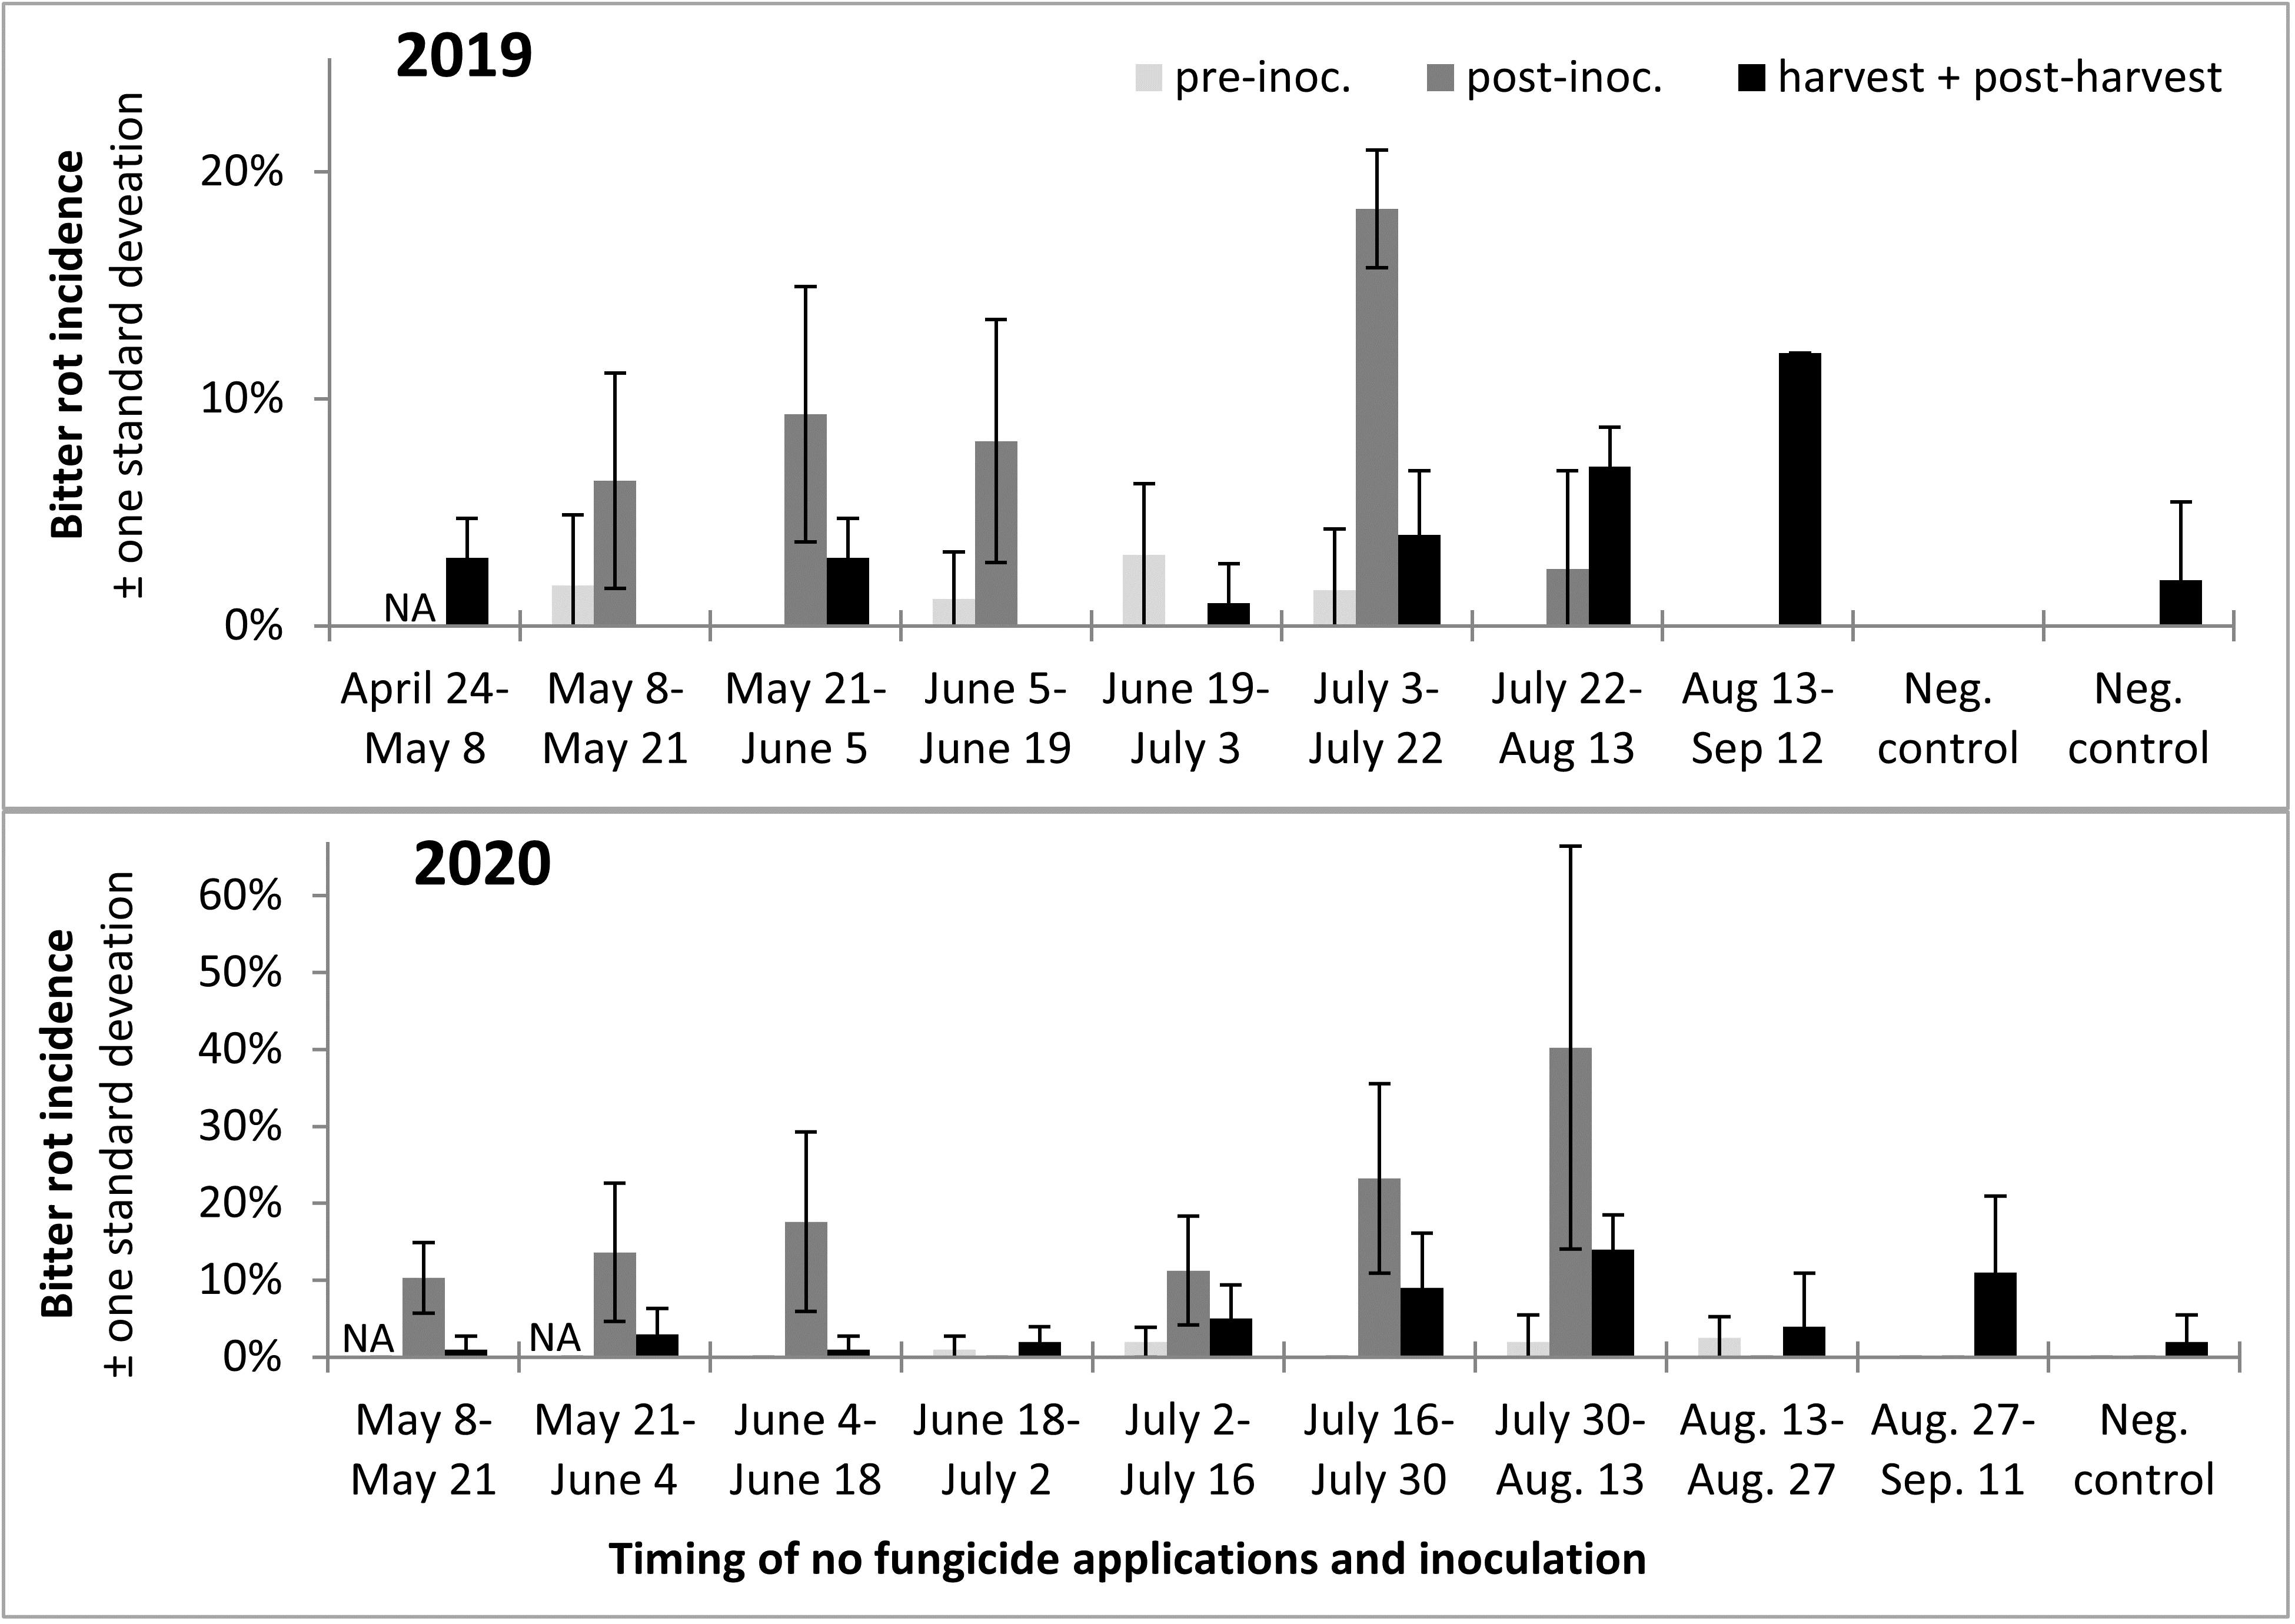
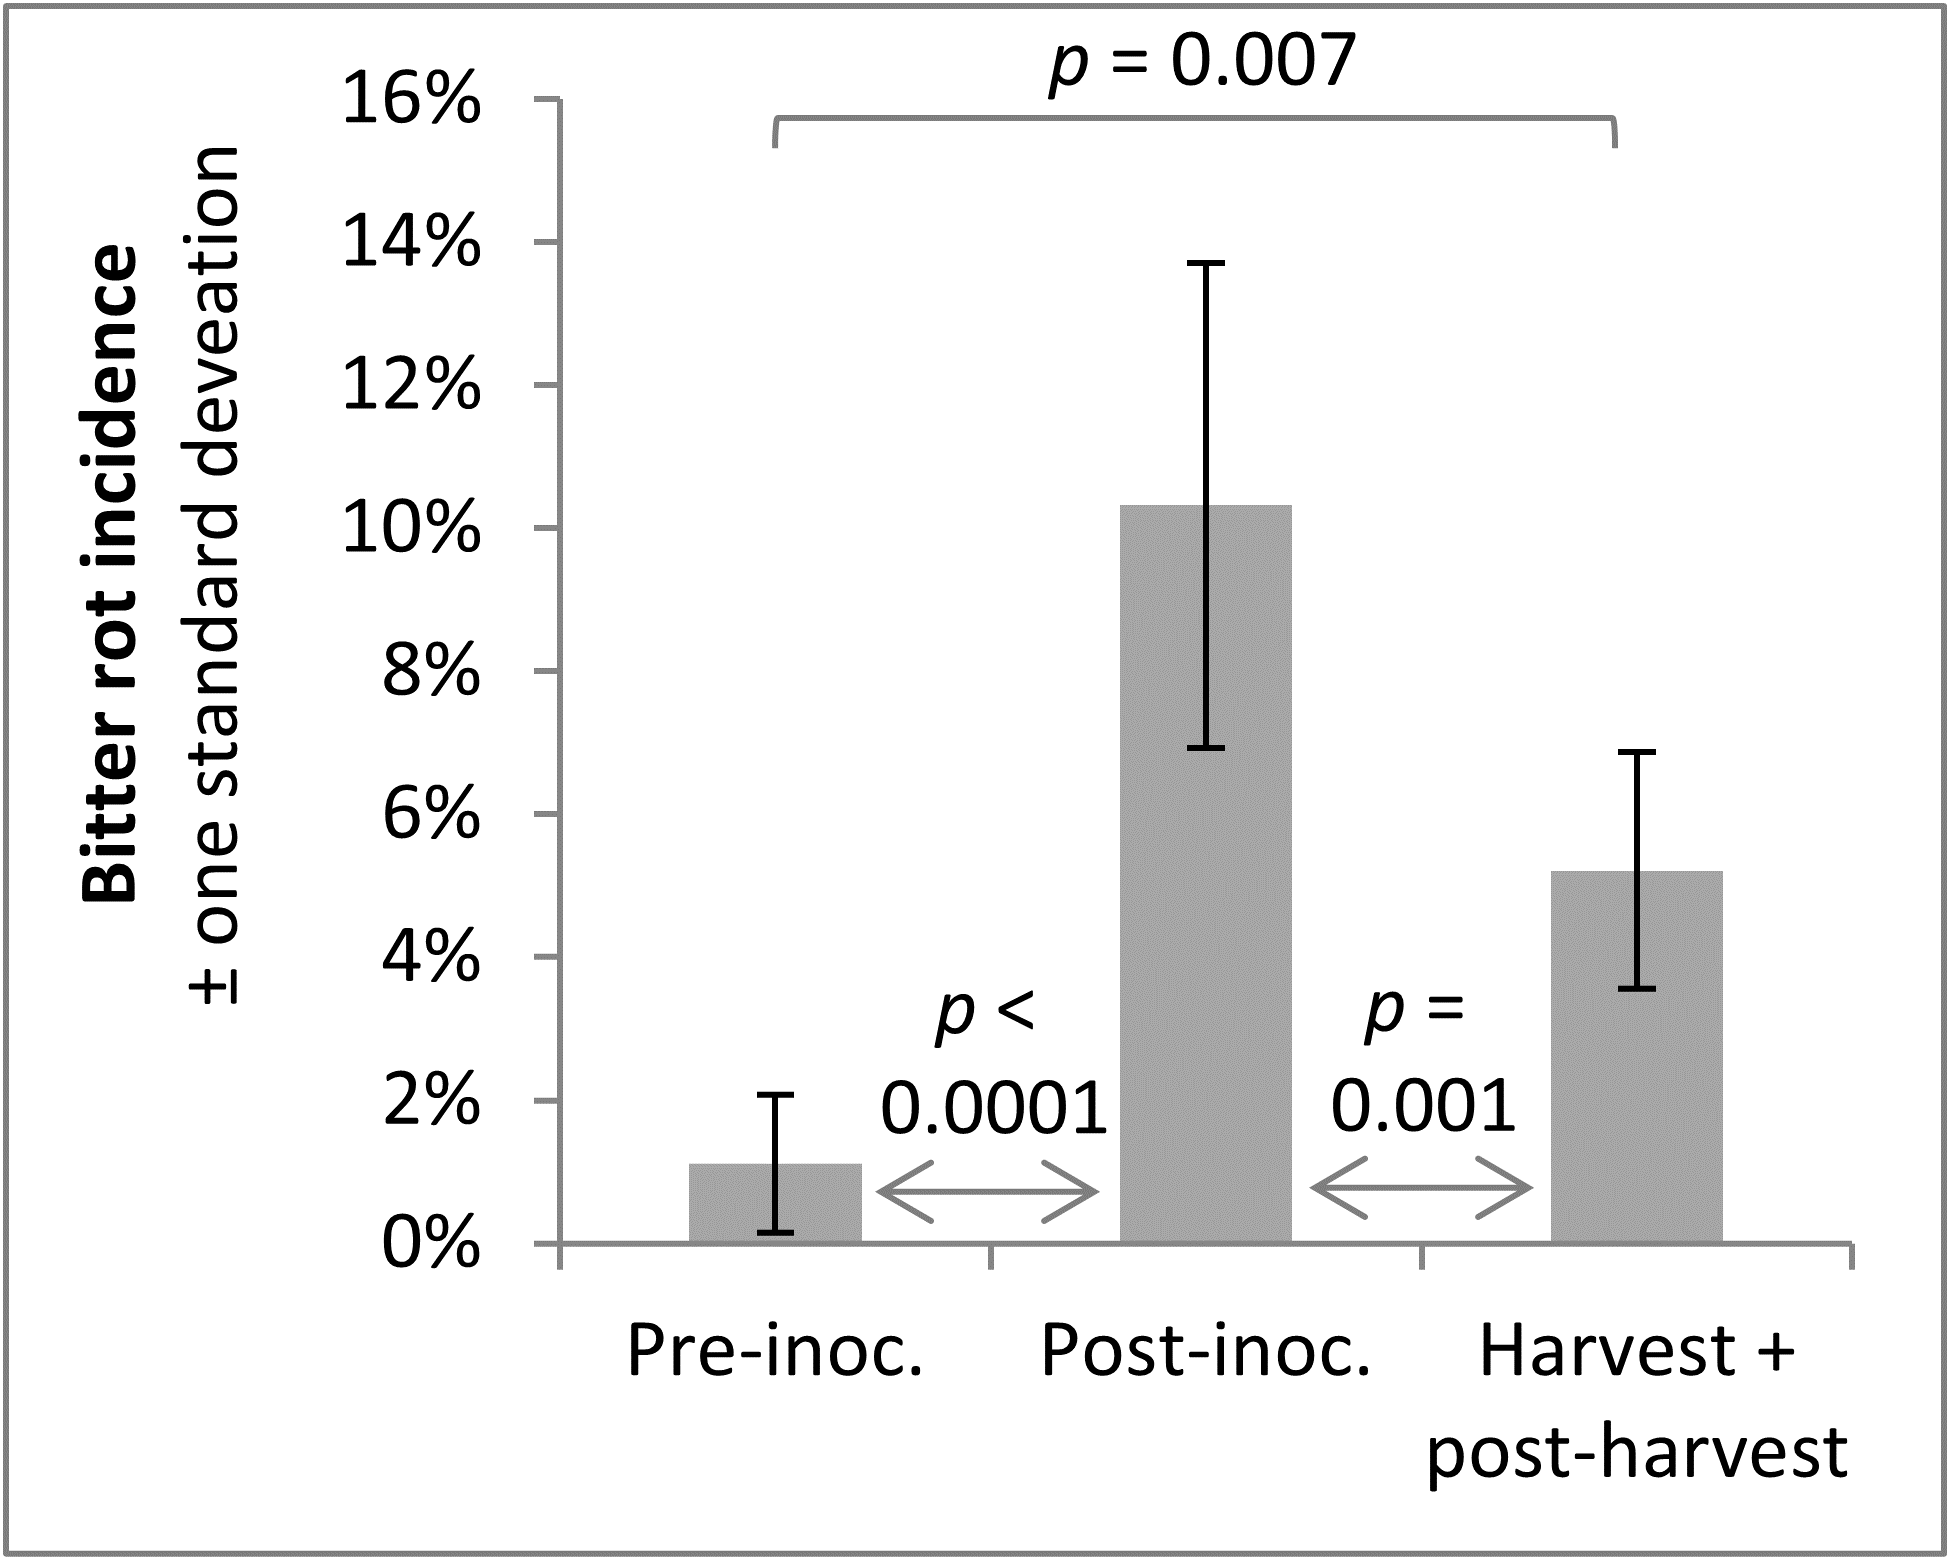
A trend observed across both years was that infections were higher after the infection period, which was to be expected, and that bitter rot at and after harvest was lower than the incidence of infections after the infection period, which indicated that not all infections during the summer persist until harvest and cause bitter rot. A statistical comparison of combined 2019 and 2020 data was performed with ANOVA and a Tukey HSD test, not including the first two treatments of the season as those did not have pre-inoculation data or the negative controls which did not have an infection period. The results showed an increase of infection after the infection period (p < 0.0001), and a subsequent decrease from immediately after the infection period to final bitter rot incidence (Figure 14). The importance of this is not immediately obvious, but could be used to guide future research into practices that decrease the number of infections that persist to harvest. This decrease is unlikely to have come from post-infection period applications of fungicides, as the fungicides Mancozeb and Captan are strictly surface contact fungicides with no systemic activity.
2. Track persistence of Colletotrichum (bitter rot fungi) and microbial succession in infected apples on the orchard floor.
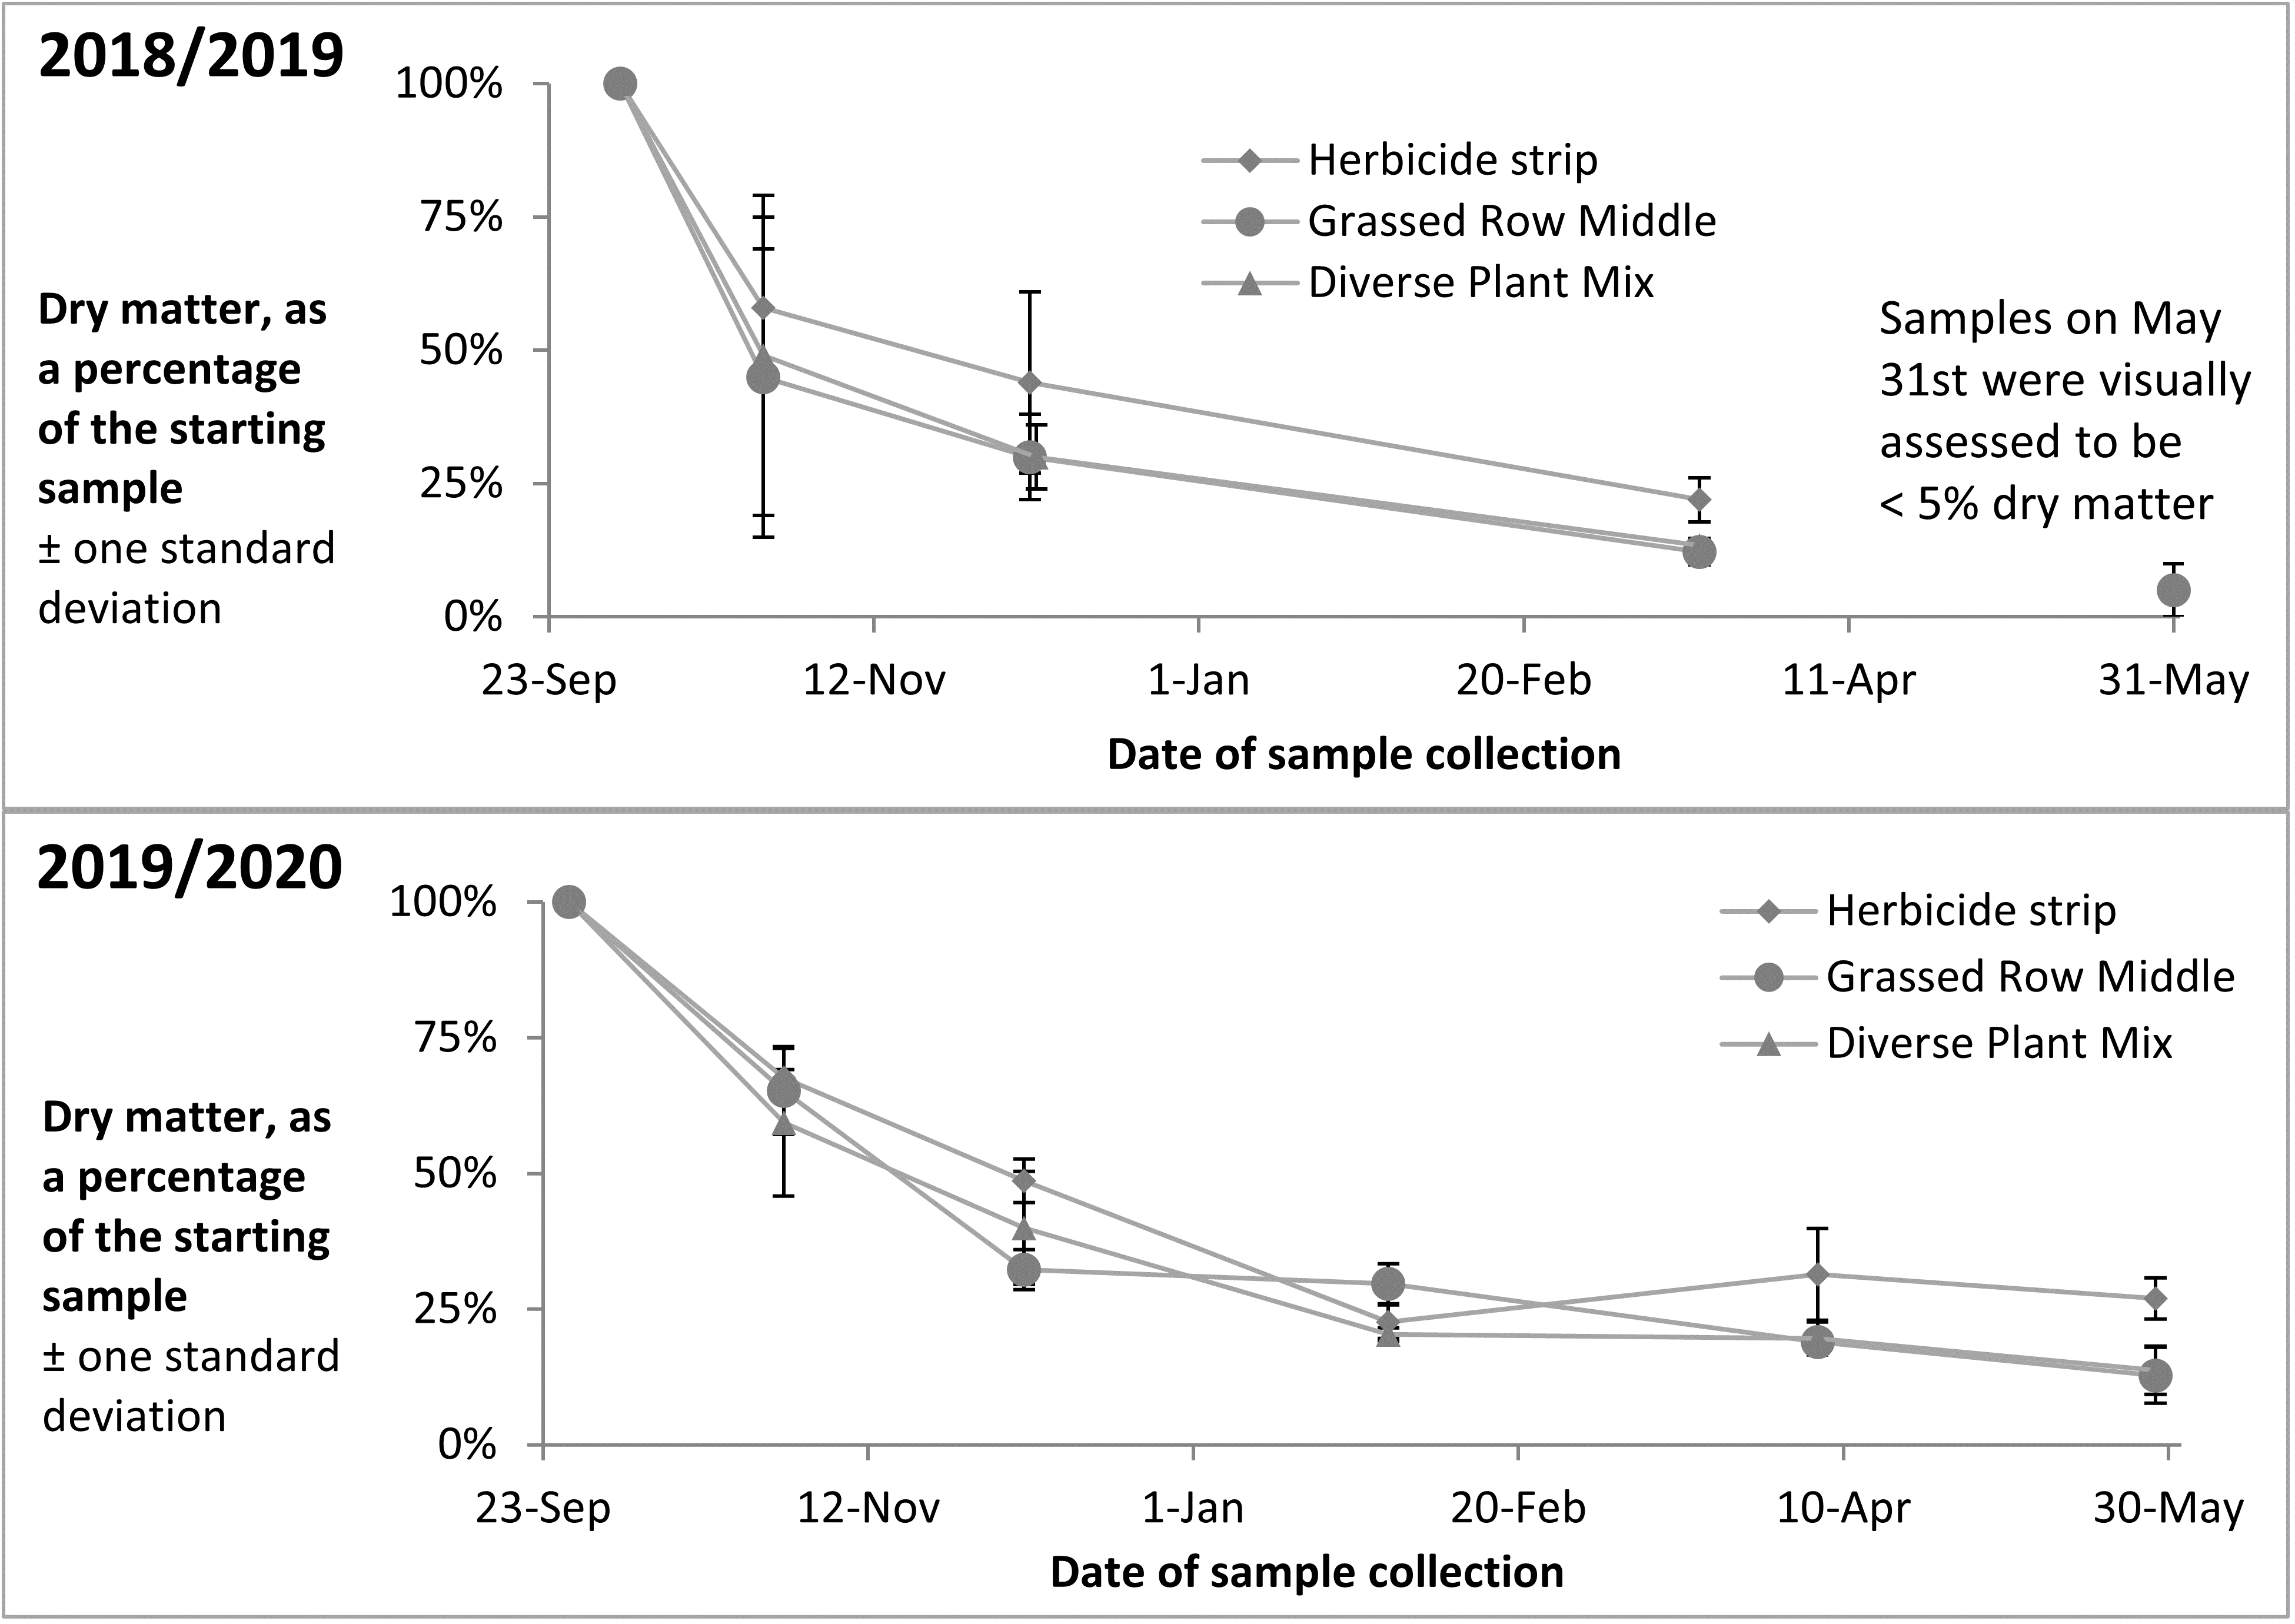
Apples with bitter rot were placed out in the orchard in the fall of 2018 and 3 sample collections were taken of the rotting apples between October and March. The apples were almost completely degraded by May and no collection was taken that month. Apples with bitter rot were again placed out in the orchard in the fall of 2019, and 5 sample collections have been taken of the rotting apples between October and May. Percent dry matter of the samples across both years showed an initial rapid decrease in the fall after apples were placed on the ground, with slower decreases over the colder winter months (Figure 15).
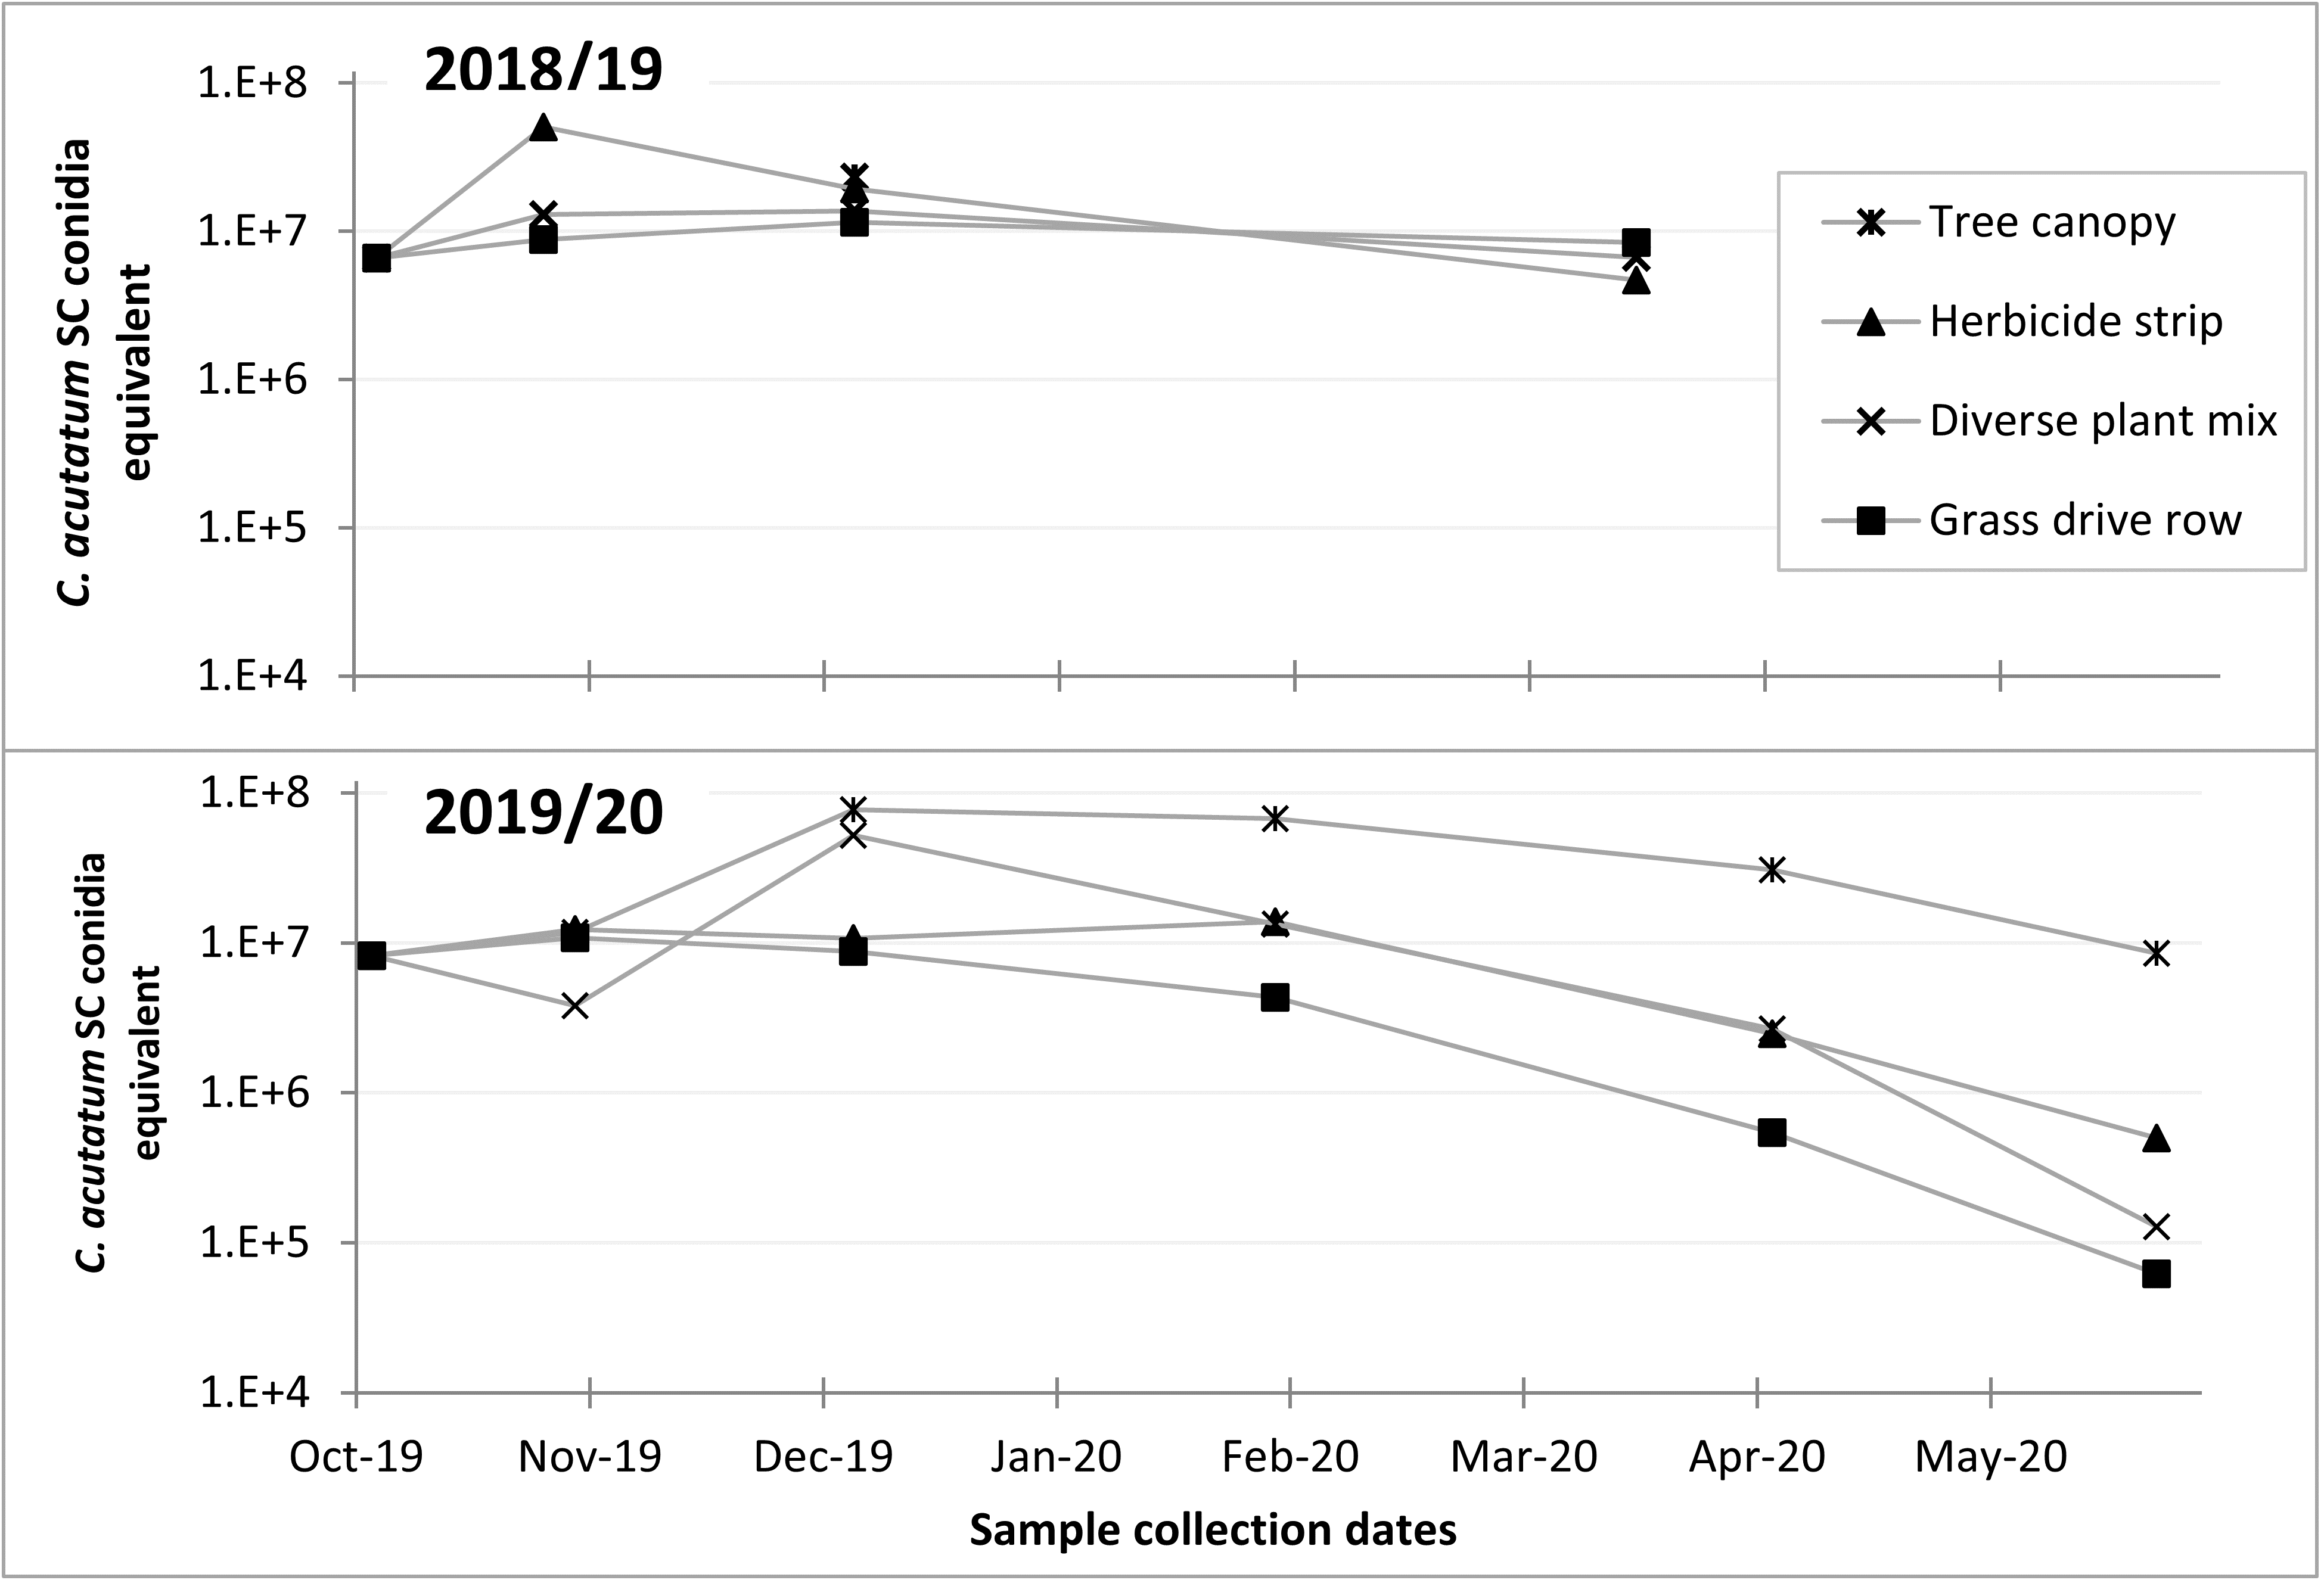
Q-PCR tests of DNA extracted from the 2018/19 samples showed little decrease in total C. fioriniae DNA in decaying apples from October to March (Figure 16). The 2019/2020 samples included samples from apples with bitter rot in the tree canopy, which showed increases in C. fioriniae DNA as the rot spread through the apple with subsequent decreases from February to May (Figure 16). The other samples showed decreases in total C. fioriniae DNA in the period from February to May (Figure 16). These results demonstrated a decrease in C. fioriniae DNA as the apples decayed, as was expected, but also showed that apples on the ground the following spring still contained C. fioriniae DNA, albeit at much lower concentrations than in the fall. Whether this C. fioriniae DNA came from C. fioriniae that was still alive, or whether successional microbes had outcompeted and killed C. fioriniae and the DNA was simply residual DNA that had not yet degraded is not known. Given the abundance of C. fioriniae detected in spore traps in the spring, as shown in the previous section, it is possible that some of the C. fioriniae DNA detected in the decayed apples collected in the spring was not from the apple itself, but splashed onto the apple surface from above. Visual observations of the decayed apples revealed no orange spore masses indicative of C. fioriniae.
Metagenomic amplicon DNA sequencing of the fungal ITS1 barcoding region showed relatively high levels of Colletotrichum DNA in the initial samples, as was expected (Figure 17). The remaining fungi in the initial samples would have been mostly on the apple surface, as those apples were only starting to decay at that point. Subsequent samples show a rapid drop in the relative amounts of Colletotrichum DNA and rapid increases in other fungi, with spring collected samples from apples that were on the ground showing no Colletotrichum, while Colletotrichum persisted into the spring in samples from the tree canopy (Figure 17).
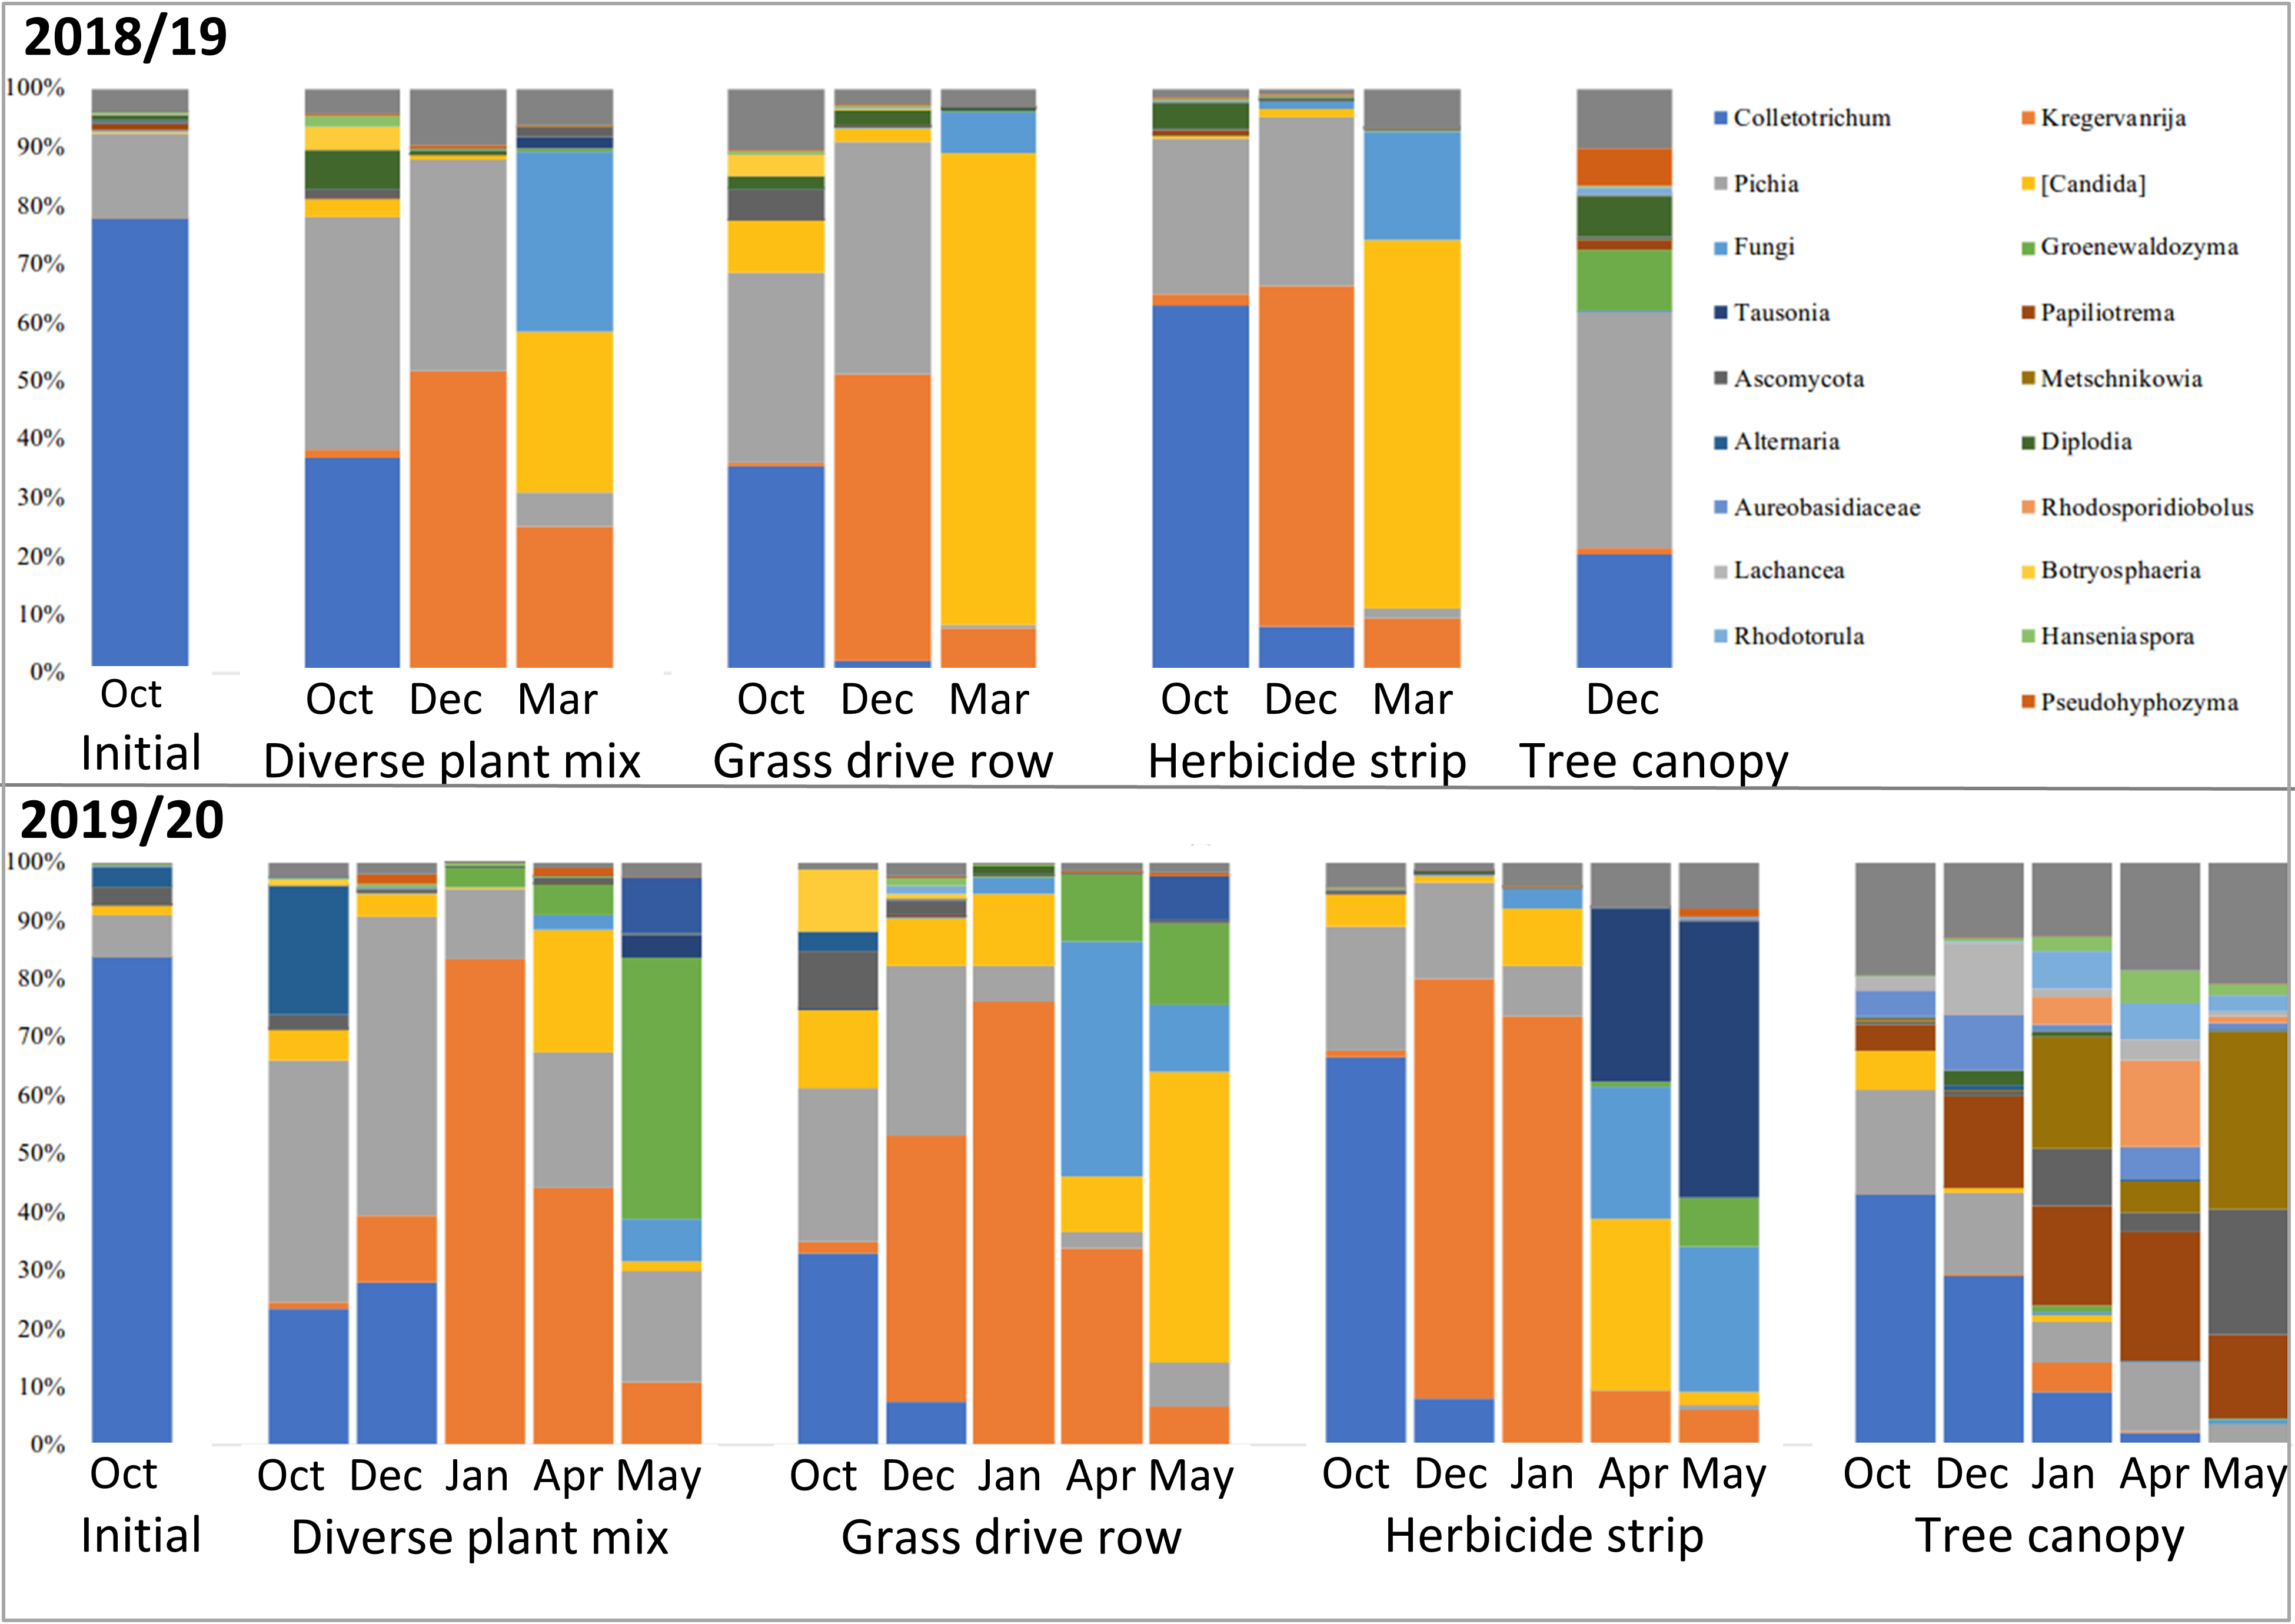
Classification of the fungal genera into filamentous or yeast categories showed that the vast majority of succession fungi that moved in after Colletotrichum were yeasts (Figure 18). This makes sense considering that yeasts grow well in conditions with lots of soluble sugars, which are abundant in mature apples. The biggest differences were between the apples on the ground and those in the tree canopy, with those in the tree canopy having relatively more filamentous fungi and a different population of yeasts (Figures 17 and 18).
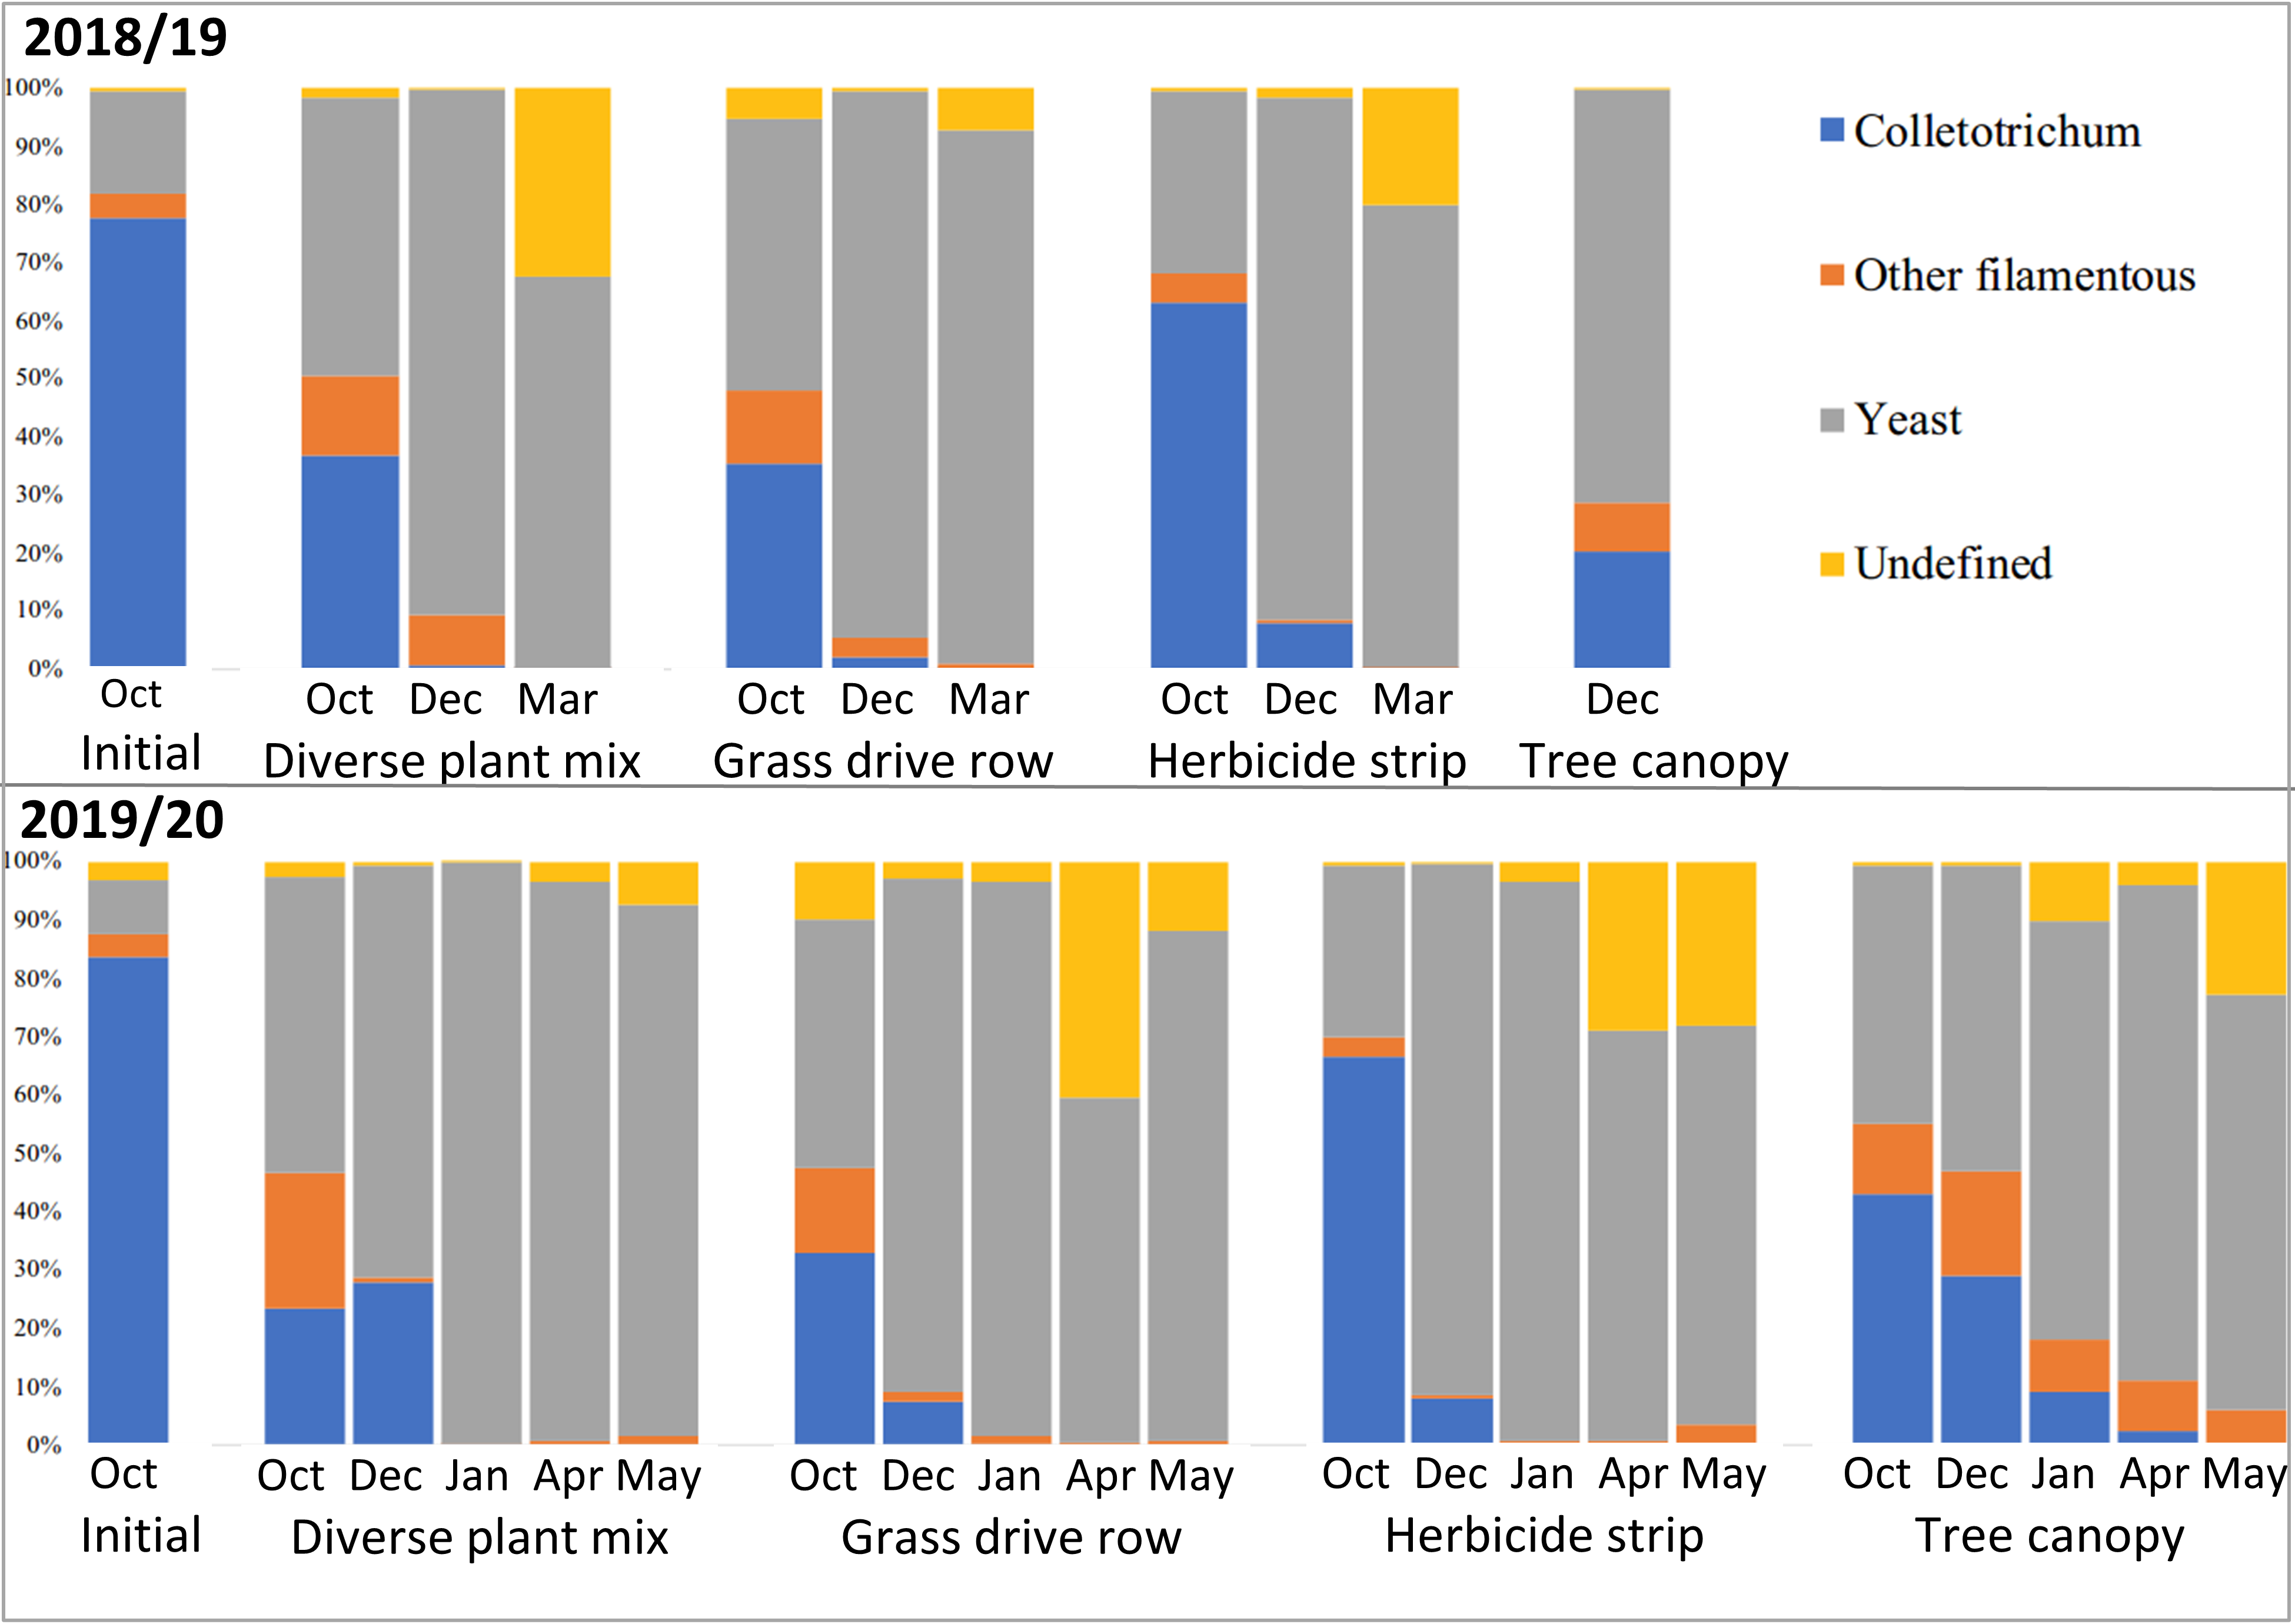
There are several conclusions of this persistence and microbial succession of Colletotrichum in apples with bitter rot study. The successional fungi that move in after bitter rot starts the decay process are mostly yeasts. Yeasts rarely cause plant diseases and are generally considered beneficial. Some C. fioriniae DNA overwinters in apples with bitter rot, but for apples that are on the ground, the absolute and relative amounts of C. fioriniae DNA are low. Apples with bitter rot that remain in the tree canopy retain higher levels of C. fioriniae DNA and are likely sources for spores the following season. There were little differences between apples with bitter rot on the ground in grass-free herbicide strips, in grassed row middles, or in a nearby diverse plant mix. The key take-home message for apple growers is that apples with bitter rot should be removed from the tree canopy and tossed on the ground to decay. Exactly where on the ground the apples are tossed is unlikely to make a large difference.
References in this section:
Børve, J., and Stensvand, A. 2017. Colletotrichum acutatum occurs asymptomatically on apple leaves. Eur. J. Plant Pathol. 147:943–948.
Carbone, I., and Kohn, L. M. 1999. A Method for Designing Primer Sets for Speciation Studies in Filamentous Ascomycetes. Mycologia. 91:553–556.
Debode, J., Van Hemelrijck, W., Baeyen, S., Creemers, P., Heungens, K., and Maes, M. 2009. Quantitative detection and monitoring of Colletotrichum acutatum in strawberry leaves using real-time PCR. Plant Pathol. 58:504–514.
Doyle, V. P., Oudemans, P. V., Rehner, S. A., and Litt, A. 2013. Habitat and Host Indicate Lineage Identity in Colletotrichum gloeosporioides s.l. from Wild and Agricultural Landscapes in North America. PLoS One. 8.
Garfinkel, A., and Chastagner, G. 2018. Identification of peony diseases in the Pacific Northwest and Alaska.
Hu, M.-J., Grabke, A., and Schnabel, G. 2015. Investigation of the Colletotrichum gloeosporioides species complex causing peach anthracnose in South Carolina. Plant Dis. 99:797–805.
Kumar, S., Stecher, G., Li, M., Knyaz, C., and Tamura, K. 2018. MEGA X: Molecular evolutionary genetics analysis across computing platforms. Mol. Biol. Evol. 35:1547–1549.
Marcelino, J. a P., Gouli, S., Parker, B. L., Skinner, M., Schwarzberg, L., and Giordano, R. 2009. Host plant associations of an entomopathogenic variety of the fungus, Colletotrichum acutatum, recovered from the elongate hemlock scale, Fiorinia externa. J. Insect Sci. 9:25.
Mertely, J. C., and Legard, D. E. 2004. Detection, Isolation, and Pathogenicity of Colletotrichum spp. from Strawberry Petioles. Plant Dis. 88:407–412.
O’Donnell, K., and Cigelnik, E. 1997. Two Divergent Intragenomic rDNA ITS2 Types within a Monophyletic Lineage of the Fungus Fusarium Are Nonorthologous. Mol. Phylogenet. Evol. 7:103–116.
Rhoads, A. F., and Block, T. A. 2007. The Plants of Pennsylvania: an Illustrated Manual. University of Pennsylvania Press.
Rojas, E. I., Rehner, S. A., Samuels, G. J., Van Bael, S. A., Herre, E. A., Cannon, P., et al. 2010. Colletotrichum gloeosporioides s.l. associated with Theobroma cacao and other plants in Panamá: multilocus phylogenies distinguish host-associated pathogens from asymptomatic endophytes. Mycologia.
Schneider, C. A., Rasband, W. S., and Eliceiri, K. W. 2012. NIH Image to ImageJ : 25 years of image analysis. Nat. Methods. 9:671–675.
Sogonov, M. V, Castlebury, L. A., Rossman, A. Y., Mejía, L. C., and White, J. F. 2008. Leaf-inhabiting genera of the Gnomoniaceae, Diaporthales. Stud. Mycol. 62:1–79.
Stephenson, S. A., Green, J. R., Manners, J. M., and Maclean, D. J. 1997. Cloning and characterisation of glutamine synthetase from Colletotrichum gloeosporioides and demonstration of elevated expression during pathogenesis on Stylosanthes guianensis. Curr. Genet. 31:447–454.
Swofford, D. L. 2003. PAUP*. Phylogenetic Analysis Using Parsimony (*and Other Methods).
Templeton, M. D., Rikkerink, E. H. A., Solon, S. L., and Crowhurst, R. N. 1992. Cloning and molecular characterization of the glyceraldehyde-3-phosphate dehydrogenase-encoding gene and cDNA from the plant pathogenic fungus Glomerella cingulata. Gene. 122:225–230.
Toju, H., Tanabe, A. S., Yamamoto, S., and Sato, H. 2012. High-coverage ITS primers for the DNA-based identification of ascomycetes and basidiomycetes in environmental samples. PLoS One. 7.
Weir, B. S., Johnston, P. R., and Damm, U. 2012. The Colletotrichum gloeosporioides species complex. Stud. Mycol. 73:115–180.
White, T. J., Bruns, S., Lee, S., and Taylor, J. 1990. Amplification and direct sequencing of fungal ribosomal RNA genes for phylogenetics. In PCR Protocols: A Guide to Methods and Applications, New York: Academic Press, p. 315–322.
We have learned that C. fioriniae spores are being dispersed and apple fruits are susceptible throughout the growing season, indicating that bitter rot control measures also must be practiced throughout the season. Contrary to what we had expected we have found that C. fioriniae is not primarily a pathogen, but rather is primarily a common endophyte of many broadleaf plants in fence rows and forests. However, due to the limited distance rain-splashed conidia (spores) are generally dispersed, it does not appear that endophytic leaf infections of C. fioriniae in the forest are primary sources of infection in apple orchards. C. fioriniae appears to overwinter in bud scales, fruit mummies, fruit scars, and twig cankers within the tree canopies, and then infect leaves and fruits during the growing season.
We learned that as apples with bitter rot decay, they are colonized by a diverse community of yeasts and the amount of Colletotrichum declines. Colletotrichum persisted longest in apples that remained as mummies in the tree canopy as compared with those on the ground. While infected apples in the tree canopy are likely sources of spores in the spring, it is unlikely that infected apples on the ground are major sources of spores for the following season, irrespective of whether they fall to the ground in the grass drive strip or the weed-free herbicide strip directly below the trees.
Education & outreach activities and participation summary
Participation summary:
In the fall of 2018 a poster showing some of the preliminary spore dispersal results was presented at the 3rd Partnerships in Biocontrol, Biostimulants & Microbiome conference, in Philadelphia on Oct. 1-2. Talks covering some of the same topics were given at the Cumberland Shenandoah Fruit Workers Conference in Winchester VA on November 29 -30, and to the department of Plant Pathology and Environmental Microbiology at Penn State University on January 28, 2019. An oral presentation titled “Spore dispersal patterns and apple infection timing by Colletotrichum fioriniae, the main bitter rot fungus of apples in Pennsylvania” was presented at the American Phytopathological Society Annual meeting in Cleveland OH, August 8, 2019. An oral presentation on the biology and timing of infection of bitter rot was given at the 2019 Plant Protection Field Day at Penn States Fruit Research and Extension Center. An oral presentation titled “Quantification of Colletotrichum fioriniae in the forest suggests its main ecological role is that of a leaf endophyte” was presented at The Cumberland Shenandoah Fruit Workers Conference in Winchester VA, December 6, 2019. Two oral presentations that build on this research are planned for the 2021 Mid-Atlantic Fruit and Vegetable Convention, titled “The Biology & Management of Bitter Rot of Apple” and “How Did I Get Anthracnose in My Strawberry Field?”.
While the research details were not directly presented, the overall implication of the necessity of season long bitter rot control was included in updates to the 2020-2021 edition of the Penn State Tree Fruit Production Guide, presented by Dr. Kari Peter at numerous winter tree fruit schools and spring and summer tree fruit twilight meetings hosted by Penn State Extension.
The results of the abundance of C. fioriniae in forest spore traps and its abundance as an endophyte of leaves of many forest plants was published in the peer-reviewed journal Phytopathology as Martin, P. L., and Peter, K. A. 2020. Quantification of Colletotrichum fioriniae in orchards and deciduous forests indicates it is primarily a leaf endophyte. Phytopathology. First Look. doi.org/10.1094/PHYTO-05-20-0157-R. Manuscripts of the relative amounts of C. fioriniae in orchard spore traps and the timing of infection field trial, and the persistence and microbial succession of Colletotrichum in apples with bitter rot are in preparation for publishing in the near future.
Project Outcomes
This project increased our knowledge of the biology of Colletotrichum fioriniae, the main fungal species that causes bitter rot in the Mid-Atlantic region, by demonstrating that it infects leaves endophytically (that is, without causing disease), and that C. fioriniae spores are dispersed in orchards from bud break until leaf drop. The practical outcome for apple growers is rather limited, in that farmers that applied fungicides season-long without really knowing what they were spraying for can now apply fungicides season-long because they know spores are being dispersed and fruit are susceptible season-long. It does however, influence future research on bitter rot control. A private company is already looking at applying early season plant defense regulators that might increase the thickness of the apple skin, making it less susceptible to bitter rot. This research further demonstrated that after infecting apples and causing bitter rot, Colletotrichum is rapidly succeeded by a community of yeasts and declines more rapidly in apples on the ground than in those left in the tree. This adds to our knowledge of the role these yeasts play in nature, and reinforces the importance of removing infected apples from the tree canopy to reduce disease pressure the following year.
Through this project we gained extensive knowledge of the biology of Colletotrichum fioriniae, the main fungal species that causes bitter rot in the Mid-Atlantic region. The direct applicability to sustainable agriculture was not what we expected or hoped for, but in the long run it may be just as important. We had hoped to find certain periods during the growing season when C. fioriniae spores are not being dispersed in orchards, and/or when apple fruits are not susceptible to infection by C. fioriniae spores. It turns out that spores are being dispersed weeks before fruits (which are susceptible all season long) are present, and for weeks afterwards. Spore dispersal does not coincide with the presence of fruits at all, but rather with the presence of leaves, and C. fioriniae is not primarily a pathogen of fruit, but an endophyte of leaves. Exactly what all this means for sustainable agriculture is not yet clear. One conclusion is that many plants seem to host C. fioriniae in their leaves without suffering any disease from it, which would be related to the plant’s genetics, so breeding for disease resistance and planting the least susceptible apple cultivars is likely the best long-term strategy for bitter rot control.
I came away from this project with a greater awareness of the role that consumer choice plays in sustainable agriculture. In our research, and in surveys with farmers across the Mid-Atlantic, it became clear that apple cultivars vary dramatically in how susceptible they are to bitter rot. From a sustainable agricultural perspective, the choice is clear; plant the least susceptible cultivars. However, some of the most susceptible cultivars, such as Honeycrisp, are very popular with consumers and command high prices at the farmgate. Farmers who wish to remain profitable must grow what consumers want to buy. In places where consumer choice and sustainability are at odds with each other, I think consumer choice will win. For my career I want to work at the interface of farming and science, ideally involving some applied research. The exact path this will take is still unclear, but it is likely to be with a private company or with University Extension Services.