Final report for GNE19-206
Project Information
A leading cause of honey bee colony mortality, Varroa destructor populations typically exceed damaging levels in the fall. One possible explanation for rapid population increases is immigration of mite-carrying bees from other colonies. Here, the degree to which bees move between apiaries from high and low mite donor colonies, and resulting Varroa population changes in visited colonies were monitored. More bees from low mite colonies (n = 37) were detected in receiver apiaries than bees from high mite colonies (n = 10, p < 0.001). A receiver colony’s Varroa population growth was associated with visitation by non-natal bees (p = 0.03). Finally, unscreened colonies experienced significantly faster Varroa population growth than screened neighbors (p = 0.01). Thus the novel application of robbing screens as inhibitors of Varroa population growth was successfull. This data indicates colonies were exposed to mites on visiting non-natal bees, not due to direct contact via robbing high mite colonies or visitation from high mite bees. This is a new possible route of horizontal transmission, suggesting non-natal bees visit multiple colonies in one foraging trip, spreading mites to any colonies they visit. This study supports the notion that any untreated colony in the landscape can spread mites to neighbors, and that landscape scale Varroa management is crucial for colony health and survival.
This project seeks to:
1. Investigate the efficacy of robbing screens as a mechanism for preventing spread of Varroa between colonies.
2. Evaluate the economic feasibility of adopting robbing screens as a Varroa management tactic.
The purpose of this project is to investigate the efficacy and economic feasibility of a novel application of existing beekeeping equipment in reducing the spread of parasitic mites between honey bee colonies. This is an add-on to a funded project investigating the modes and magnitude of mite-driven movement of bees between colonies. Honey bees provide over $14 billion of pollination services in the US[1]. Northeastern farmers producing crops such as apples and blueberries often rely on imported honey bee colonies to bolster pollination and improve yields[2]. Recent high rates of colony losses have strained the supply of colonies needed to meet pollination demands[3]. Beekeepers need effective, economical management options that bolster colony health and decrease mortality.
The leading cause of colony mortality in the US is the parasitic mite Varroa destructor[4]. Organic and synthetic chemical miticides can control Varroa, but must be applied with precise timing and under specific conditions. This is critical in the Northeast because beekeepers have a short window to control Varroa loads before the colonies overwinter, and added pressure from Varroa significantly decreases winter colony survival [5]. Furthermore, long term colony monitoring studies suggest Varroa populations can exceed pretreatment levels in as little as two weeks (Figure 1). This rate of population growth exceeds expected Varroa reproduction[6-8], indicating that mites are entering colonies from external sources, likely on bees from nearby colonies[9-11]. This phenomenon, referred to as horizontal transmission of Varroa, can diminish effects of management performed by beekeepers. Additional treatments, monitoring, and reduced colony health and survivorship are all potential consequences of horizontal transmission. We believe this phenomenon could be interrupted with a novel application of existing beekeeping equipment, the robbing screen (Figure 2).
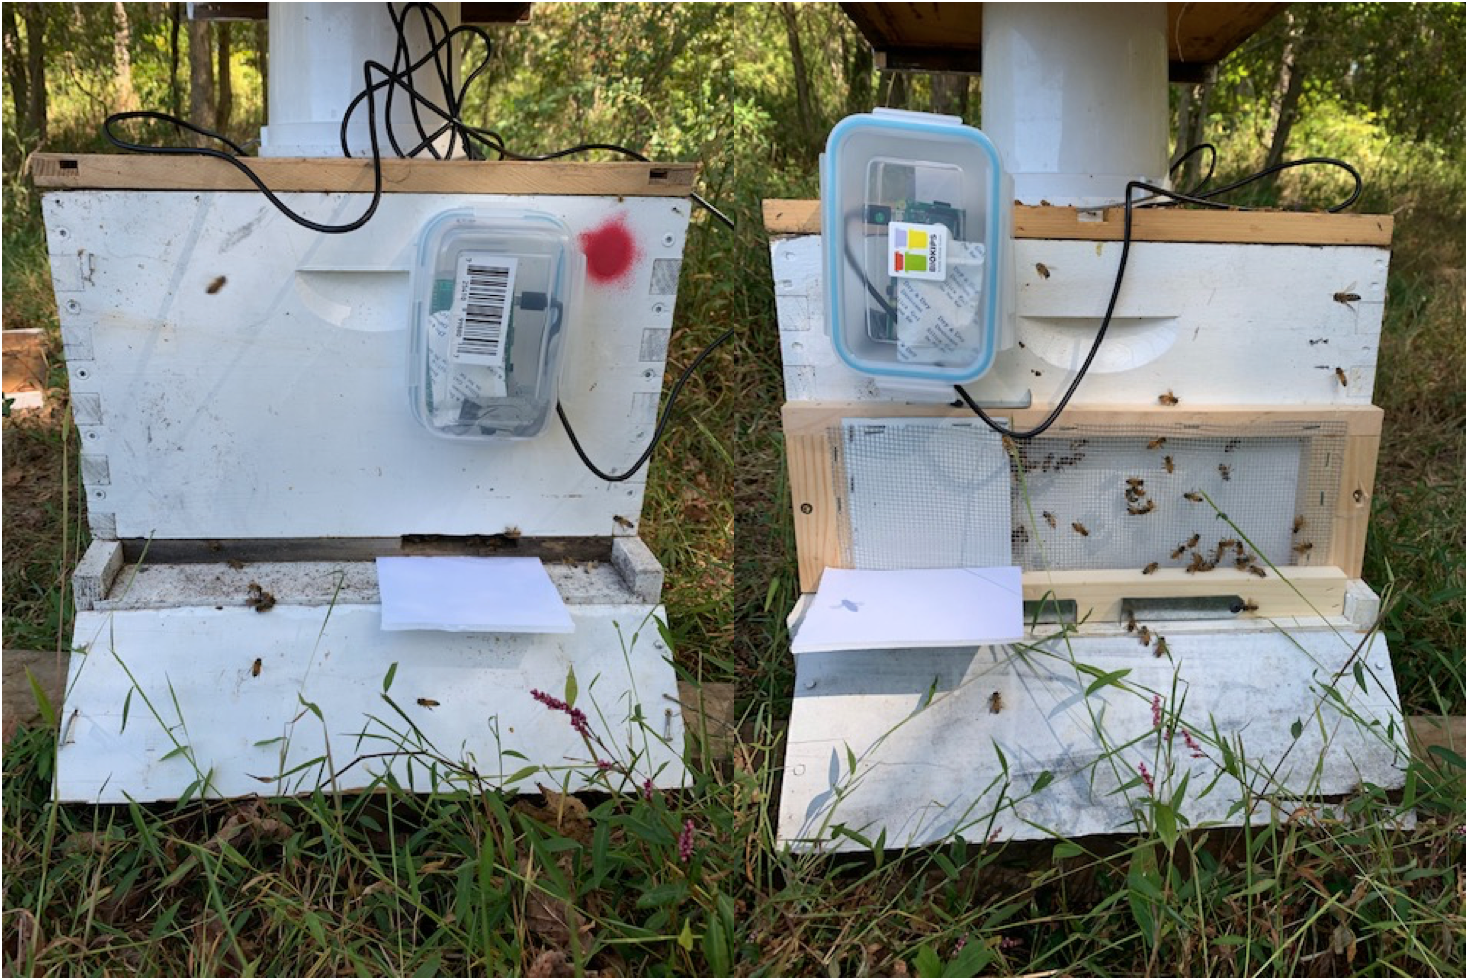
Robbing screens are placed over the original colony entrance, but allow smells and sounds to pass through, tricking unfamiliar bees into thinking the only colony entrance is blocked by the screen. A notched opening in the top of the screen acts as a new colony entrance that is much less apparent to unfamiliar bees. Only the bees originating from the colony with the robbing screen learn the new entrance. The reduced opening also makes colony defense against robbers easier as their point of entry is restricted. We hypothesize these screens could prevent inter-colony transmission of Varroa by blocking foreign bees from carrying mites into colonies. This would increase efficacy of Varroa control methods implemented by the beekeeper and help ensure their fall treatments remain successful and Varroa loads remain low throughout winter. An economic analysis will aim to demonstrate the cost savings and increase in profits that robbing screen use can provide. This simple intervention has potential to decrease colony mortality in the Northeast, easing the burden on beekeepers and ensuring availability of local colonies for northeastern crop pollination.
Research
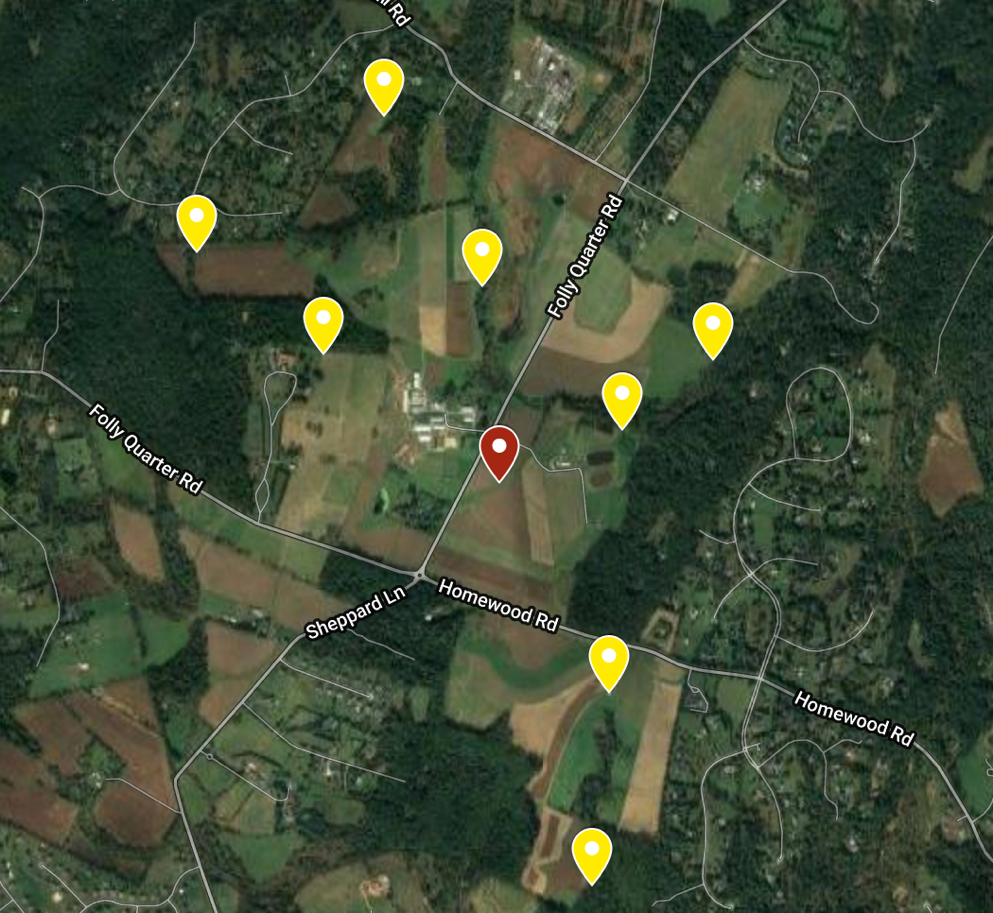
This study was performed at the University of Maryland Clarksville Agricultural Research Farm. Nine apiaries of 4 colonies each were established on the farm. Four apiaries were placed ~0.5 miles roughly north, south, east, and west of center. Four additional apiaries were placed in the same direction ~1 mile from center (Figure 1). These 32 receiver colonies were established by making new splits from preexisting colonies at the UMD Beltsville Research Farm. All receivers were made of 4 frames of brood, 2 frames of honey, and with new Italian queens purchased from the same source placed into a single deep. Once the receiver apiaries were moved into place, they received a formic acid treatment (Mite Away Quick Strips) to render them as mite free as possible. Alcohol samples were taken right after the completion of treatment to test starting mite loads.
After the 32 receiver colonies were ready, the central apiary could be established. Two “donor” colonies with Varroa loads of >10 mites/100 bees were placed in a central apiary with two healthy colonies (<3 mites/100 bees). Donor colonies were chosen from pre-existing colonies located at the Upper Marlboro UMD Research Farm. Two colonies with mite loads > 10 mites/100 bees were identified by alcohol wash. These colonies were further stressed by removing honey supers and compacting the entire colony to 2 brood boxes. This was done to maximize the ratio of Varroa mites to adult bees to ensure the mite infestation remained intense. Healthy colonies were chosen from the same location as donor colonies and were also compacted to 2 brood boxes, but these colonies had mite load < 3 mites/100 bees. These 4 colonies were moved into the central location at the experimental station.
The same day the central apiary was moved into place, the bees in those colonies were painted. The donor colony bees were painted red, and the healthy colony bees were painted blue. Painting was achieved by shaking bees of of all frames in the colony into a plastic tub covered with a lid. Once the majority of the adult bees in the colony were in the tub, we scooped ~500 bees at a time into a modified CO2 Varroa tester (https://www.my-honey.nl/winkel/co2-varroa-tester/). The screen was removed from the tester so the mites would not become separated from the bees. Bees were then anesthetized with CO2 and spread onto a flat surface where they could be marked with Sharpie Paint Pens of the appropriate color. We repeated this process 8 times per colony, so that each colony had ~2,000 painted bees at the end of the process.
Once all 36 colonies were in place, sticky boards were placed underneath them to monitor the change in mite load throughout the experiment. Since receiver colonies were new splits, we opted for sticky board monitoring over repeated alcohol washes as we were concerned about removing too many adult bees from the relatively small colonies. Sticky boards were changed approximately every 3 days throughout the duration of the experiment, with some exceptions due to weather. At this time, robbing screens were placed on 2 of the 4 colonies in each receiver apiary. All colonies also had entrance reducers engaged with the larger opening.
Finally, camera sensors were installed on all 36 colonies to detect the presence of painted bees. Cameras consisted of a simple computer (Raspberry Pi 3B+) and camera module (Pi Camera Version 2) (Figure 6a). Cameras were placed over either the opening in the entrance reducer (on colonies without robbing screens) or above the opening in the top of the robbing screen (on colonies with robbing screens) (Figure 2). All colonies had a piece of white cardboard glued to the bottom board underneath the camera to act as a white back drop for photos. Once all cameras were installed, this marked the beginning of the experiment on September 28, 2019. Cameras were turned on daily and sticky boards replaced every three days until the weather became too cold for bees to migrate on November 10, 2019. A final alcohol wash sample for Varroa was taken from all colonies on that date.
Throughout the experiment, the central apiary was checked for whether colonies had collapsed. By the end of the experiment, one of the donor colonies had only a handful of bees remaining and was functionally dead. Adult bees were taken from donor and healthy colonies for viral analysis. Samples were placed immediately on dry ice and then stored at -80 degrees Celsius. Viral samples were taken near the start of the experiment (10/3/19), at the middle (10/15/19), and towards the end (11/5/19). Samples will be analyzed for viral prevalence and copy number using PCR techniques at a later date.
Donor colony adult bee populations:
The experiment began on Sept 28th, 2019 with all donor colonies at the same population size (Figure 1, 12.5 ± 0.5 frames of bees, t = -1, df = 1, p = 0.5), and while high mite donor colonies did lose more population than low mite donor colonies, they did not collapse before Nov 10th, when weather no longer warranted continued observation. At the end of the experiment, high mite colonies were functionally dead (less than 1 frame of bees) and were significantly smaller than the low mite colonies (high mite 1.75 ± 1.25 vs. low mite 6.0 ± 0.35 frames of bees, F1 = 12.49, p < 0.001). All 32 receiver colonies survived the entire length of the experiment.
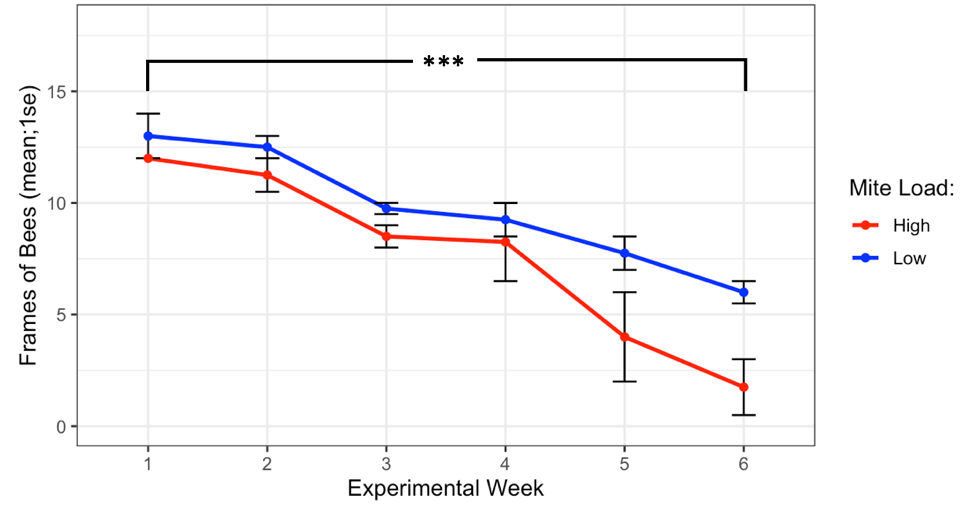
Figure 1. Colony population sizes in high and low mite donor colonies over each experimental week. Low mite colonies were significantly larger than high mite colonies over the duration of the study (glm ***p < 0.001).
Detections of donor bees in receiver apiaries:
In total, 47 unique painted bees were detected by the 16 camera sensors on unscreened colonies. Considering ~2,000 bees were painted in each of the 4 donor colonies at two time points, a total of 16,000 bees were painted. Thus the 47 bees detected equal a 0.29% recovery rate. Despite the fact that high mite colonies lost more population than low mite colonies, of the 47 detections, more low mite bees were detected (n = 37) than high mite bees (Figure 2, n = 10, c2= 15.5, df = 1, p < 0.001). Painted bees were detected in 62.5% (n = 5) of receiver apiaries and at 56.3% (n = 9) of non-screened receiver colonies.
There was substantial drift of bees between colonies within the donor apiary. Donor colonies were mounted with cameras, and the number of non-natal bees detected was higher than could be quantified (hundreds in each donor colony camera). The two manual checks performed of receiver colonies for painted bees did not result in any detections, indicating painted bees did not permanently remain in non-natal colonies. With only one detection in apiaries placed at the further 1.6 km radius, donor bees were much more likely to visit closer apiaries then further apiaries (c2= 43.1, df = 1, p < 0.001). The visited apiary at the further radius only received one visitor to one unscreened colony. In all other apiaries that received donor bee visitors, both unscreened colonies were visited.
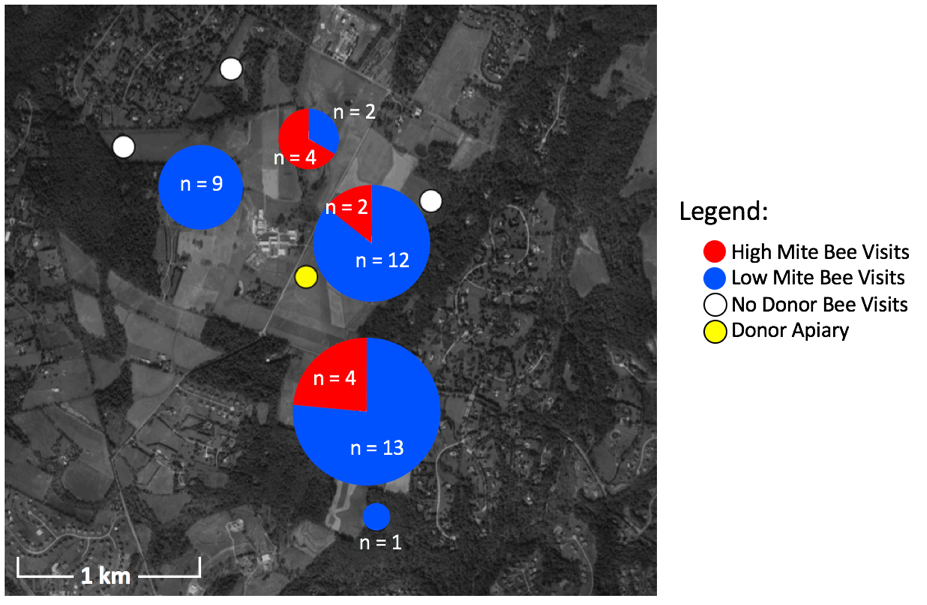
Figure 2. Location, number, and color of painted bee detections. Pie charts represent the number of high and low mite bees detected in each receiver apiary. White circles are receiver apiaries where no painted bees were found, the yellow circle indicates the donor apiary.
Varroa loads:
Varroa loads in low mite donor colonies remained low throughout the study (from 0.17 ± 0.17 to 1.95 ± 0.10), while Varroa loads in high mite donor colonies grew substantially (from 9.57 ± 5.12 to 34.8 ± 29.41). The two high mite colonies started with significantly different mite infestations (Supplemental Table 4.1, (c2= 5.5, df = 1, p= 0.02), but their mite loads were always higher than in low mite colonies (Figure 3, c2= 29.4, df = 1, p < 0.001). Varroa loads in all receiver colonies increased over the duration of the study (from 0.91 ± 0.22 to 1.94 ± SE 0.32, p < 0.001).
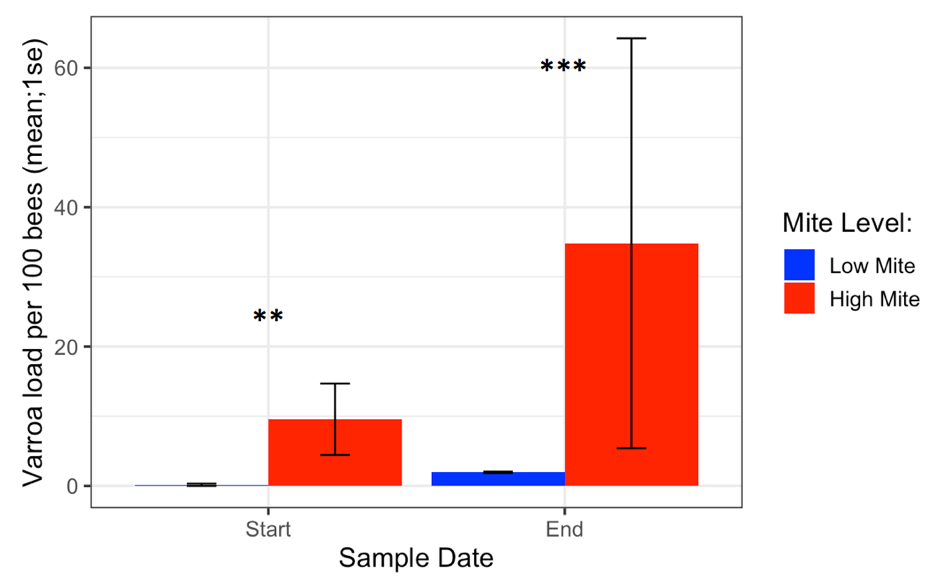
Figure 3. Varroa loads in low vs. high mite donor colonies at the start and end of the experiment. High mite colonies had significantly more mites than low mite colonies throughout the study ( c2 **p < 0.01, ***p < 0.001).
Receiver colonies that were visited by high mite donor bees started the study with similar Varroa loads to colonies that were not visited by high mite donor bees (t = 0.80, df = 9.4, p = 0.45). Whether a high mite donor bee visited a receiver colony did not affect the receiver colony’s mite population increase over the duration of the study (Figure 4, F1 = 1.42, p = 0.19).
Receiver colonies that were visited by any donor bee (from high or low mite donor colonies) also started the study with similar mite loads to unvisited receiver colonies (t = 1.34, df = 9.33, p = 0.21). However, Varroa loads in colonies that were visited by any donor bee increased significantly faster than colonies not visited by donor bees (Figure 5, F1 = 4.57, p = 0.03). Within apiaries that were visited by donor bees, there was a positive correlation between a colony’s starting mite load and the number of non-natal bees it received (Figure 6, Spearman’s r = 0.62, p = 0.05). However, an increased number of visitors did not result in accelerated Varroa population growth (Spearman’s r = -0.14, p = 0.71). Varroa population growth was only associated with whether a colony was visited, and not the total number of visitations.
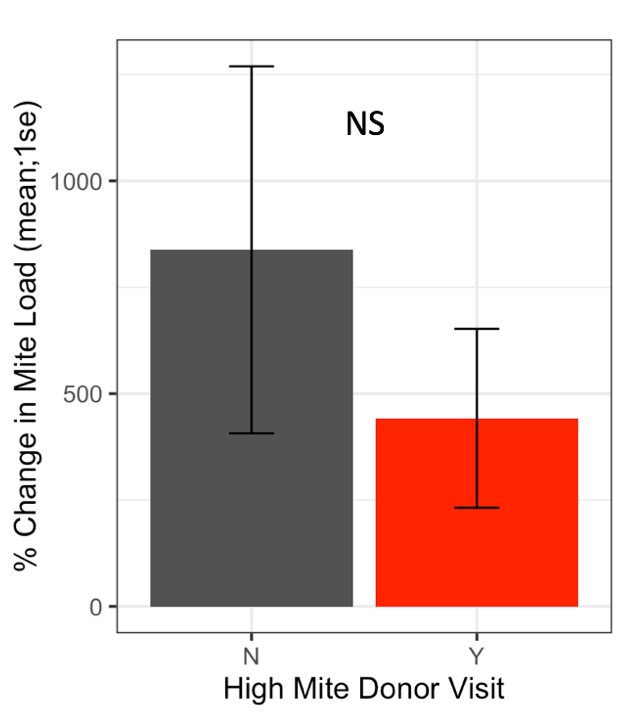
Figure 4. Percent change in Varroa loads in colonies that received red bees compared to colonies that did not receive red bees. There was no difference in percent change between colonies visited by high mite bees and unvisited colonies at the start or end of the study (glm p = 0.19).
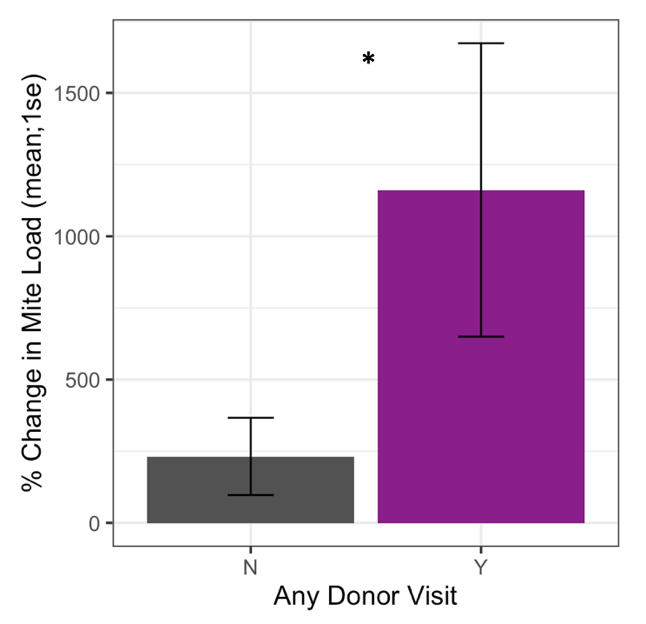
Figure 5. Percent change in Varroa load in colonies that received any painted bee (blue or red) compared to colonies who did not receive any painted bee. Colonies that were visited by painted bees experienced significantly faster Varroa population growth than unvisited colonies (glm **p = 0.03).
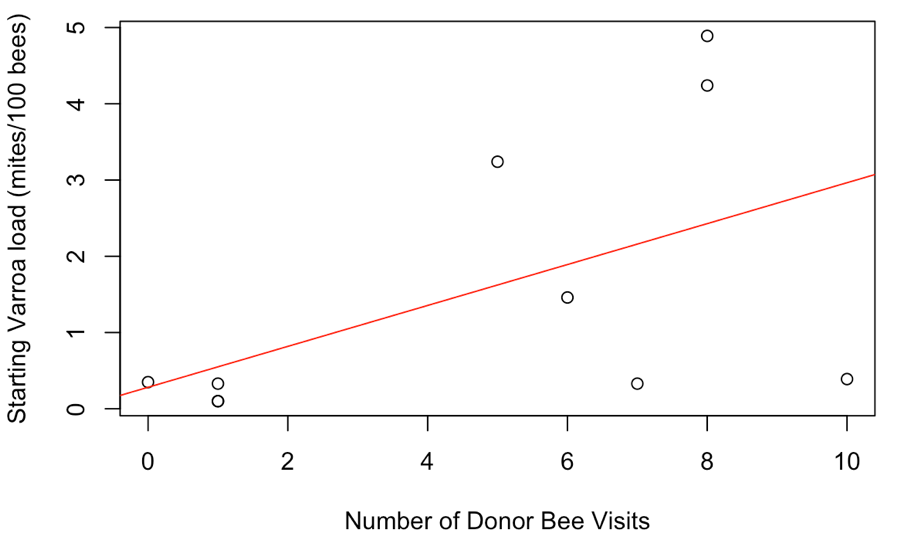
Figure 6. Correlation between a colony's starting Varroa load and the number of donor bee visitors it received. Colonies with higher starting Varroa loads received more visitors than colonies with lower starting Varroa loads. Spearman's r = 0.62, p = 0.05.
Robbing screens:
Alcohol wash Varroa counts from receiver colonies with and without robbing screens were not different at the start of the experiment (t = -1.61, df = 22.2, p = 0.12). However, colonies with robbing screens had significantly lower increases in Varroa population (Figure 7, F1 = 6.16, p = 0.02). Sticky board Varroa counts show a similar trend, with starting counts not differing between colonies with or without screens (Figure 8, t = -0.99, df = 29.8, p = 0.33). Sticky board counts over the whole experiment show that colonies with robbing screens had consistently lower Varroa loads than colonies without robbing screens (F1 = 14.31, p < 0.001). Sticky board mite counts in the first experimental week were significantly higher than any other week (first week 6.35 ± 0.98 vs. other weeks 1.71 ± 0.12, t = 4.69, df = 31.9, p < 0.001). This is likely due to residual mite drop from the formic acid treatment that ended one day before sticky boards were placed on colonies.
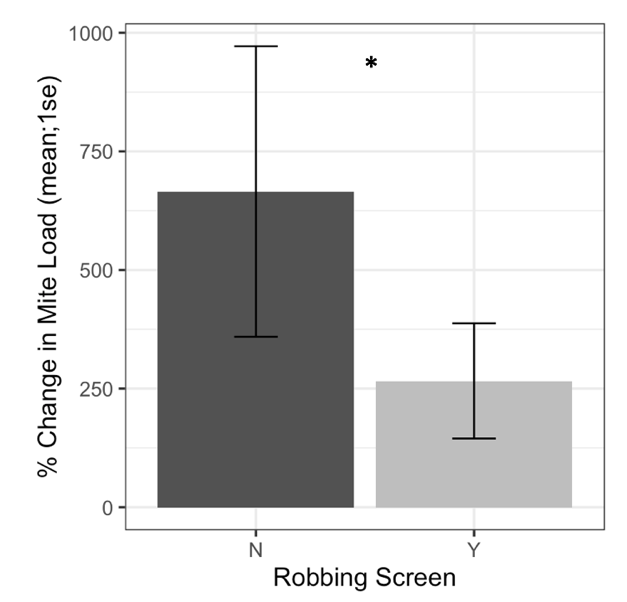
Figure 7. Percent change in Varroa loads in colonies with and without robbing screens. Colonies with robbing screens had reduced increases in Varroa population compared to unscreened colonies. (glm *p = 0.02).
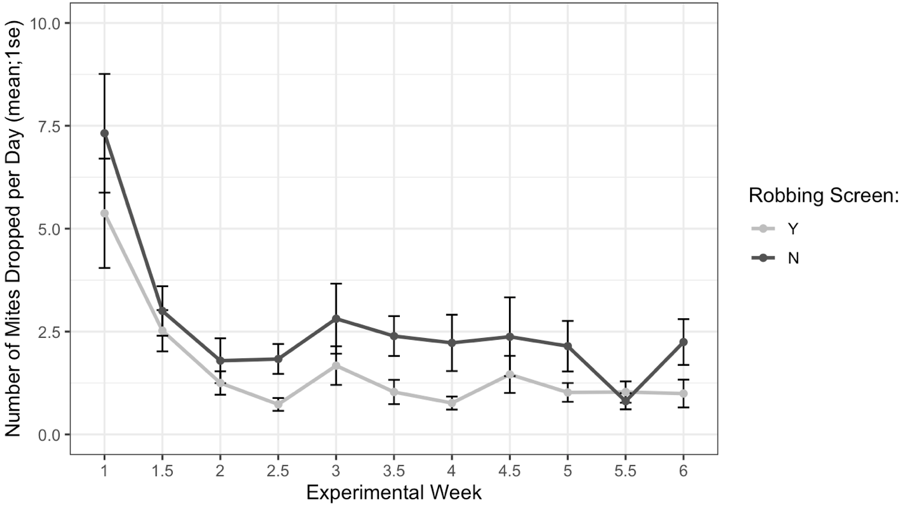
Figure 8. Sticky board Varroa loads in colonies with and without robbing screens over each experimental week. Colonies with robbing screens had fewer mites on sticky boards than colonies without screens (glm ***p < 0.001).
Discussion:
This study hypothesized that more bees from high mite donor colonies would visit receiver colonies. However, the majority of bee visitations were from low mite donor colonies. Despite the finding that high mite donor bee visitation was low, visited receiver colonies experienced accelerated Varroa population growth compared to unvisited colonies. Additionally, screened colonies exhibited reduced Varroa population growth compared to unscreened colonies. Bees visiting other colonies transfer mites in the process whether their own colony’s mite load is high or not.
Past studies have implicated robbing or drifting as important contributors to Varroa population growth, however, these studies failed to track bees [30, 31]. Studies which have tracked bees have done so at small distances and/or with fewer colonies [27, 33, 34]. This study is the first to track bee movement and resulting mite population changes over large distances within several apiaries and colonies. Closer apiaries were more subject to visitation by bees from the donor apiary, with only one detection occurring at the 1.6 km radius. This can be explained by energetic optimization of foraging, when foragers expend as little energy as possible seeking resources as nectar and pollen become scarce in the late fall [35, 36]. Colonies that were visited experienced more significant Varroa population growth, indicating that visiting bees may vector mites to receiver colonies. The increase in Varroa loads was due to visitation by non-natal bee.
The finding that increases in Varroa load were not due to contact with bees from high mite colonies suggests that a high mite colony does not need to crash and send bees into the landscape to impact Varroa loads of other colonies. This conclusion is supported by prior work which found that high mite colonies were not more likely to produce drifted bees than low mite colonies, but rather high mite colonies were more likely to receive non-natal bees than low mite colonies [34]. Further, a study which tracked the movement of bees between high and low mite apiaries and the resulting change in mite populations found that large numbers of mites spread to low mite colonies via their own bees that were robbing the crashing high mite colonies [33]. This study builds on this prior work by testing these hypotheses at a larger scale and with more colonies, and agrees with the finding that Varroa horizontal transmission is not primarily occurring from a “mite bomb” phenomenon where crashing colonies send bees and mites to neighbors. However, the present study disagrees with prior work, indicating that Varroa is transmitted to colonies via healthy bee visitation, and not as a result of a colony’s own robbing of high mite donors.
The robbing screen results support the assertion that increases in mite populations were not a result of colonies bringing home mites after robbing. Colonies with robbing screens experienced reduced Varroa population growth, which would not have occurred if natal bees were bringing home mites. Natal bees are not deterred by screens, indicating that non-natal visiting bees are a more likely source of immigrating mites. This is possible if non-natal bees are visiting multiple colonies, as mites can switch phoretic hosts or enter a brood cell within seconds [13, 37]. Because of their close proximity to the high mite colonies, bees from low mite colonies were almost certainly visiting their weak neighbors, and much mixing between donor colonies was observed [29, 31]. However, the Varroa load in low mite colonies remained low throughout the experiment, indicating that visiting low mite donor bees did not bring home a significant number of mites. Thus, bees from low mite colonies may have visited high mite colonies, and then visited receiver colonies before returning home, transmitting mites from high mite colonies to other apiaries in the process.
It also appears that non-natal bees visit the most vulnerable colonies, and a colony’s Varroa population growth is related to its attractiveness to visitors. The number of visitations to screened colonies is unknown, but their reduced Varroa population growth indicates that they were visited less often because they were less accessible. If all colonies in an apiary were screened and no unscreened, easily accessible colony was nearby, visiting bees may be more persistent and find ways to enter screened colonies. Additionally, the number of visitors a colony received was positively associated to its starting mite load, indicating that elevated Varroa loads can make colonies more susceptible to non-natal bee visitation. This could be a result of reduced colony size or strength either caused by or resulting in elevated mite loads, which could affect a colony’s ability to defend itself against intruding bees. Regardless of a colony’s initial mite load, visitation by non-natal bees resulted in accelerated Varroa population growth. It appears that colonies with high Varroa loads are more susceptible to visitation, which results in further accelerated Varroa population growth.
This experiment confirmed prior observations of bees moving between apiaries, and resulting increases in Varroa loads. However, a unique phenomenon was observed of mite loads increasing in colonies that were visited by non-natal bees, not as a result of a colony directly picking up mites by visiting other colonies. There were also promising results that robbing screens can help interrupt horizontal transmission of mites, which may be an effective management option. Regardless of how the horizontal transmission of mites occurs, the outcome of increased Varroa loads in the late fall is detrimental to a beekeeper’s attempts to manage Varroa. An untreated colony in the landscape represents a significant risk to beekeepers in the area. In the future, cooperative Varroa management will likely become increasingly important to improving colony health and survival. As such, beekeeping communities should work together for active Varroa management and coordinate the timing of treatments for maximum effectiveness.
Education & outreach activities and participation summary
Participation summary:
The on-farm demonstration listed was the annual UMD College of Agriculture Farm Tour at the Clarksville Research Farm. At one of the stops on the farm tour, I showed an example of an experimental apiary, how the cameras were set up, and described the methods, need, and expected results of this study. This meeting was attended by a few farmers, but mostly agriculture extension and administrative personnel.
I have given many talks about this study to beekeeping groups. These are attended entirely by beekeepers of varying operation sizes from hobbyist to commercial. The following are the talks I have given since this grant began on September 1st.
- Howard County Beekeepers Association. n = 60
- Southern Pennsylvania Beekeepers Group, Hershey PA, n = 75
- Inland Empire Beekeeping Association, Spokane WA, n = 150
- Florida State Beekeepers Association, Orlando FL, n = 20
- Apimondia International Beekeeping Convention, Montreal CAN, n = 50
Project Outcomes
The results of this study will help other scientists better understand Varroa population dynamics. This will enable them to come up with more IPM and sustainable Varroa treatment options for beekeepers. These results in particular include practical IPM solutions for beekeepers to help them sustainably combat Varroa. These results have been presented to over 200 beekeepers, and have helped them understand their colony health threats. These beekeepers say they took away valuable knowledge from these study results and will incorporate the information into their Varroa treatment regimes. Collectively, this could result in decreased chemical miticide application and improve the sustainability of US beekeeping and pollination.
This project helped develop a realistic IPM approach for improving honey bee colony health. Currently, beekeepers' main tool for combating the deadly Varroa mite is chemical pesticides. Beekeepers typically have to apply repeated applications of these chemicals, likely contributing to the development of resistant pest populations. This study showed that simple, non-chemical practices can make a true difference and provide beekeepers a much needed leg up on pests. I plan to continue Varroa IPM research in my future career, and look for more sustainable solutions for beekeepers to support US agriculture. We have applied for 2 follow up grants to do with this research and are waiting to hear back.