Final report for GNE19-214
Project Information
The Varroa destructor and deformed wing virus pandemic are the most major biological threats to honey bee health globally. This study aimed to understand how different ecological factors of disease, including the immunocompromising effects of Varroa, as well as the lack of disease interventions in isolated populations of honey bees, can select for different DWV genotypes and alter disease outcomes. To understand how Varroa immunocompromising the bee affects DWV populations, I conducted experimental infections with the inclusion of hemolymph removal or triggering melanization. These experiments demonstrated that these additional factors do indeed introduce further complexity to DWV infections, and more in-depth investigation may better understand the dynamics of these DWV populations. Furthermore, through additional experimental infections with DWV isolated from naturally infected bees in NY and PA, I found differing DWV genotypes can result in differential disease, which can be used both to understand how loci within the DWV genome influence disease as well as to track the most severe genotypes that may be spreading across the US.
I used two systems in which to examine how transmission rates influence selection of different genotypes of DWV (different strains) and virulence of these strains (as measured by mortality rates of infected bees). (1) Determining if rapid transmission selects for more virulent viral populations, by a) Generating populations of viruses that have been selected under conditions of rapid transmission in the laboratory, mimicking repeated transmission by Varroa b) Evaluating if these viruses exhibit increased levels of virulence in laboratory assays, relative to non-selected viral populations c) Determining if this variation in virulence is associated with underlying viral genetic variation by conducting whole-genome sequencing of the viral populations (2) Determining if viral populations in feral bees from the Arnot Forest have reduced virulence relative to managed honey bees, by a) Collecting viruses from feral bees and bees from nearby managed apiaries b) Sequencing viral populations to identify genetic differences associated with these isolated populations c) Assessing virulence of these viral populations. Results can be used to understand how viral populations can be managed to improve honey bee survival and adaptation. Furthermore, this work will continue to be disseminated to researchers and beekeepers through publications and conferences, to develop new outreach activities, and continue to support undergraduate research experiences.
Approximately 75% of major food crops benefit from animal pollination (Klein et al., 2007), with pollination services contributing approximately $14-$23 billion annually to the US economy (Chopra, Bakshi, & Khanna, 2015). Declines in pollinators, and insect populations broadly, have been increasingly documented in recent decades (Hallmann et al., 2017; Kluser & Peduzzi, 2007; LeBuhn et al., 2012; Potts et al., 2010). Despite heavy management, US beekeepers lose an average of 40% of their colonies annually, with over 45% overwintering losses in Pennsylvania in 2017-2018 (Bee Informed Partnership, 2018). It is critical to develop sustainable approaches that mitigate the impacts of stressors to support food security and improve beekeepers’ economic outcomes.
The primary stressors driving honey bee colony losses in the Northeastern US and other temperate regions are Varroa destructor mites and Deformed Wing Virus (DWV) (Dainat, Evans, Chen, Gauthier, & Neumanna, 2012), which act synergistically to undermine bee health (Di Prisco et al., 2016). There are no methods to control DWV, though molecular approaches can be used to track levels and spread of viruses (Traynor et al., 2016). Beekeepers can only reduce DWV levels by controlling Varroa, which is accomplished primarily through repeated miticide application, which may also have negative effects on bees (Berry, Hood, Pietravalle, & Delaplane, 2013; Johnson, Pollock, Berenbaum, Anderson, & Varroa, 2009). Beekeepers typically purchase packages of bees from Southern states to replace lost colonies, but packages often have high Varroa loads and low survival rates, and thus is an expensive, unsustainable solution (SARE, 2014). As the cost of beekeeping increases, the cost of renting colonies for pollination services will also increase, which will lead growers to increase product prices to offset these costs (Calderone, 2012).
There is consequently considerable interest in breeding Varroa-tolerant or Varroa-resistant stocks of bees, including the PA Queen Improvement Project (NE SARE #FNE18-886). The ability to breed for resistance is supported by reports of feral bee populations which survive without management, such as the bees found in the Arnot Forest of New York (Seeley, 2007). However, traits associated with survival (small colony sizes, high queen turnover) are not sufficient to explain these high survival rates. It may be that instead the DWV population circulating within the Arnot Forest bees has been selected for reduced virulence due to decreased transmission rates, which have led to increased bee survival. If reduced transmission rate, leading to selection for decreased virulence (Schmid-Hempel, 2011), is a major determinant of feral honey bee population survival, then management practices must be developed to similarly decrease virus transmission rates in managed honey bee colonies.
Most efforts to develop sustainable approaches reducing the impact of honey bee stressors focus on breeding bees that are genetically tolerant or resistant to parasites or pathogens. Breeding bees that are resistant to Varroa mites typically focus on selecting for stocks that remove Varroa-infested pupae or groom Varroa off adult bees (Buchler, Berg, & Le Conte, 2010; Thomas, H, Gregory, & G, 2010). However, since honey bee queens mate with an average of 12 males far from their home colonies, it is difficult for beekeepers to maintain these traits in their stocks (Niño & Jasper, 2015). Wild populations in the Arnot Forest, though, are able to self-sustain and persist despite ubiquitous stressor exposure.
Varroa-mediated DWV transmission leads to increased titers and selection for more virulent strains (Di Prisco et al., 2016; Ryabov et al., 2014). High levels of DWV lead to deformed wings in adults, reduced activity and ability to contribute to colony tasks, and increased mortality (de Miranda & Genersch, 2010; McMahon et al., 2016; Nazzi et al., 2012). This increased mortality can unbalance the demographic structure of colonies and drive colony losses (Perry, Søvik, Myerscough, & Barron, 2016). Importantly, a vicious cycle is created by high levels of DWV that result in increased reproductive success of Varroa (Di Prisco et al., 2016), which then further transmit DWV to additional hosts. Thus, DWV, not Varroa, may be the more significant driver of colony losses.
How is it possible, then, that some feral bee populations are able to survive unmanaged despite the presence of Varroa and DWV? It is predicted that in populations where a virus cannot readily infect new hosts, where population size is small or hosts (i.e. colonies) are far apart (Nolan & Delaplane, 2017; Seeley & Smith, 2015), there should be selection for reduced viral virulence (Schmid-Hempel, 2011). These conditions may be met in the Arnot Forest, as colonies are small and more spread out than colonies in managed apiaries (Seeley, 2017). Conversely, easy transmission should select for more virulent strains, as predicted by Varroa-mediated vectoring (McMahon, Wilfert, Paxton, & Brown, 2018). I, therefore, hypothesize that the viral populations within these small, low-density feral populations have adapted reduced virulence due to decreased transmission rates.
To investigate my viral adaptation hypothesis, I characterized the effects of viral transmission rate on DWV virulence and genotype, using viral populations generated from laboratory studies mimicking Varroa transmission (rapid pupae to pupae transmission), and viral populations collected from bees from the Arnot Forest and nearby, managed apiaries. These studies provided insights into how management practices can be adjusted to reduce selection for virulent genotypes and provide molecular markers to better screen for virulent viruses. This work will not only support honey bees and beekeepers, but additionally support vital wild bee pollinator populations, which are known to share pathogens with managed honey bees (Graystock, Blane, McFrederick, Goulson, & Hughes, 2016) and have also demonstrated population crashes in the past decades, promoting sustainable pollination and agriculture in the Northeast.
Research
Honey bee samples - Honey bees were in vitro reared (Schmehl et al 2016). This allowed for controlled development across samples, and also limited other unknown environmental variables that may affect DWV infection (including exposure to DWV from the colony). Bees were collected from a research colony with a single drone inseminated (SDI) queen - this allowed for approximately 75% relatedness between sister bees due to the honey bee's haplodiploid sex-determination system, and therefore, minimized the effect of differing honey bee host genetics influencing DWV infection. This SDI colony was inspected weekly to ensure health status (ie low virus infection and low parasite load) and confirm the presence of the original queen.
Virus Isolation - Since it is not possible to general purified bee viruses, crude isolations were conducted to create two starting inoculums, as well as the subsequent inoculums from the viral passaging paradigm (see below, Virus Passaging). Virus was isolated from individual bees using the following protocol. 2ml screw-cap microcentrifuge tubes with 2mm zirconia beads within were sterilized with a UV-cross linker for 2 minutes. Bees (flash-frozen and kept at -80°C until processing) were placed into 2ml screw-cap microcentrifuge tubes, and 500ul of 1x PBS was added. Bees were homogenized using a Bead Ruptor Elite (Omni International, Kennesaw, GA) at 6.5 ms for 45 seconds. Tubes were then placed on ice then centrifuged for 3 minutes at max speed. Supernatant was removed and passed through a sterile 0.2um syringe filter to separate viral particles from honey bee cells (pellets were stored at -80°C). This crude isolate was kept at 4°C for no longer than a week (for injections and/or RNA extractions) and stored long-term at -80°C.
Virus Passaging - The starting inoculum was injected into in vitro reared honey bee pupae at the white-eyed stage (14 days post-egg-laying). Virus concentration was approximately 6 x 10^9 genome equivalents. 1.5ul inoculum was injected using a mouth aspirator with an attached 10ul capillary tube pulled into a needle. Needles were changed between treatments to avoid contamination between treatments. Two separate starting inoculums were utilized. To measure colony DWV levels and the effect of the injection itself on DWV levels, control bees (in vitro reared but further unmanipulated) and PBS-injected bees (injected with the stock viral isolation saline) were included as controls (these groups are labeled as "no inject" and "PBS").
Two additional treatments were incorporated into the virus passaging paradigm to immunocompromise bees infected with DWV. Bees were either injected with a nylon thread to induce melanization (an immune response supplementary to the main antiviral response, the RNA interference pathway) or had 1μl hemolymph removed (to mimic Varroa feeding). These groups were identified as "DWV+mel" and "DWV+hemo", respectively. Bees without any immunocompromisation were simply identified DWV+. Passaging virus through Varroa (the biological vector) was not included as proposed as mites could be successfully kept in the lab, but did not reproduce. To control for virus amplification triggered by the immunocompromisation protocol, bees were immunocompromised and injected with PBS (groups "DWV-mel" and "DWV-hemo").
Virus inoculums from samples were isolated (see above, Virus Isolation) four days after infection, and all groups were passaged five times. See Figure 1 for all 10 included groups.
Figure 1. Groups included in the immunocompromised bees viral passaging paradigm.
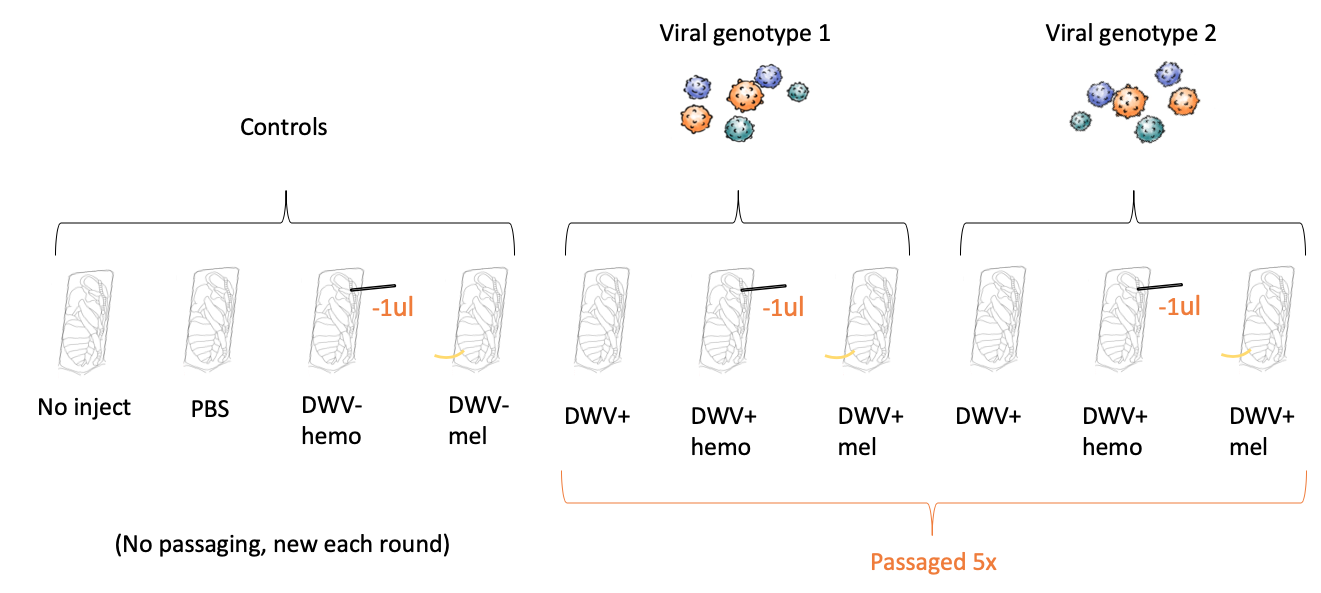
To passage virus, viral inoculums with confirmed DWV (see below, Virus Quantification) was injected into a new in vitro reared honey bee pupae at the white-eyed stage using the described method - 1.5ul injection using a mouth aspirator and capillary needles - and isolated again 4 days post-injection. Inoculums isolated from bees with additional treatments (ie hemolymph removal or triggered melanization) were again injected into bees with the same treatment as the previous passage (ex DWV+hemo inoculum into another bee with 1μl hemolymph removed, etc.). This method was repeated until virus populations were passaged 5 times.
Virus Quantification - RNA was extracted from 30ul of each virus inoculum using a Direct-zol RNA Miniprep kit (Zymo Research, Irvine, CA) following the manufacturer's protocol. cDNA was prepared from each sample using a High-Capacity cDNA Reverse Transcription Kit with RNase Inhibitor (ThermoFisher Scientific, Maltham, MA) the following way : 1ul of 10x Buffer, 0.4ul of 25x dNTP mix, 1ul of 10x random primers, 0.5ul of Reverse Transcriptase, 0.5ul of RNAse Inhibitor, and 3.4ul of RNA. cDNA was diluted 1:20x to allow a sufficient amount of cDNA for all qPCR reactions. qPCR was conducted using PowerUp™ SYBR™ Green Master Mix (ThermoFisher) in the following way : 5ul SYBR, 1ul of 10x Forward Primer, 1ul of 10x Reverse primer, 1ul of water, and 2ul cDNA. qPCR was conducted using a 7900HT Fast Real-Time PCR system (Applied Biosystems) under the following parameters: 50°C for 2 minutes, 95°C for 10 minutes, then cycle 40x 95°C for 15 seconds and 60°C for one minute, and then a dissociation stage step for melting curve analysis. qPCR primers can be found in Table 1.
Table 1. Primers used in this study to quantify DWV-A and DWV-B within viral populations. S8 was used to confirm successful RNA extraction and cDNA conversion.
|
Primer name |
Primer sequence (5’ to 3’) |
Reference |
|
DWV-A+B F |
GTTTGTATGAGGTTATACTTCAAGGAG |
Ryabov et al 2014 |
|
DWV-A+B R |
GCCATGCAATCCTTCAGTACCAGC |
|
|
DWV-B CP F |
CTGTAGTTAAGCGGTTATTAGAA |
Ryabov et al 2014 |
|
DWV-B CP R |
GGTGCTTCTGGAACAGCGGAA |
|
|
DWV-A CP F |
CTGTAGTCAAGCGGTTACTTGAG |
Ryabov et al 2014 |
|
DWV-A CP R |
GGAGCTTCTGGAACGGCAGGT |
|
|
DWV-B NS F |
TTCATTAAAACCGCCAGGCTCT |
Ryabov et al 2014 |
|
DWV-B NS R |
CAAGTTCAGGTCTCATCCCTCT |
|
|
DWV-A NS F |
TTCATTAAAGCCACCTGGAACA |
Ryabov et al 2014 |
|
DWV-A NS R |
CAAGTTCGGGACGCATTCCACG |
|
|
eIF3-S8 F |
TGAGTGTCTGCTATGGATTGCAA |
Alaux et al 2009 |
|
eIF3-S8 R |
TCGCGGCTCGTGGTAAA |
|
|
BQCV F |
TTTAGAGCGAATTCGGAAACA |
Boncristiani et al 2012
|
|
BQCV R |
GGCGTACCGATAAAGATGGA |
Arnot Forest Collections - Bees were collected from 13 sites across NY and PA (Figure 2). Collections were conducted between September 19 to October 14, 2019, between 10AM-5PM on sunny, warm (mid 60's-mid 70's°F) days, by Allyson Ray and Dr. Thomas Seeley. Bees were captured using insect nets and knocked out on dry ice and then placed into 15ml conical tubes by site and kept on dry ice. Wild Arnot Forest bees were collected while foraging on flowers (n = 5-12 bees/site), and bees from managed colonies were collected from colony entrances, preferentially selecting obvious foragers (indicated by pollen-filled corbiculae) when possible (n = 2-5 colonies/apiary, 10-15 bees/colony). Upon returning from the field, bees were placed at -80°C for long term storage. See Table 2 for details.
Figure 2. Collection sites (From top to bottom, left to right : Site 3, 8, 9, 10, 11, 12, 13)
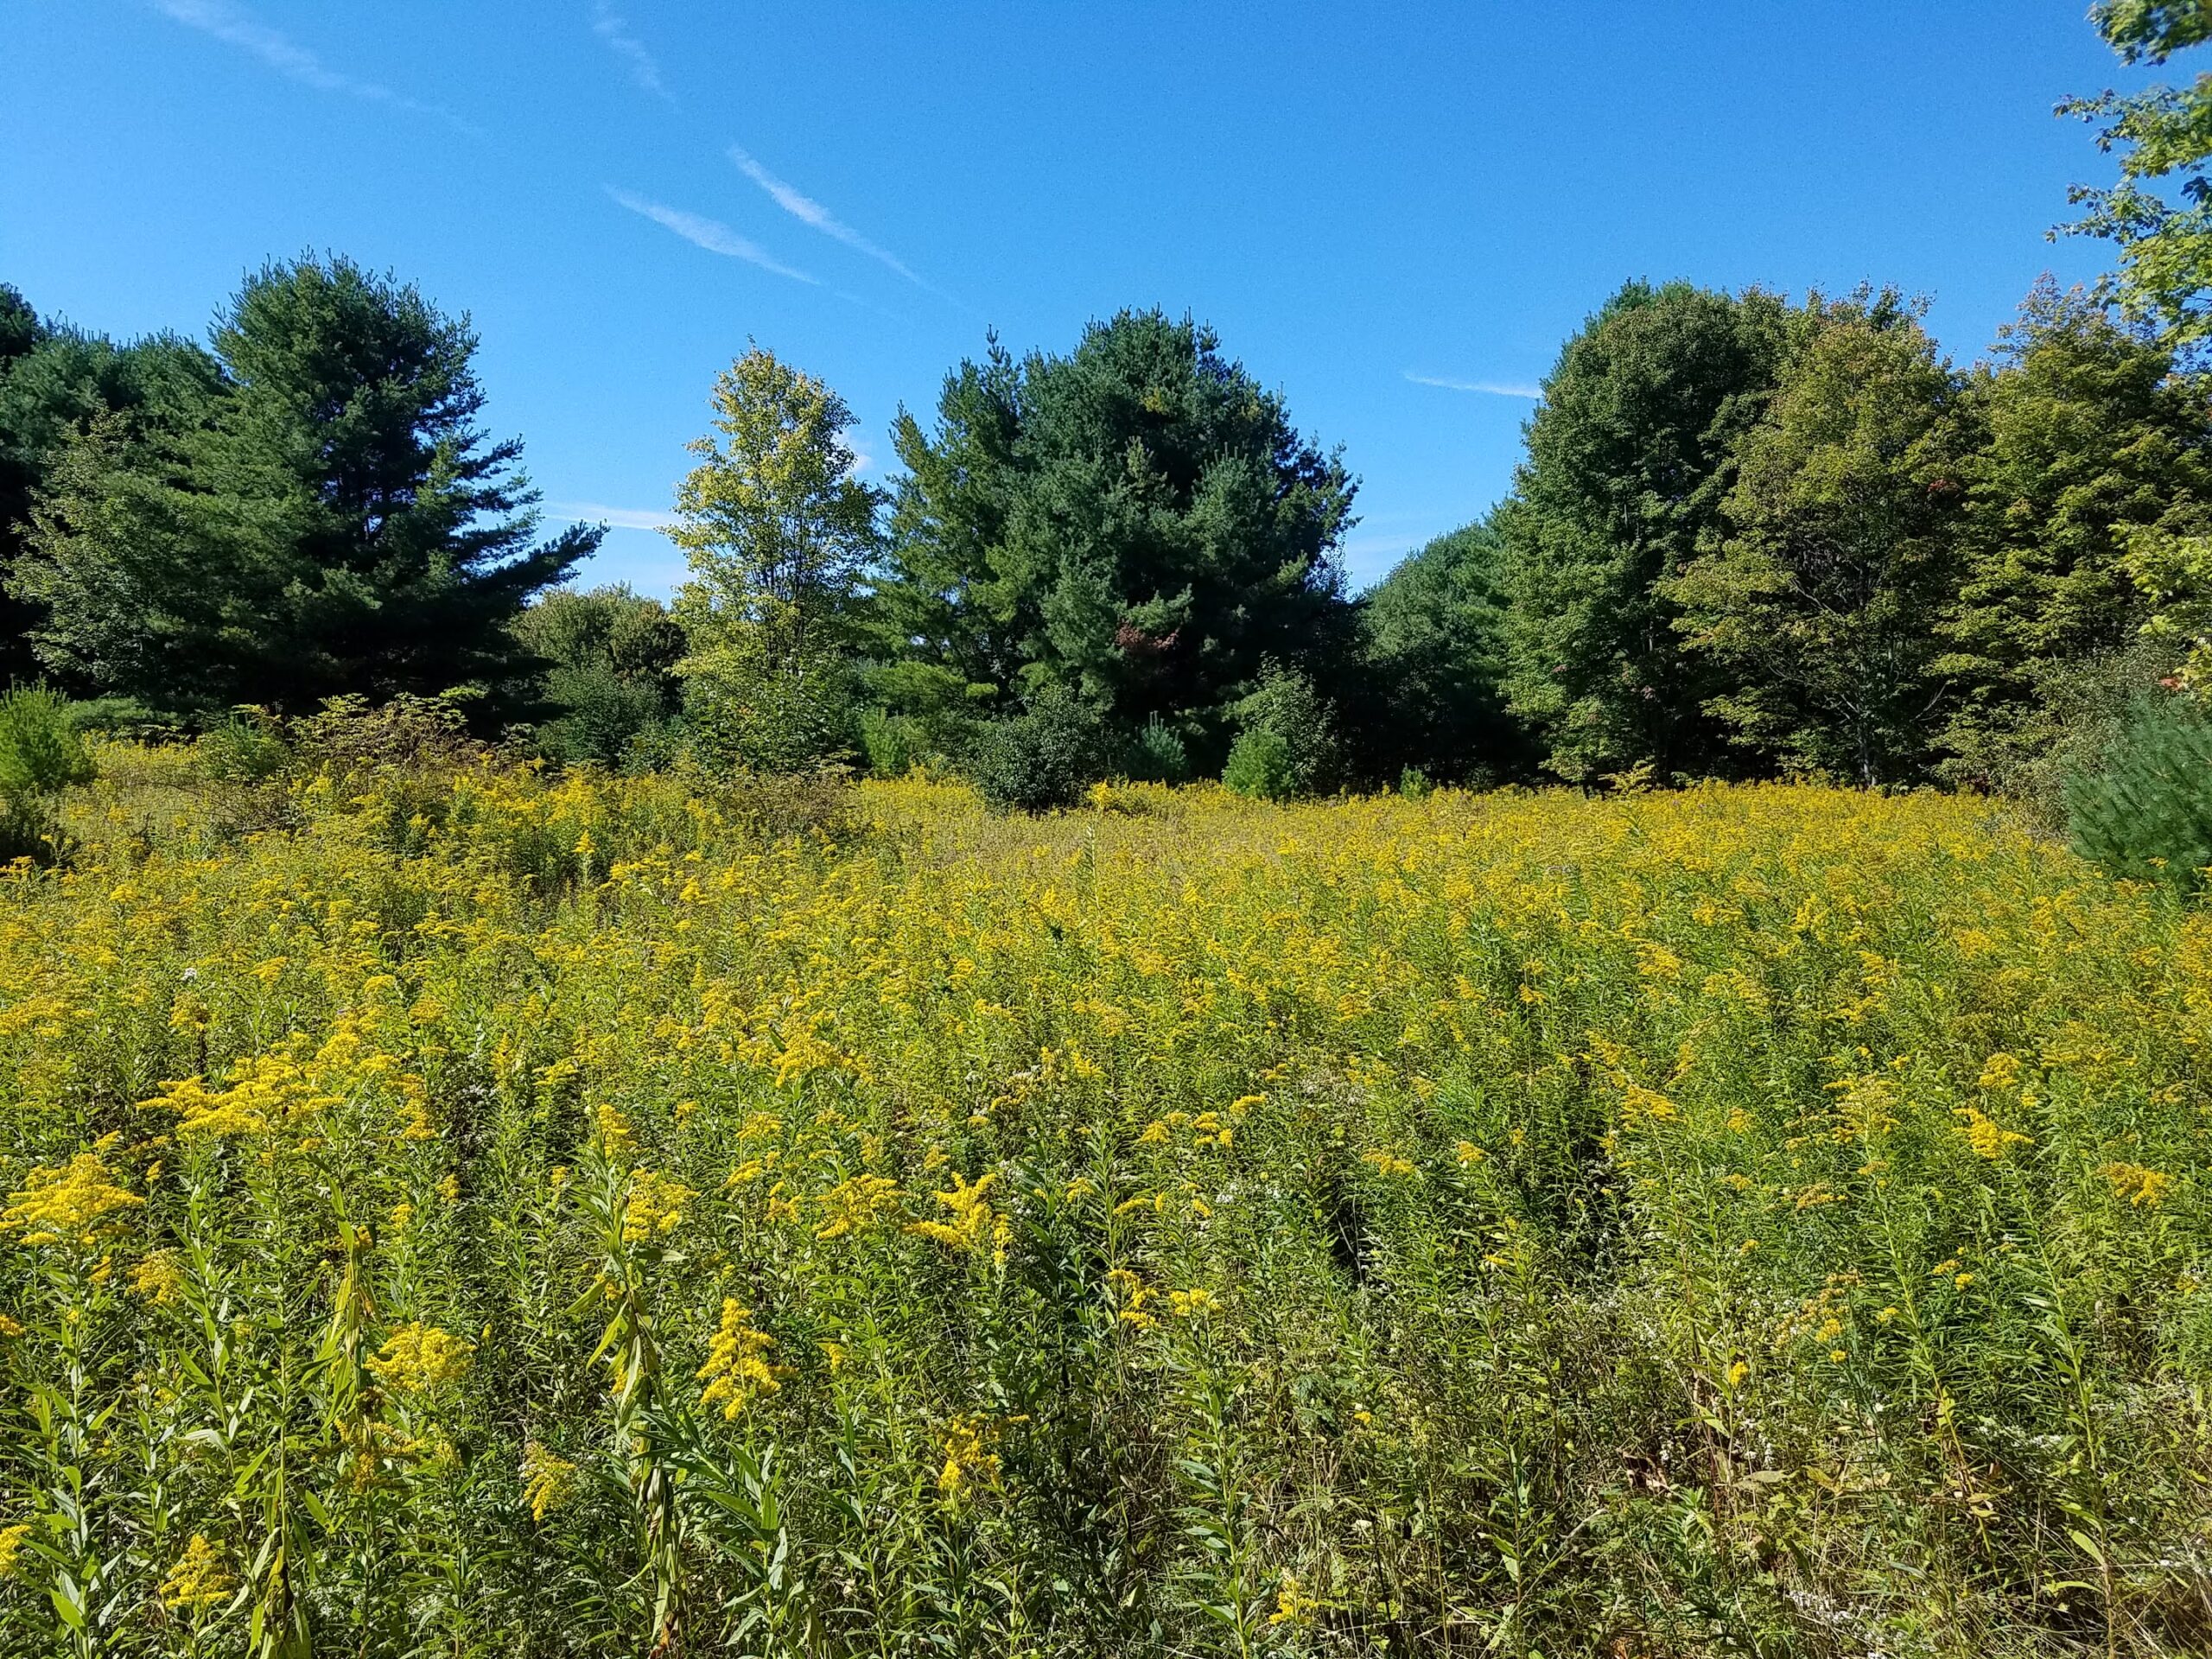
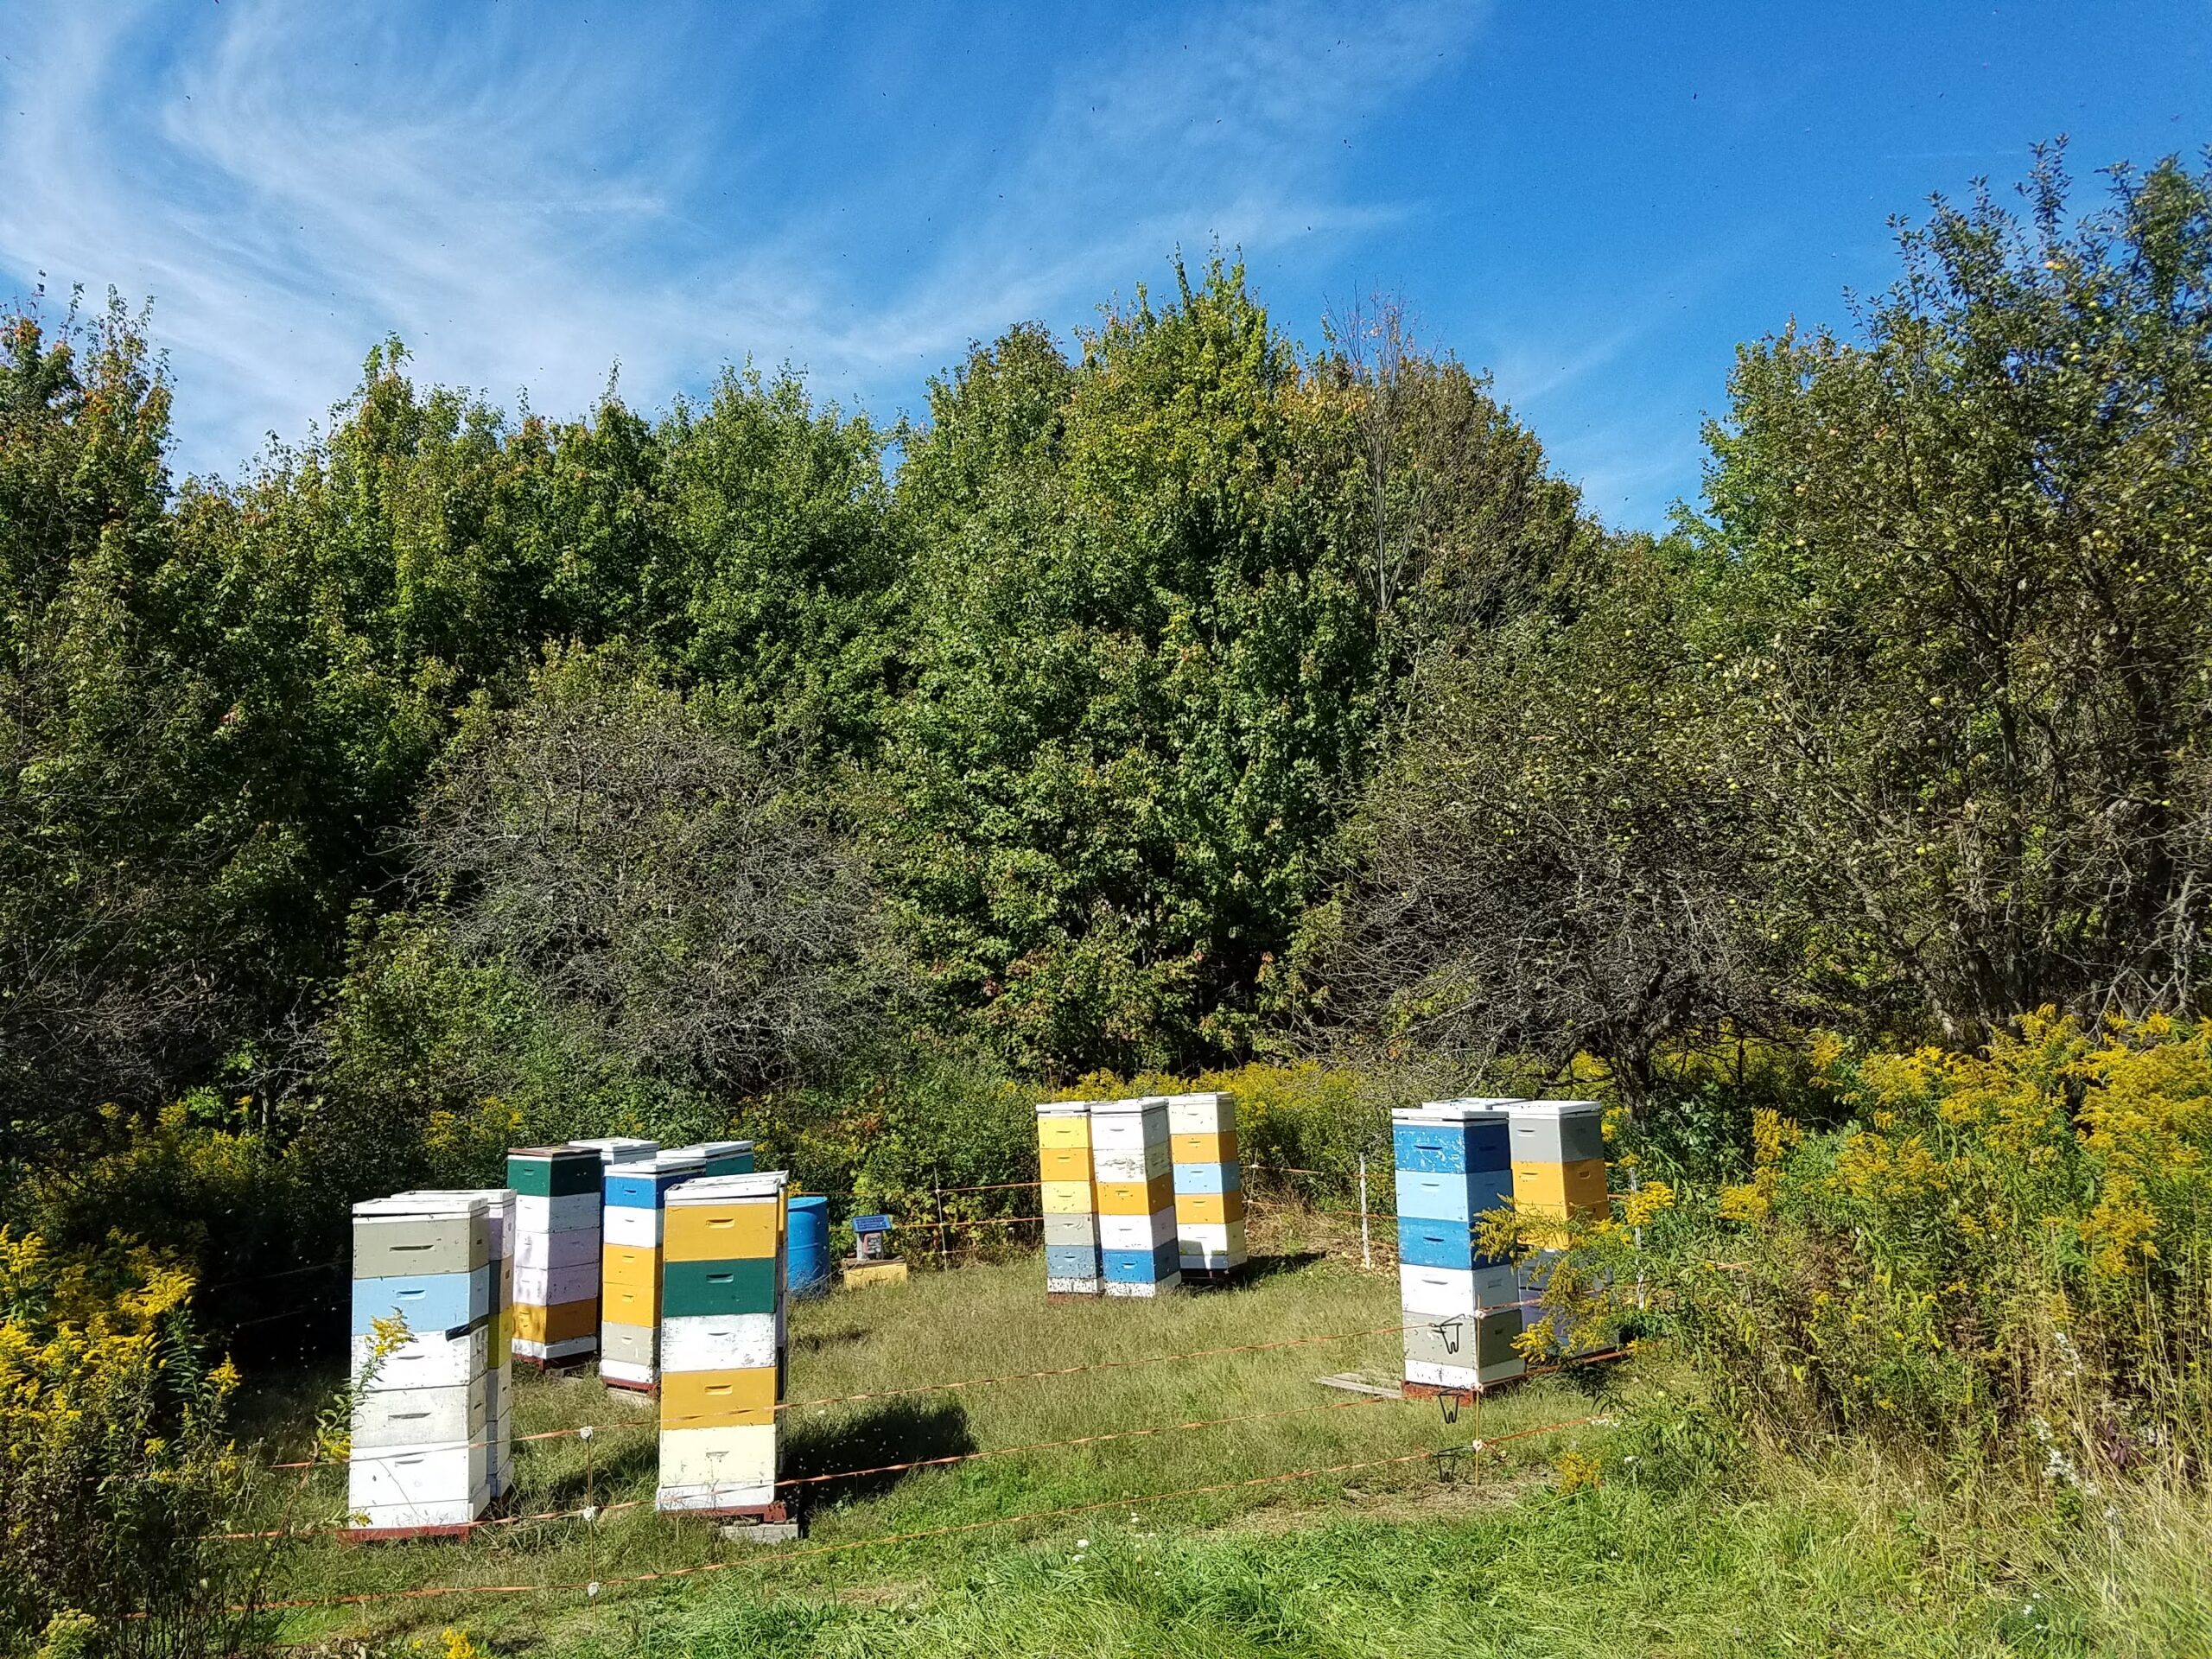
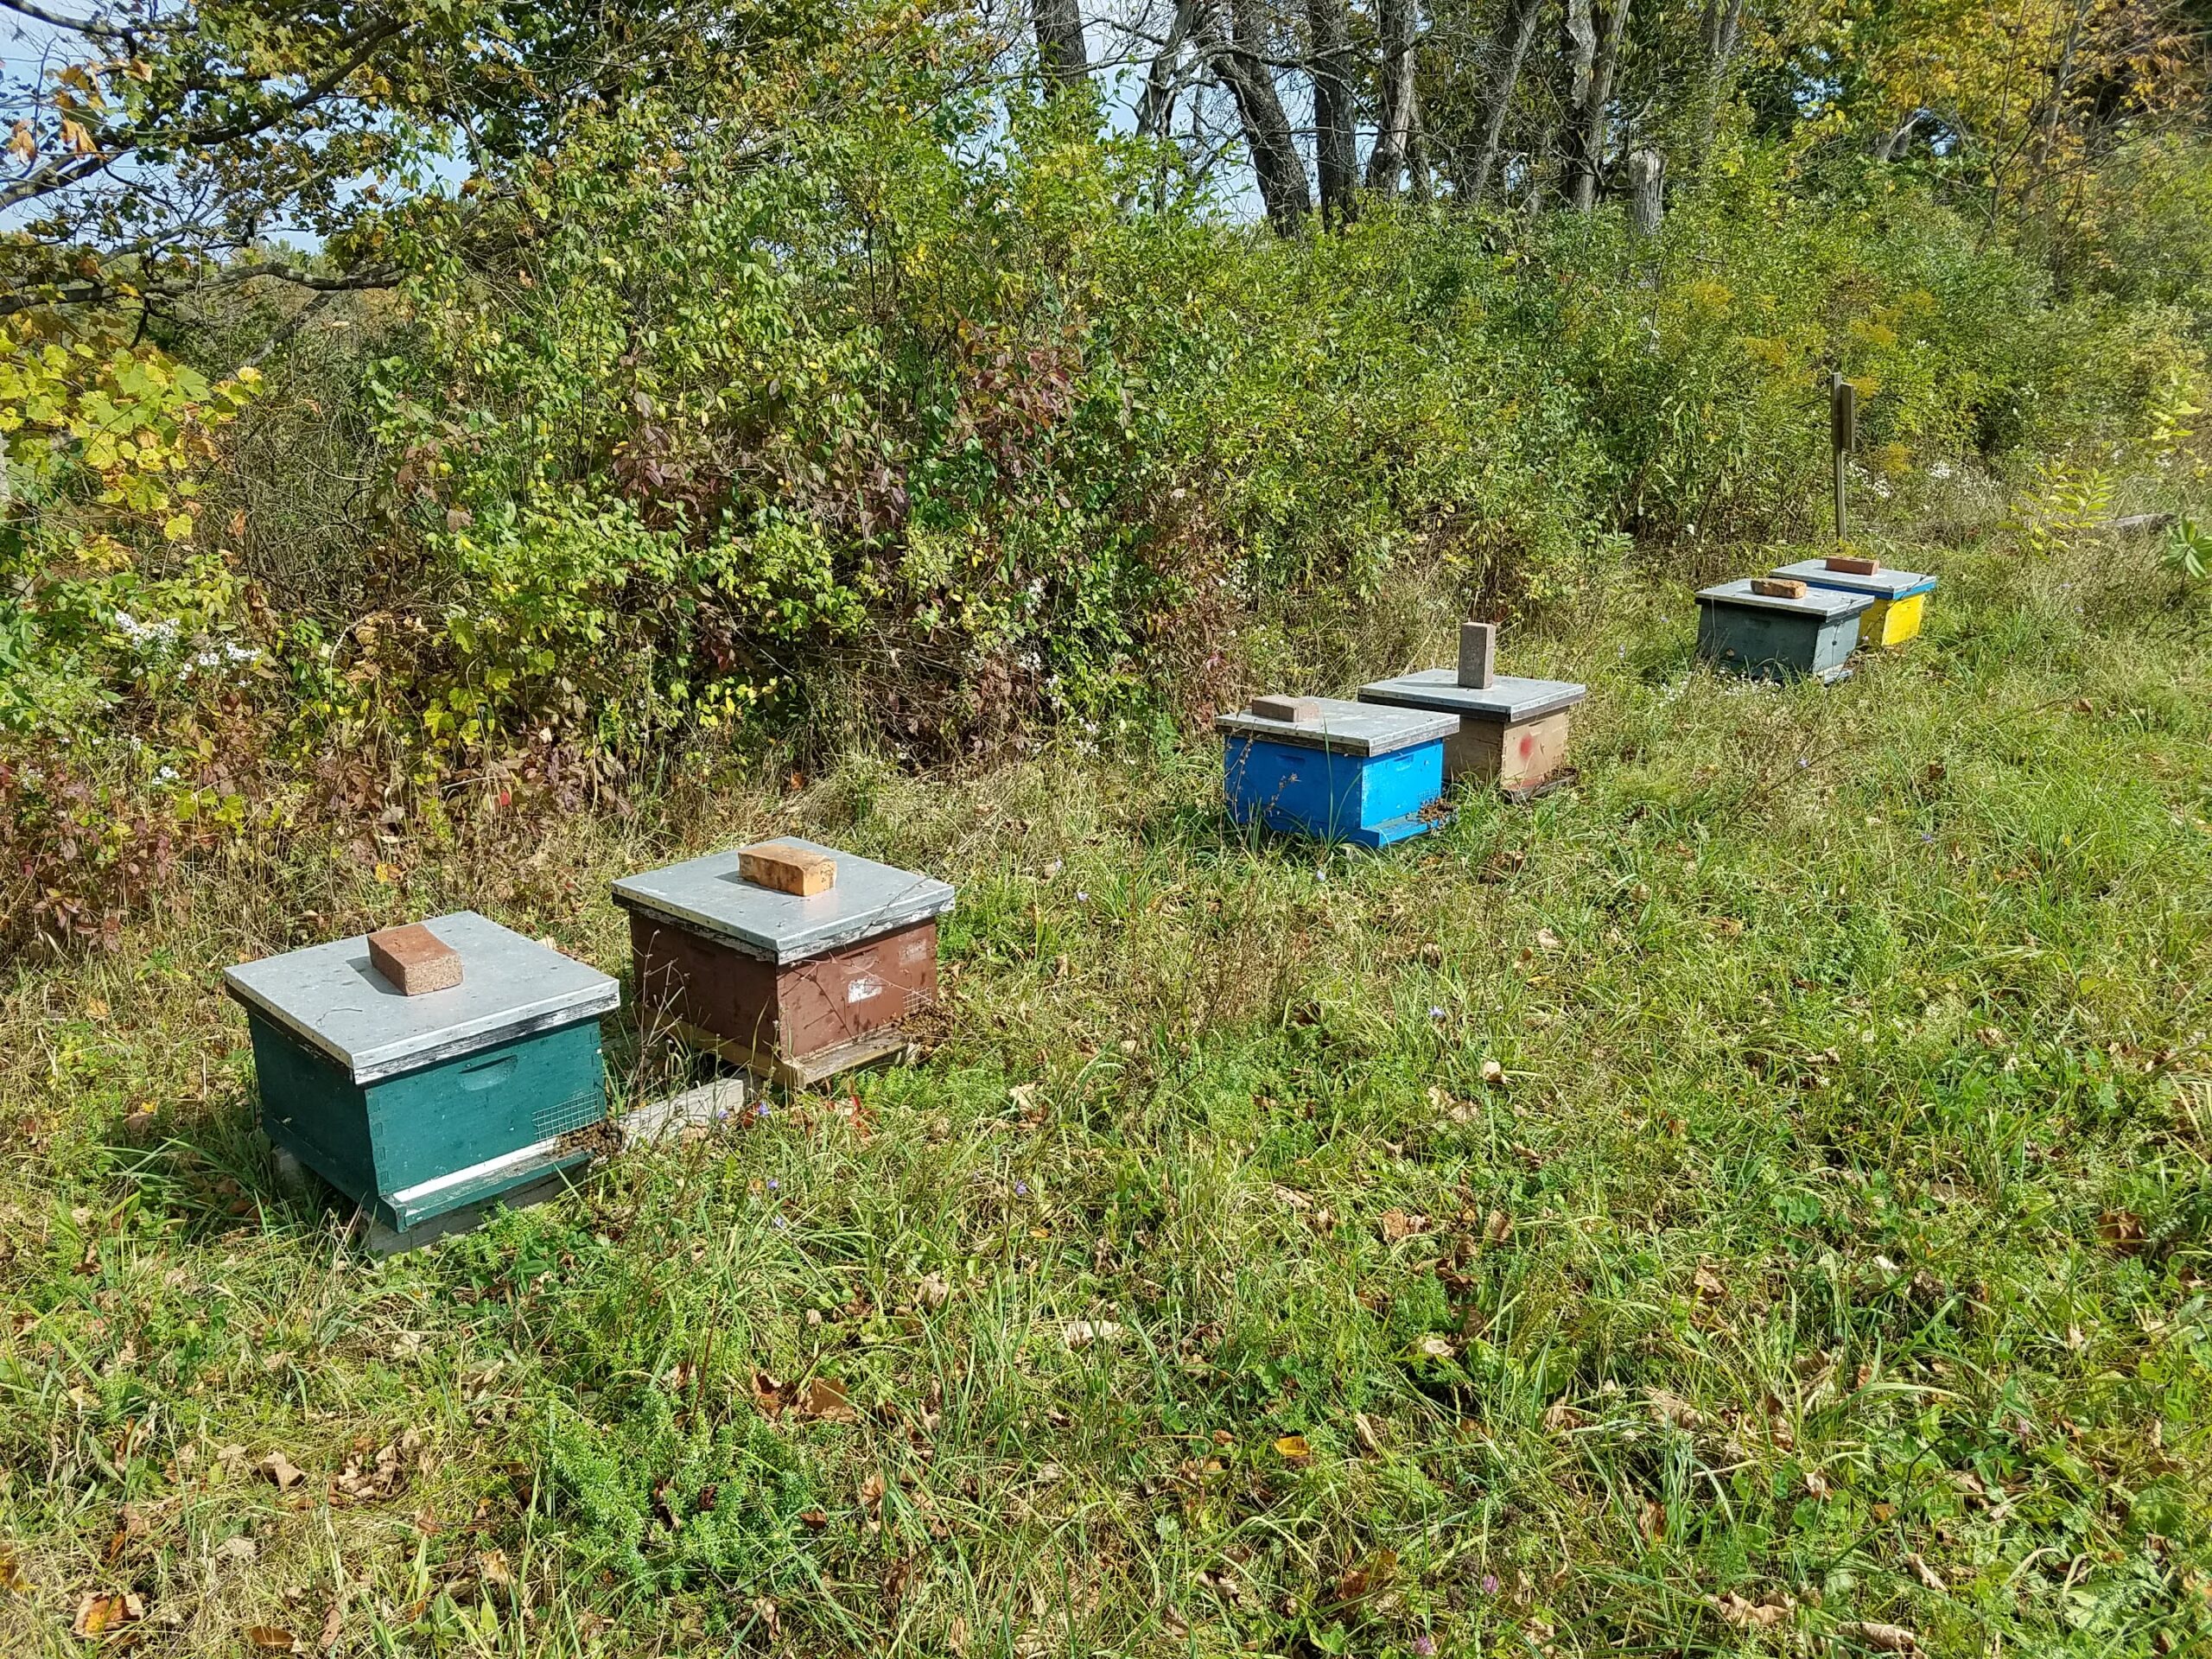
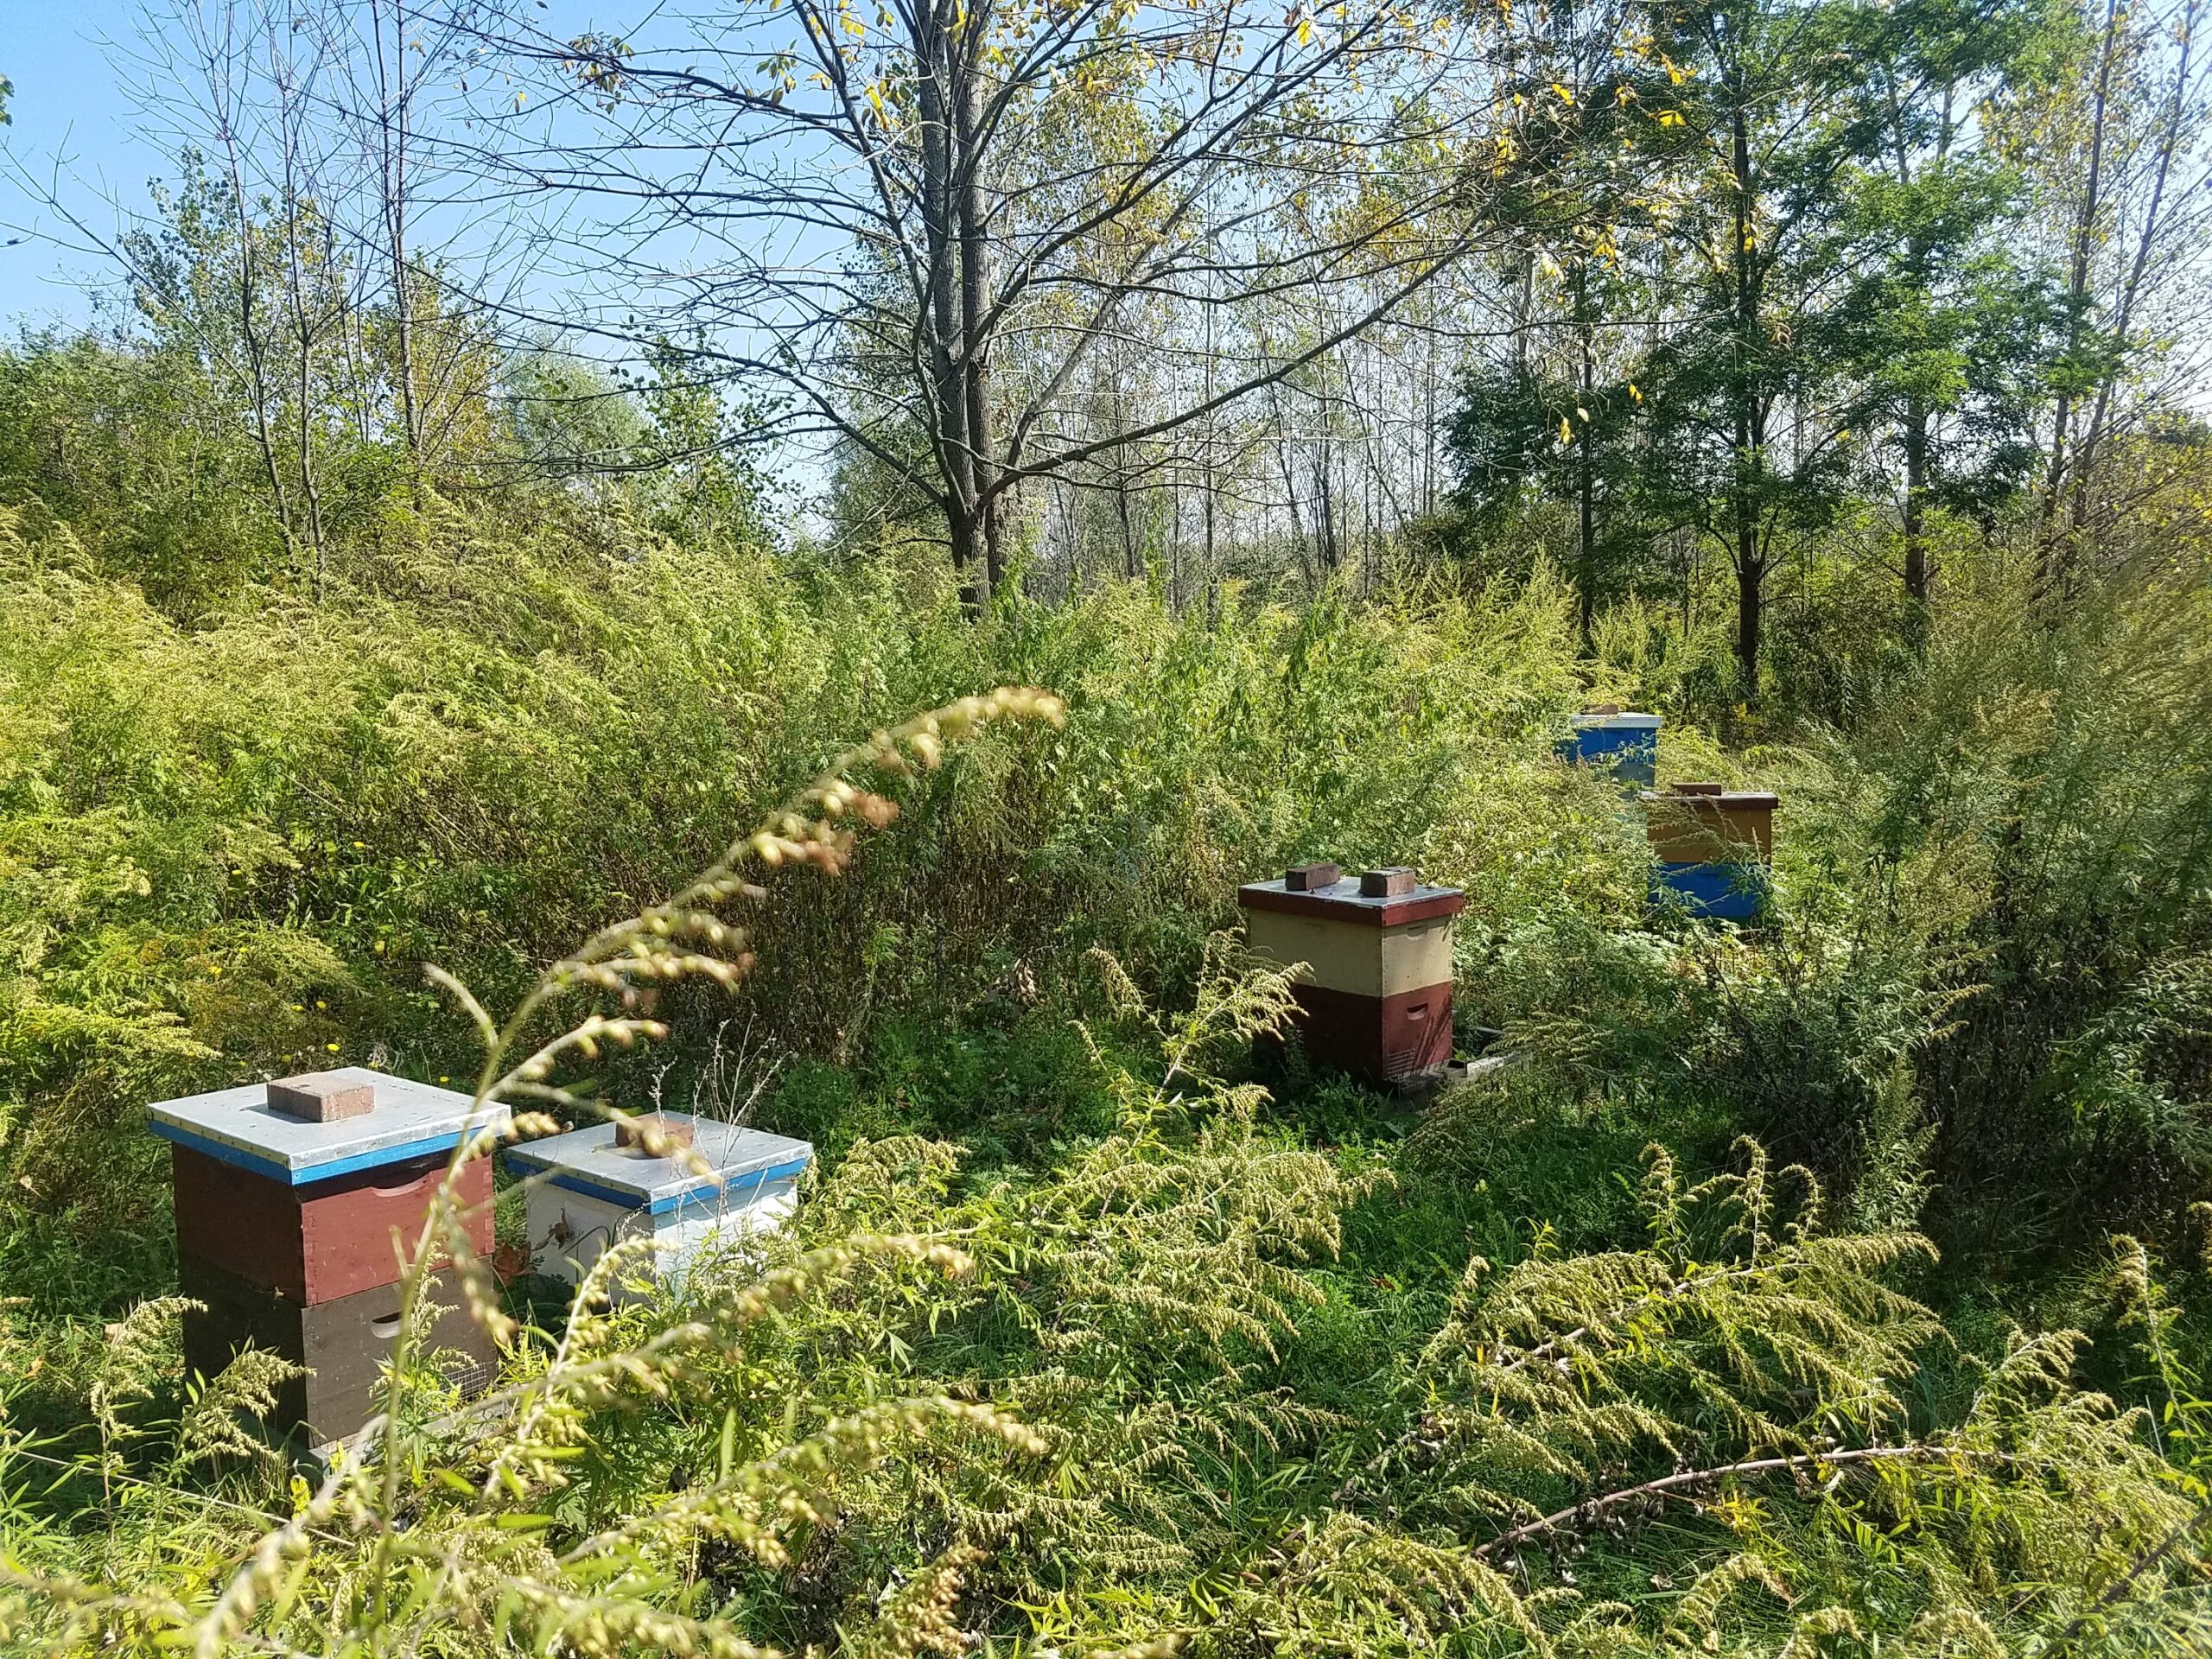
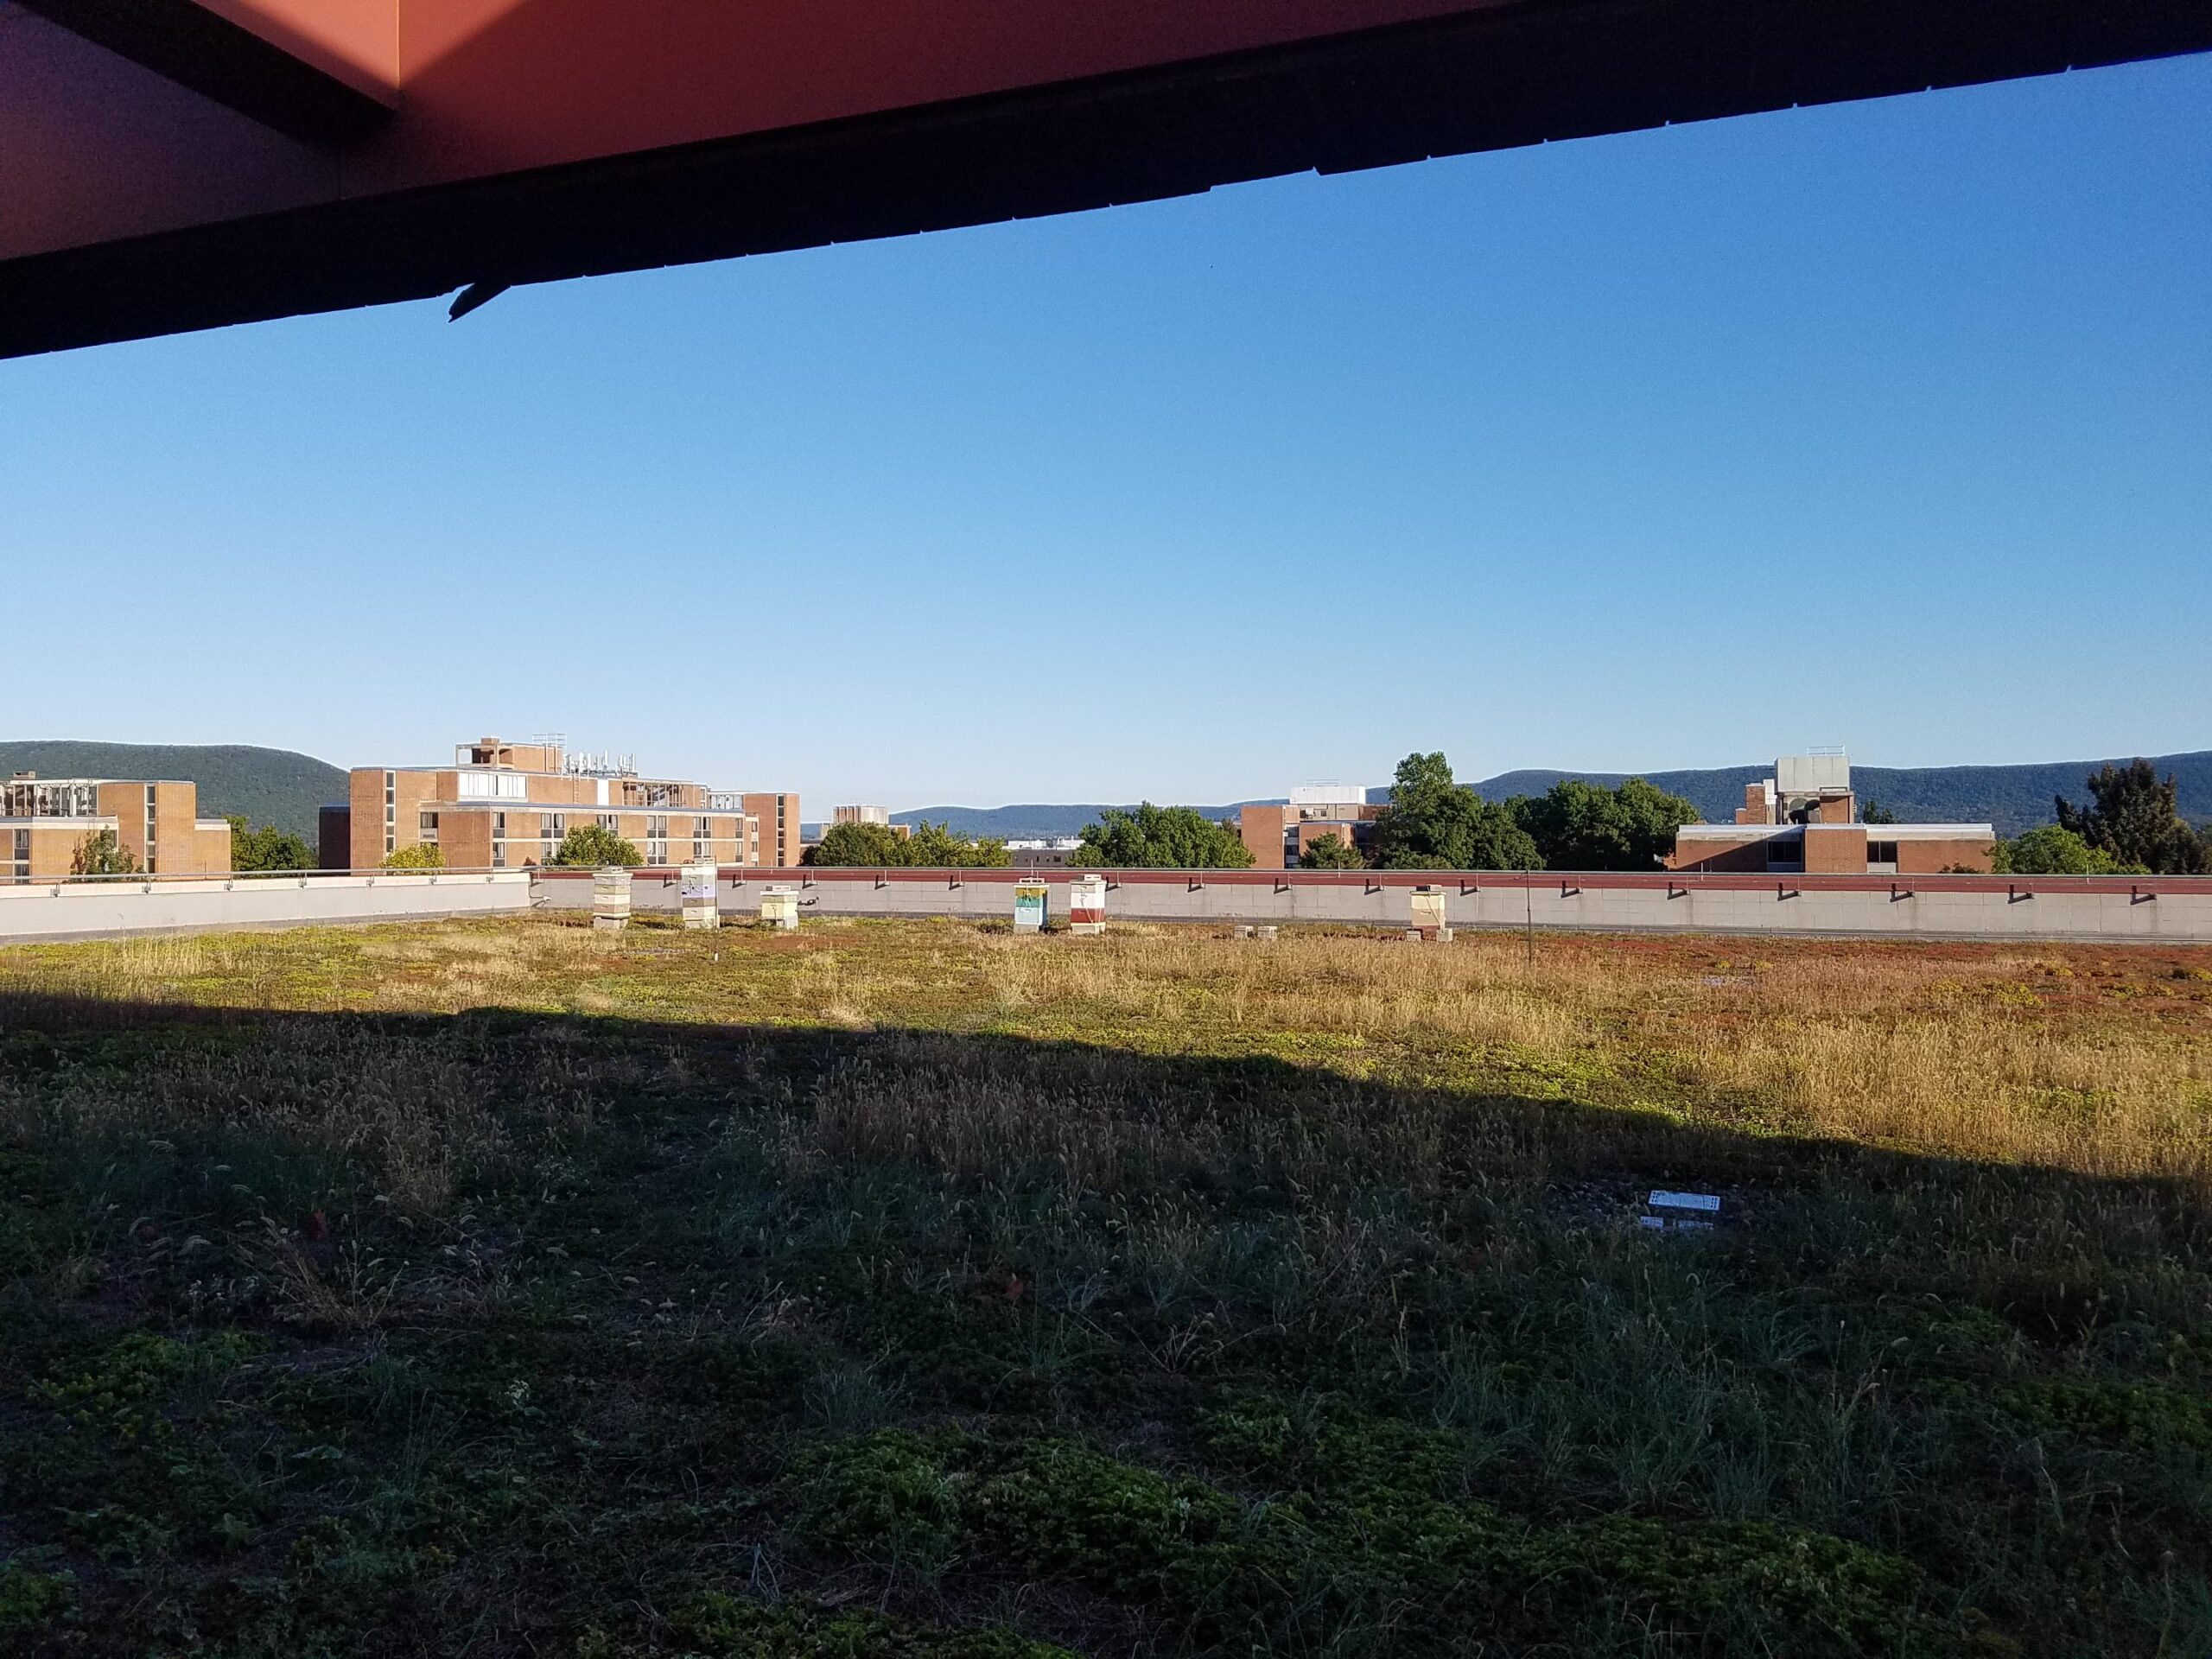
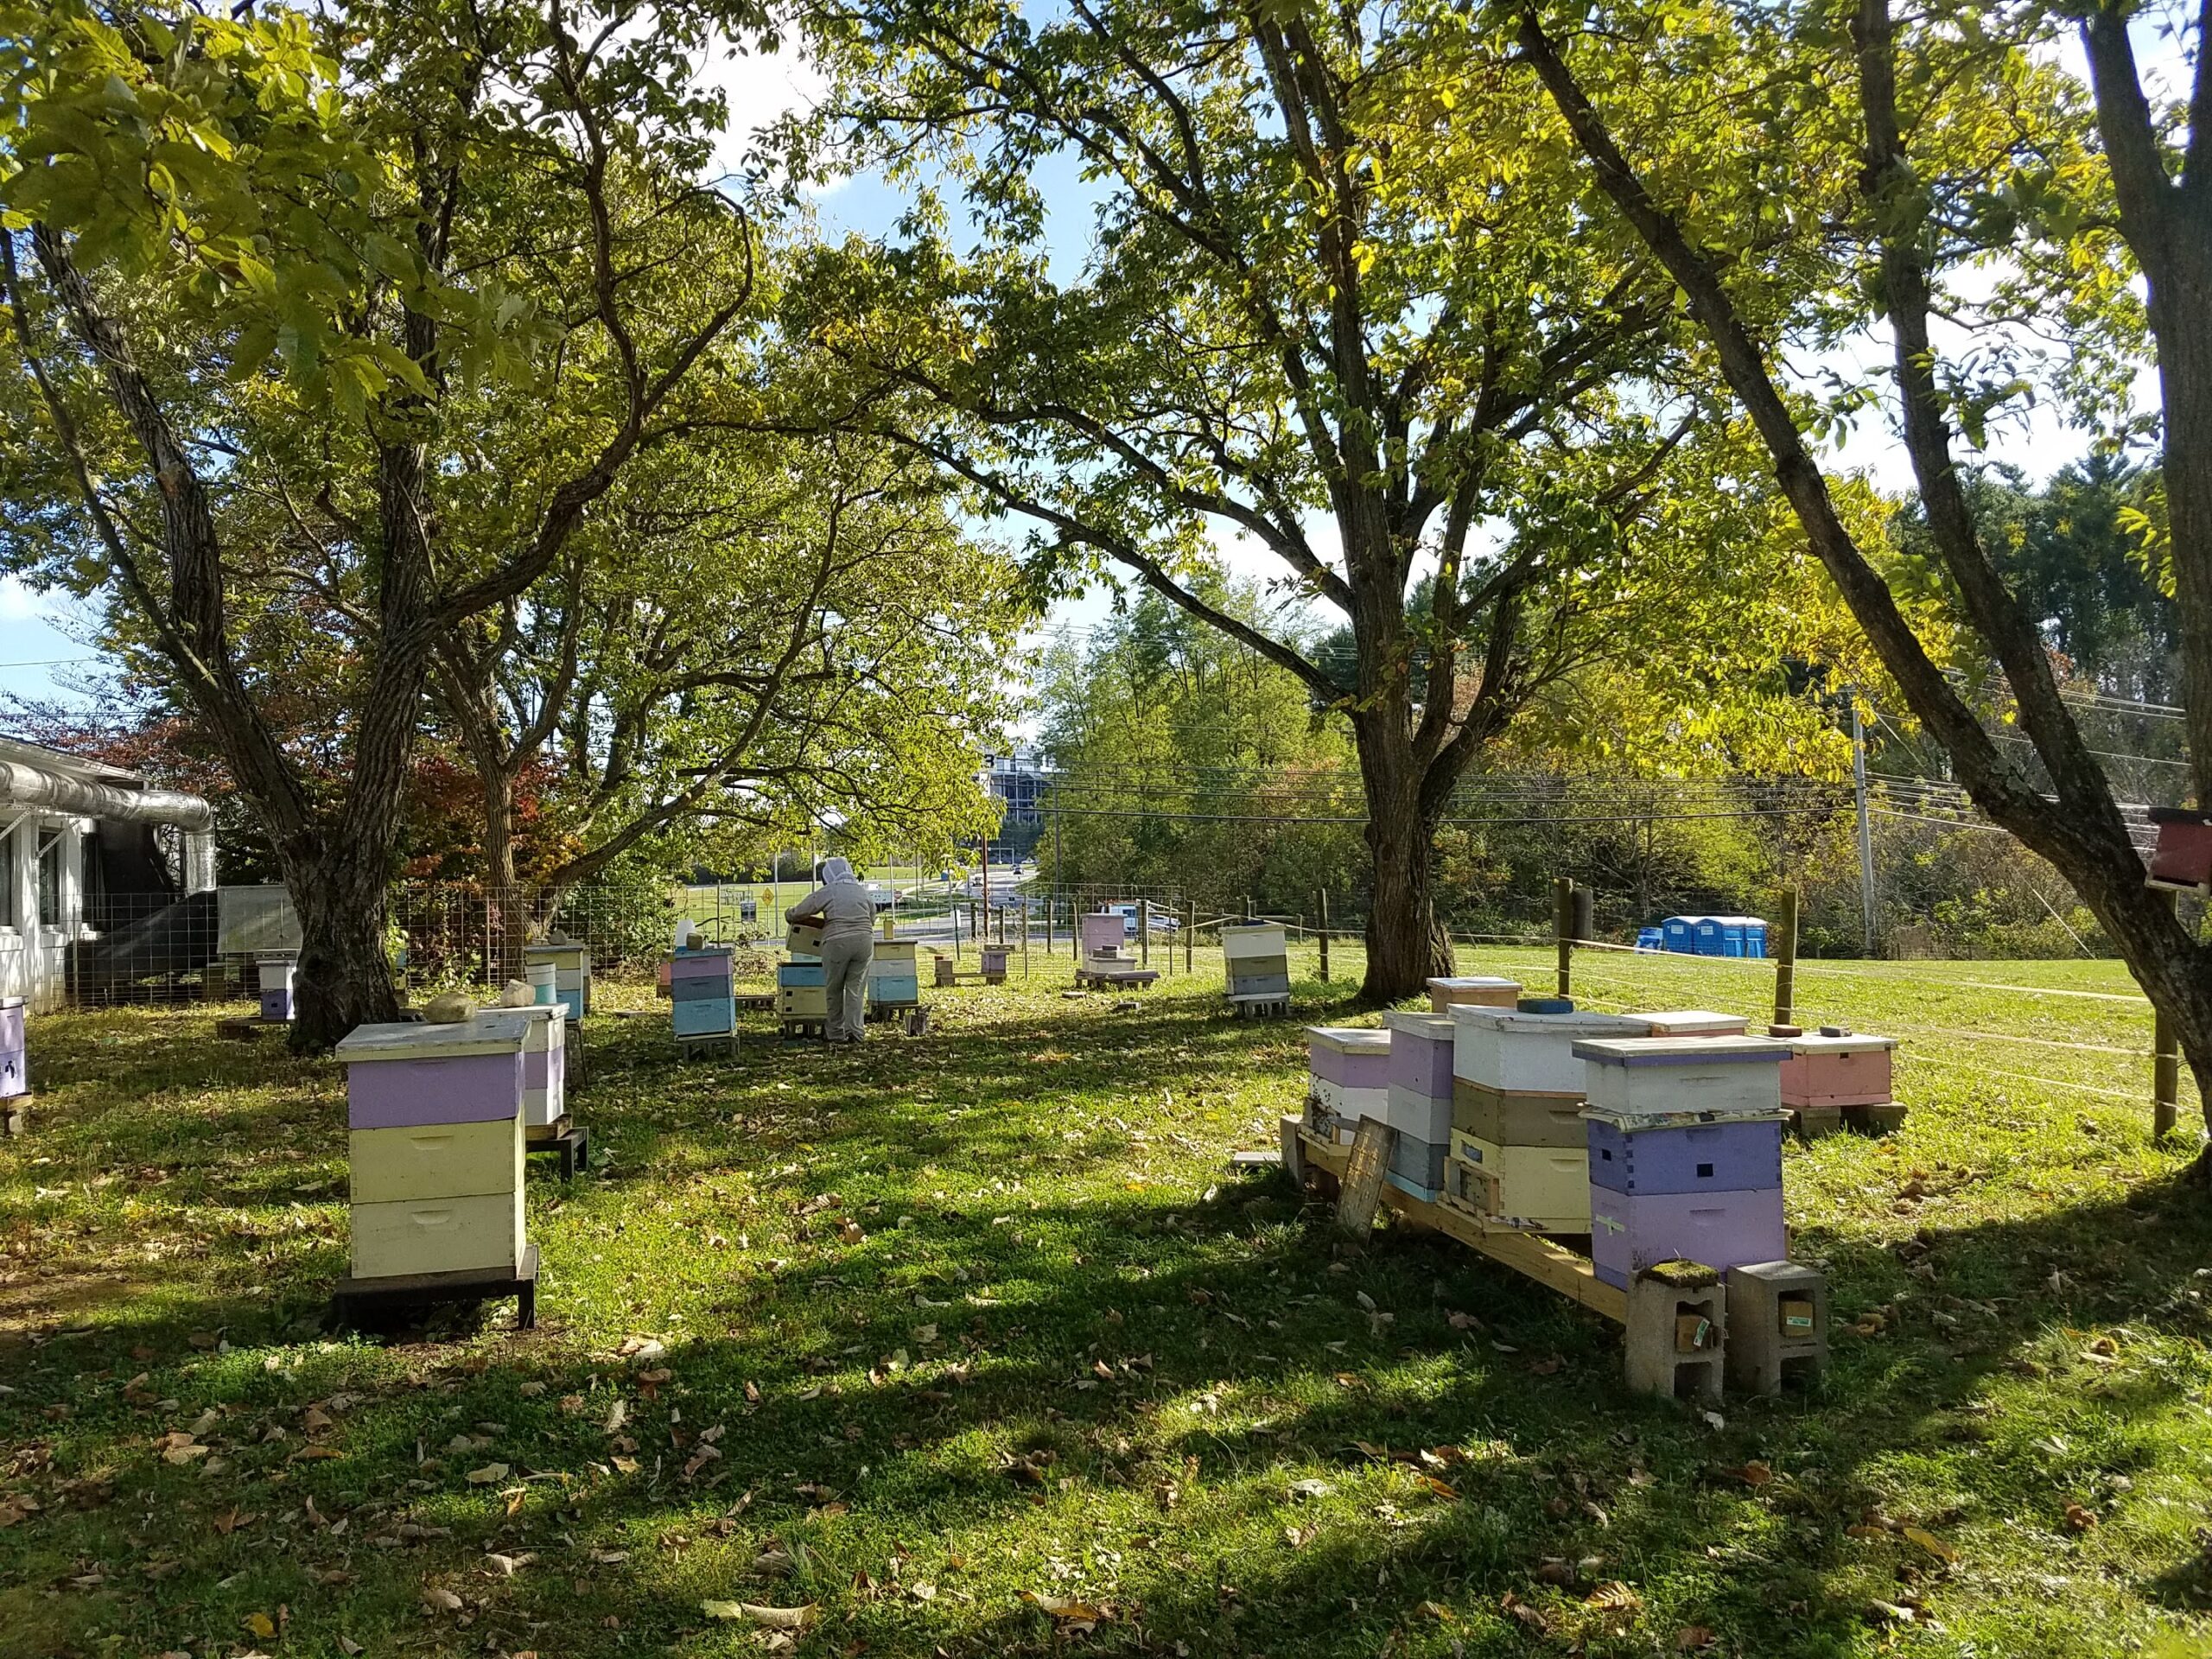
Table 2.
| Date of collection | Site | Location | Colony | # bees |
Description / notes
|
| 9/19/2019 | 1 | 42.278775, -76.619141 | N/A | 10 |
Road on East boundary, abandoned barn
|
| 2 | 42.261283, -76.628128 | N/A | 5 |
Sugar mill, south entrance to forest, small site, not much to collect
|
|
| 3 | 42.276844, -76.657628 | N/A | 11 | near center? sites 3 and 4 were GREAT collecting sites | |
| 4 | 42.285173, -76.658358 | N/A | 12 |
also near center, about 0.5mi as the bee flies
|
|
| 5 | 42.293468, -76.656313 | N/A | 6 |
North road, large logging site, dry and hard to collect from
|
|
| 6 | 42.2944444,-76.6386111 | N/A | 11 |
Green Springs natural cemetery preserve
|
|
| 7 | 42.256238, -76.656220 | N/A | 10 |
Southeast boundary, near road - bees on little white asters
|
|
| 8 | 42.308280, -76.572549 | 1-5 | 15/colony |
commercial apiary outside of Arnot
|
|
| 10/1/2019 | 9 | 42.434992, -76.390923 | 1 | 11 |
Ellis Hollow apiary - returning foragers
|
| 2 | 10 |
Ellis Hollow apiary - Not super mean but defensive (Tom got stung!)
|
|||
| 3 | 11 |
Ellis Hollow apiary - no visible pollen on "foragers"
|
|||
| 10 | 42.386705, -76.394294 | 1 | 10 |
Brooketondale Apiary, Dunlap meadow - California Q
|
|
| 2 | 10 |
Brooketondale Apiary, Dunlap meadow - Vermont Q
|
|||
| 3 | 10 |
Brooketondale Apiary, Dunlap meadow - Wild caught Q (captured summer 2018, so had overwintered)
|
|||
| 11 | 42.500471, -76.434303 | 1 | 10 |
Niemi Road Apiary - noticeable pollen collecting
|
|
| 2 | 12 |
Niemi Road Apiary - lots of drones? Didnt see any pollen
|
|||
| 3 | 10 |
Niemi Road Apiary
|
|||
| 10/9/2019 | 12 | 40.801257, -77.859579 | 1 | 12 |
Millennium Science Complex Rooftop apiary - Colony 50 (the "mean" one) 2 deeps and medium, strong, but lots of phoetic mites
|
| 2 | 12 |
Millennium Science Complex Rooftop apiary - Colony 53, the one right next door, 1 deep 2 mediums, also strong - mite count 1 day prior : 6/300
|
|||
| 10/14/2019 | 13 | 40.823654, -77.867992 | 1 | 12 |
Beneficial Arthropod Research Facility apiary - Colony 16, high mites
|
| 2 | 12 |
Beneficial Arthropod Research Facility apiary - Colony 15 (12 mites/ 300 bees on 10/8/2019) Possibly new queen this 2019 Summer
|
|||
| 3 | 12 |
Beneficial Arthropod Research Facility apiary - Colony 36, low mites (2/300) w/ new queen this summer 2019
|
Virus Isolation and Quantification - Virus from Arnot forest collections was isolated and quantified as described above, with the exception that, for Presence/Absence consideration, cycle threshold (ct) from qPCR experiments had to be less than 30 to be considered 'infected'.
Sequencing of subset and analysis – As BQCV was in low abundance across our samples, we focused on DWV for deep sequencing analysis. RNA extracted from a subset of virus isolations with higher DWV levels were submitted to the Pennsylvania State Genomics Core Facility (University Park, PA, USA) for library preparation and sequencing. Libraries were prepared from viral populations of individual bee samples across the Arnot forest samples as well as the managed honey bees from New York and Pennsylvania. The 28 samples were sequenced on the Illumina Miseq platform, resulting in 150 nucleotide paired-end stranded mRNA reads. Total reads per sample ranged between 274,942 – 753,035. Reads were assessed for quality with FastQC and quality trimmed with Trimmomatic (option SLIDINGWINDOW:4:25).
DWV consensus DWV-A and DWV-B genomes were built using methods described in Ray et al 2021. Briefly, genomes were created by aligning reads from each sample to DWV-A and -B reference genomes from NCBI (Ref. NC_004830.2 and NC_006494.1, respectively) using Hisat2 (Pertea, Kim, Pertea, Leek, & Salzberg, 2016). Using bcftools (Li, 2011), variants were called and the consensus fastq sequence file generated, and from the resulting fasta files, bases with qualities less than 20 were converted to Ns using seqtk (Li, 2013). DWV levels were still mostly low in these samples, but full-length genomes were constructed for 10 samples. This resulted in 11 consensus genomes (one sample, 13-1-E was naturally co-infected with DWV-A and DWV-B). Reads were also aligned to a third variant of DWV, variant C, as well as other common bee viruses – less than 0.06% of reads within each sample aligned to DWV-C (CEND01000001.1), and less than 0.35% of reads within each sample aligned to other common bee viruses in the USA (acute bee paralysis virus (NC_002548.1), black queen cell virus (NC_003784.1), chronic bee paralysis virus (NC_010711.1), Israeli acute paralysis virus (NC_009025.1), Lake Sinai virus 2 (NC_035467.1), sacbrood virus (NC_002066.1), and thus these viruses were not further examined within the sequence data.
For phylogenetic analyses, Multi-sequence alignments of generated consensus genomes and additional reference genomes (DWV-A reference (NC_004830.2), DWV-B reference (NC_006494.1), and DWV-C (CEND01000001.1)) were generated with Clustal Omega using default settings. Multisequence alignment was then imported into MEGAX for Maximum likelihood tree construction with default settings and bootstrapped using 1000 replicates, (Kumar, Stecher, Li, Knyaz, & Tamura, 2018). Consensus genomes, as well as raw sequence reads, will be uploaded to the NCBI Genome and SRA database (accession numbers to be assigned).
Honey bee samples for experimental infections – Bees were collected in August through September 2021 from a Penn State University research apiary. Two different colony (genotypes) were utilized in this study. One colony was led by a single drone inseminated (SDI) queen – this allowed for approximately 75% relatedness between sister bees due to the honey bee’s haplodiploid sex-determination system (Winston, 1991), and therefore, minimized the effect of differing honey bee host genetics influencing DWV infection. The other colony was led by a naturally (i.e. multiply) mated queen. Prior to infection studies, colonies were assessed for viral infection via PCR and found no-low indication of common bee viruses. Both colonies were inspected weekly to ensure health status (i.e. no obvious signs of viral disease and low parasite load) and confirm the presence of the original queen.
Experimental infections – DWV populations from the sequencing analysis were additionally assessed for infection phenotype in the Summer of 2021. In order to reach a high titer of virus, inoculums were propagated in pupae collected from a DWV-free (assessed via qPCR) colony. Pupae at the white-eyed stage (14 days post egg-laying) were injected with the viral isolates, then collected 4 days post-injection (4DPI) as described above, and aliquoted to minimize the number of free-thaws. Virus was quantified (as described above) and assessed for co-infected bee viruses including BQCV, SBV, and the paralysis suite of bee viruses. Prior to injections, propagated virus populations were then normalized to two doses : approximately 10^6 genome equivalents per microliter and approximately 10^2 genome equivalents per microliter. Virus being actively used was kept at 4C for no longer than 3 days.
Pupal collections and infections were conducted in a UV sterilized hood to minimize contamination by mold and other microbes. Virus populations were injected into honey bee pupae at the white-eyed stage. White eye pupae were collected from the colony by uncapping worker cells and carefully removing pupae from their cell. Pupae that showed eye pigmentation (indicating older than 14 days old), melanization (indicating injury during collection), or Varroa within their cell were not utilized for infections. 1ul inoculum was injected using a mouth aspirator with an attached 10ul capillary tube pulled into a needle. Needles were changed between inocula to avoid contamination. To measure colony DWV levels and the effect of the injection itself on DWV levels, control bees (collected from the colony but further unmanipulated) and PBS-injected bees (injected with the saline solution used for the stock viral isolation) were included as controls (these groups are labeled as ‘Control’ and ‘PBS-inject’, respectively).
Injected pupae were kept in 48-well plates and placed at 34.5C and approximately 75% R.H. in a desiccator within an incubator. Subsets of samples were collected at 3 days post-injection (DPI) to assess viral titers via qPCR. Samples were monitored daily for mortality and nearing eclosion timing (approximately 7DPI), monitored every 8-12 hours for successfully eclosed bees. ‘Successfully’ eclosed bees were assessed via pigmentation and high mobility, measured by noticeable movement around their respective well. Once eclosed, bees were removed from their well with sterilized forceps, accessed for deformed wings, and placed into plexiglass cages, split by group, noting the time of transfer. Cages were provided 30% sugar water and honey, ad libitum, and placed within an incubator at 34.5C and approximately 40-60% R.H. Cages with adult bees were monitored for survival daily, removing bees which had perished.
Virus quantifications from experimental infections – RNA was isolated from abdomens from 3DPI pupae collected during the experimental infection experiments using the Qiagen RNeasy Mini kit following manufacturers’ protocol including a DNAse incubation step and quantified using a Nanodrop. cDNA was prepared from each sample using a High-Capacity cDNA Reverse Transcription Kit with RNase Inhibitor (ThermoFisher Scientific, Maltham, MA) from 200ng RNA following manufacturers’ protocol. cDNA was diluted 1:20x to allow a sufficient amount of cDNA for all qPCR reactions. qPCR was conducted using PowerUp™ SYBR™ Green Master Mix as described above.
Viral Passage Variant Quantification - Sample processing and quantification of viral variant populations are currently in progress – R0, R1, and R5 have been quantified (Figure 3), and quantification of R2-R4 were intended for Spring 2020, but the COVID-19 pandemic related shutdowns have delayed these experiments.
Figure 3. Variant proportions from virus passaging experiments.
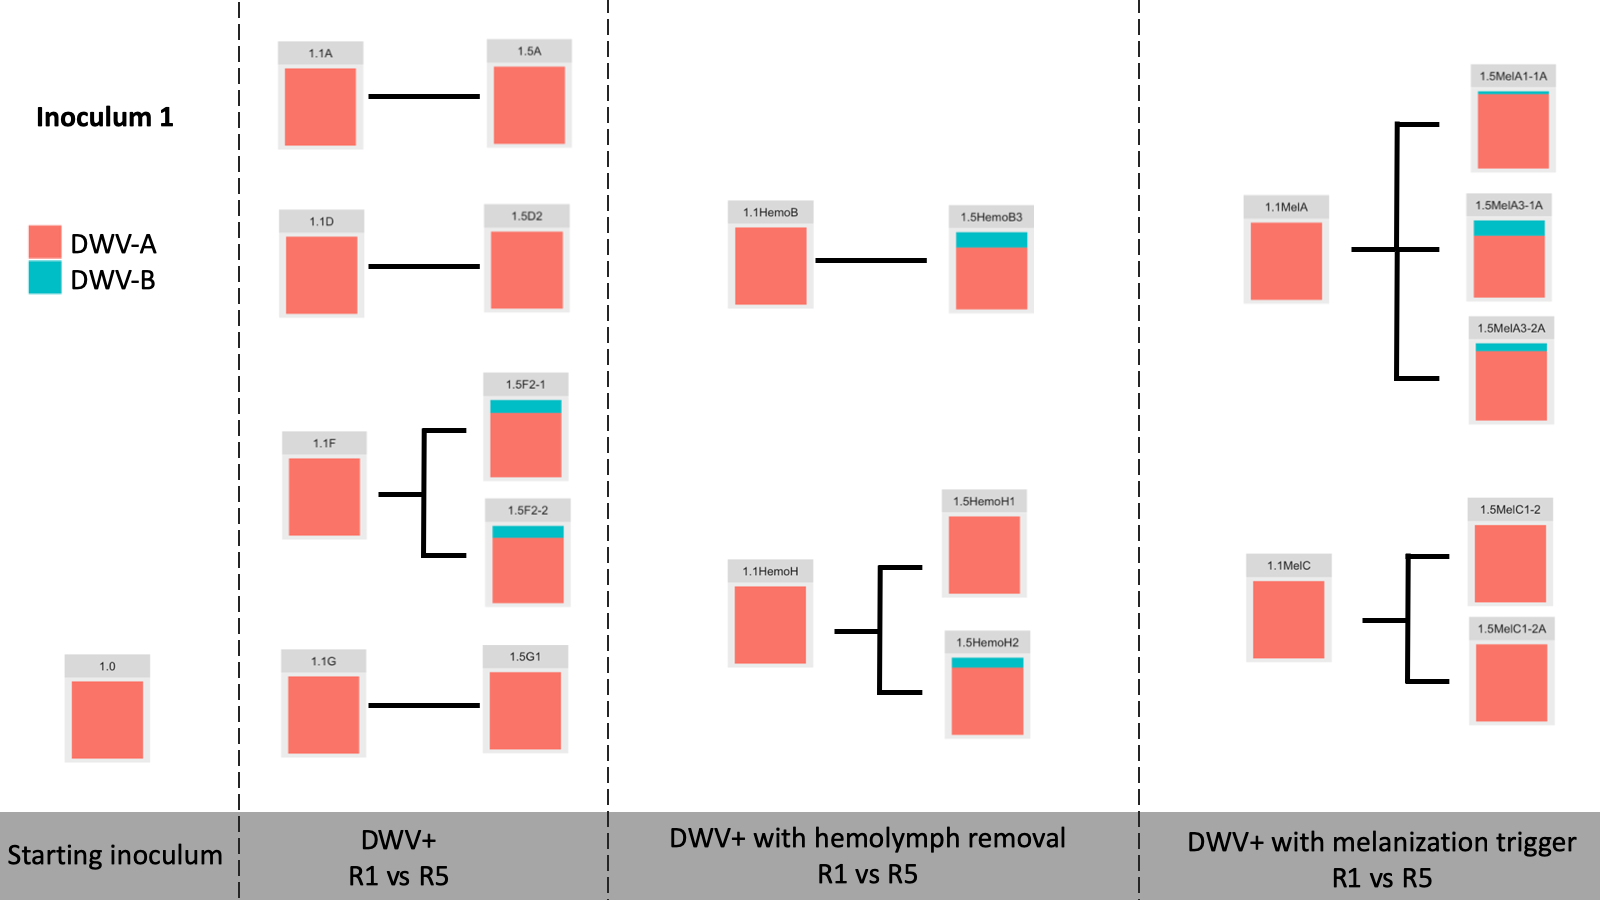
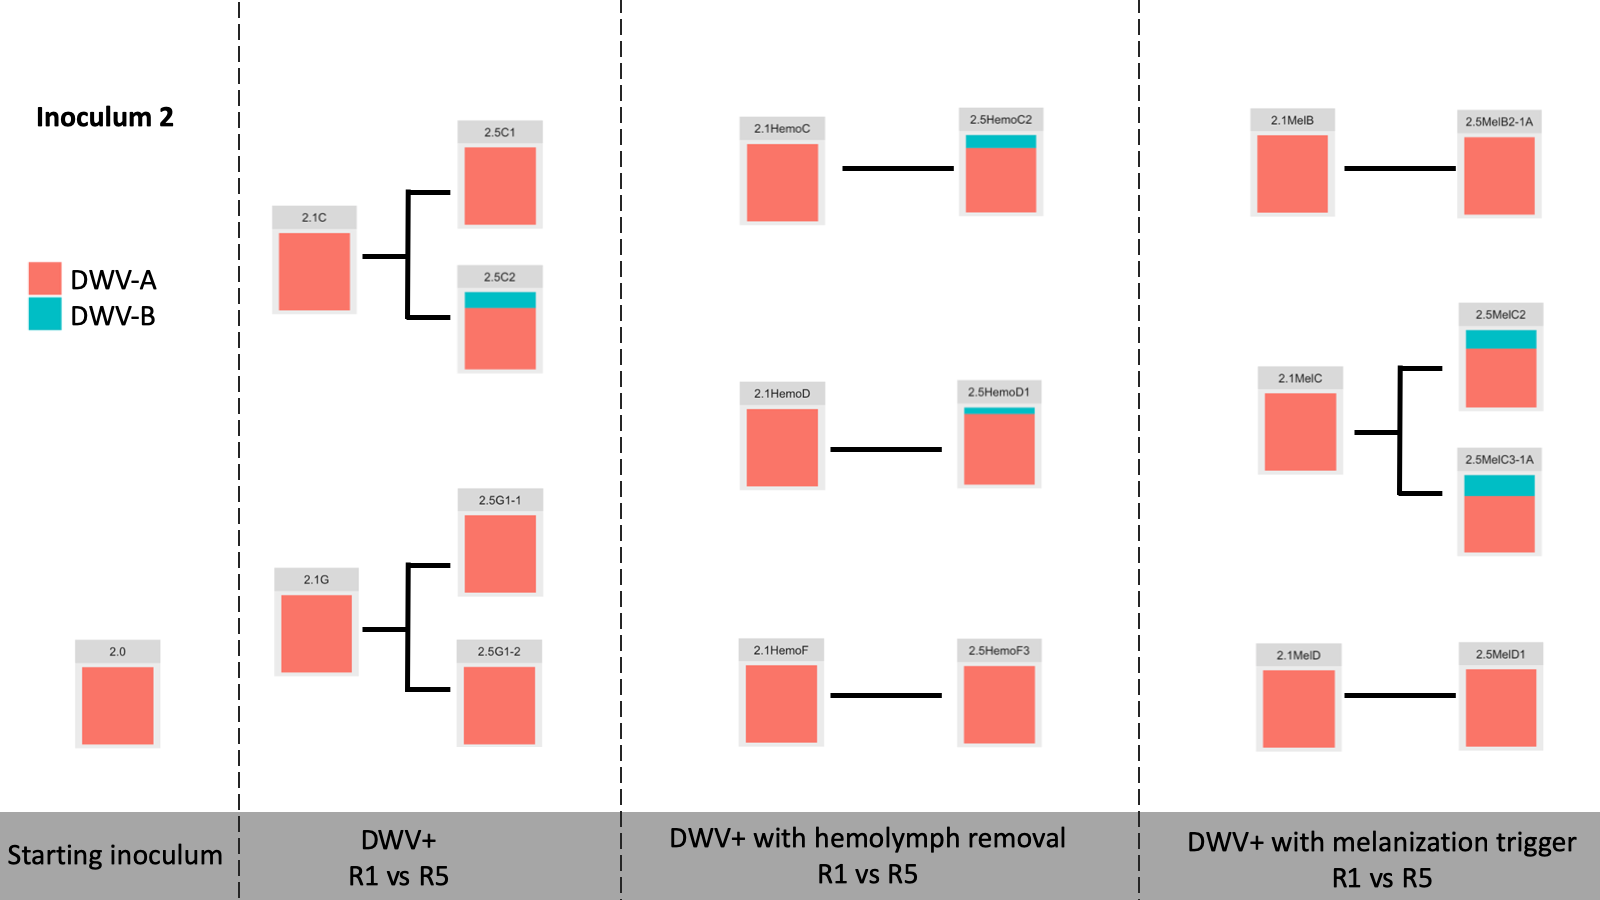
Control samples did not have any detected virus (not shown). Intriguingly, while previous virus passaging experiments demonstrated universal trends in directional variant population shifts, much more variability occurred in this experiment. Both starting inoculums were almost entirely DWV-A, and while some experimental passages were nearly completely DWV-A after five passages, other lines accumulated DWV-B through the passaging paradigm. This happened across all DWV+ treatments, with no discernible pattern at this time.
Experiments planned for 2021 intended to track the increase of DWV-B in these variant populations by quantifying R2-R4, but the ongoing COVID-19 pandemic restrictions forced us to prioritize the Arnot forest virus characterization experiments.
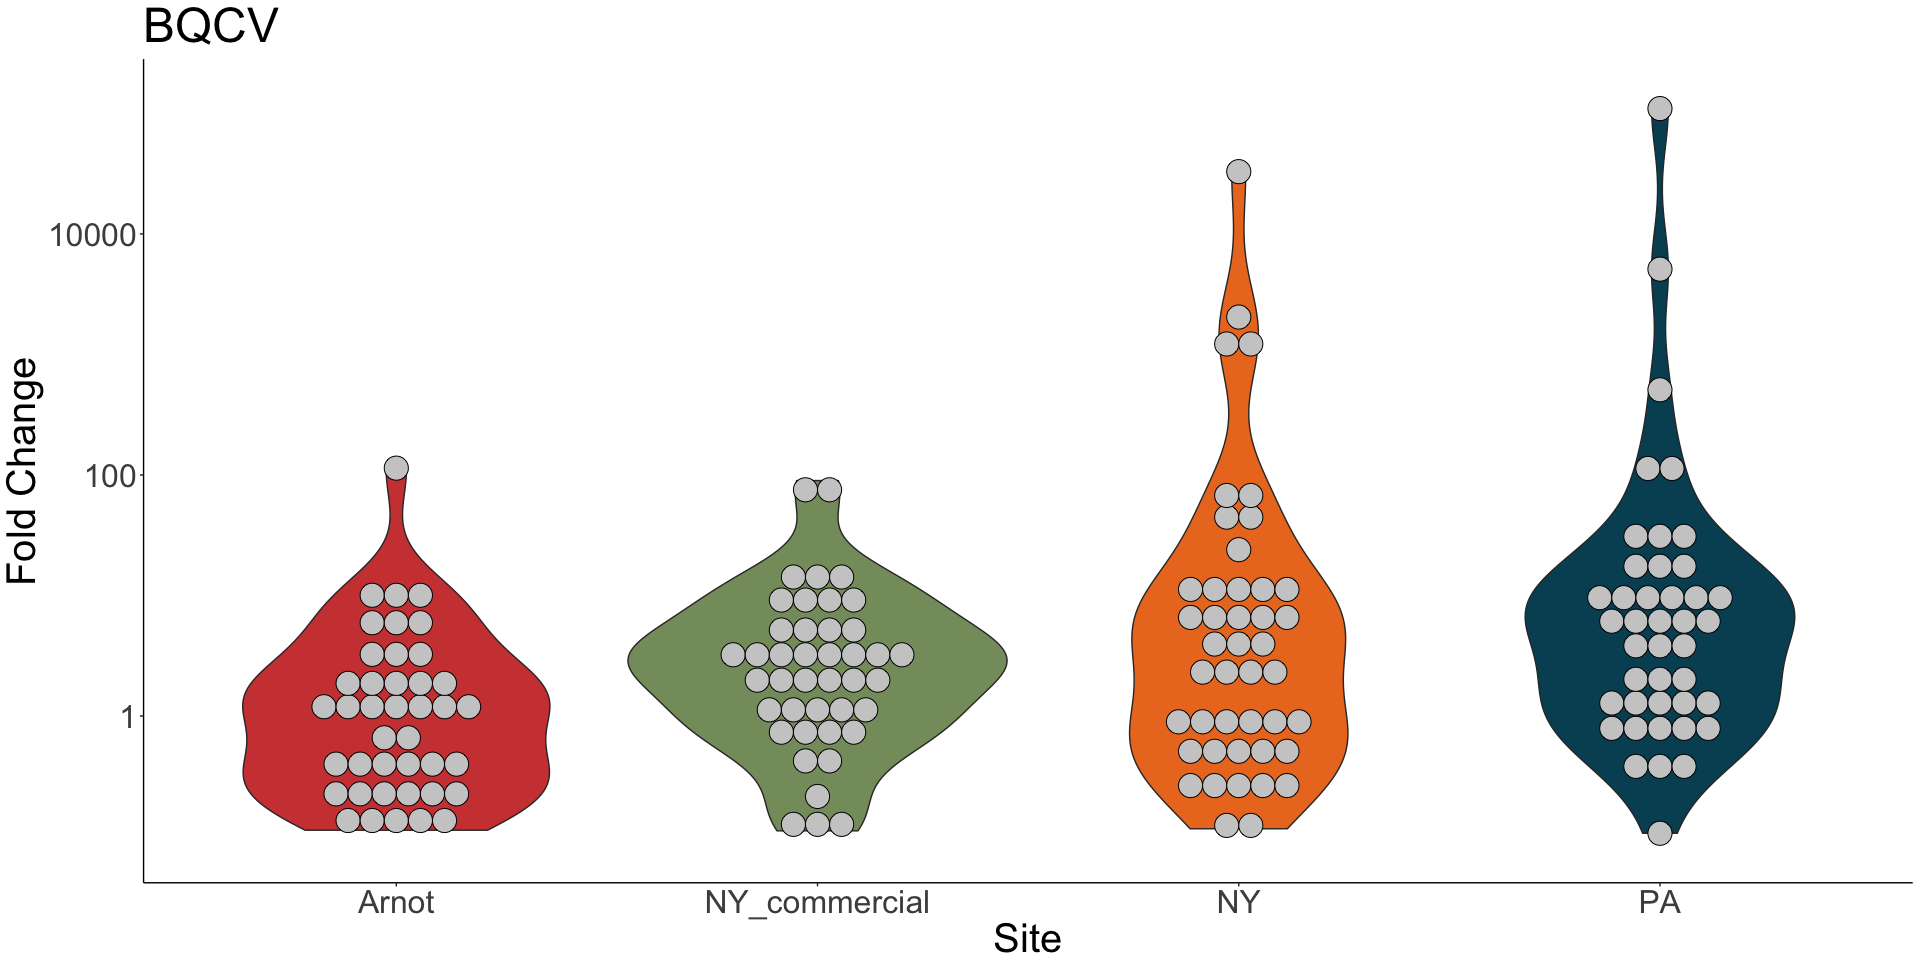
Viral presence in the Arnot Forest bees and nearby apiaries – To assess whether viral populations circulating within the Arnot Forest are at lower levels, we first screened for virus presence in 185 samples across 13 sites (Figure 4). We found black queen cell virus (BQCV, a common bee virus not associated Varroa transmission) across all sites, detecting BQCV across most samples. Conversely, DWV was at a lower presence across samples, with several sites within the Arnot with no DWV at thresholds high enough to consider 'infected'. When quantifying virus, focusing only samples with virus present at threshold levels, most groups shared a similar distribution of mostly lowly infected bees with a subset of samples caring higher viral loads. For DWV, the Arnot forest and research apiaries from NY and PA had bees harboring high levels of infection (Figure 5a); most BQCV infected bees had low levels of infection, with the exception of a few bees from NY and PA research apiaries with higher levels of infection (Figure 5b).
Figure 4. Native DWV and BQCV presence across locations
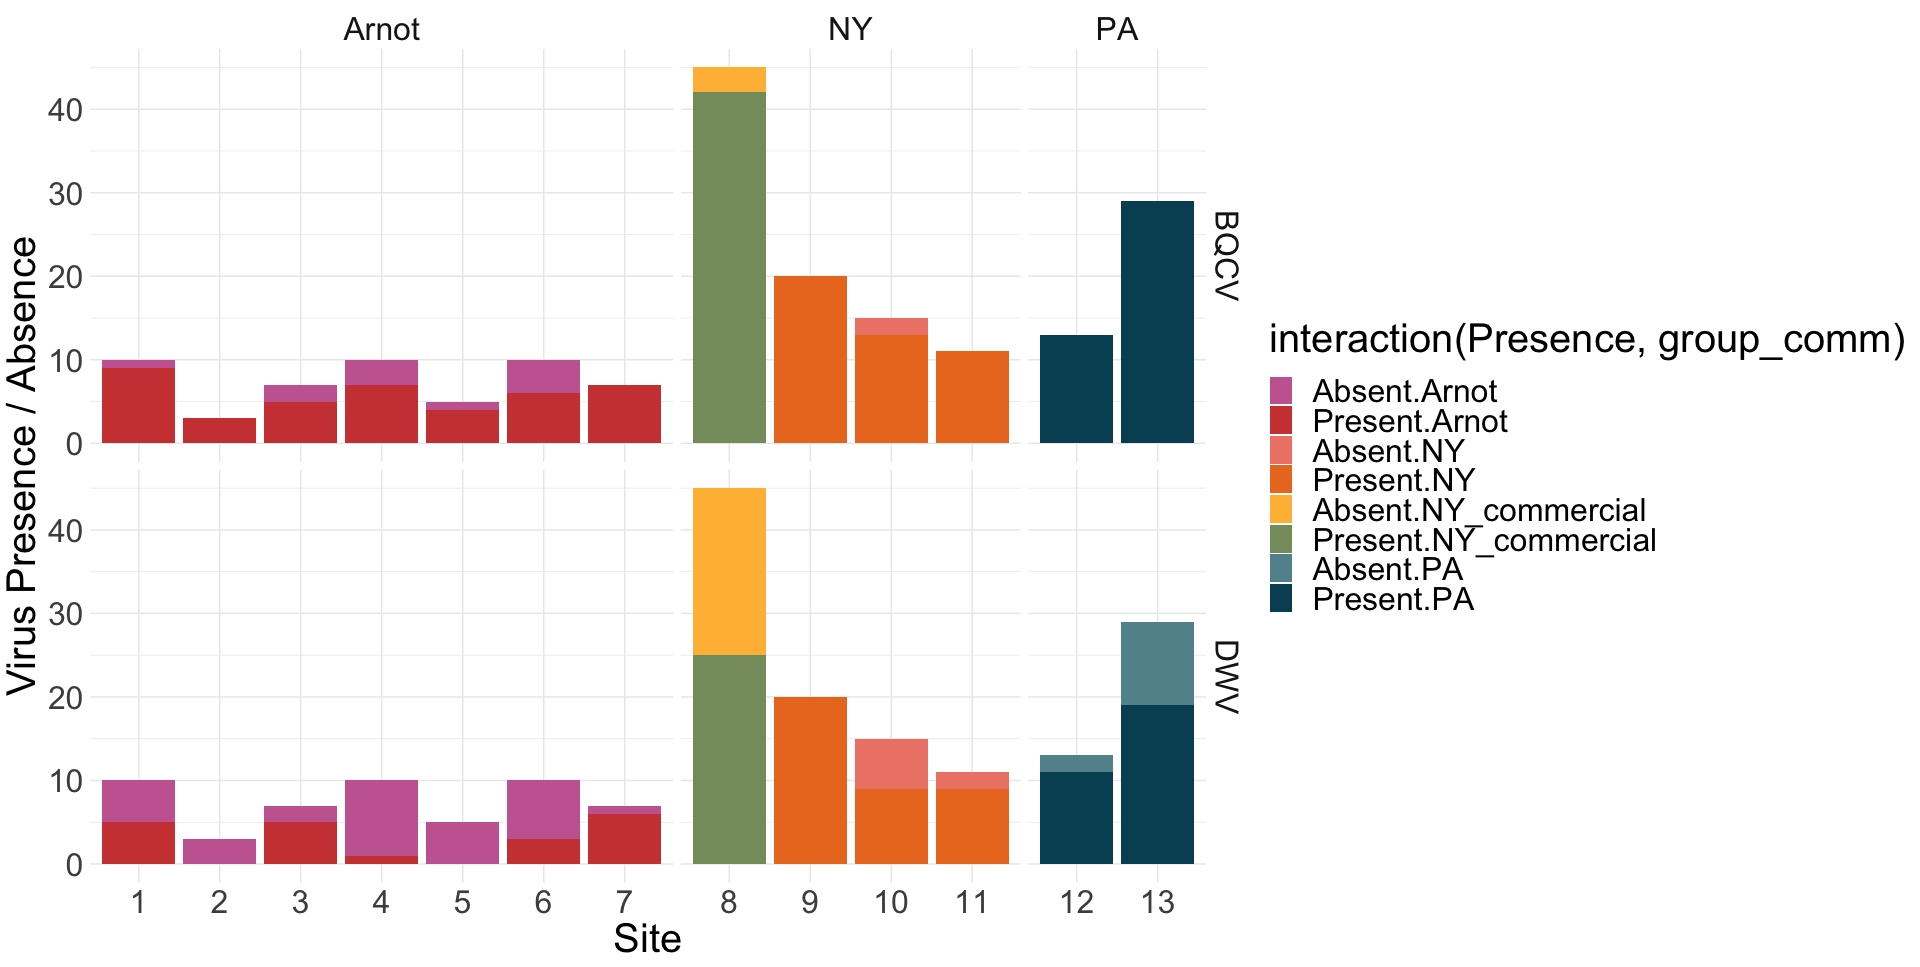
Figure 5a. DWV quantification across groups
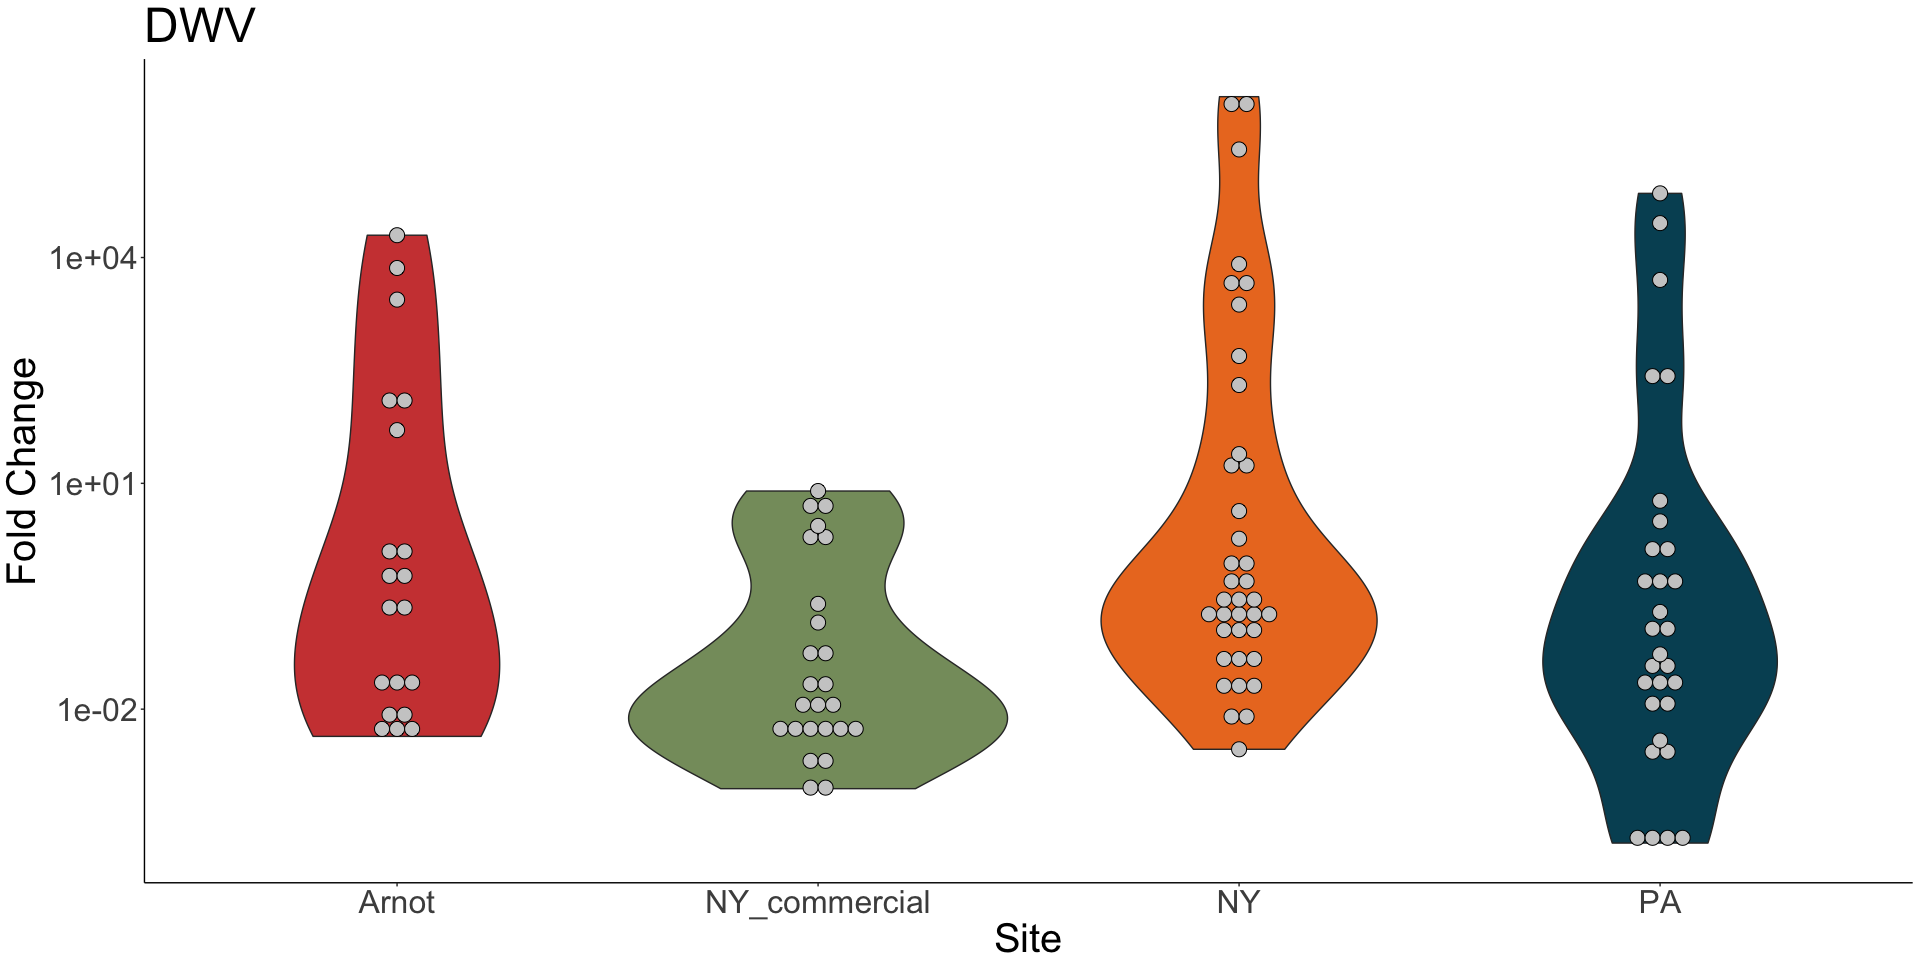
Figure 5b. BQCV quantification across groups
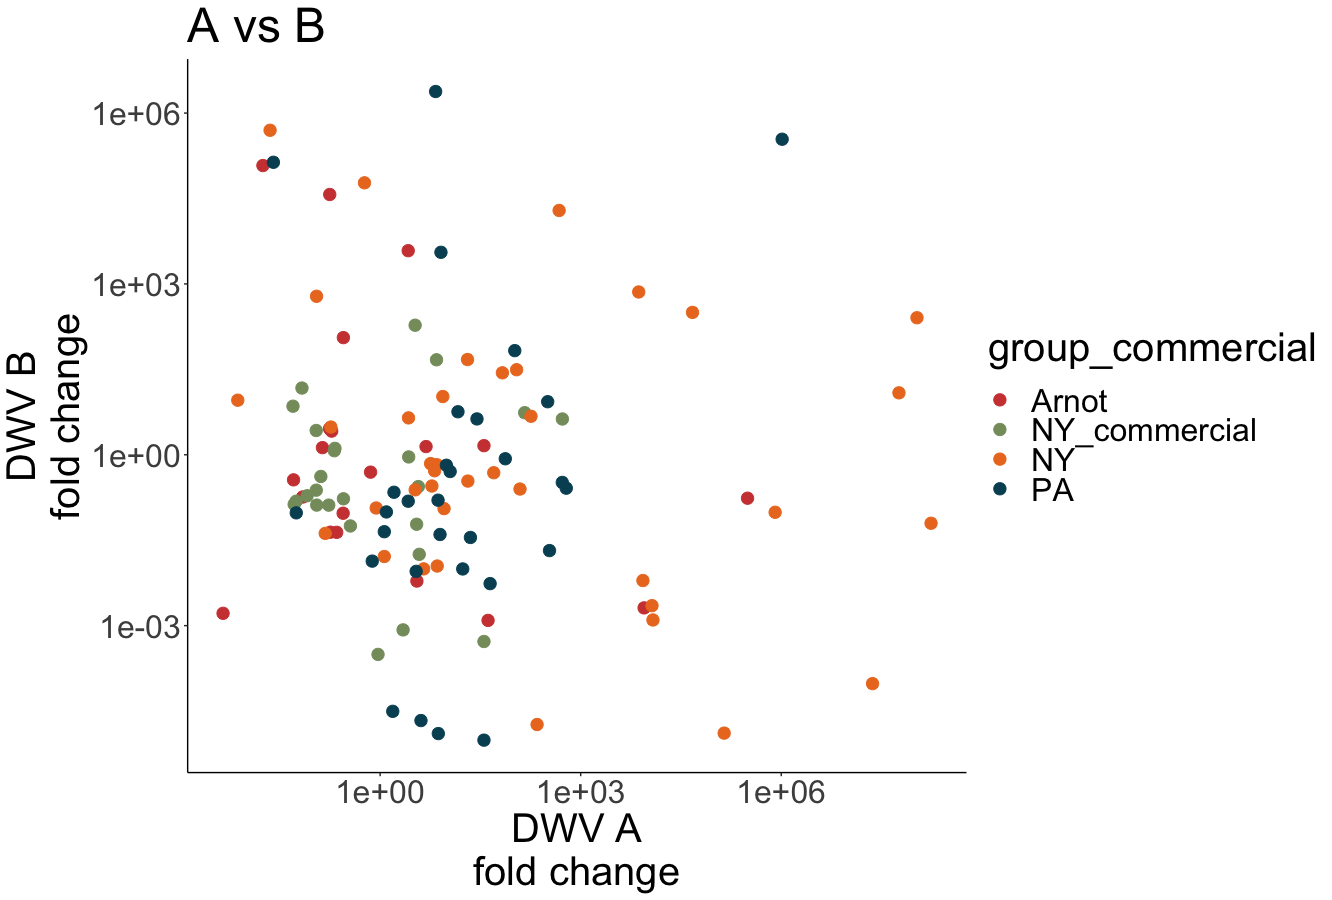
Both DWV-A and DWV-B master variant strains were identified across samples (Figure 6). Some samples contained only DWV-B, while other samples were only infected with DWV-A, or were co-infected with both variants, including samples from nearby research apiaries in NY. Interestingly, there is a wide range of infection levels across samples, and no variant is consistently outcompeting the other in co-infecting samples (i.e. DWV-B levels are not consistently higher than DWV-A levels, as observed by Norton et al 2020).
Figure 6. Proportion of DWV-A vs DWV-B across locations
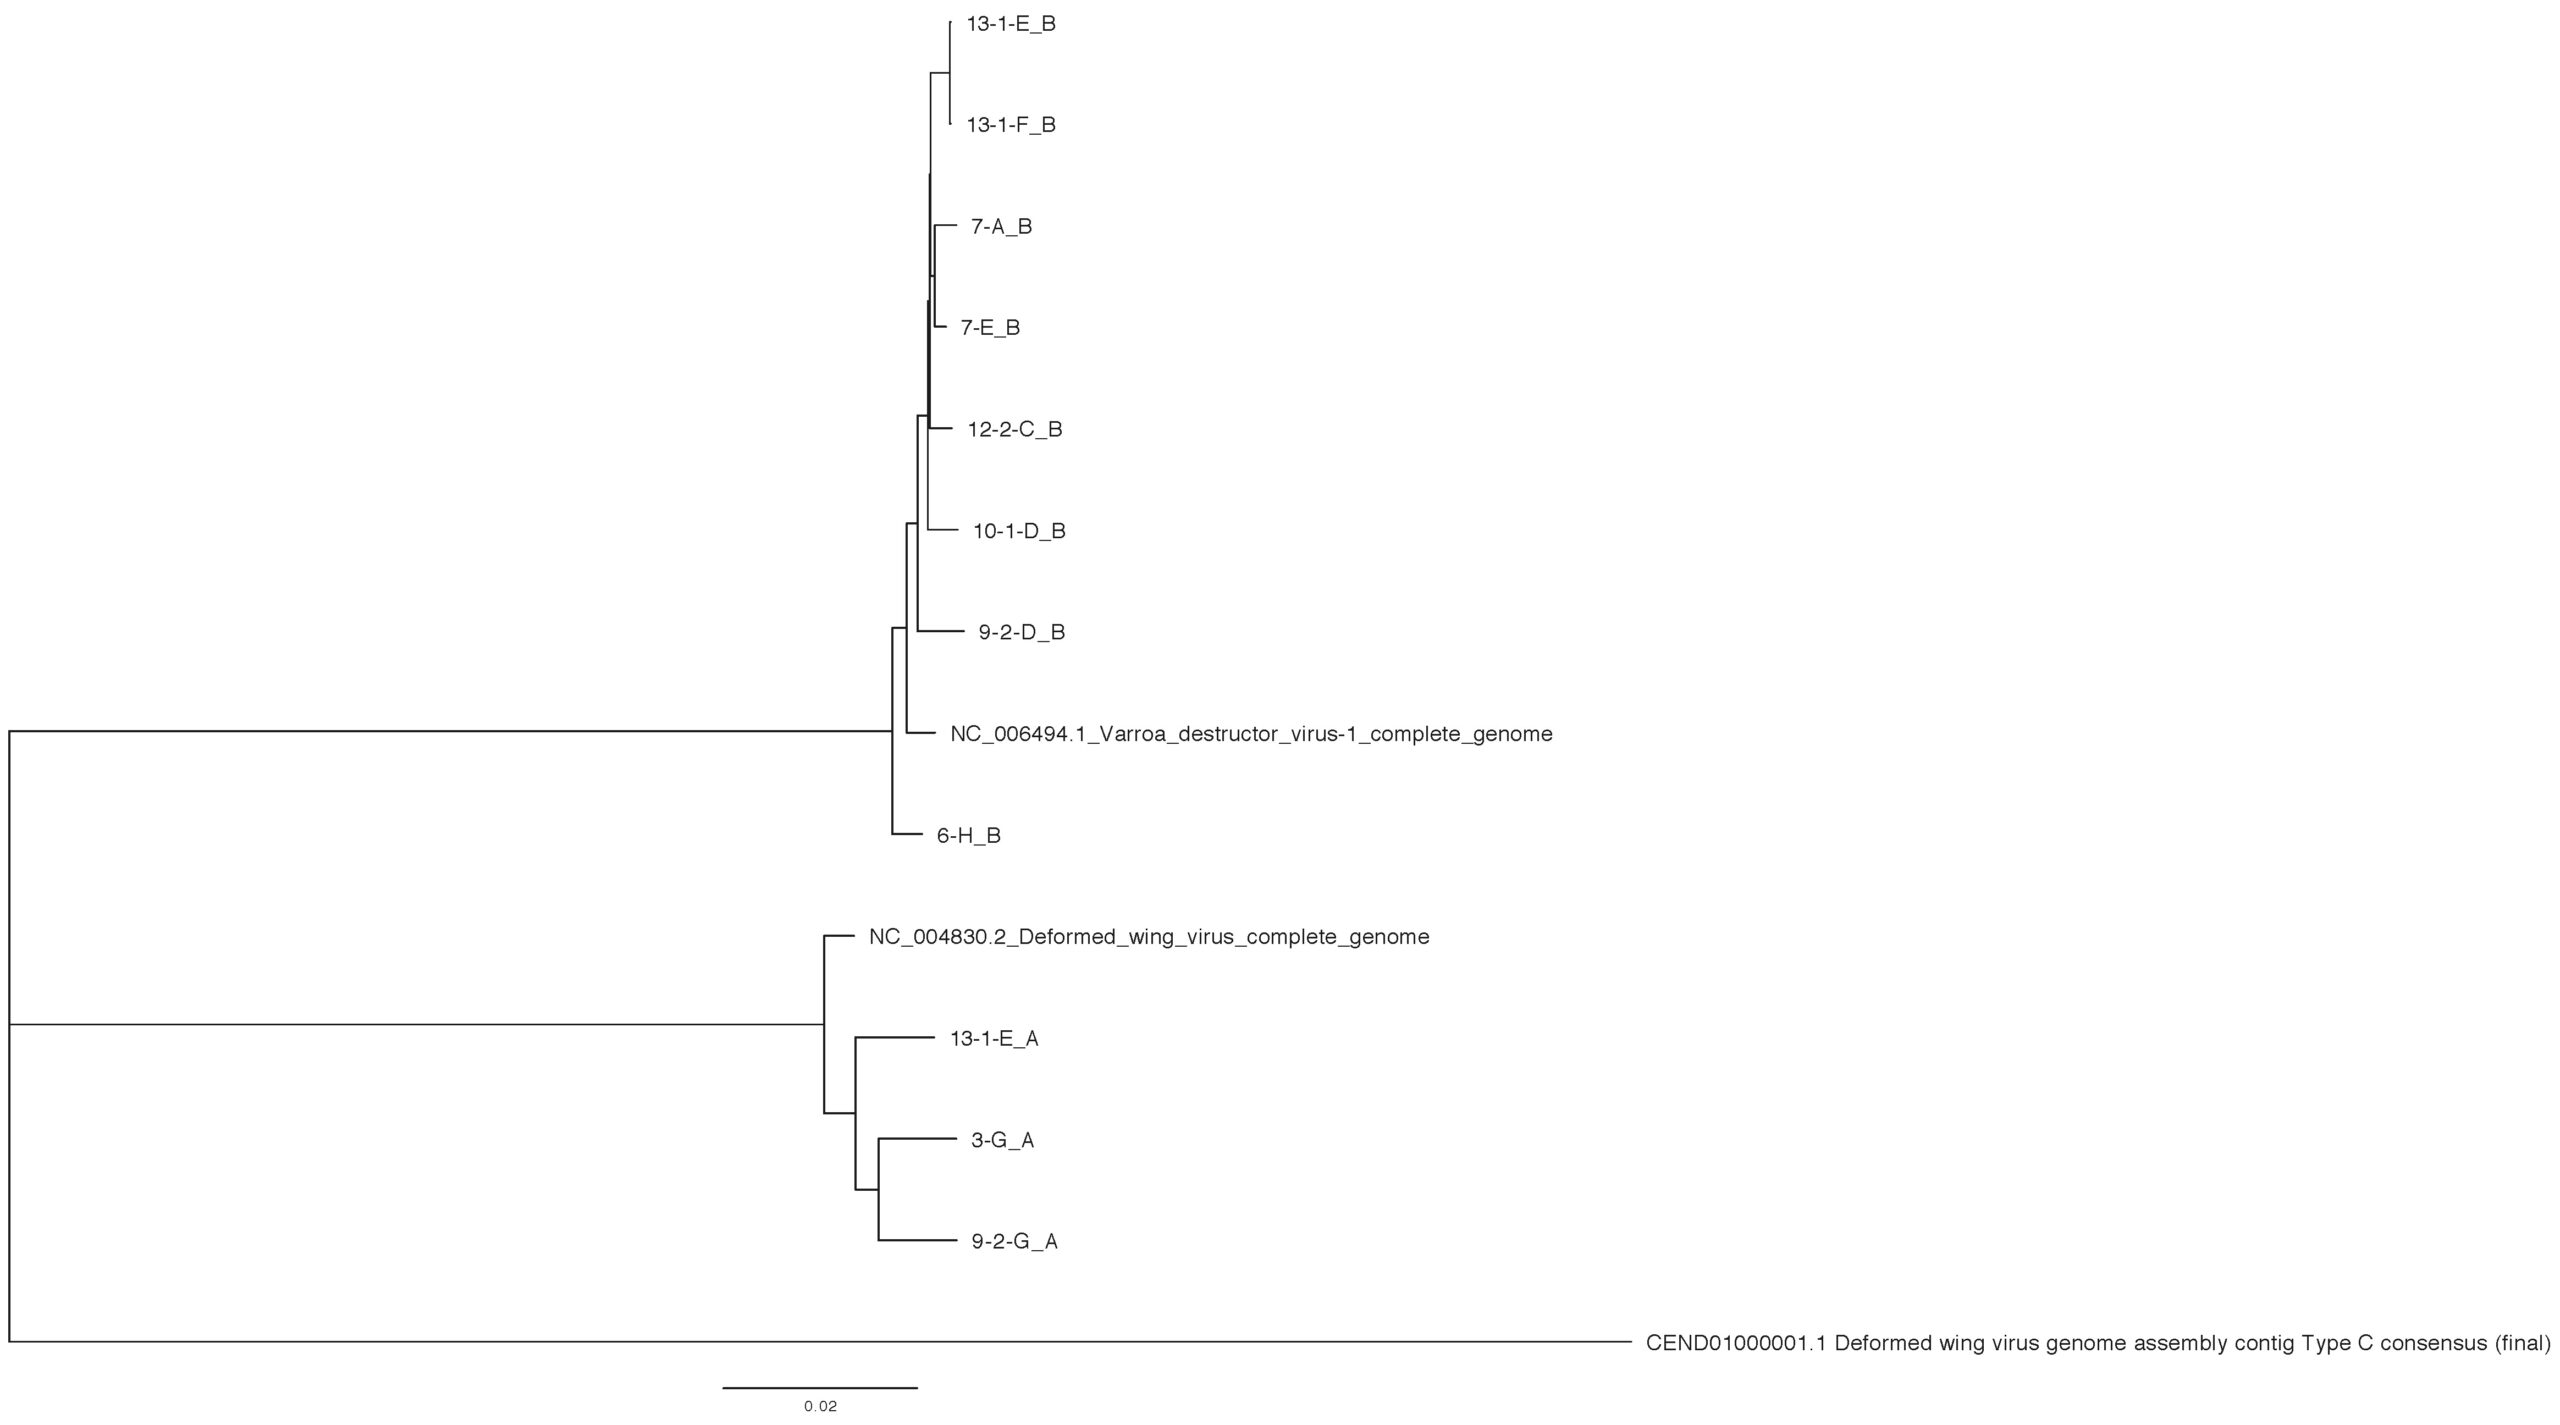
Sequence variation across a subset of DWV genomes - Next generation sequencing analysis was able to identify 11 unique DWV genomes (3 DWV-A and 8 DWV-B) across groups (Table 3). When comparing within strains, there is approximately a 1% nucleotide sequence difference across different isolates. Variation does not appear to be restricted to certain regions, but can be found across the genome. DWV-B isolates were able to recover more full-length genomes; we observe clustering within site (site 7 and site 13) but not consistently by group (site 6 vs site 7) (Figure 7).
Table 3. Identification of full-length genome sequences from naturally infected bees
| Isolate | Group | Site | Master Variant |
| 3-G | Arnot | 3 | DWV-A |
| 6-H | Arnot | 6 | DWV-B |
| 7-A | Arnot | 7 | DWV-B |
| 7-E | Arnot | 7 | DWV-B |
| 9-2-D | NY | 9 | DWV-B |
| 9-2-G | NY | 9 | DWV-A |
| 10-1-D | NY | 10 | DWV-B |
| 12-2-C | PA | 12 | DWV-B |
| 13-1-E | PA | 13 | DWV-A / DWV-B |
| 13-1-F | PA | 13 | DWV-B |
Figure 7. Phylogenetic analysis of DWV isolates from the Arnot forest and nearby locations
Experimental Infections with naturally infected DWV-isolates - 7/10 isolates were further assessed for phenotypic differences through experimental infections. Pupae were injected with high or low doses of the isolates, or with 1xPBS as sham-injection controls or were uninjected controls. 3 days post injection, subsets of pupae were collected to assess infection titers. The remaining bees were allowed to further develop, and later assessed for 1. Eclosion rates and timing, 2. Rates of symptomatic deformed wings, and 3. Adult survival through time.
All DWV+ groups had lower survival than the two Control groups (Figure 8). Isolates in order from best to worst Adult survival rates were as follows : 6 H (DWV-B isolated from the Arnot forest), 13 1 F (DWV-B from PA), 3 G (DWV-A from the Arnot forest), 13 1 E (mixed DWV-A-/B from PA) (Figure 8). Isolates with extremely low pupal survival (7 A, 9 2 D, and 9 2 G) were not included in Adult survival analyses due to low sample sizes. These isolates are suspected to be contaminated with other bee viruses, but cannot confirm until qPCR has been completed. Symptomatic deformed wings rates were mostly associated with survival, meaning the best survival isolate (6 H) also had the lowest rates of deformed wings and vice versa (Table 4).
Figure 8. Survival from experimental infections with DWV isolates
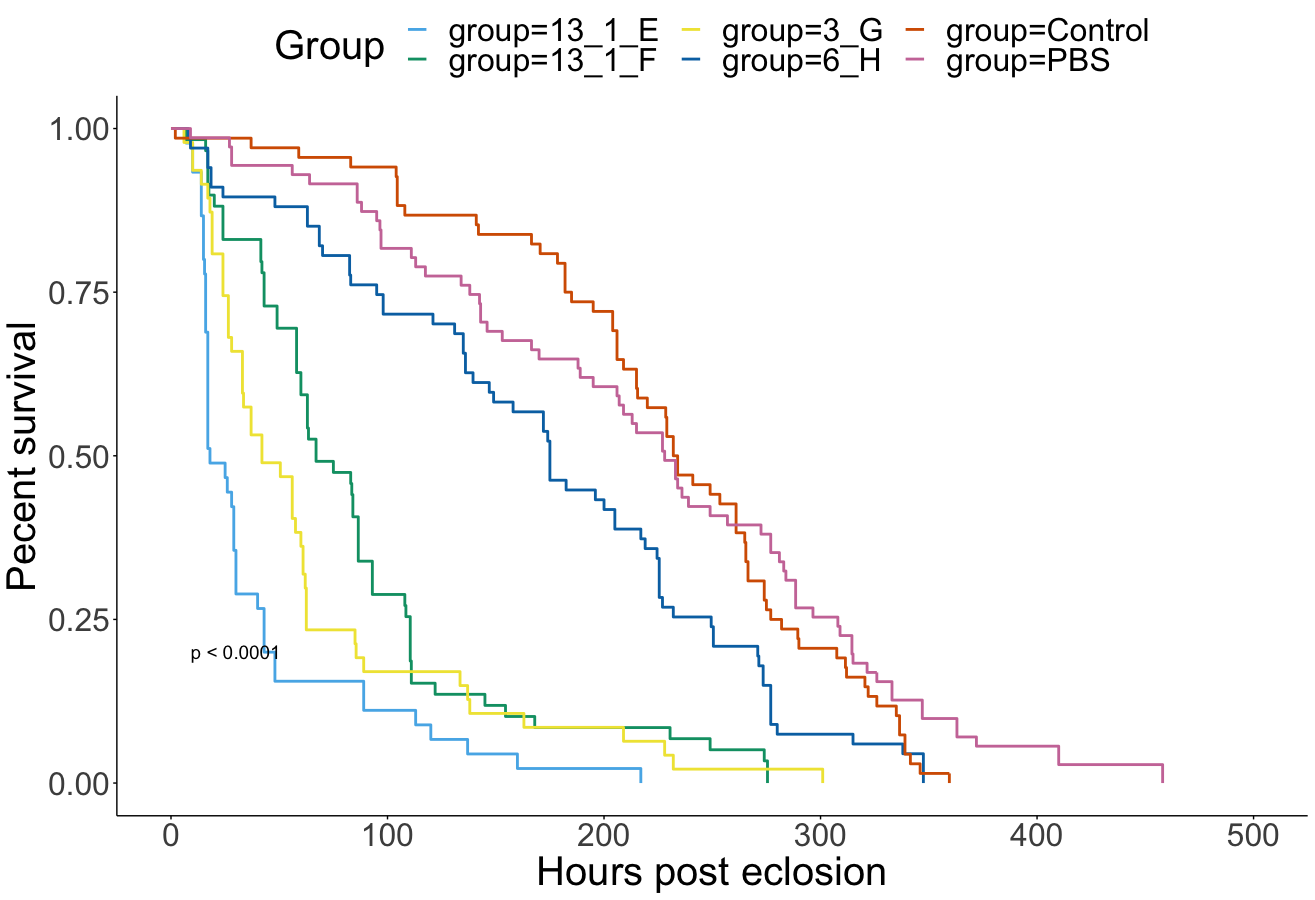
Table 4. Isolate disease phenotype data from Experimental Infections with naturally infected DWV-isolates
|
Isolate |
Pupal Survival Rate (High dose) |
Deformed Wing rate (High dose) |
Survival (both doses) |
|
6 H (DWV-B – Arnot) |
96% |
3% |
High |
|
13 1 F (DWV-B – PA) |
77% |
24% |
Low |
|
3 G (DWV-A – Arnot) |
71% |
60% |
Low |
|
13 1 E (Mixed DWV-A/B – PA) |
74% |
93% |
Low |
|
7 A (DWV-B + possible BQCV – Arnot) |
2% |
0% |
Lowest |
|
9 2 D (DWV-B + possible BQCV – NY) |
0% |
NA |
Lowest |
|
9 2 G (DWV-A + possible BQCV – NY) |
0% |
NA |
Lowest |
Assessment of viral load at 3DPI is ongoing, and predicted to be completed by the end of Spring 2022.
This study aimed to understand how different ecological factors of disease - the immunocompromising effect of Varroa, as well as the lack of disease interventions in isolated populations of honey bees - can select for different DWV genotypes and alter disease outcomes. Initial experiments examined how the indirect effects of Varroa feeding on infected bees influence the viral population of two main DWV variants. This was done by removing pupal hemolymph (simulating Varroa feeding) and by triggering melanization responses (simulating Varroa wounding) during experimental infections, then passaging this virus through multiple generations of immune challenged bees to amplify the selective effect. This passaging across different immunocompromised states resulted in varying variant populations within groups. Some groups were consistently biased for one variant (DWV-A), while others accumulated low but measurable levels of DWV-B. This was observed across two different starting inocula and across immunocompromised groups. It is not known what is driving this variable difference, but demonstrates how incorporating additional disease factors may introduce more complexity, and potentially more stochasticity, to infection dynamics. Future experiments should aim to quantify viral variant populations of additional passages to determine whether DWV-B is slowly, but consistently, accumulating in certain populations or randomly rising and falling across samples. Furthermore, as DWV-B normally outcompetes DWV-A in experimental infection (Norton et al 2020), it would be interesting to examine the nucleotide composition of all genomes - variation in key functional regions may explain this unexpected observation, and we can use that nucleotide difference to monitor for potentially highly infective DWV strains.
We also aimed to characterize viral populations in the isolated honey bee colonies within the Arnot Forest. As these bees survive mite and pathogen pressure without human intervention (e.g. chemical miticides), we hypothesized the virus circulating within the forest was at lower virulence (deadliness) to allow both virus and honey bee host to persist. We first characterized the presence of DWV as well as black queen cell virus within wild-caught Arnot bees as well as managed colonies in NY and PA. We were able to identify infected bees across all groups, although some sites within the Arnot forest had no detectable DWV. When quantifying the virus within these samples, we find that overall levels are fairly low. High titers of virus are associated with worsened disease, so this low abundance of virus within these foragers may be expected, as these bees had to be healthy enough to survive adulthood until the foraging behavioral stage. When examining DWV strains, we find both DWV-A and DWV-B across groups, although we see low frequency of co-infection across these samples. As co-infection can also result in worsened disease outcomes (Remnant et al 2019), and we studied bees healthy enough to forage, again, this result may be unsurprising.
When looking at sequence identity across different isolates, we found distinct viral genotypes across groups. In particular, one isolate of DWV-B circulating within the forest was more divergent from other DWV-B genomes. This was also the least virulent isolate in the experimental infections. This observation supports our hypothesis that the virus circulating within the forest is indeed less virulent, which may explain, at least in part, how the Arnot bees are able to survive with constant pathogen and mite presence and without human management attempting to alleviate the negative effects of infection. Arnot isolates were not consistently less virulent, though, compared to isolates from managed colonies. A DWV-A isolate from the Arnot forest was more virulent, in terms of pupal mortality and deformed wing rates, than a DWV-B isolate from PA. This may mean that not all strains within the forest are evolving towards decreased virulence, or perhaps this particular isolate has not been selected for long enough to have an observed decreased disease phenotype, or an effect that DWV-B may broadly be less virulent than DWV-A (virulence comparisons across variants have differing conclusions, see for example Mordecai et al 2015 versus McMahon et al 2016).
As it is challenging to locate wild colonies within the forest, as well as access the developing brood most vulnerable to DWV transmitted by Varroa, we focused on viruses within foragers who could potentially transmit virus to vulnerable colonies via co-foraging or drifting across colonies. We found that one isolate, in particular, from the Arnot forest was less virulent than other isolates from managed colonies. This might mean that, while vulnerable bees may be exposed and become infected, infections may not be as severe. This also means that, if pathogen spillover is occurring via co-foraging events, unnamanged wild bees and other pollinators may be exposed to less virulent strains, supporting their population health, although this would require additional experiments measuring transmission at foraging and infection in these other species to confirm.
Studying virus evolution is critical for improving bee health. Direct applications from these experiments focus on the identification of the less virulent DWV-B isolate, which can be used to identify virulence regions within DWV-B genomes by comparing infection outcomes and sequence variation. Identifying virulent genotypes and loci are needed to develop better screening targets to track virulent DWV in the US and beyond. Furthermore, understanding the factors that can influence viral evolution can be used to indirectly manage DWV by managing the critical factors that might select for more virulent DWV genotypes, such as what was predicted to have occurred after the introduction of Varroa. Overall, to holistically understand DWV disease ecology, we must examine and manage all three components - honey bees, Varroa, and DWV - as well as monitor other environmental conditions to support bees and beekeepers.
Education & outreach activities and participation summary
Participation summary:
Due to the ongoing Covid-19 pandemic, most educational and outreach events were not held. The results from the differing DWV isolates resulting in differential disease are currently being compiled into a manuscript, aiming to submit to Scientific Reports, which is an open-access journal to make these data more accessible to the public and to stakeholders.
Project Outcomes
Identifying virulent DWV strains will inform virus screening protocols. Targeted screens for virulent genotypes, versus screening for DWV broadly, may better track the most critical disease, which will focus intervention efforts on the most severe cases, informing isolation protocols to protect unexposed colonies and supporting apiary health.
Overall, this project has improved our understanding of bee virus variation and disease outcomes. We find that not all DWV isolates result in the same level of infection, which means that infection across colonies across the US may not be equal. This research has motivated a USDA NIFA Predoctoral fellowship application, which was awarded in 2021. These projects aim to understand, at the molecular level, if there are differences in the honey bee's response to these different DWV isolates. These questions, examining host and pathogen genotype and disease outcomes, will continue to be Ray's research focus throughout her research career.
The isolates obtained in this study still only represent a subset of what may be circulating within the US. More research can continue to investigate different DWV isolates obtained across the US, identifying most differential sequence variation and differing disease outcomes, to even better understand how virulence may be genetically encoded in the DWV genome. Furthermore, this study did not deeply investigate how different honey bee genotypes interact with these different DWV genotypes. These potential genotype-by-genotype investigations will also reveal more about other critical factors influencing disease outcomes, supporting breeding and bee health.