Final report for GNE19-219
Project Information
Bees and many other insects rely on nutritious pollen and nectar from plants to survive and rear young, and pollination services to crops depend on those plants being attractive forage to bees and other pollinators. While effects of environment and management on plant health and production have been well studied, we know very little about how these factors may impact plants as forage for insects. We tested the effects of two different plant growth promoting biofertilizers and glyphosate drift on insect visitation to flowers, pollen nutritional content, and nectar sugar concentration to determine if these commonly used products may indirectly influence insect foraging through changes in plant health. While no significant differences were found between treatments in the biofertilizer experiment, we did observe a consistent pattern of lower insect visitation on untreated plants in two different plant species. In the glyphosate experiment, we simulated glyphosate drift using low (0.1% and 1.0% recommended application rates) glyphosate doses and found a 40% decrease in insect visitation in high dose plants compared to control plants. These results suggest that glyphosate drift makes plants less attractive to insects, which could decrease pollination services to crops or natural vegetation when glyphosate is used nearby. Differences in pollen nutritional analysis and nectar concentration were very small and are unlikely to be biologically significant. However, there exists ample room to explore the effects of other biofertilizers or soil ammendments, herbicides, and plant species on insect behavior and nutritional quality of floral rewards.
This project had two primary objectives.
1. Identify the effects of plant growth promoting rhizobacteria and mycorrhizae on floral rewards by measuring flower number, size and phenology; pollen nutritional content and grain size, and nectar sugar concentration in plants grown with and without inoculation with live beneficial microorganisms.
Prediction 1.1: Plants inoculated with either mycorrhize or rhizobacteria will exhibit faster growth rates, bloom earlier, and produce larger inflorescences compared to plants not inoculated with microorganisms. Plants inoculated with both mycorrhizae and rhizobacteria simultaneously will have faster growth rates and bloom earlier than those receiving a single inoculate.
Prediction 1.2: Plants inoculated with either mycorrhize or rhizobacteria will produce pollen with larger average grain size and will differ in amino acid concentration and/or composition compared to pollen from plants that were not inoculated. Innoculation with both mycorrizae and rhizobacteria may impact nutritional composition but will not further increase pollen grain size. Nectar sugar concentration will be higher in inoculated plants compared to controls, but will not differ between inoculated treatments.
Prediction 1.3: Inoculated plants will receive a higher number of insect visitors than control plants, but insect visitation will not differ between inoculated treatments. Diversity of insect visitors will not differ between control and treatment plants.
2. Examine the effects of glyphosate drift on floral rewards by comparing flower number, size and phenology; pollen nutritional content and grain size; nectar sugar concentration; and insect visitation between treated and untreated plants.
Prediction 2.1: Plants treated with glyphosate will exhibit delayed flowering time compared to control plants.
Prediction 2.2: Plants treated with glyphosate will differ in the volume and sugar content of nectar produced compared to control plants.
Prediction 2.3: Plants treated with glyphosate will produce pollen with smaller grain size and pollen crude protein and amino acid profiles will differ between treatment and control plants.
Prediction 2.4: Plant volatile organic chemical composition will differ between treated and untreated plants.
Prediction 2.5: Glyphosate treated plants will attract a lower abundance and diversity of flower visiting insects compared to control plants.
The purpose of this project was to investigate factors that impact the nutritional quality of bee forage in the agricultural and garden settings with a goal of providing growers a better understanding of how to sustain populations of both wild and managed pollinators. Sustainable agriculture is dependent on sufficient pollination services, and therefore providing abundant, nutritious forage for bees and other pollinators is foundational to maximizing crop yields and seed production. While bee pollinated crops themselves provide forage and many farmers provide supplementary forage in and near their fields, little is known about how environmental conditions and management practices alter the production of floral rewards (pollen and nectar) provided by these plants. One component of the agricultural system that has yet to be studied for its impact on floral rewards is the soil microbiome. Soil bacteria and fungi impact plant health and have been shown to affect pollen viability and seed set, but these soil mediated impacts on pollen production have yet to be investigated from the perspective of changes in nutritional quality for pollen feeding insects. We expect that changes impacting germination of pollen grains also affect the composition of protein, sugars, lipids, vitamins and/or minerals available to foraging bees. The role of the soil microbiome in nectar production has never been studied, but given the influence of plant-soil interactions on other aspects of the plant reproductive system we expect to see changes to nectar volume and/or sugar concentration as well. Previous studies suggest that changes to plant physiology as a result of these interactions may also affect bee forage by shifting bloom time or duration and flower morphology, though this has rarely been studied, and never under the lens of impact on pollinators.
Herbicides are one management tool that is known to have consequential effects on soil microbes and plant reproduction. Shifts in microbial communities as well as changes to pollen viability and bloom time have been tied to addition of glyphosate, but again, no studies to date have explored the effects of herbicide on insect visitation, pollen nutrition, or nectar production. By examining the soil-plant-insect interactions we aim to improve pollinator management strategies in sustainable agriculture. Shedding light on the role of the soil microbiome in pollinator health will spur development of new tools to enhance forage in crop fields, such as addition of certain bacteria or fungi to improve pollen and nectar content and yield. Studying the implications of herbicide use for pollinator health will provide farmers with direct knowledge of how their management strategies affect pollination services to their crops. In addition to researching these questions, we aim to equip farmers with the informational toolkit needed to understand sustainable promotion of pollination in agriculture.
The scientific literature examining the role of soil microbes and effects of herbicides on crops has identified measurable effects on plant growth rates and seed set, yet previous studies have failed to address pollination ecology. This study is novel in that it aims to identify how these two factors influence the quality of forage for pollinating insects. The economic value of pollination services to U.S. crops by wild and managed bees has been estimated at $16 billion annually (Ritten et al. 2018). In sustainable agriculture, sufficient pollination of crops leading to high yields and seed set hinges on maintenance of diverse, abundant populations of wild bees and/or healthy managed bee colonies. For efficient and cost-effective management of resources for these bees in the agricultural landscape, we must first understand how the quality of floral rewards vary in relation to conditions in which the plants are grown.
Addressing this gap required two approaches 1) studying the ecological interactions between soils, plants, and insects feeding on floral rewards on a basic level, and 2) exploring specific management practices and how they impact these interactions. Guided by the first approach, we ask a fundamental question which has yet to be explored: Is the soil microbiome important in the production of floral rewards, and do its impacts on pollen and nectar production have implications for pollinator health? As the first study to investigate this topic, we aim to provide foundational knowledge by looking at the amendment of soil with just a few of the many potentially beneficial groups of rhizosphere microorganisms. Bacteria and fungi found to enhance vegetative plant growth have been used as soil inoculants to increase crop productivity, therefore we expect this work to draw attention to the system and spur further study of mechanisms and influential microbes, ultimately leading to the development of new management tools aimed at increasing the value of flowering plants as bee forage.
The second approach takes a more targeted look at a widely used herbicide, with the goal of providing information that can be directly applied by farmers, beekeepers, and hobby gardeners. While the effects of herbicides and pesticides have been studied for their lethal and sublethal effects on insects, the study of their indirect impacts by altering floral rewards is new. Growers who have invested resources in either managed bee pollination or forage for wild bees must be able to weigh the potential costs to these investments when selecting weed management strategies, or plan their use to minimize those costs. If significant impacts on floral rewards are observed in this study, we hope to further investigate if these effects can be lessened by adjusting treatment time and dosage in the future to develop best management practices for growers.
In addition to providing novel information on soil-plant-insect interactions, we draw attention to the need for a better understanding of factors affecting floral reward quality. The full suite of factors impacting vegetative growth are potentially important for pollen and nectar production, and we expect our investigation of the soil microbiome and herbicide treatment to open the door to further explorations of other conditions impacting sustainable agriculture.
Cooperators
- (Educator and Researcher)
- (Educator and Researcher)
- (Educator and Researcher)
Research
Experimental Design:
Study Species and Growth Conditions: Sunflower (Helianthus annus ‘Big Smile’) and partridge pea (Chamaecrista fasciculata) were seeded into 1 gallon nursery pots at 3 seeds per pot, fertilized biweekly with a 20-20-20 NKP fertilizer and watered as needed. After germination, seedlings were thinned to one plant per pot. Plants for insect visitation were grown outdoors, and plants for pollen (sunflower) and nectar (partridge pea) collection and analysis were grown in a greenhouse maintained at approximately 24°C with a 16:8 light:dark cycle. Number of replicates per treatment for each experiment are shown in Table 1.
Objective 1 Treatments: Mycorrhizal fungi and Plant Growth Promoting Rhizobacteria (PGPR): We tested two commercial biofertilizers available through ARBICO Organics (www.arbico-organics.com): one mycorrhizal inoculant and one rhizobacterial inoculant. The mycorrhizal product, ARBICO Organics® Root Build 240, contains four endomycorrhizae (Rhizoglomus intraradices, Funneliformis mosseae, Rhizoglomus aggregatum, and Glomus etunicatum), as well as the ectomycorrhiza, Pisolithus tinctorius. This product was chosen because it contains only microorganisms and inert carrier material, without artificial fertilizer or other nutrients that could obfuscate the specific impacts of the inoculant. Of the many potential PGPR, we will focus on Bacillus spp., many of which have been shown to impact various floral traits of plants (see literature review). The commercial product we are testing, Sumagrow, was chosen because, like the mycorrhizal product, it is composed of only microorganisms and an inert carrier, and contains four Bacillus spp. strains (B. amyloliquefaciens, B. subtilis, B. pumilus, and B. lichenformis).
Plants were assigned to one of four treatments: 1) Mycorrhizal innoculant only (MR), 2) Bacillus spp. inoculant only (BC), 3) both products applied simultaneously (MX), and 4) controls with no PGPR product applied (CT). Both products were applied to soil at planting according to manufacturer’s instructions and at the recommended application rate.
Objective 2 Treatments: Simulation of Glyphosate Drift: Plants were assigned to one of 3 treatments: control with no glyphosate added, glyphosate at 0.1% field dose (low), and glyphosate at 1.0% field dose (high). Glyphosate was applied to leaves using a pressurized backpack sprayer when flower buds had begun to form, but before flowers opened.
Plant Growth Metrics for Objective 1: Plant height was measured as distance from soil to the base of the terminal flower bud during flowering. Inflorescence width in sunflower was measured as the diameter of the floral disc at its widest point. Total number of inflorescences per plant were also recorded for sunflower.
Nectar Sampling for Both Objectives: Nectar concentration was measured using a handheld refractometer. Nectar was sampled by touching the refractometer to the exposed extrafloral nectaries. Plants were sampled daily for 5 days at the same time each day in the morning. Three nectaries per plant per day were sampled.
Pollen Collection for Both Objectives: Pollen was collected from sunflower daily during flowering by brushing pollen from anthers into a petri dish using forceps. Samples were pooled by treatment to ensure adequate volume for nutritional analysis. Pollen was stored at -20°C during collection and was sent to the University of Missouri-Columbia Agricultural Experiment Station Chemical Laboratory (AESCL) for analysis of crude protein, amino acid profile, fatty acid profile, and sugar profile.
Insect Visitation for Both Objectives: During bloom, ten inflorescences per treatment were visually observed daily for 10 minutes each, during which time all insects coming in contact with either anthers or foraging for nectar (including robbing) were counted and identified to morphospecies. Morphospecies categories included: honey bee (Apis mellifera), bumble bee (genus Bombus), large carpenter bee (genus Xylocopa), sweat bee (family Halictidae), small dark bees, Aculeate wasps (Aculeata), parasitic wasps (Parasitica), butterflies (order Lepidoptera), beetles (order Coleoptera), hover flies (family Syrphidae), and other flies (order Diptera).
Data analysis for Objective 1: Effect of treatment on plant growth metrics were analyzed using linear mixed models with individual plant number as a random effect. Plant identification number was treated as a random effect, and effects were considered significant at p<0.5. Insect visitation in both objectives was also analyzed using linear mixed models. In partridge pea, plant identification number was included as a random effect and temperature was included as a fixed effect. Because we had more variables in sunflower, several models were designed incorporating combinations of plant growth metrics, temperature, and time of day, and best fit models were selected based on the Akaike Information Criterion (AIC). The models compared can be found in Table 2. Once a model was selected, significance was determined at p<0.5. Models were developed for both visitation of all insects, and visitation of bees only.


Nectar concentration by treatment was also assessed using linear mixed models, including plant identification number and date as random effects. Significance was determined at p<0.05. Because pollen samples were pooled, nutritional contents were assessed qualitatively by comparing raw values between treatments.
Data analysis for Objective 2: As in objective 1, insect and bee visitation were analyzed using linear mixed models. The models compared in objective 2 are shown in Table 3, and model selection was based on AIC values. Significance was determined at p<0.5. Nutritional content of pollen samples was compared qualitatively between treatments.

Objective 1 Results
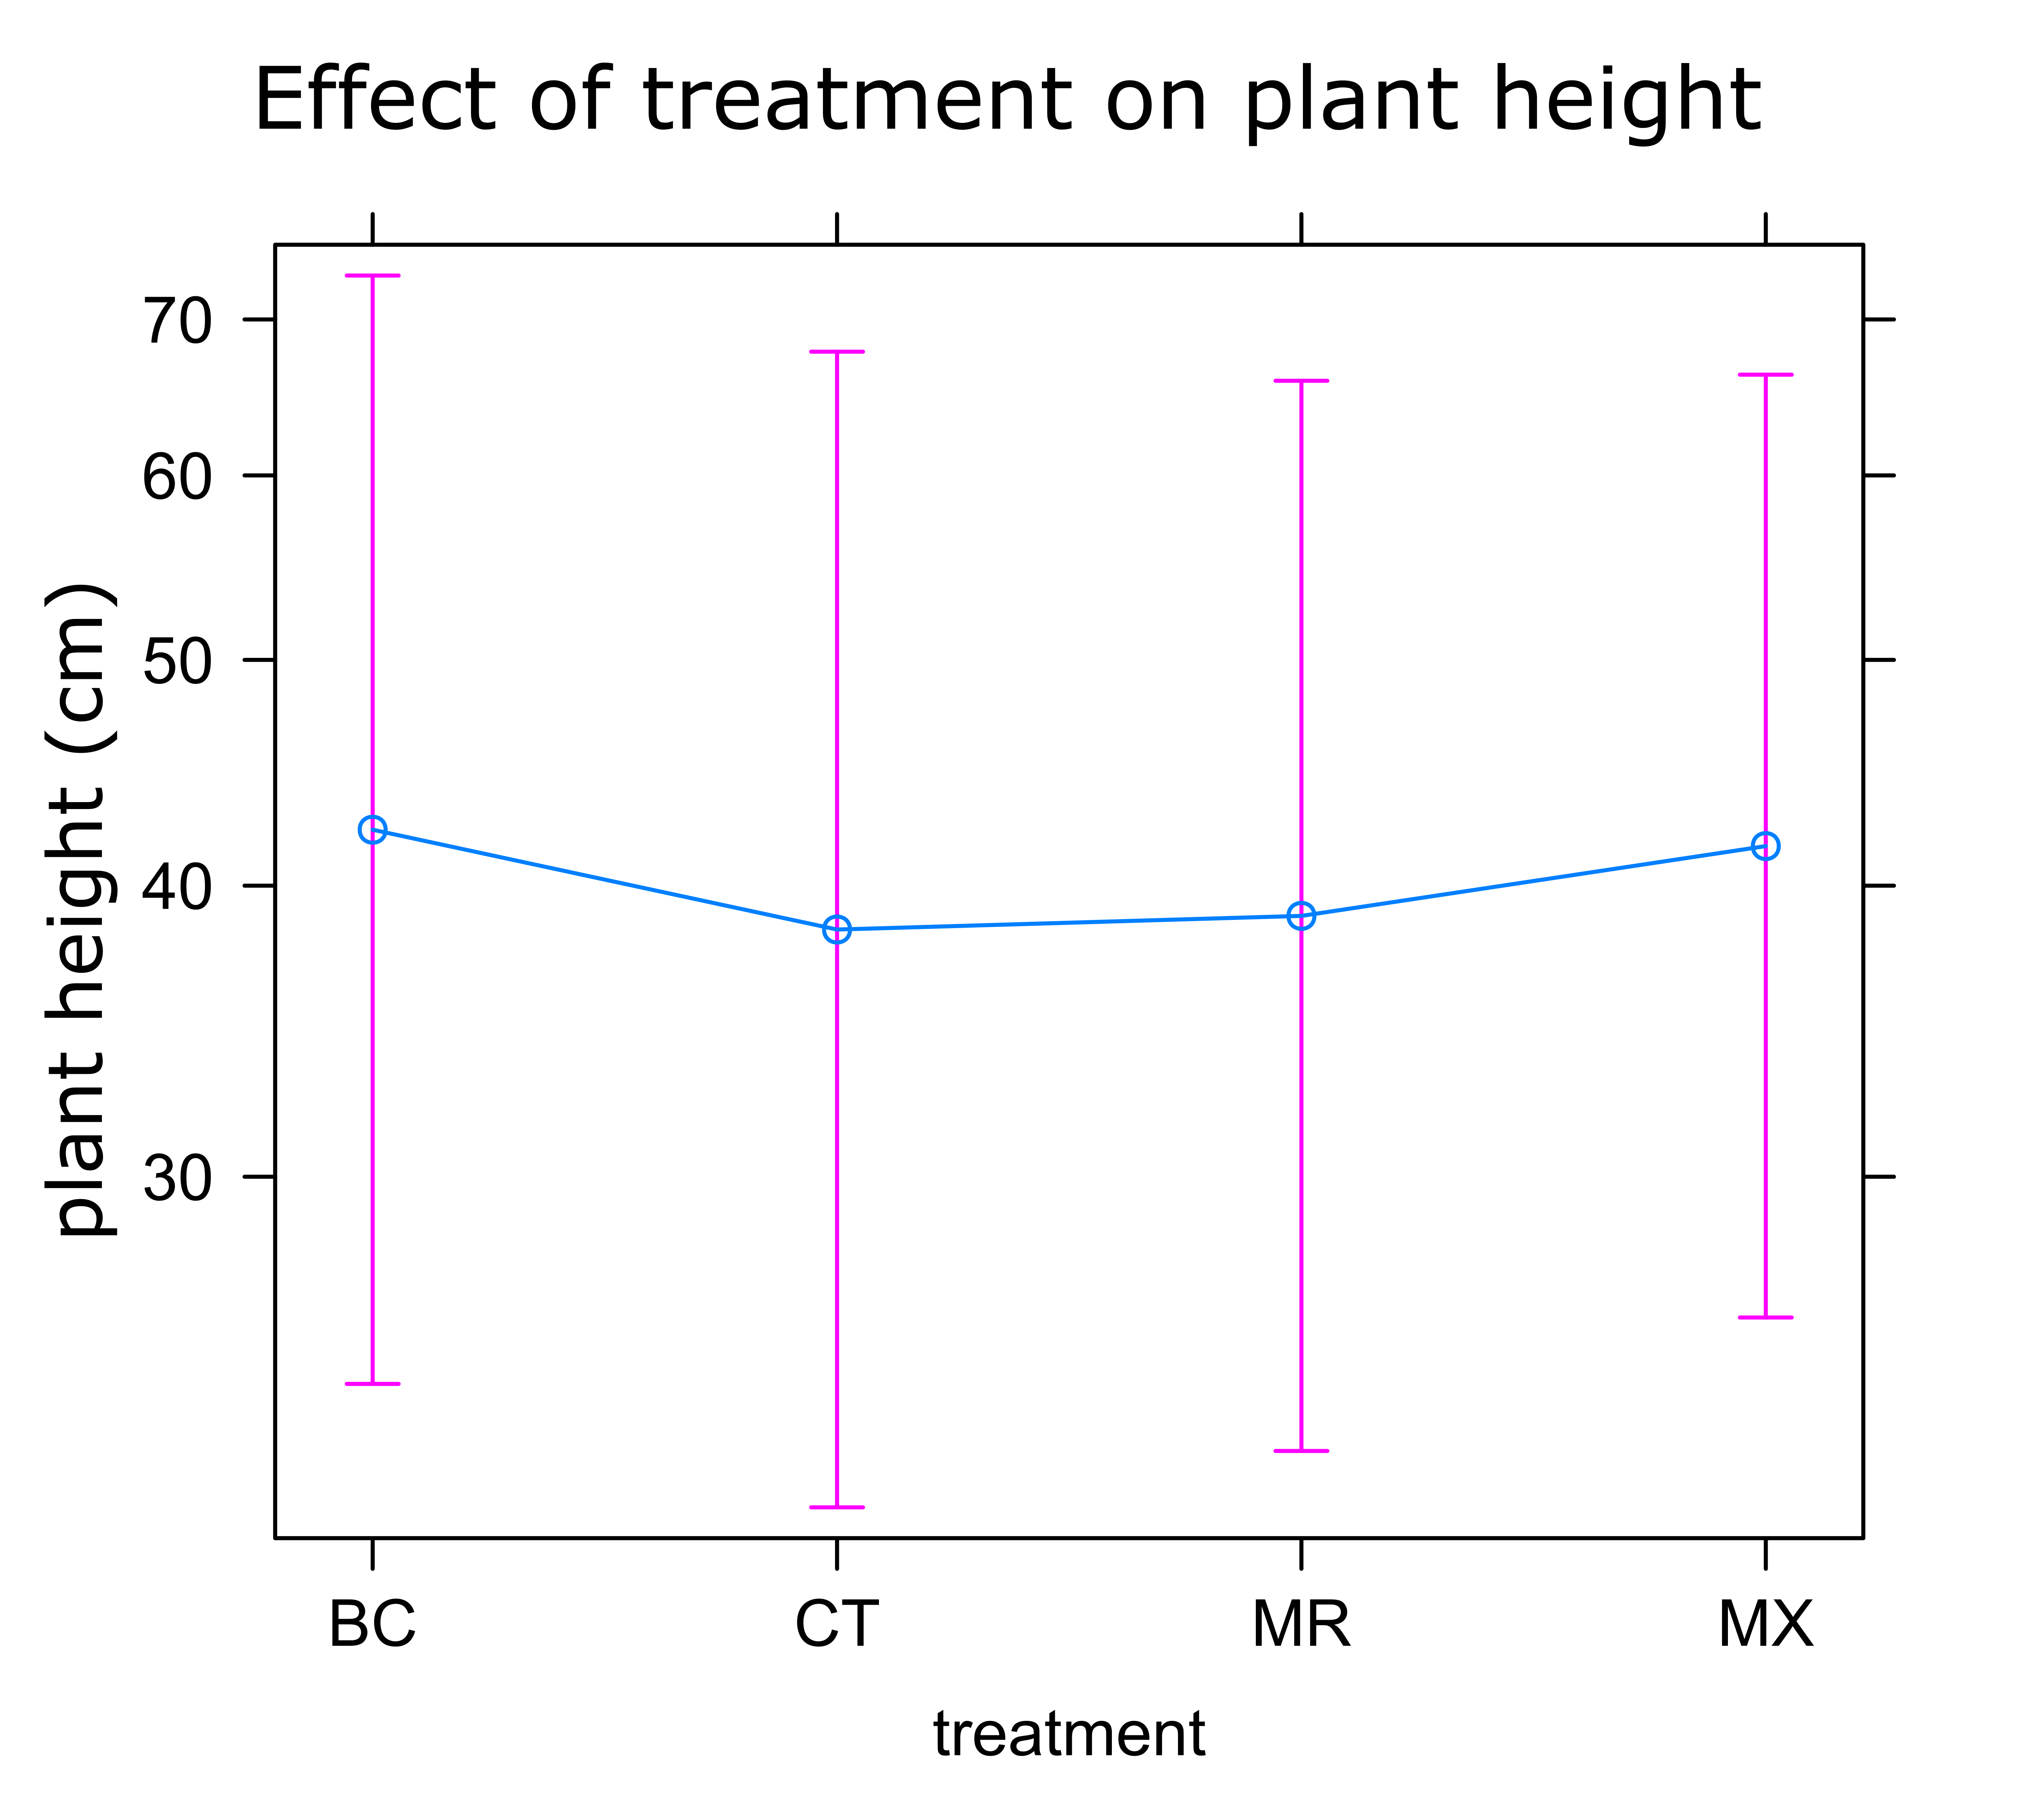
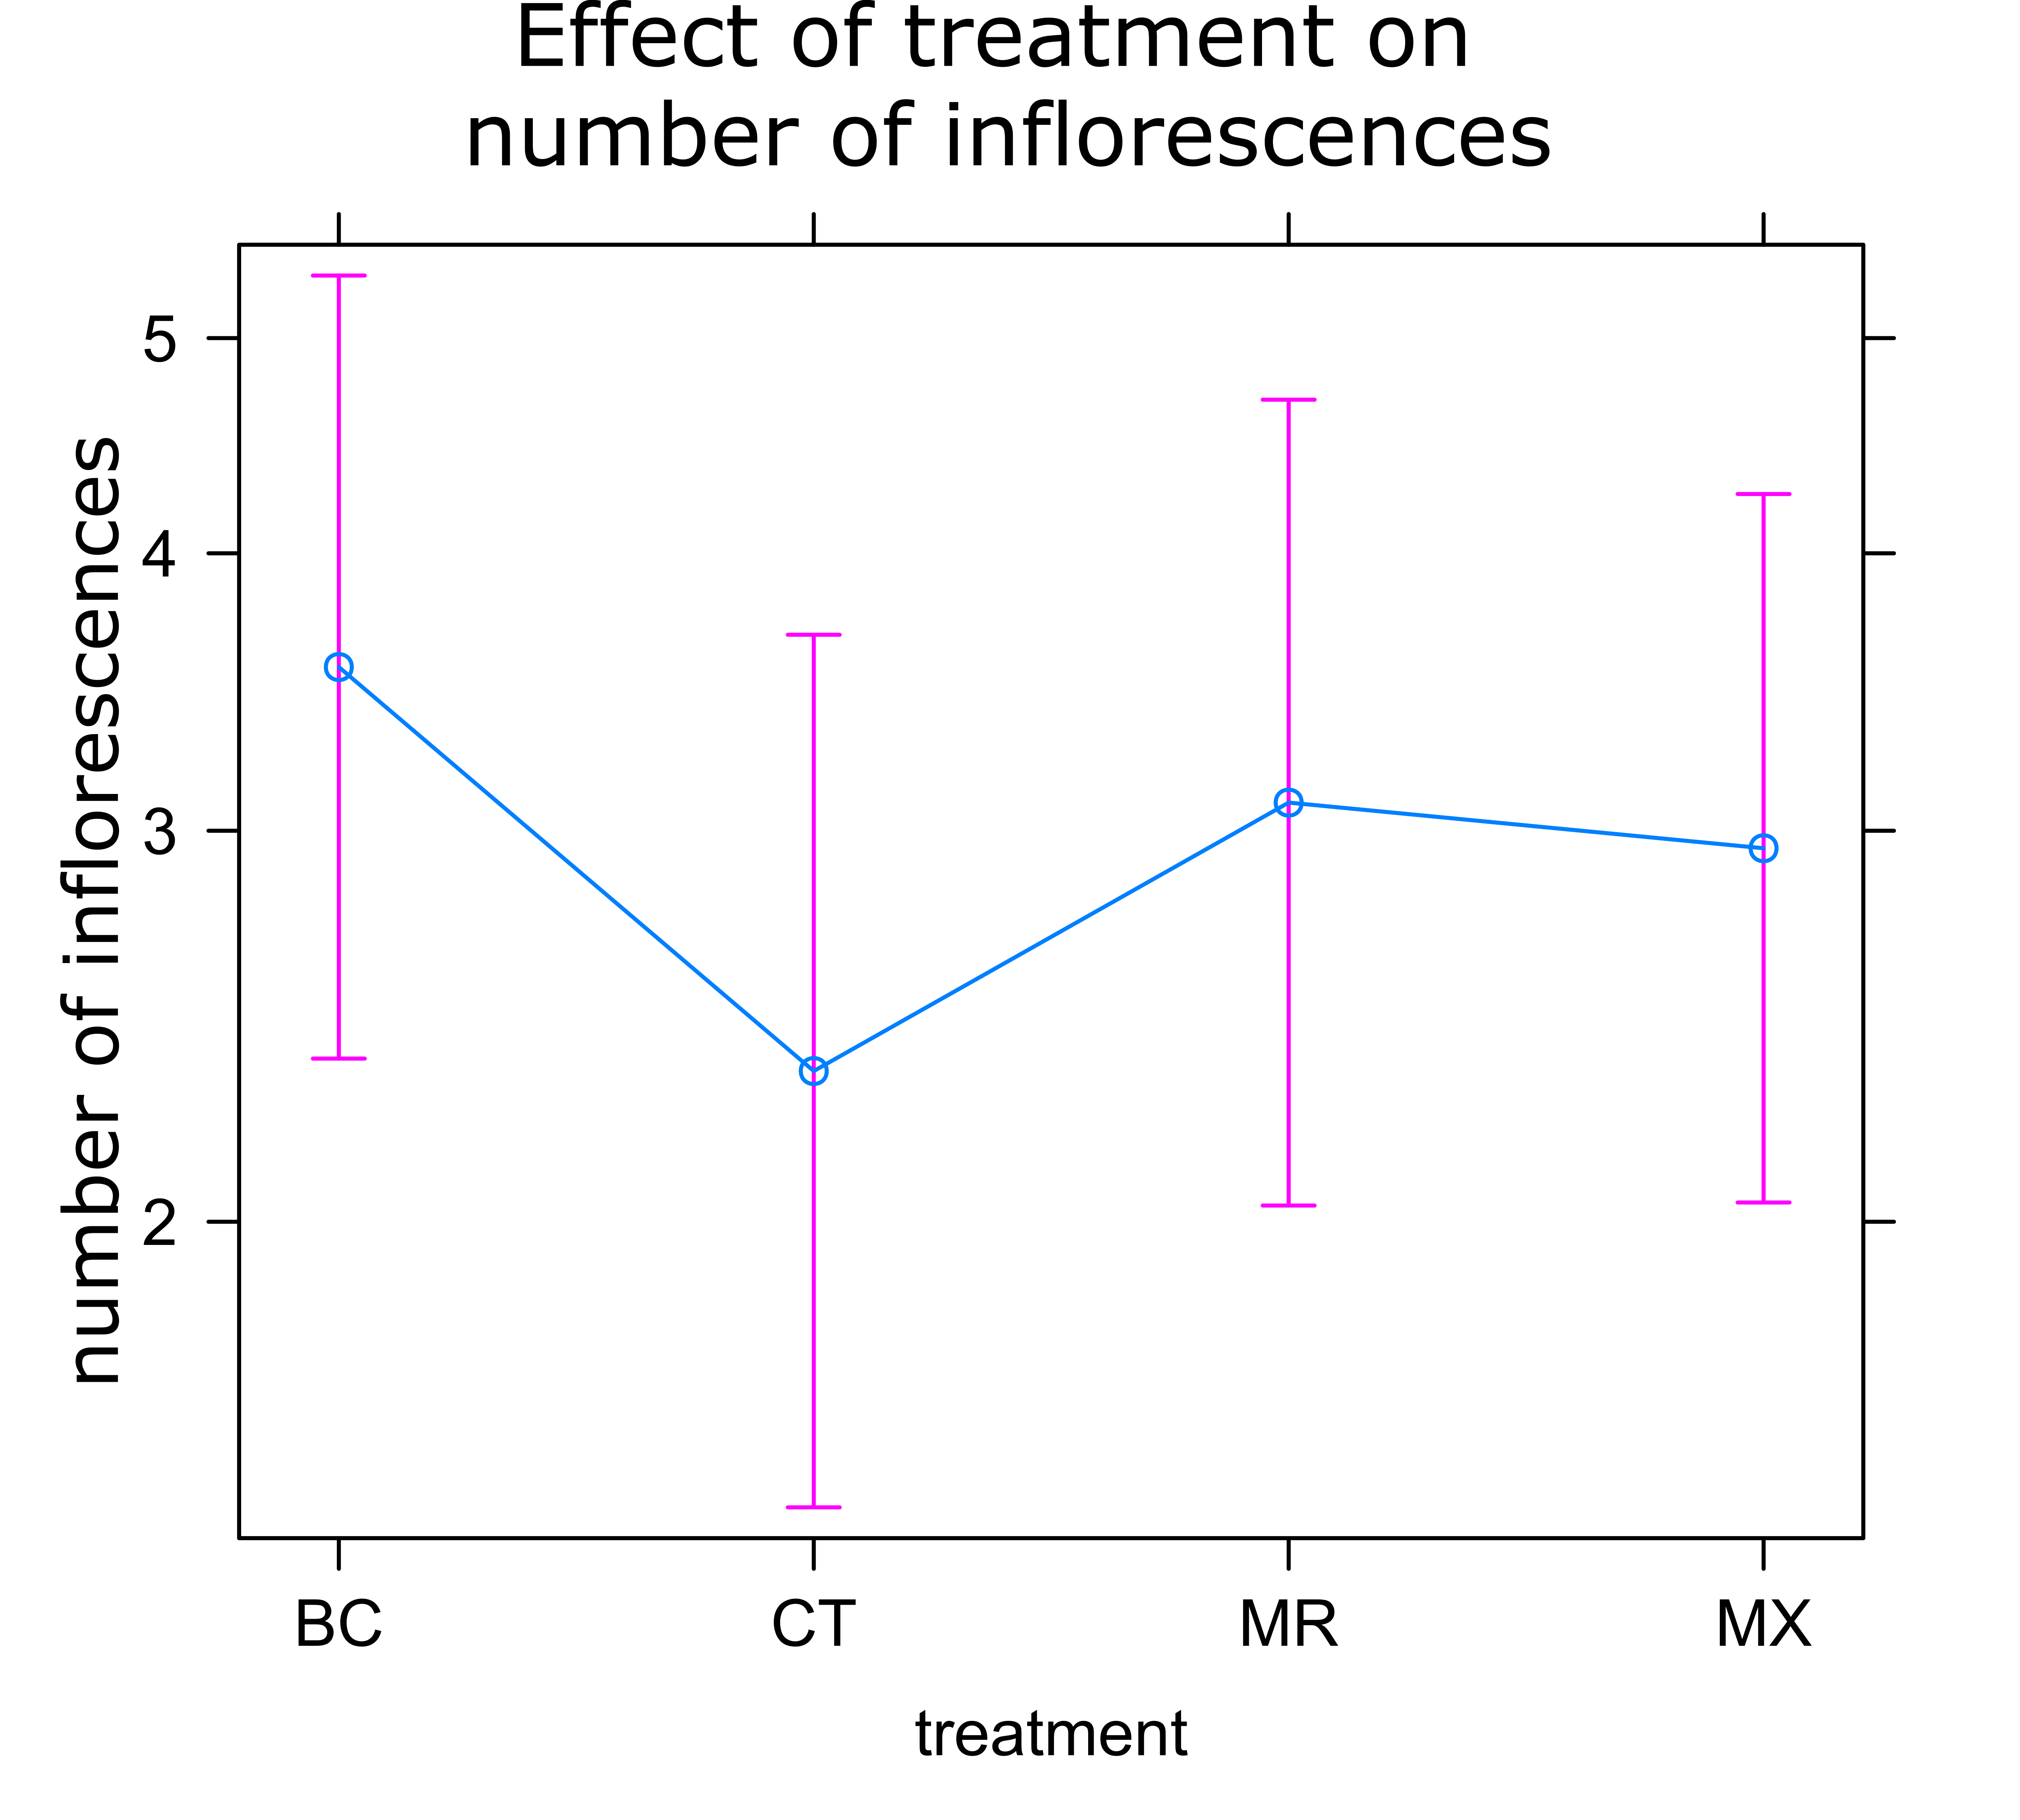
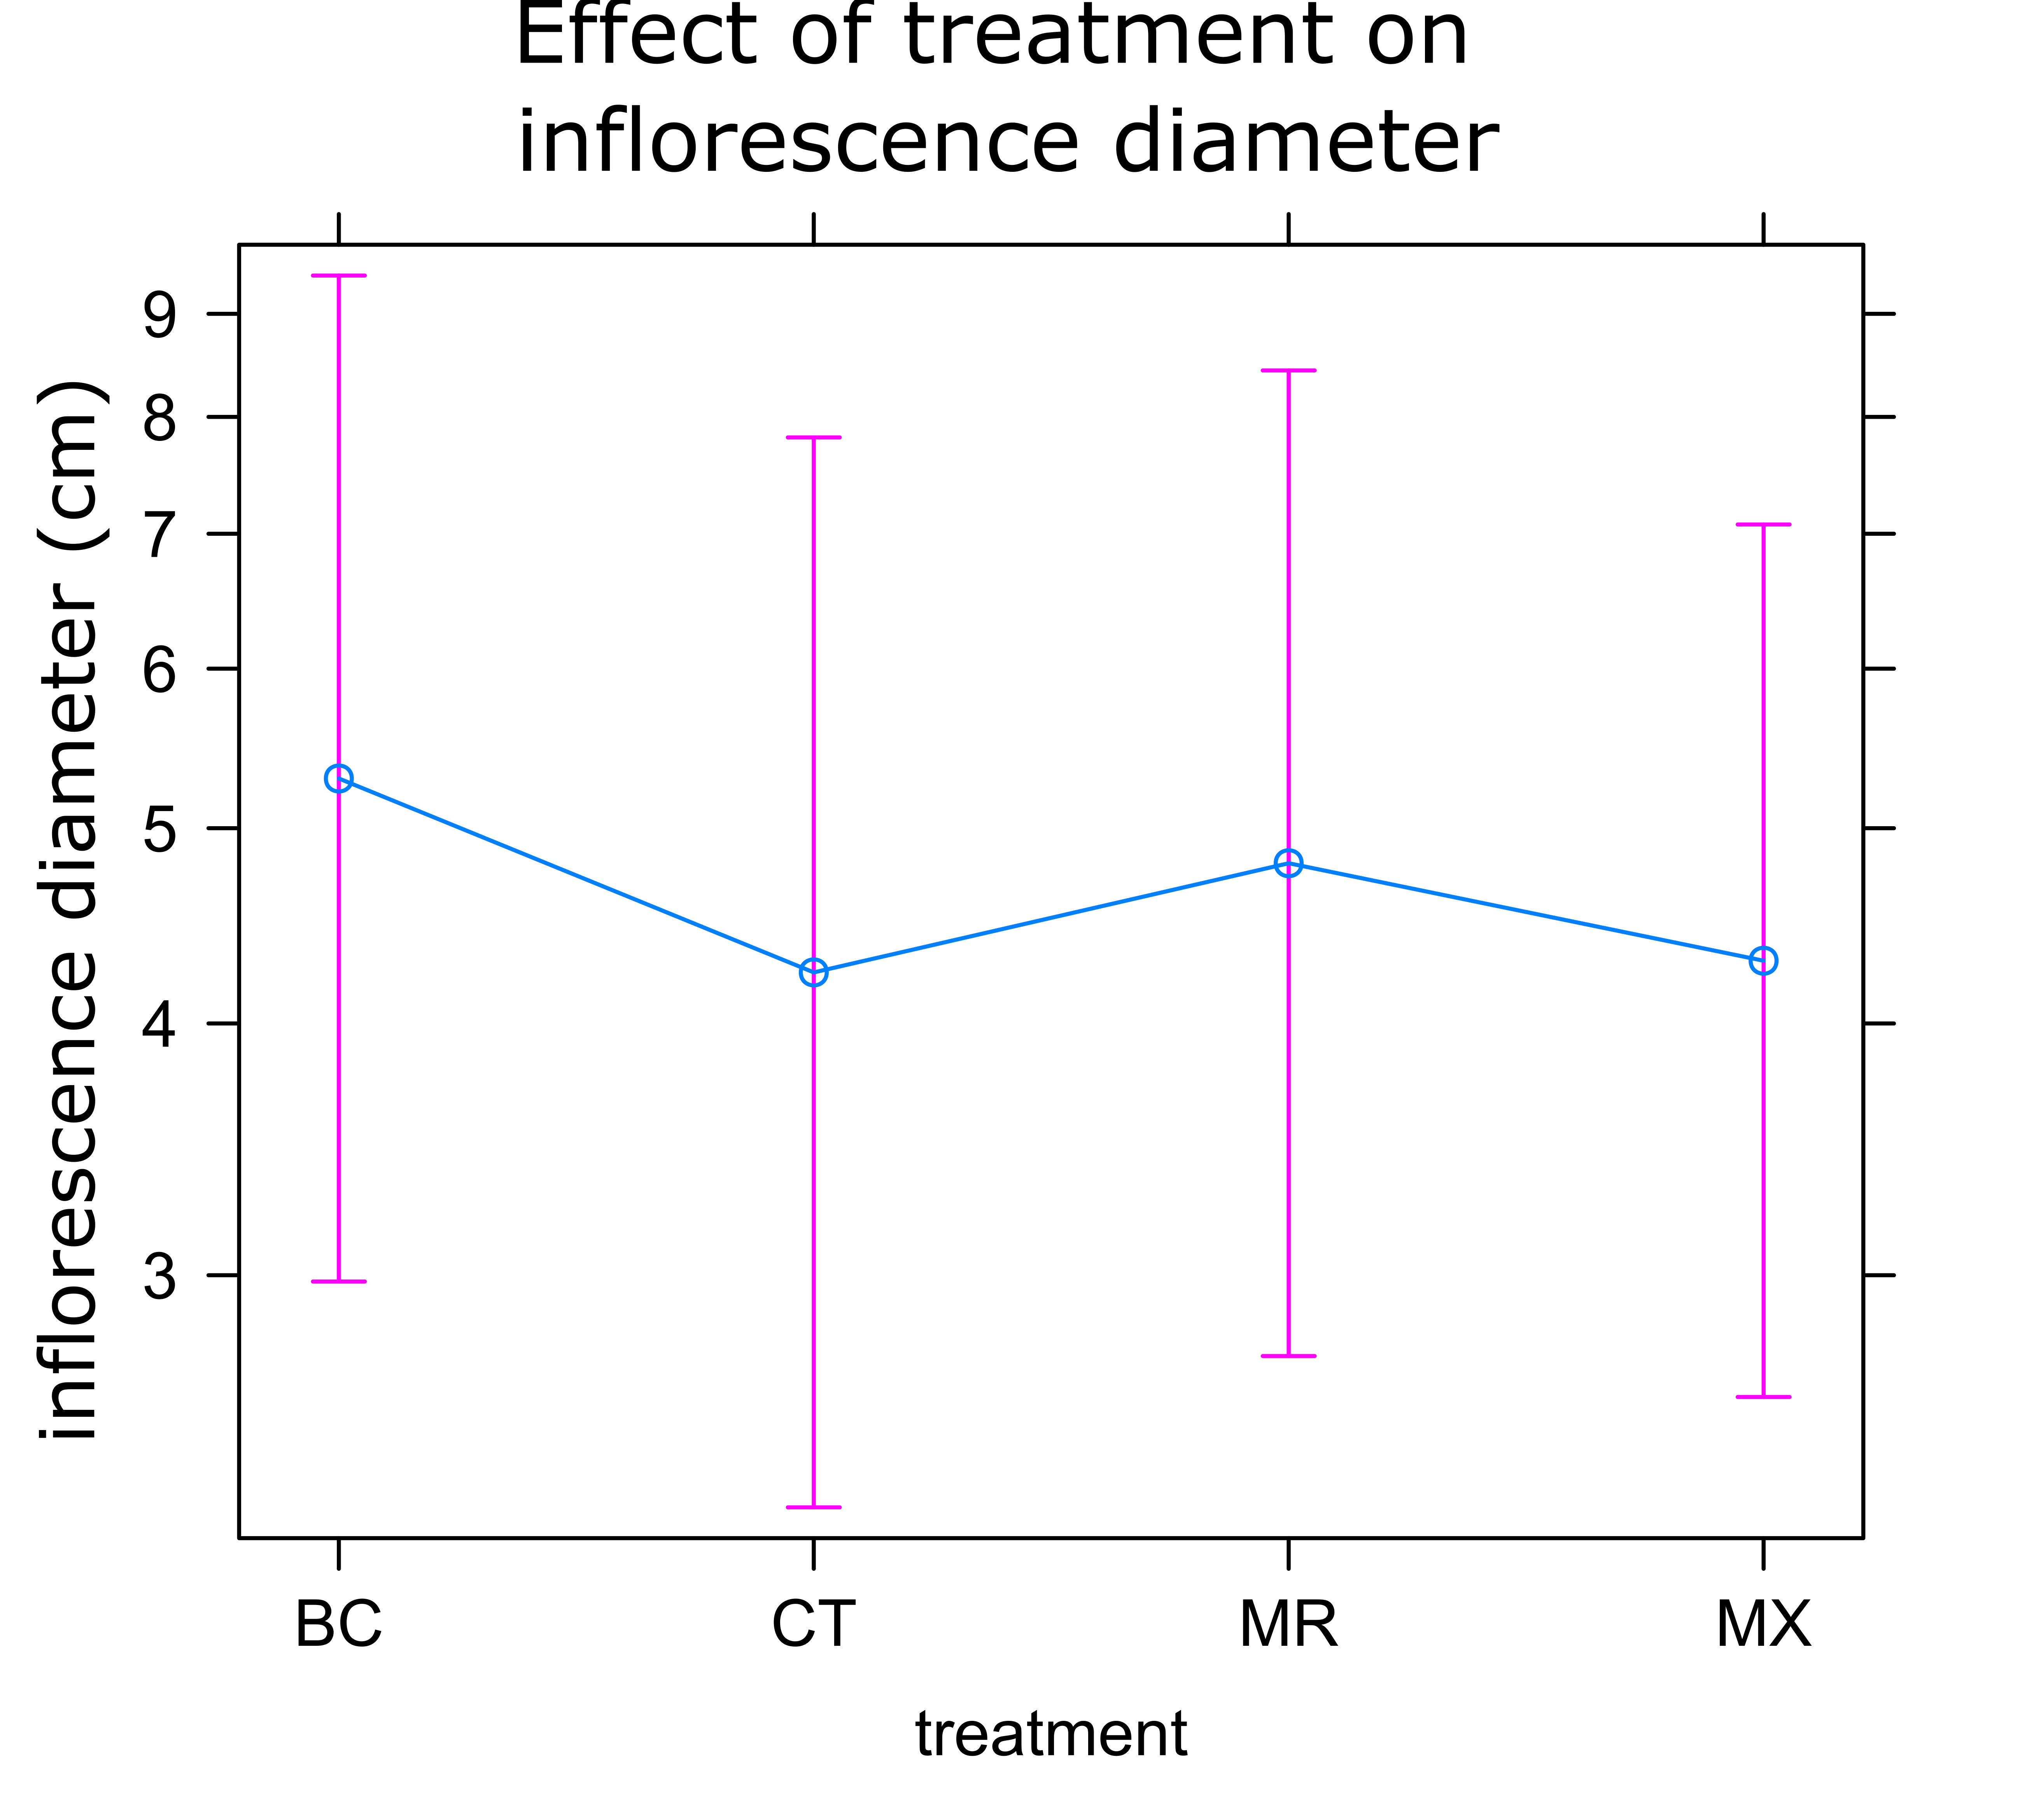
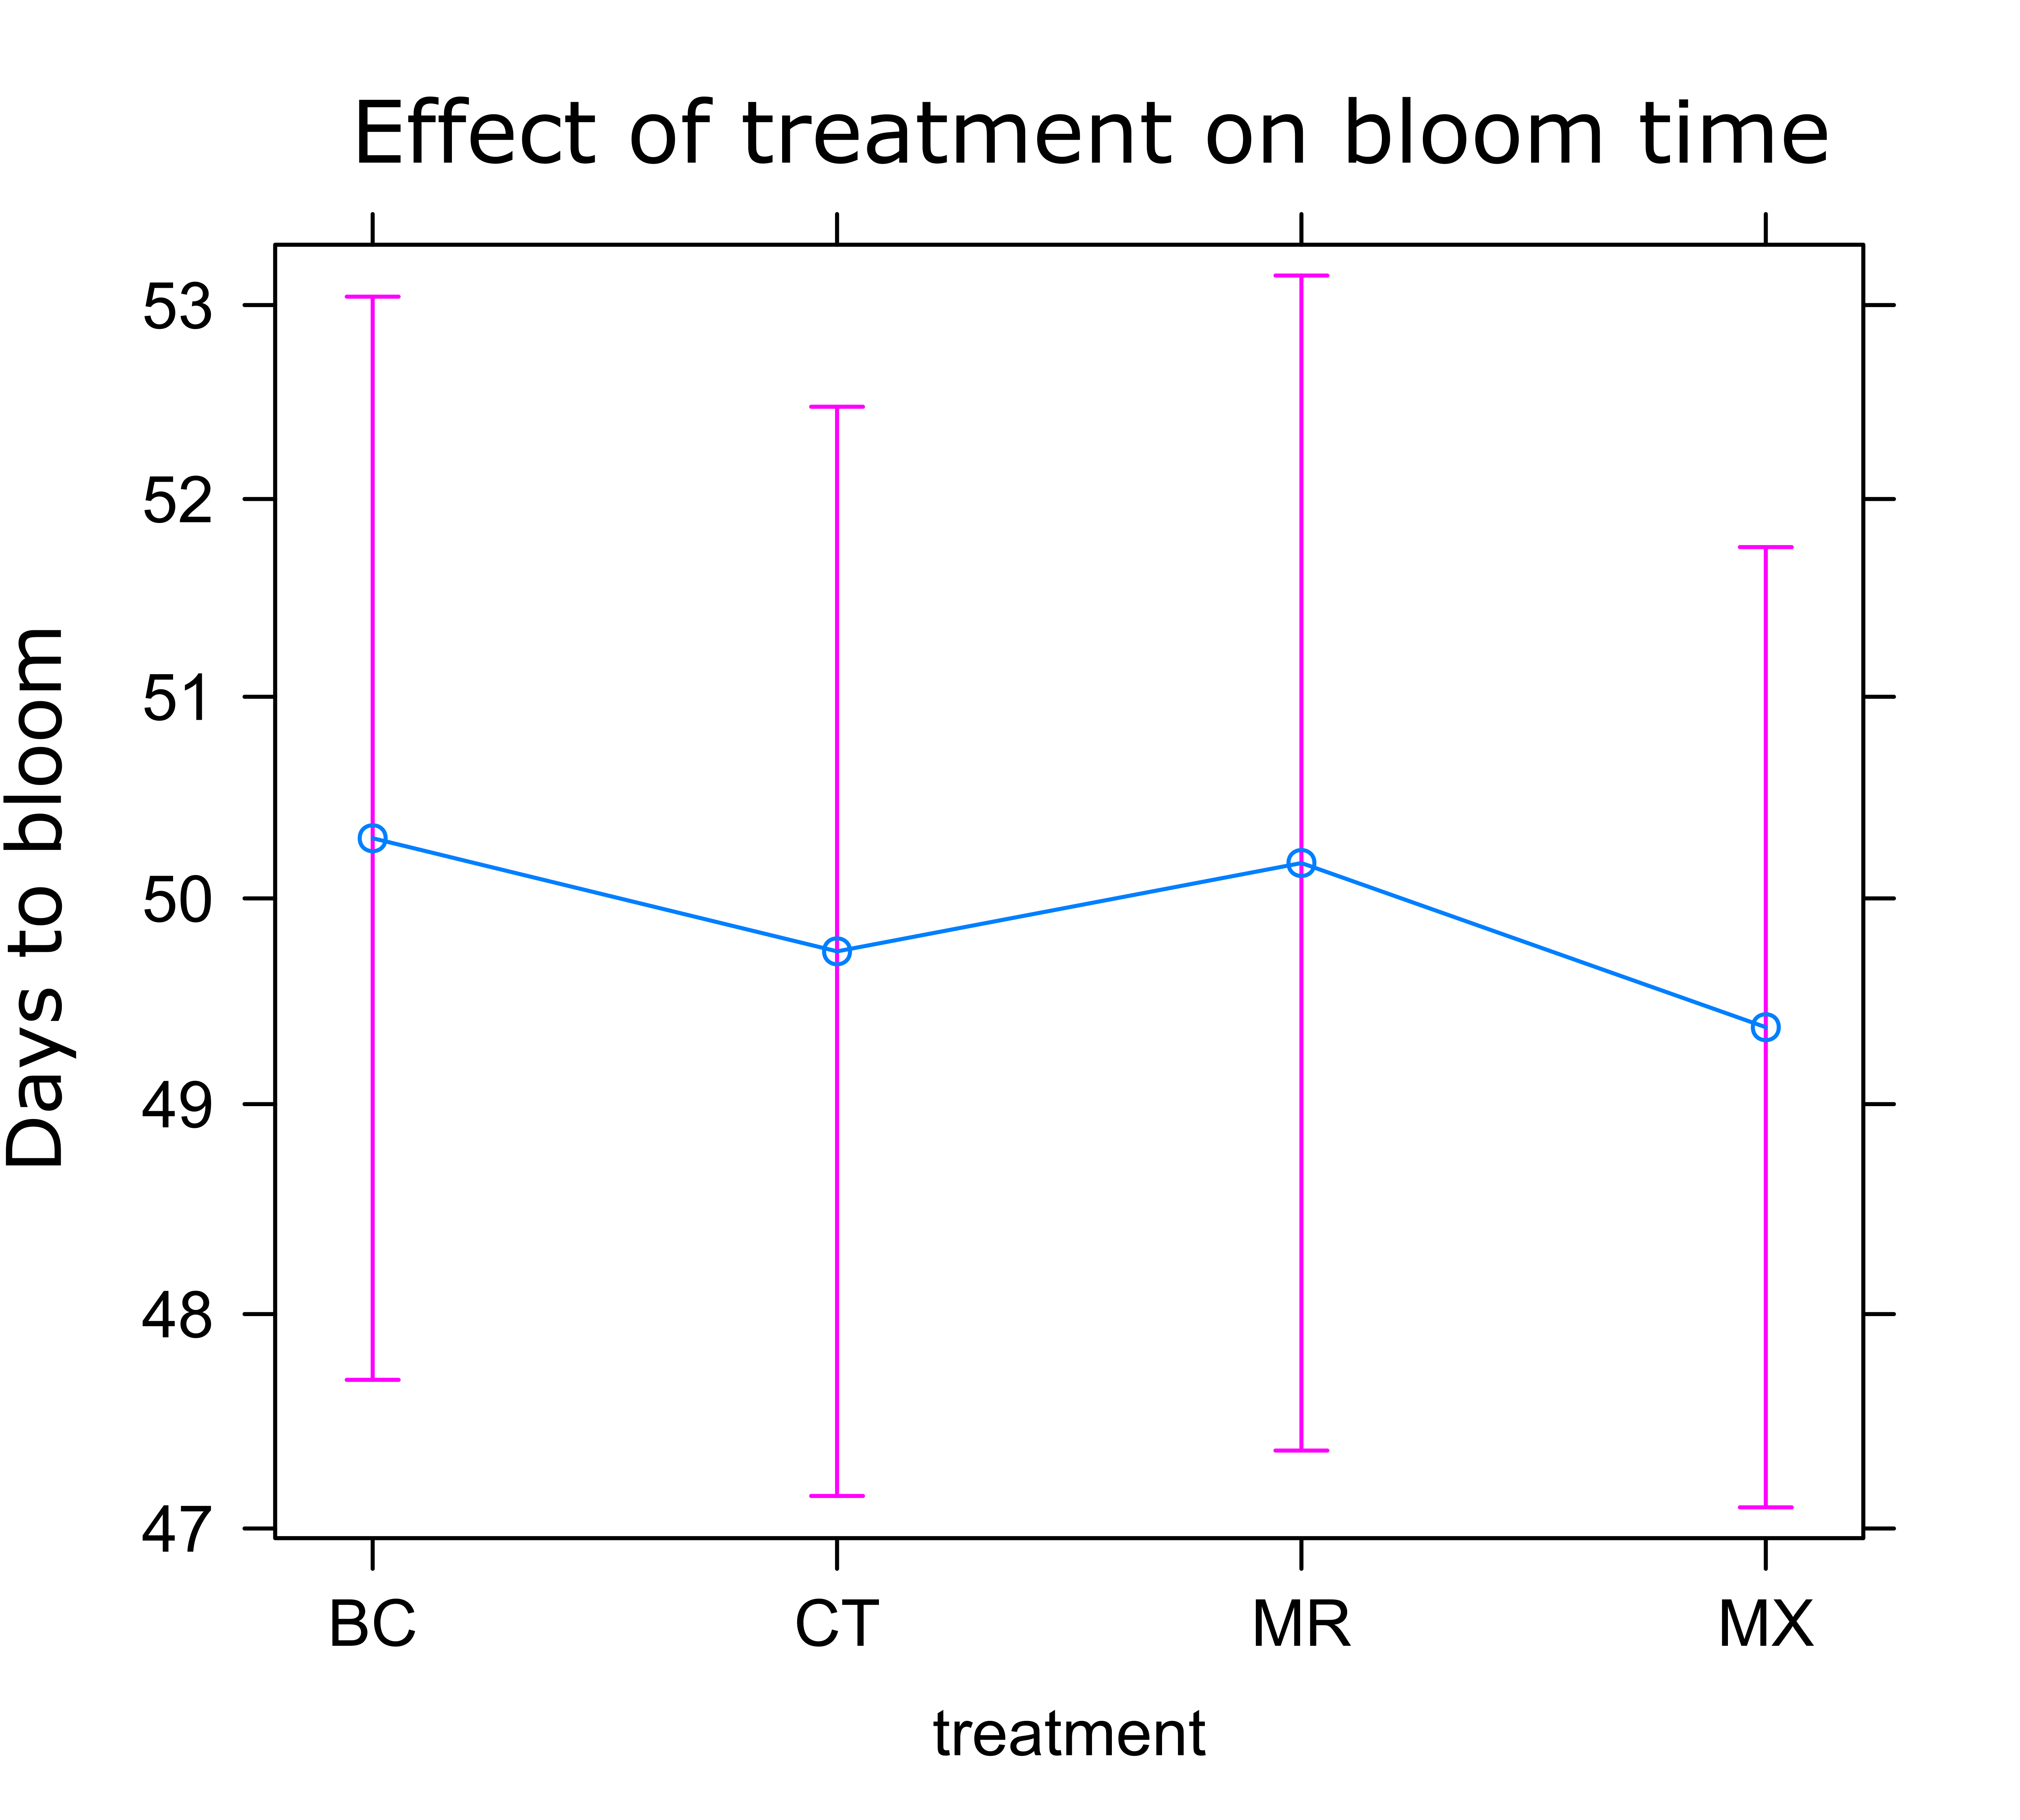
Sunflower Plant Growth: There was no significant difference in any of the plant growth metrics measured between treatments. On average control plants were the shortest and plants treated with either BC or MX were tallest (Figure 1). Control plants also had the fewest inflorescences and BC treated plants the highest number of inflorescences on average (Figure 2). Inflorescence diameter was smallest in control and MX treatment plants and largest in BC treated plants (Figure 3). Plants in the MX treatment bloomed on average 0.92 days earlier than BC plants, which were the latest to bloom (Figure 4).
Sunflower Insect Visitation: The best fit models for both insect and bee visitation included time of day, plant identification number, and temperature as random effects. However, there was only a minimal difference between this model and the model including inflorescence diameter and plant height. Because these variables are likely to have an impact on attraction of insect visitors, we selected this model (Models 8 and 16, Table 2). Visitation of all insects and only bees were both highest in the afternoon and lowest in the morning (Figures 5a and 5b) and decreased with increasing temperature (Figures 6a and 6b). Visitation of both insects and bees increased with increasing inflorescence diameter (Figures 7a and 7b). There were no statistically significant differences between treatments in insect visitation, but on average BC treated plants received the most visits and controls the fewest for both all insects and bees (Figures 8a and 8b).
Partridge Pea Insect Visitation: Visitation of both bees and all insects to partridge pea flowers decreased with increasing temperature (Figure 9c-d), as did bee visitation to nectaries (Figure 9b). However, visitation of all insects increased with increasing temperature in nectaries (Figure 9a). Like in sunflower, there were no statistical differences between treatments (Figures 10a and 10b). Visitation to nectaries by all insects was lowest in control plants and highest in the MR treatment (Figure 10a). Visitation of bees to nectaries, as well as visitation of all insects and bees to flowers was greatest in the mixed treatment, with little difference between other treatments (Figure 10a and 10b).
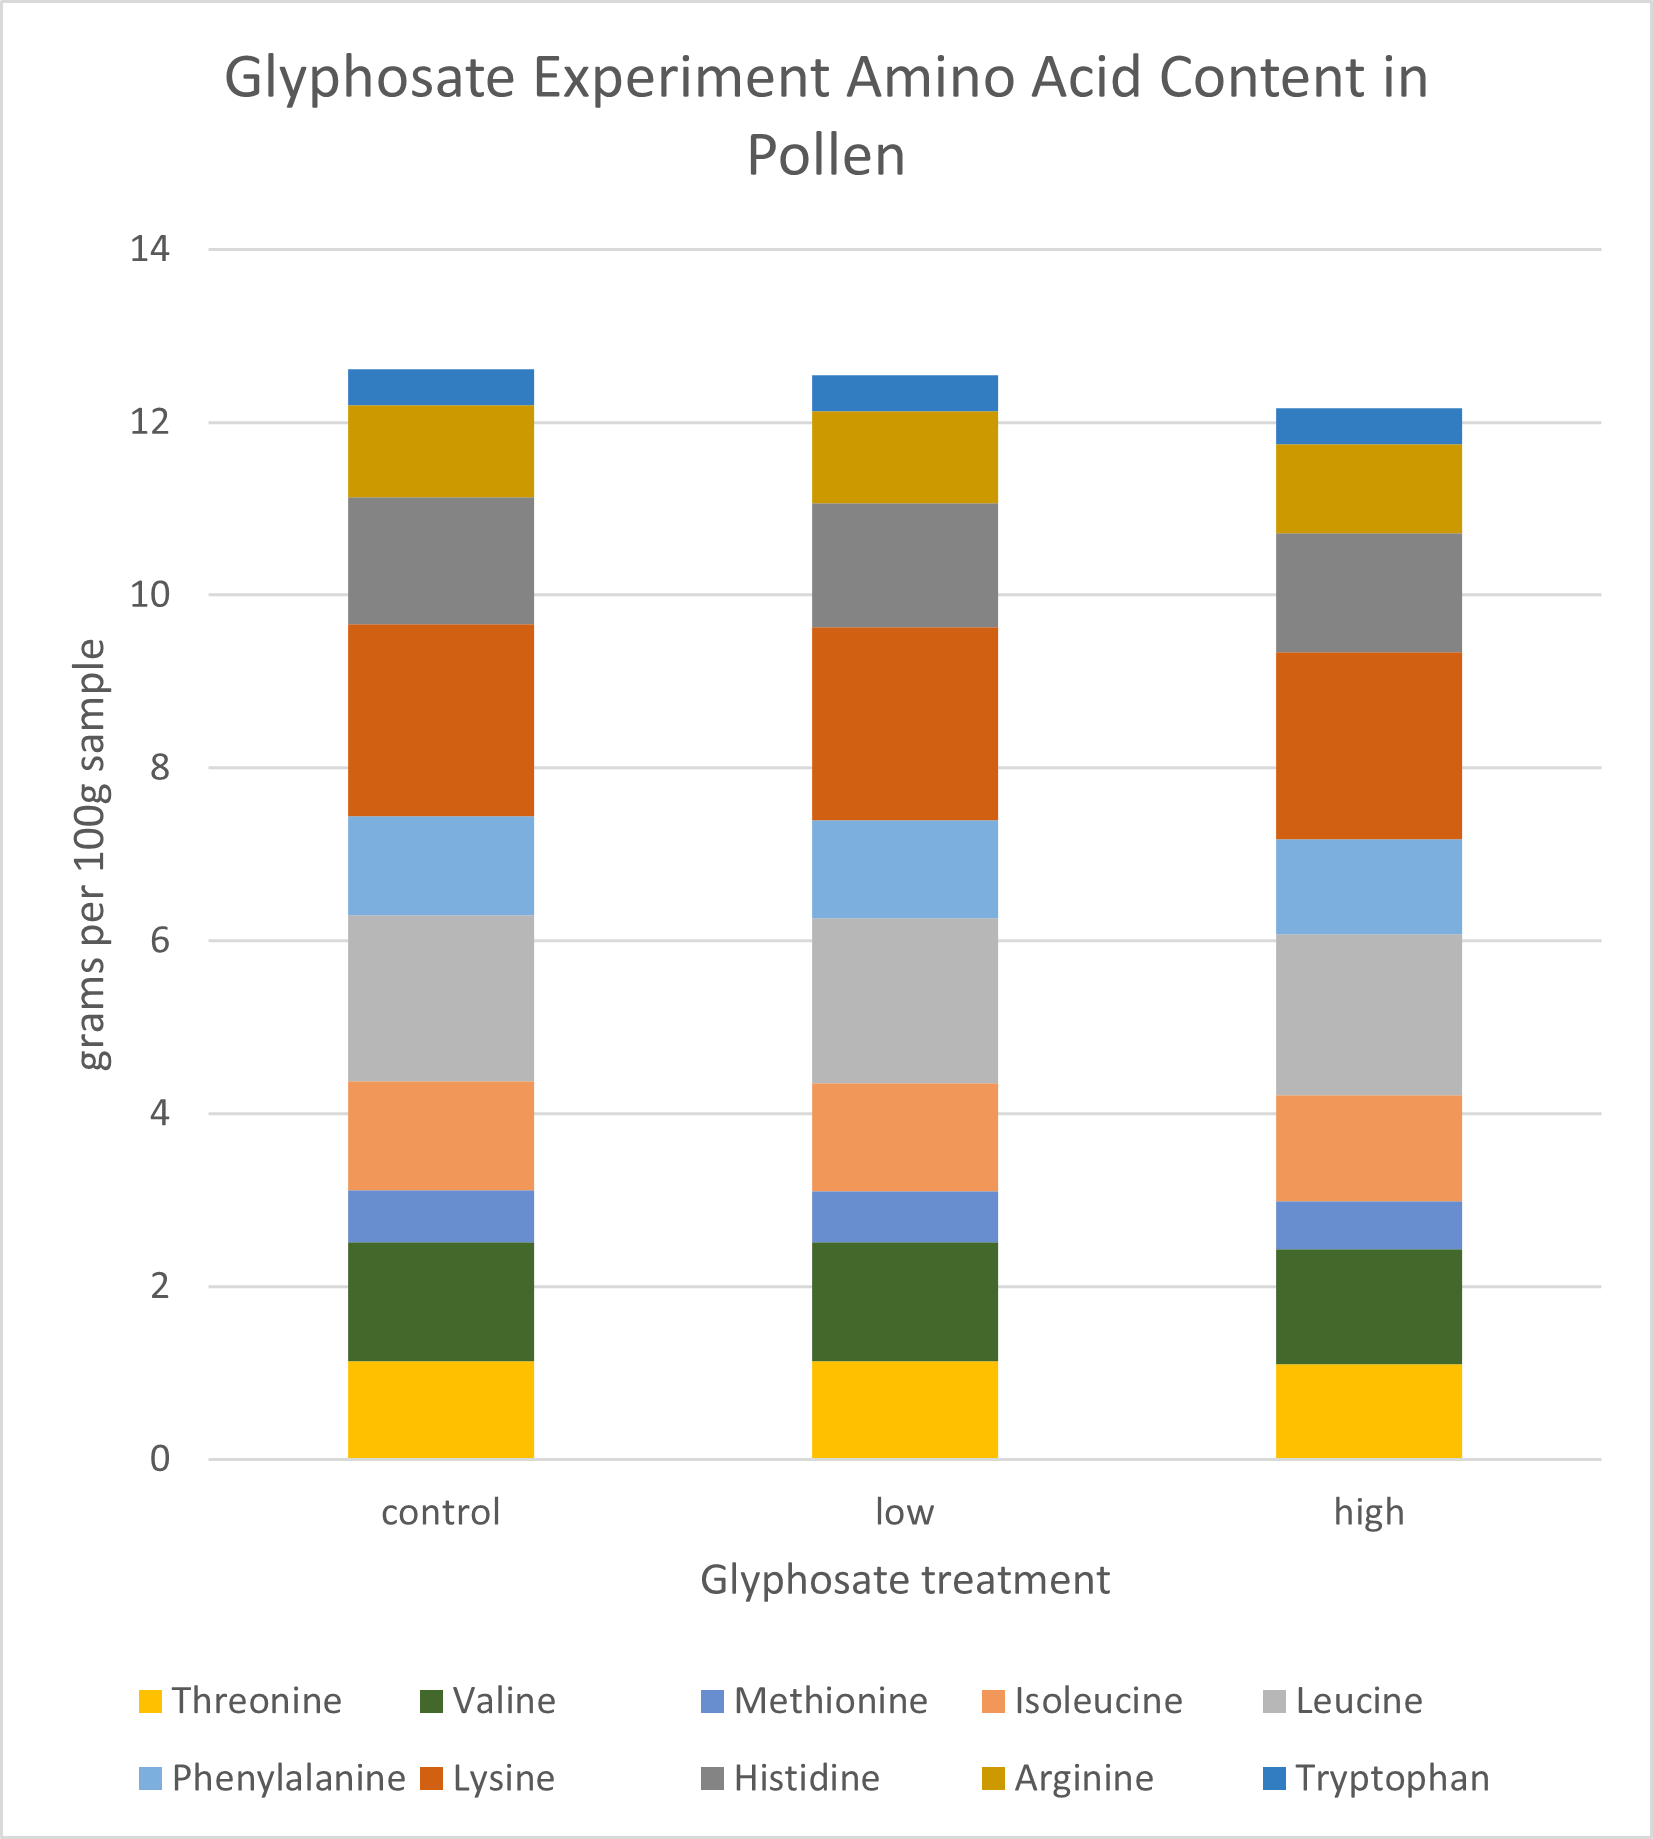
Pollen Analysis: Crude protein and total sugar and fat proportions were similar across samples (Figure 11). On average, dwarf sunflower pollen in this experiment was comprised of 29.3% protein, 62.0% sugar, and 10.8% fat. Protein content was highest in control plants and lowest in the BC treatment. The greatest fat and sugar content was found in MR treatment plants. However, these differences were very small. Finer scale analysis of amino acids also showed only slight differences between treatments. Of the 10 amino acids necessary for bee health and development, control plants had the highest grams per 100g sample (13.13g) and BC treatments had the lowest (12.47, Figure 12). The largest difference in a single amino acid was in Valine, with controls containing 1.43g per 100 g sample, and BC and MX treatments containing 1.36g and 1.35g respectively (Figure 12).

Differences in fatty acid content between treatments were also small. MX treated plants and CT plants had the lowest fat content (10.14% and 10.45% respectively), MR treatment contained 11.22% fat and BC treatments had the highest fat content (11.50%) (Figure 13). Some of the largest differences within individual fatty acids were seen in linoleic and linolenic acids. Linoleic (18:2n6) acid was 0.47% higher in the MR treatment (8.16% of total fat) than in the CT treatment (7.69% of total fat) (Figure 13). Linolenic acid (18:3nn) was highest in MR treatment (39.21% of total fat), and lowest in the BC treatment (37.97% of total fat), constituting a 1.24% difference (Figure 13). Pamitic (16:0) was 1.6% to 2.05% higher in the BC treatment than all other treatments (Figure 13).
Sugar content also differed only slightly between treatments (Figure 11). The MX treatment contained the lowest sugar content (61.23g per 100g sample), and the MR treatment contained the most sugar (62.86g per 100g sample). All treatments contained more glucose than fructose, ratios of glucose to fructose ranging from 1.03 in the BC treatment to 1.29 in control plants.
Nectar Analysis: As in the visitation experiment, no significant differences were observed in nectar concentration between treatments. On average, plants in the MR treatment had the lowest nectar concentration (0.34% lower than controls), while other treatments had similar concentrations (Figure 14).
Objective 2 Results
Insect Visitation: The best fit models for both all insects and bees included both time of day and plant identification number (Models 20 and 28, Table 3). Both insect and bee visitation were higher in the morning than afternoon (Figures 15a and 15b), though there was no statistically significant difference between the two sampling times. However, visitation did differ between treatments. Insect visitation was 40.8% higher in control plants compared to plants treated with a high dose of glyphosate (Figure 16a, p<0.05). Visitation in the low treatment was similar to the high treatment, though it was not significantly different than either control or high (Figure 16a). The same pattern was observed in bee visitation, with controls receiving 43.3% more visits per 10 minutes than high treatments (Figure 16b, p<0.05).
Pollen Analysis: Crude protein and total sugar and fat proportions were similar across samples (Figure 17). On average, dwarf sunflower pollen in this experiment was comprised of 29.0% protein, 61.7% sugar, and 10.9% fat. Plants in the low treatment had the highest proportion of fats and proteins, and control plants had the highest sugar content, but these differences were slight (Figure 17). While the low treatment contained the highest total protein (25.71g per 100g sample) compared to controls (25.6g per 100g sample) or high treatment (24.87g per 100g sample), looking at only the 10 amino acids needed by bees, CT treatment had approximately 1% greater amino acid content than either low or high treatments (Figure 18). Valine content was 1.04% lower in the high treatment than in either controls or the low treatment. Similarly, high treatment plants had 1.97% lower Lysine content than controls and the low treatment (Figure 18)
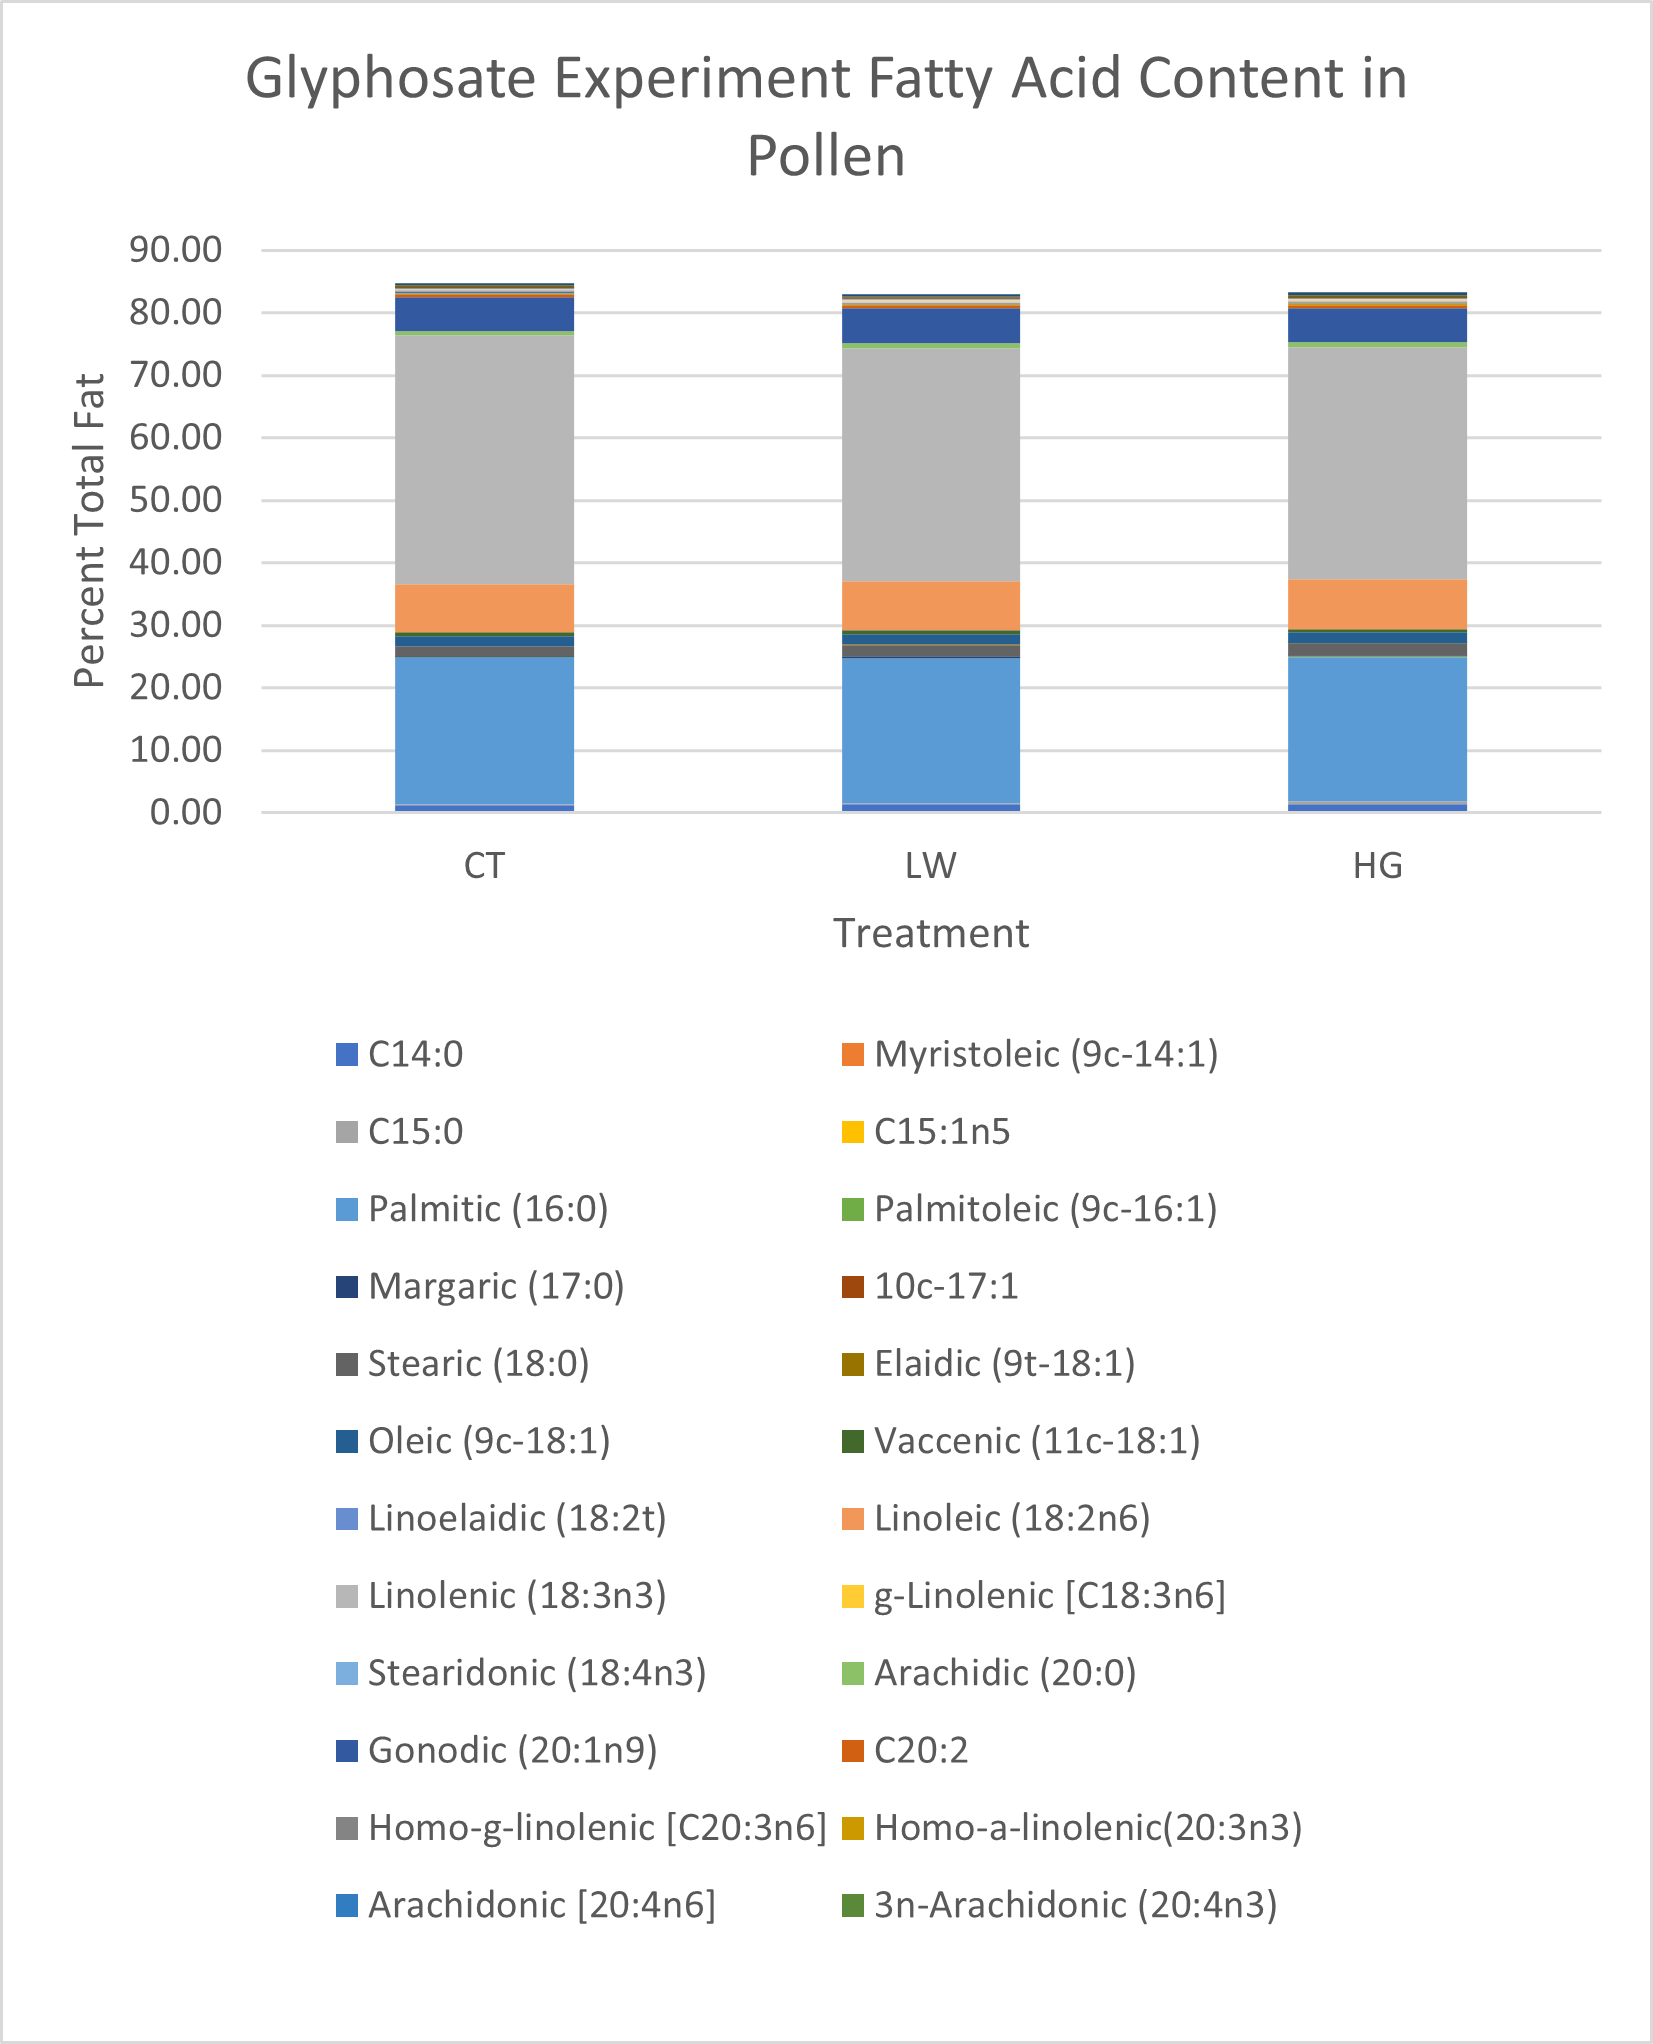
Total fat content was lowest in the low glyphosate treatment group (9.75% total sample) compared to high treatment (11.97%) or control plants (11.04%) (Figure 19). Linolenic acid in control plants was 1.07% higher than either high or low treatments (Figure 19). Linoleic acid was highest in the high glyphosate treatment group, and approximately 1% lower in both control and low treatments (Figure 19).
Sugar content was very similar between treatments, but higher in controls (35.71g per 100g sample) and low glyphosate treatments (33.92g per 100g sample) than in the high treatment (33.52g per 100g sample) (Figure 17). All pollens contained more glucose than fructose, with low and high treatments having a higher glucose to fructose ratio (1.31 and 1.32 respectively) than controls (1.16).
Discussion: Though there were no statistically significant differences between biofertilizer treatments in plant growth metrics or insect visitation, there are consistent patterns that may indicate biological significance. In sunflower, control plants on average were both smaller and had fewer inflorescences than plants treated with one or both biofertilizers, suggesting that these beneficial microbes may increase growth and flower production. This is not surprising given that both Baccillus spp. and mycorrhizae are known to promote plant growth, and these products are developed to improve plant health and growth. In both sunflower and partridge pea, average number of insect and bee visits were lowest in control plants and highest in the BC treatment. Despite the lack of significant results, the fact that we see the same pattern of visitation in two plant species suggests that there may be an impact of treatment on plants that alters their attractiveness to insect visitors. This may be due to the small changes in plant growth metrics or potentially other visual or even chemical cues. However, insect visitation may also be affected by factors we did not measure, such as interactions between insects on flowers. For example, some insects, particularly smaller bees, may avoid flowers or inflorescences with many insects present to avoid competition. We did observe some aggressive behaviors at flowers, particularly from medium to large sized bees. This could dilute the effects of floral attractiveness to insects by encouraging insects to visit less busy flowers.
While the microbe experiment in Objective 1 did not yield significant results, this does not mean that soil microbes do not significantly alter insect behavior and health. We tested two commercial products in two plant species grown in ideal conditions. There remains ample room to explore other soil inoculants, different plant species, or to look for potential protective benefits of microorganisms on plants under stress, such as drought or rising temperatures.
Glyphosate application at drift levels does seem to impact visitation of all insects as well as bees. While there was no significant difference between the low treatment and other treatments, there is a clear pattern of decreasing visitation with increasing glyphosate dose. Control plants received more than twice the number of visits of either low or high dose plants, suggesting that there may be biological significance even at the extremely low dose of 0.1% the recommended field rate. It is unclear the mechanism by which high drift levels of glyphosate reduce insect visitation, but given that glyphosate breaks down rapidly (citation) and several days passed between glyphosate treatment and the start of pollen dehiscence (when visitation sampling began), it is likely due to changes in plant chemistry and not detection of the herbicide by insect visitors. Glyphosate is a widely used product, not only in agriculture, but also by homeowners treating weeds in lawns, gardens, and other areas where potential bee forage is likely to be exposed to drift. Therefore, glyphosate use could have a major impact on the attractiveness of flowers to insects. This not only could impact the ability of pollen and nectar feeding insects to find quality forage, but could also decrease pollination, fruiting, and/or seed set in insect pollinated crops.
In both experiments, differences in pollen nutritional analysis were very small and not likely to represent biologically significant effects. It is uncertain how large these changes would need to be to result in significant changes to either attractiveness of flowers to insects or pollen feeding insect health. It is possible that the patterns observed in insect visitation are tied to pollen nutritional content. However, there may be other honest chemical or visual signals of plant health that influence insect behavior when foraging. Nectar chemistry may be an important factor for insect attraction, and we did not conduct nutritional analysis of nectar samples. We also did not measure pollen or nectar volume, which may be more important to some insect visitors than slight differences in nutritional quality, especially for nectar foragers.
Education & outreach activities and participation summary
Participation summary:
Workshop Summary
A day-long workshop was held in person on August 7, 2021 for 20 participants recruited through the University of Delaware Master Gardener Program. While the majority of participants were Master Gardeners, we had a few open seats which were offered to and filled by members of a local native plant gardening group on Facebook. The workshop consisted of two presentations (attached) with interspersed hands on activities. Each participant received a folder containing a business card sized bee identification quick reference guide and a flyer summarizing the workshop content on gardening for pollinators (attached). Additionally, the folder included several relevant factsheets and plant lists from the Xerces Society (www.xerces.org) publication library. Participants were first exposed to the diversity and ecology of flower visiting animals with a particular focus on bees. They were given a box of numbered specimens which they had the opportunity to observed under the microscope as different taxonomic groups and physical characteristics were discussed.
After lunch, workshop participants were given a tutorial on using the app iNaturalist to observe and identify plants and insects. One hour was then spent practicing using the app and observing some of the bees discussed in the morning presentation. Our afternoon presentation focused on resource needs of flower visiting insects, variation in floral rewards, and simple steps for creating quality pollinator habitat.
Online presentations
After receiving positive feedback from workshop participants, the extension office asked us to give the presentations in the form of an online training for first year Master Gardeners in September 2021. Two trainings, each approximately two hours, were conducted over zoom with a combined audience of 105 trainees and 3 University of Delaware extension professionals. These attendees did not receive the print resources, but were given digital version of all workshop materials. Additionally, these resources were shared with a handful of members of the native plant gardening Facebook group, who requested them upon learning that the workshop was full. The resources were later made publicly available on the graduate student's professional website.
Academic Presentations
The graduate student presented a poster at the Delmarva Soil Summit (February 26-27, 2020) outlining the study objectives, methods, and preliminary results. In fall 2023 she will give an oral presentation at the Entomological Society of America national meeting. Upon completion of the project, we anticipate producing at least two publications to peer-reviewed scientific journals.
Project Outcomes
The direct effects of glyphosate and other herbicides on insects through direct exposure are well studied, but no study that we're aware of has looked at indirect effects through changes to the plant. Our findings can better inform farmers and gardeners who are weighing the benefits and costs of using glyphosate to control weeds while also maximizing pollination services. We hope our study also encourages other researchers to test whether other herbicides or agrochemicals have similar effects. While we did not find significant effects of biofertilizers, this project opens the door to further exploration of how soil ammendments might alter floral rewards or attractiveness of flowers to pollinating insects. We tested two plant species, both of which were annuals. Effects on different annual species, or on perennials receiving multiple treatments over the course of several years may produce different results. Likewise, there are a vast array of biofertilizers and other soil ammendments that have the potential to increase nutritional quality of pollen in flowering plants.
I was surprised by the results of this project. Prior to collecting data, I expected to observe stronger effects of microbial inoculants on insect behavior and pollen nutrition. Given that plant growth promoting rhizobacteria and mycorrhizae are known to improve plant health and have been tied to changes in pollen viability and seed set, I expected chemical changes during pollen development that would be detectable by foraging insects. While we did not see significant differences in visitation between treatments in objective 1, I do believe the consistent pattern across both plant species indicates there is a weak effect, or the effect is masked by other factors we did not control for. While we would not expect drastic differences in nutritional content of pollen within a plant species, the differences we observed were smaller than expected.
The results of the glypohsate experiment in objective 2 did surprise me. While I expected to see decreased insect visitation in treated plants, a greater than 40% decline in visits between control and high dose plants was unexpected. In designing this experiment, I was trying to address indirect effects of herbicide through changes to the plant and not direct exposure of insects. However, I was skeptical that any changes resulting from the herbicide would have measurable effects on insect behavior. These results have strengthened my interest in better understanding how common land and crop management strategies might indirectly affect pollinators through changes to plant chemistry, or visual cues observable by bees but not humans.
While I have enjoyed conducting research in sustainable agriculture, my true passion is teaching. I will be starting a teaching position in Biology at West Virginia University this summer and plan to continue educating gardeners and farmers in managing land to support insects through WVU cooperative extension and other organizations.
Because very little is known about the effects of glyphosate and biofertilizers on insect visitation and floral rewards, our project is limited in scope, but opens the door to future study. As discussed previously, similar experiments could be conducted exploring effects of other soil ammendments or agrochemicals, or looking at our treatments in other plant species. In particular, we are interested in the effects of vermicompost compared to other composts or fertilizers because it contains plant growth hormones and promotes plant immune health. Furthermore, there are other variables that could be explored in future work, such as the amount of time individual insects spend handling flowers. We measured visitation to sunflower, which is a composite, at the level of the inflorescence and not individual disc flowers. Using video to record insect behavior on flower heads could yield finer scale information on how insects are interacting with floral rewards.
The results of our glyphosate study both inform herbicide users of potential risks and raise more questions. While our study was conducted in potted plants in controlled settings, it would be interesting to see if the patterns we observed are also found in field settings. Further, we are curious whether glyphosate drift has indirect impacts on insect herbivores. While decreasing herbivore feeding could be beneficial in pest control, it could also have negative impacts of populations of beneficial herbivores such as monarch butterflies. We are currently testing these impacts on milkweed and monarch caterpillars in the greenhouse and laboratory. We hope our work spurs more exploration of the indirect impacts our actions as land managers, farmers, or gardeners have on beneficial insects by altering plant chemistry or phenotype.