Final report for GNE20-229
Project Information
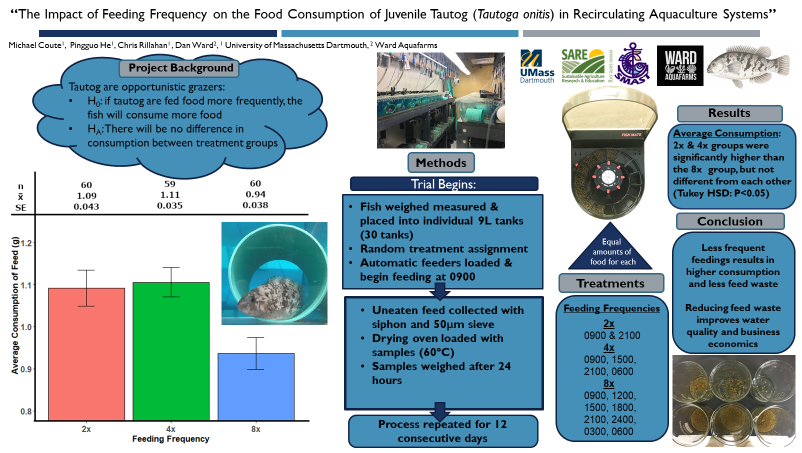
Tautog (Tautoga onitis) are a valuable commercial and recreational finfish species in southern New England coastal waters, but high demand has led to depleted populations. To counter this decline, tautog have been identified as a candidate for finfish aquaculture. Worldwide, aquaculture is the main source of fish for human consumption and is driven by advancements in technology and production. Some of the most important aspects of aquaculture include the type and amount of feed, as well as efficient feed delivery techniques. We incorporated tautog feeding behavior into culture methods by focusing on how and when the feed is distributed to individual fish. Fish were fed the same amount(g) of commercial pellets at different intervals over 24 hours. On average, fish fed two or four times per day consumed significantly more food than fish fed eight times per day. The effects of different feeding frequencies on individual tautog provided insight into variable yet distinct patterns of food consumption. Regional aquaculture farmers can develop cost efficient strategies for feed delivery that reduce feed waste by using practices that incorporate individual feeding behavior.
Objective: Observe the effects of feeding frequency on feeding behavior of tautog (Tautoga onitis)
This was achieved by using three different feeding frequencies, and one singular method of feed delivery, in order to isolate the test variable. All three feeding frequencies used automatic feeders (Fish Mate f14 Aquarium Fish Feeder). One frequency was the control, where fish were fed twice daily by automatic feeding systems. The experimental methods dispensed pellet food a total of four feedings per day and eight feedings per day (Experimental groups #1 & #2). The time intervals were over the course of a 24 hour day period, with equal feed administered during light and dark hours. The results of this experiment allowed us to understand how often juvenile tautog prefer to be fed, and these observations around feeding behavior informed us on preferred feeding schedules in order to maximize growth of tautog in recirculating aquaculture systems.
The purpose of this project was to improve feeding strategies for finfish aquaculture farmers by incorporating fish feeding behavior. Tautog (Tautoga onitis) is a coastal wrasse native to the Northeast coast of the United States (Bigelow & Schoeder, 1953). Tautog are highly sought after and are actively pursued by recreational and commercial anglers due to its desired flesh quality for human consumption (ASMFC 2017). Overfishing of the wild stock and high demand for the fish has made the species an ideal candidate for finfish culture in recirculating aquaculture systems (RAS). Farm reared tautog will provide an environmentally sustainable wild fish substitute to relieve the currently stressed wild population while providing regional aquaculture farmers with a local finfish product to bring to market.
Previous research from Ward Aquafarms and UMass Dartmouth, funded through SARE, provided significant results where tautog fed with a natural diet grew from 7 grams to ~ 400 grams in under 9 months, which is double that of previous trials (Perry et al. 1998). It has been demonstrated that tautog can grow well when fed a natural diet, and in order to make this a commercially feasible operation, understanding feeding behavior and feed delivery systems is essential.
The means and timing of feed delivery continues to be a primary focus in aquaculture research (Attia et al., 2012). One way to obtain knowledge about how often fish feed, is through observing behavior and consumption trends with feeding frequency experiments. For husbandry purposes, it is critical to understand a fish species’ feeding patterns so that feeding times and amounts can be set appropriately (Wang et al., 1998). The daily number and frequency of mealtimes have vital implications on food consumption (Volkoff & Peter, 2006). Additionally, knowledge about feeding periodicity and applications relative to these innate rhythms is an important consideration in the economics of an aquaculture business (Spieler, 1977). Testing has been completed for many different cultured species and feeding frequency increases have shown positive results in growth and consumption of rainbow trout (Oncorhynchus mykiss) (Ruohonen et al., 1998), yellowtail flounder (Limanda ferruginea) (Dwyer et al., 2002), channel catfish (Ictalurus punctatus) (Greenland & Gill, 1979), hybrid sunfish (Leopmis cyanellus x L. macrochirus) (Wang et al., 1998), zebrafish (Danio rerio) (Lawrence et al., 2012) and halibut (Hippoglossus hippoglossus) (Schnaittacher et al., 2005). Observed patterns through feeding frequency studies can assist in developing standardized feeding regimes and ultimately benefit business economics.
Feeding regimes are age and size dependent, and identification of preferred feeding frequencies for species at specific sizes will provide valuable data for culture programs (Andrei et al., 2017). Successful culture programs maximize production while limiting feed waste due to overfeeding (López- Olmeda et al., 2012). Overfeeding may reduce water quality, increase environmental degradation, and place a burden on filtration based recirculating systems (Cho & Bureau, 1997; Fast et al., 1997; Attia et al., 2012; Pavadi et al., 2012). By illuminating juvenile tautog feeding patterns with feeding frequency experiments, results could assist tautog farmers to reduce overfeeding. To move aquaculture into a more ecologically sustainable practice, minimizing food waste while maximizing food intake is essential, and this can be further explored through feeding frequency trials.
Previous studies of cultured tautog have documented low growth rates and pointed to possible nutritional concerns (Perry et al., 1998; Perry et al., 2008). However, previous studies did not consider how tautog rely on their eyesight to “scan and pick” for their dispersed prey (Auster, 1989; Rice, 2008) or that tautog lack a true stomach (Clark et al., 2006). By increasing meal frequency, tautog may be stimulated to engage in more active feeding behavior and consume more food. This has yet to be investigated in tautog aquaculture.
Tautog feeding behavior was incorporated into culture methods by focusing on how and when feed is distributed to individuals. Fish were fed at three different frequencies over the course of 24 hours (table 6). We hypothesized that tautog would consume higher quantities if food was offered more frequently. Juvenile tautog were randomly assigned distinct feeding frequency intervals and placed into isolated tanks to view feeding behavior without competition. Feeding frequencies were randomly changed each day of the experiment to eliminate the possibility of learned behavior and to increase treatment sample size. After 24 hours, uneaten food was collected, dried, quantified and compared across treatment groups. Understanding feeding patterns will directly impact commercial tautog aquaculture operations by reducing feed waste.
Cooperators
- (Researcher)
Research
Hypothesis 1 (H1):
When fed at more frequent intervals, juvenile tautog will eat significantly more food pellets than juvenile tautog fed the same amount, at less frequent intervals
Null Hypothesis (H0):
There will be no significant difference in feed consumption between the experimental and control feeding frequencies
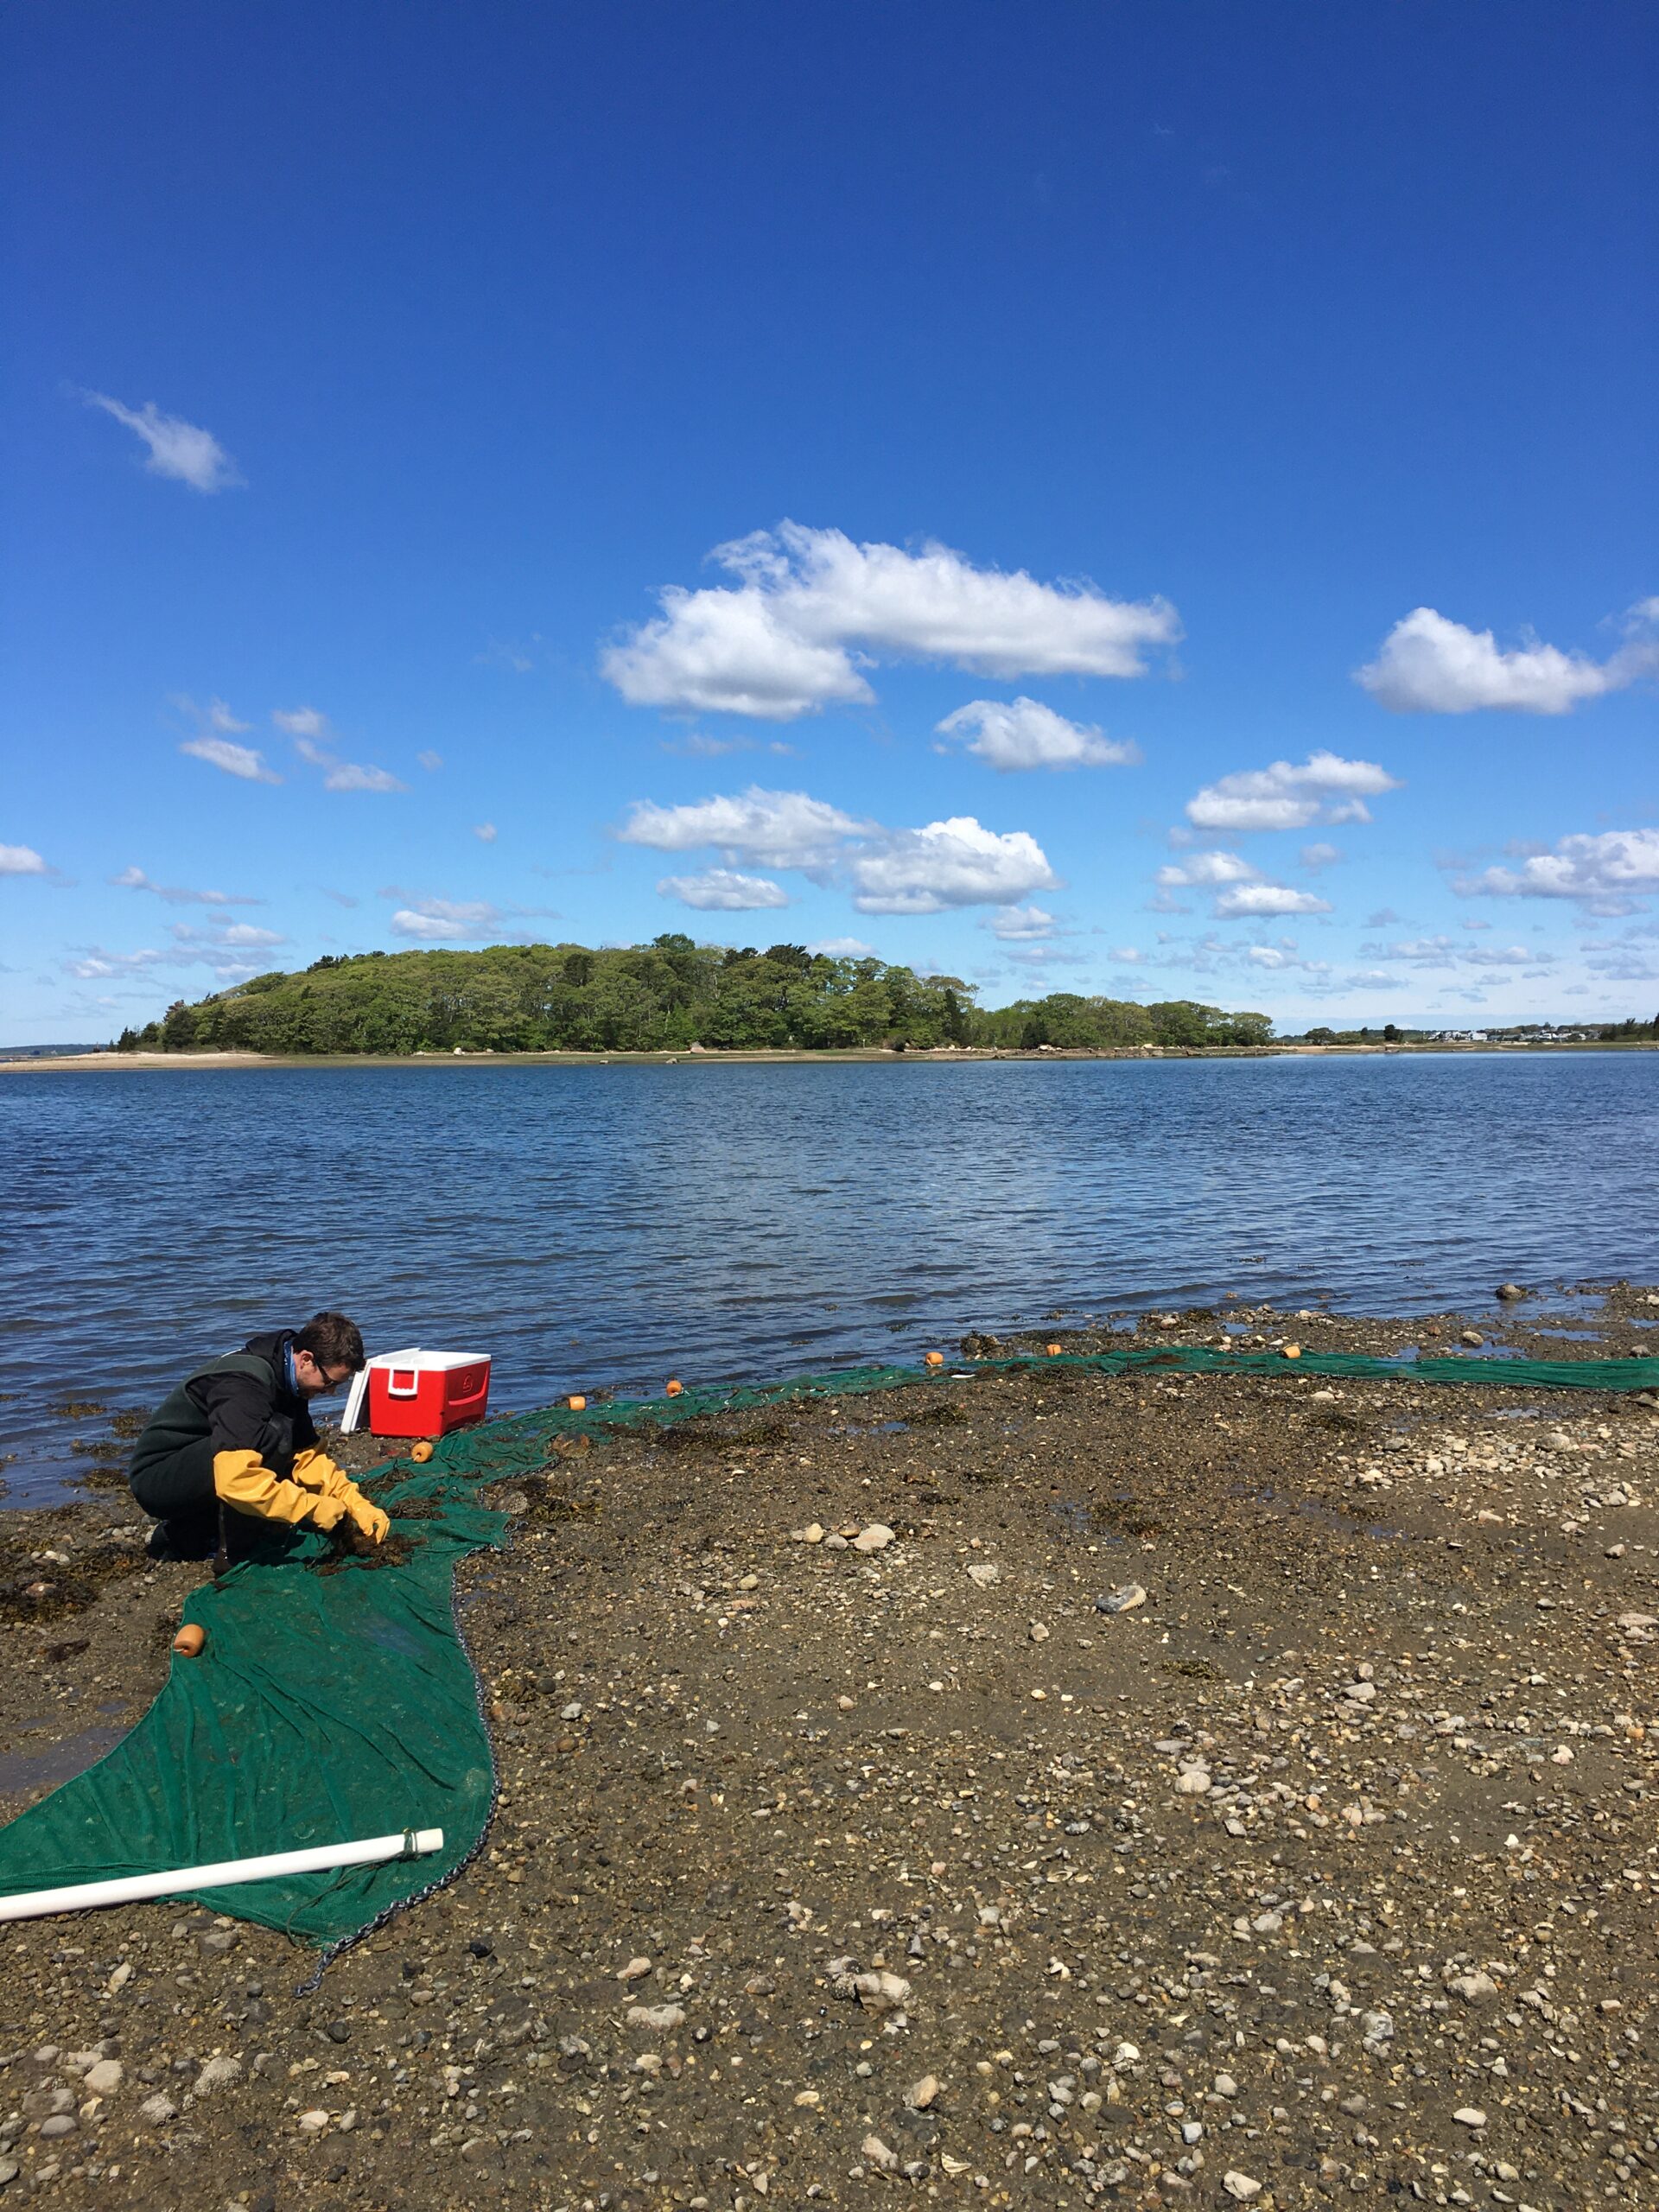
In June 2020, 450 Year-1 Tautog were collected locally from Buzzard's Bay via beach seine.
Year-1 tautog (ranging from 17-114 g in weight) were held in a recirculating aquaculture system at the UMass Dartmouth seawater laboratory in New Bedford, MA. All fish were contained within a 1135 L tank supplied with seawater from Buzzard’s Bay, MA. Seawater was controlled to a constant temperature (20ºC) salinity (33 psu) and a consistent light schedule. All 193 fish will be measured and weighed for total length and total weight to assess the ideal range of length (mm) and weight (g) to be used for the experiment.
Materials & Methods
Collection and Acclimation Period
In June 2020, 450 Year-1 juvenile tautog were collected from Buzzard’s Bay, MA via beach seine (12 x1.2m). Fish were held in a recirculating aquaculture system at the UMass Dartmouth seawater laboratory in New Bedford, MA. After an acclimation period of two weeks in a singular 1135 L tank, fish were equally divided into nine 1135 L tanks. Seawater was supplied from Buzzard’s Bay and maintained at a constant temperature (20ºC) salinity (33 psu) and accompanied by a consistent light schedule (12 L:12 D). Each day, tanks were siphoned prior to two feedings by hand (0800 & 1600). In January 2021, 30 fish were selected based on similar weight(g) and length (mm) and placed into individual 9-L tanks for the duration of the experiment. The average weight was 42.1 g (SD± 4.55 g) and average length was 128.7 mm (SD ±4.68 mm). Fish were fed 2.5% of average total body weight each day of a two-day acclimation period.
Experimental Design
Individual tanks were supplied with recirculating system water with controlled temperature (20ºC), salinity (33 psu), and consistent light schedule (0600-1800 L: 1800-0600 D). After recording initial total length (mm) and weight (g), each fish was given a specific numeric identifier corresponding with a tank. The experiment consisted of “treatment” days and “collection” days to ensure quantification of left-over food. Fish were randomly assigned one of three feeding frequency regimes: experimental groups were fed a total of 2g of feed either four (4x) or eight times (8x) per day, and a control group fed twice (2x) each treatment day. ‘2x’ was chosen as our control group as a baseline from previous research in tautog aquaculture (Perry et al., 1998). In between each treatment day was a collection day to siphon uneaten food. On collection days, all individual fish were fed a total of 1.00g of food over two feedings (0900 & 1700). Feeding frequency assignments were randomly changed each treatment day. Individual fish received the same amount of food each day. Throughout the experiment, water quality parameters were maintained daily and recorded on each “collection day” to minimize disturbances in feeding behavior.
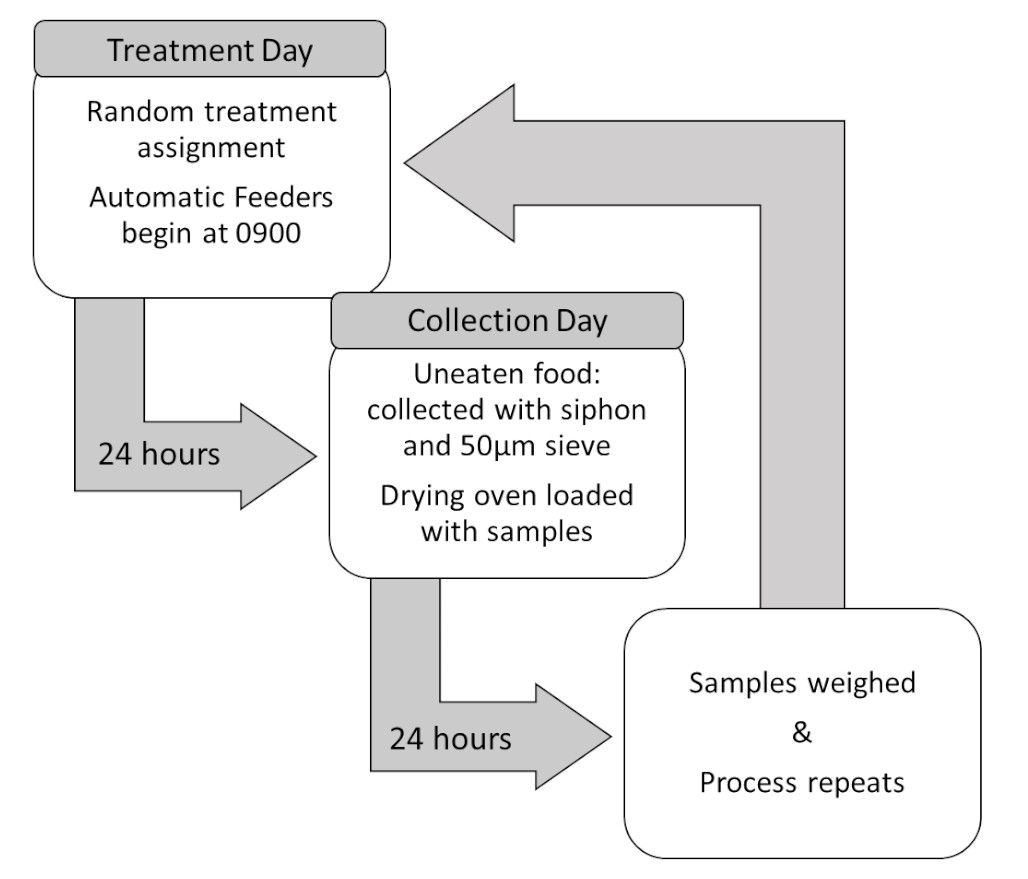
Figure 1: Flow-chart describing data collection and the alternating experimental design of “Treatment” and “Collection” days. This process was completed for 12 consecutive days.
Feed & Feed Delivery
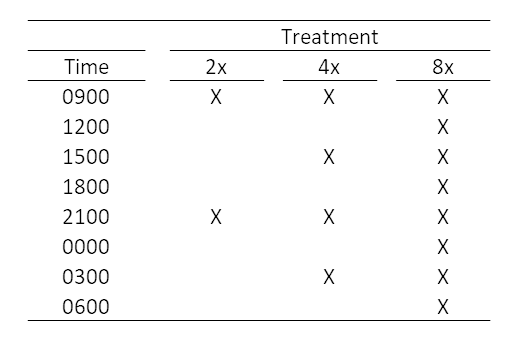
Food was commercial grade 3 mm pellets purchased from Zeigler (Zeigler Pros., PA) (Table 1). Fish were administered feed on an alternating schedule. On treatment days, food delivery was performed by automatic feeders (Fish Mate F14). Feeding began for all tanks at 0900 each day. Experimental group 1 (4x) was fed four times, experimental group 2 (8x) was fed at eight times, and the control group (2x) was fed two times during a 24-hour period (Table 2). Automatic feeders dispensed a total of 2.00 g of food divided by the number of meals allocated for the treatment group each day. Feeders slowly dispensed food over the course of 2 hours with an equal number of meals in light and dark conditions for all treatments.
Table 1: Nutrition content for the “Hi-Performance Marine Finfish” (3 mm) commercial diet used in this experiment. Food purchased from Zeigler Bros. Inc., Gardners, PA. Proximate analysis generated by Eurofins Scientific Microbiology Laboratories New England, Kingston, RI
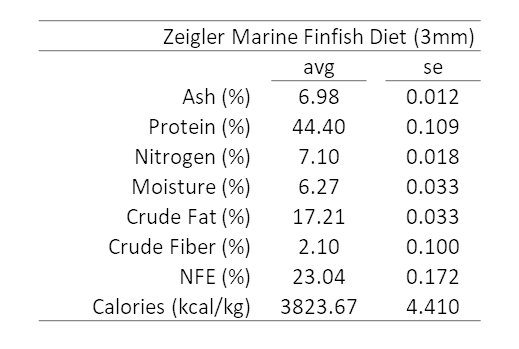
Table 2: Feeding schedule for the experimental and control feeding frequencies used during “Treatment Days”. Automatic feeders began at the same time each day and ran for 24-hours.
Pellet Leaching
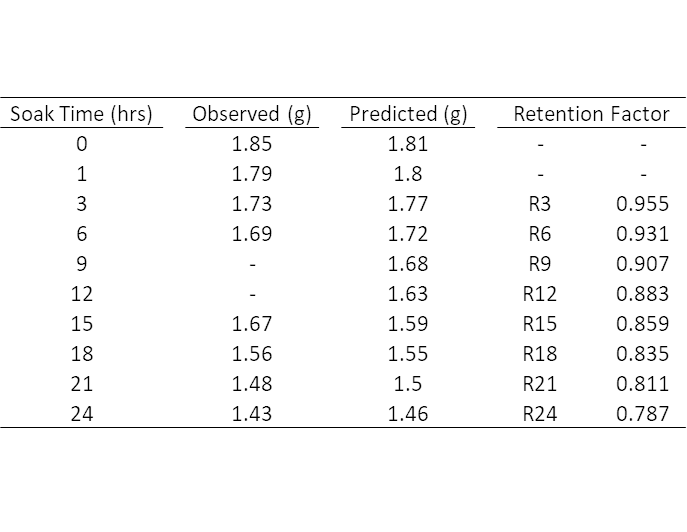
To address differences in pellet weight over time, a series of leaching experiments were conducted. Equal amounts of pellets were administered into 9L tanks without fish. Pellets were siphoned at different soak times (hours) and allowed to dry for 24 hours at 60 º C. We used a model to describe the relationship of pellet weight over time. The model was supported by a sample size of three (n=3) for each observed time. The differences in weight due to soak time were used to calculate the retention rate Rx at a specific time(x).
Data Collection
Uneaten food was generally intact, distinguishable from feces and collected with a siphon and sieve created from 50-micron mesh and 3” PVC. The siphoning began at a different tank each morning. Food was removed from the sieve using a laboratory grade squirt bottle (Axe Sickle, 500mL) and rinsed with freshwater into a 250 mL glass beaker. Water and feed volume were targeted to be ≤ 25mL. This amount was determined by preliminary drying data, where it was confirmed that after 24 hours, no further weight loss (g) was found. Drying protocol was informed from the methodology of Britz et al., 1997. Glass beakers with uneaten food and water were placed inside a drying oven (60ºC) for 24 hours and weighed the following day.
Data Analysis
Structured randomization ensured each fish received one of three treatments at least once. Tanks were randomly assigned a new feeding regime in advance. Consumption was estimated and corrected for pellet leaching for each treatment with formulae [1], [2], & [3] and corresponded to treatments ‘2x’, ‘4x’, & ‘8x’, respectively. Where Wr is the dry weight of the recovered food and Wd is the dry weight of the feed administered. Rx is the ‘retention factor’ at the specified time interval, denoted by subscript ‘x’ and was generated from the data expressed in table 3.
Rx = (Predicted Weight x / W d)
Once all values were known, it was possible to solve for consumption (C). These formulae assume consumption is the same at each feeding per day, that feeding occurred at the beginning of each meal, and that pellets from previous meals are not consumed after subsequent feed delivery. These formulae assumes consumption is the same at each feeding per day, and that food from previous meals is not consumed after subsequent feed delivery.
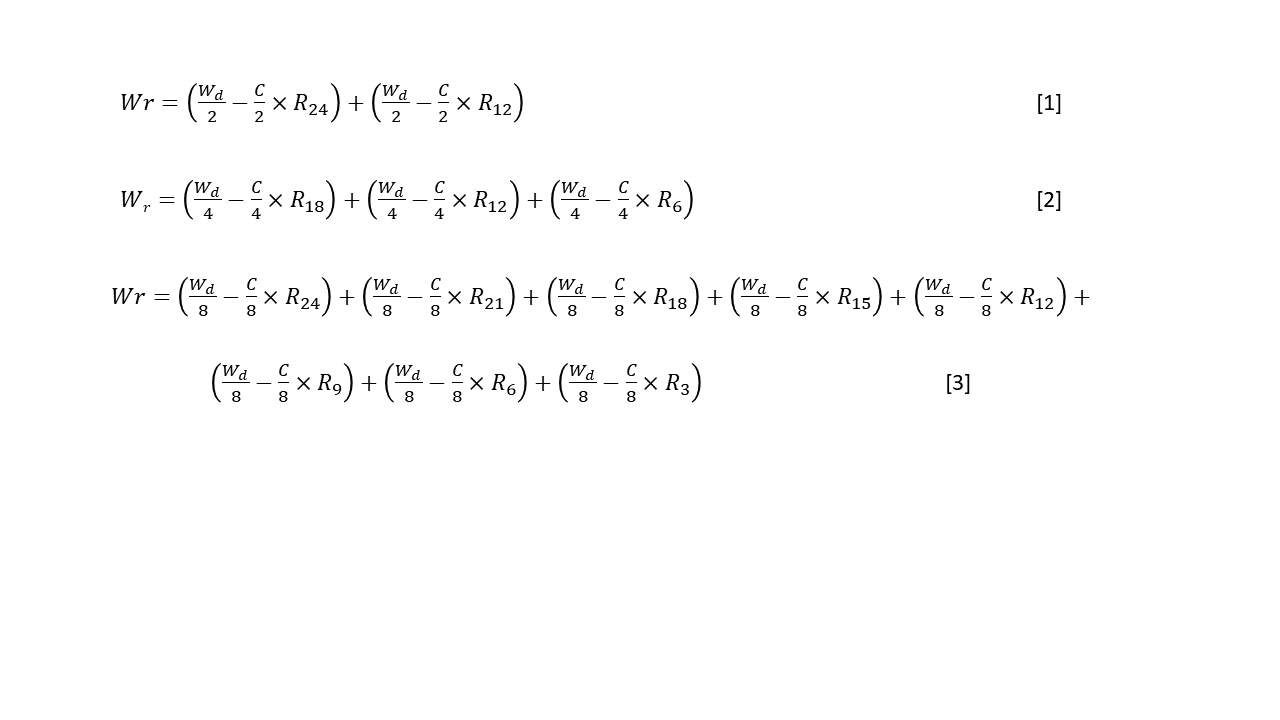
Table 3: Observed and predicted values from the leaching experiment. Values in the observed column are the average of samples (n=3) for each time step. Predicted values were used in the formulae to calculate the retention factor (Rx) and then estimate consumption for each treatment.
This experiment lasted a total of 12 days, with a target of n=60 for each treatment. Analysis of variance (ANOVA) was used to assess significant differences (p<0.05) between the amount of feed consumed in the experimental and control treatments. Tukey’s Honest Significant Difference (HSD) was used for pairwise treatment comparisons (p<0.05).
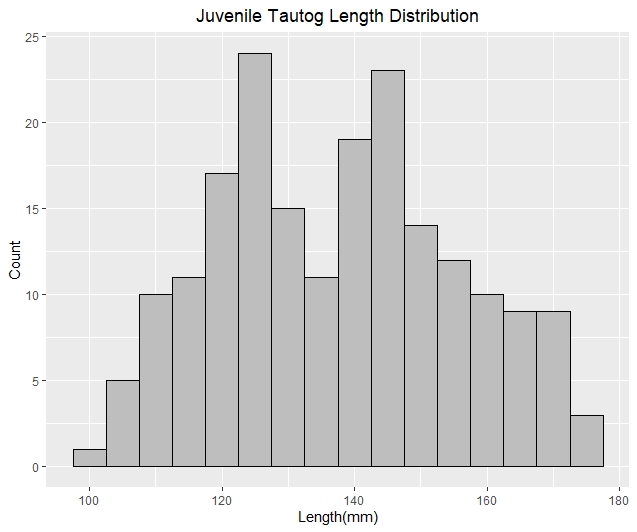
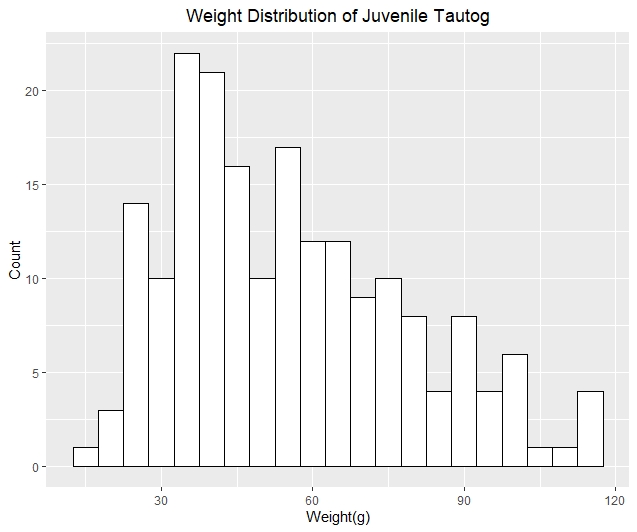
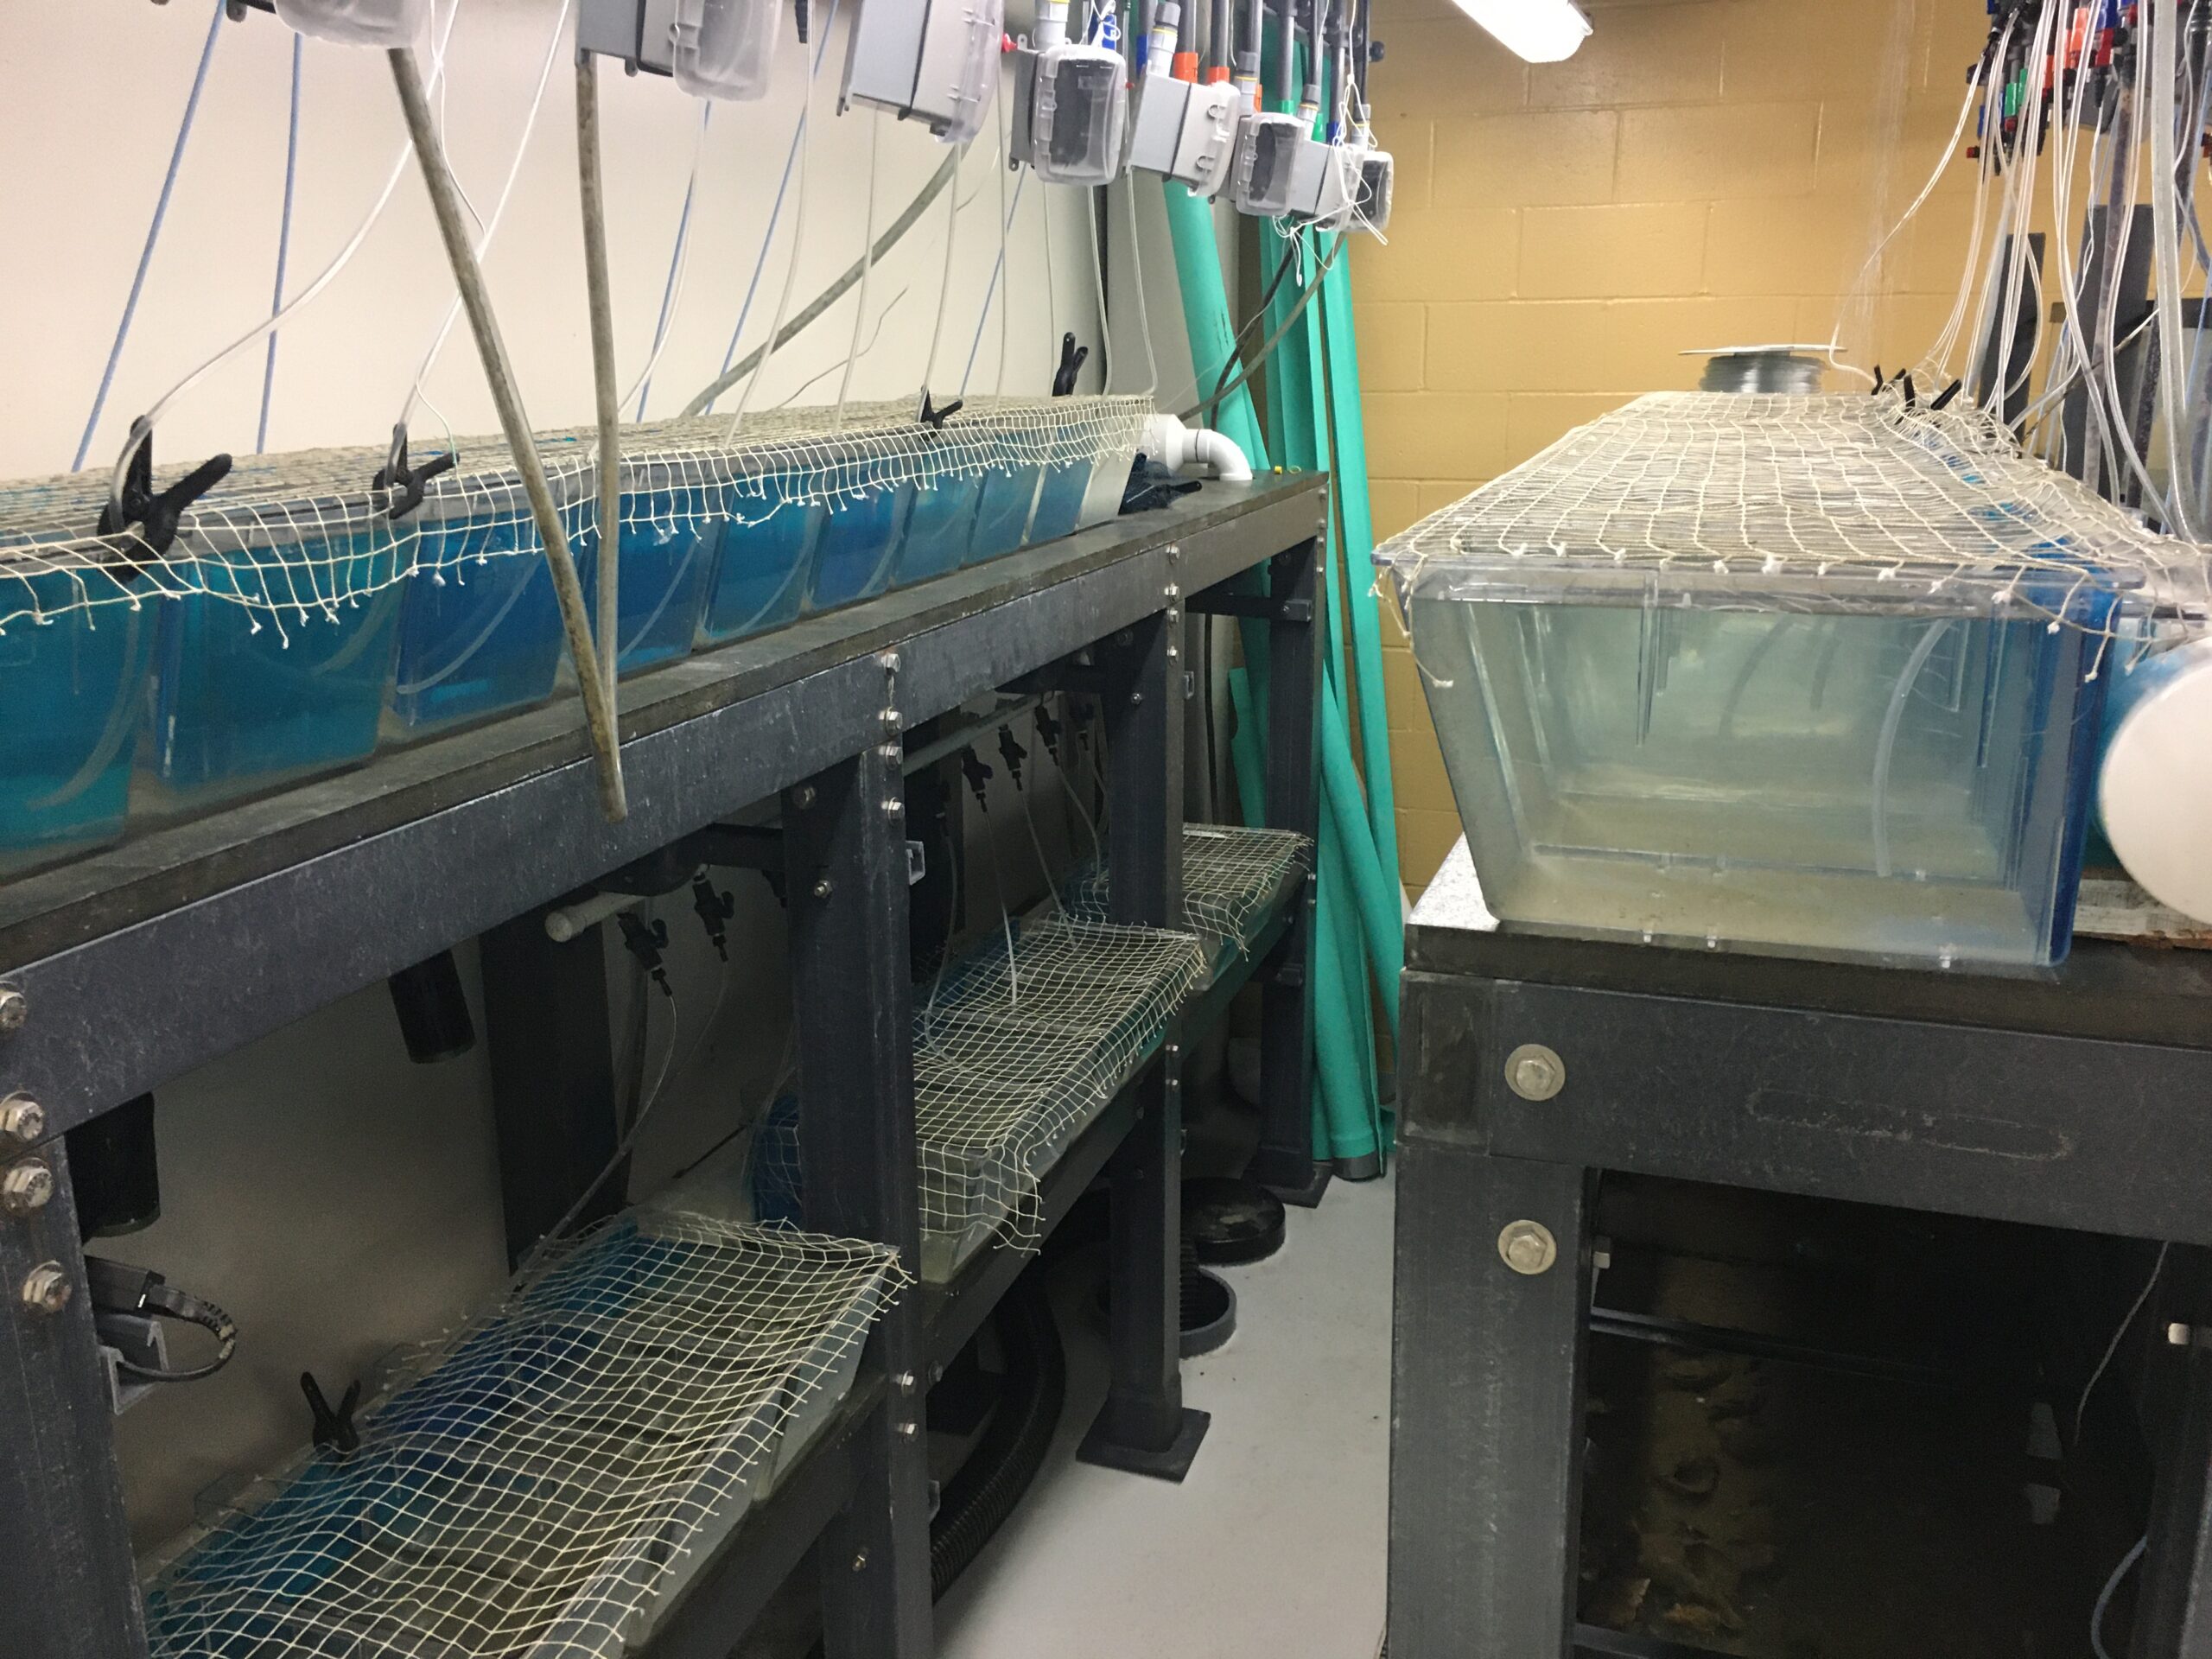
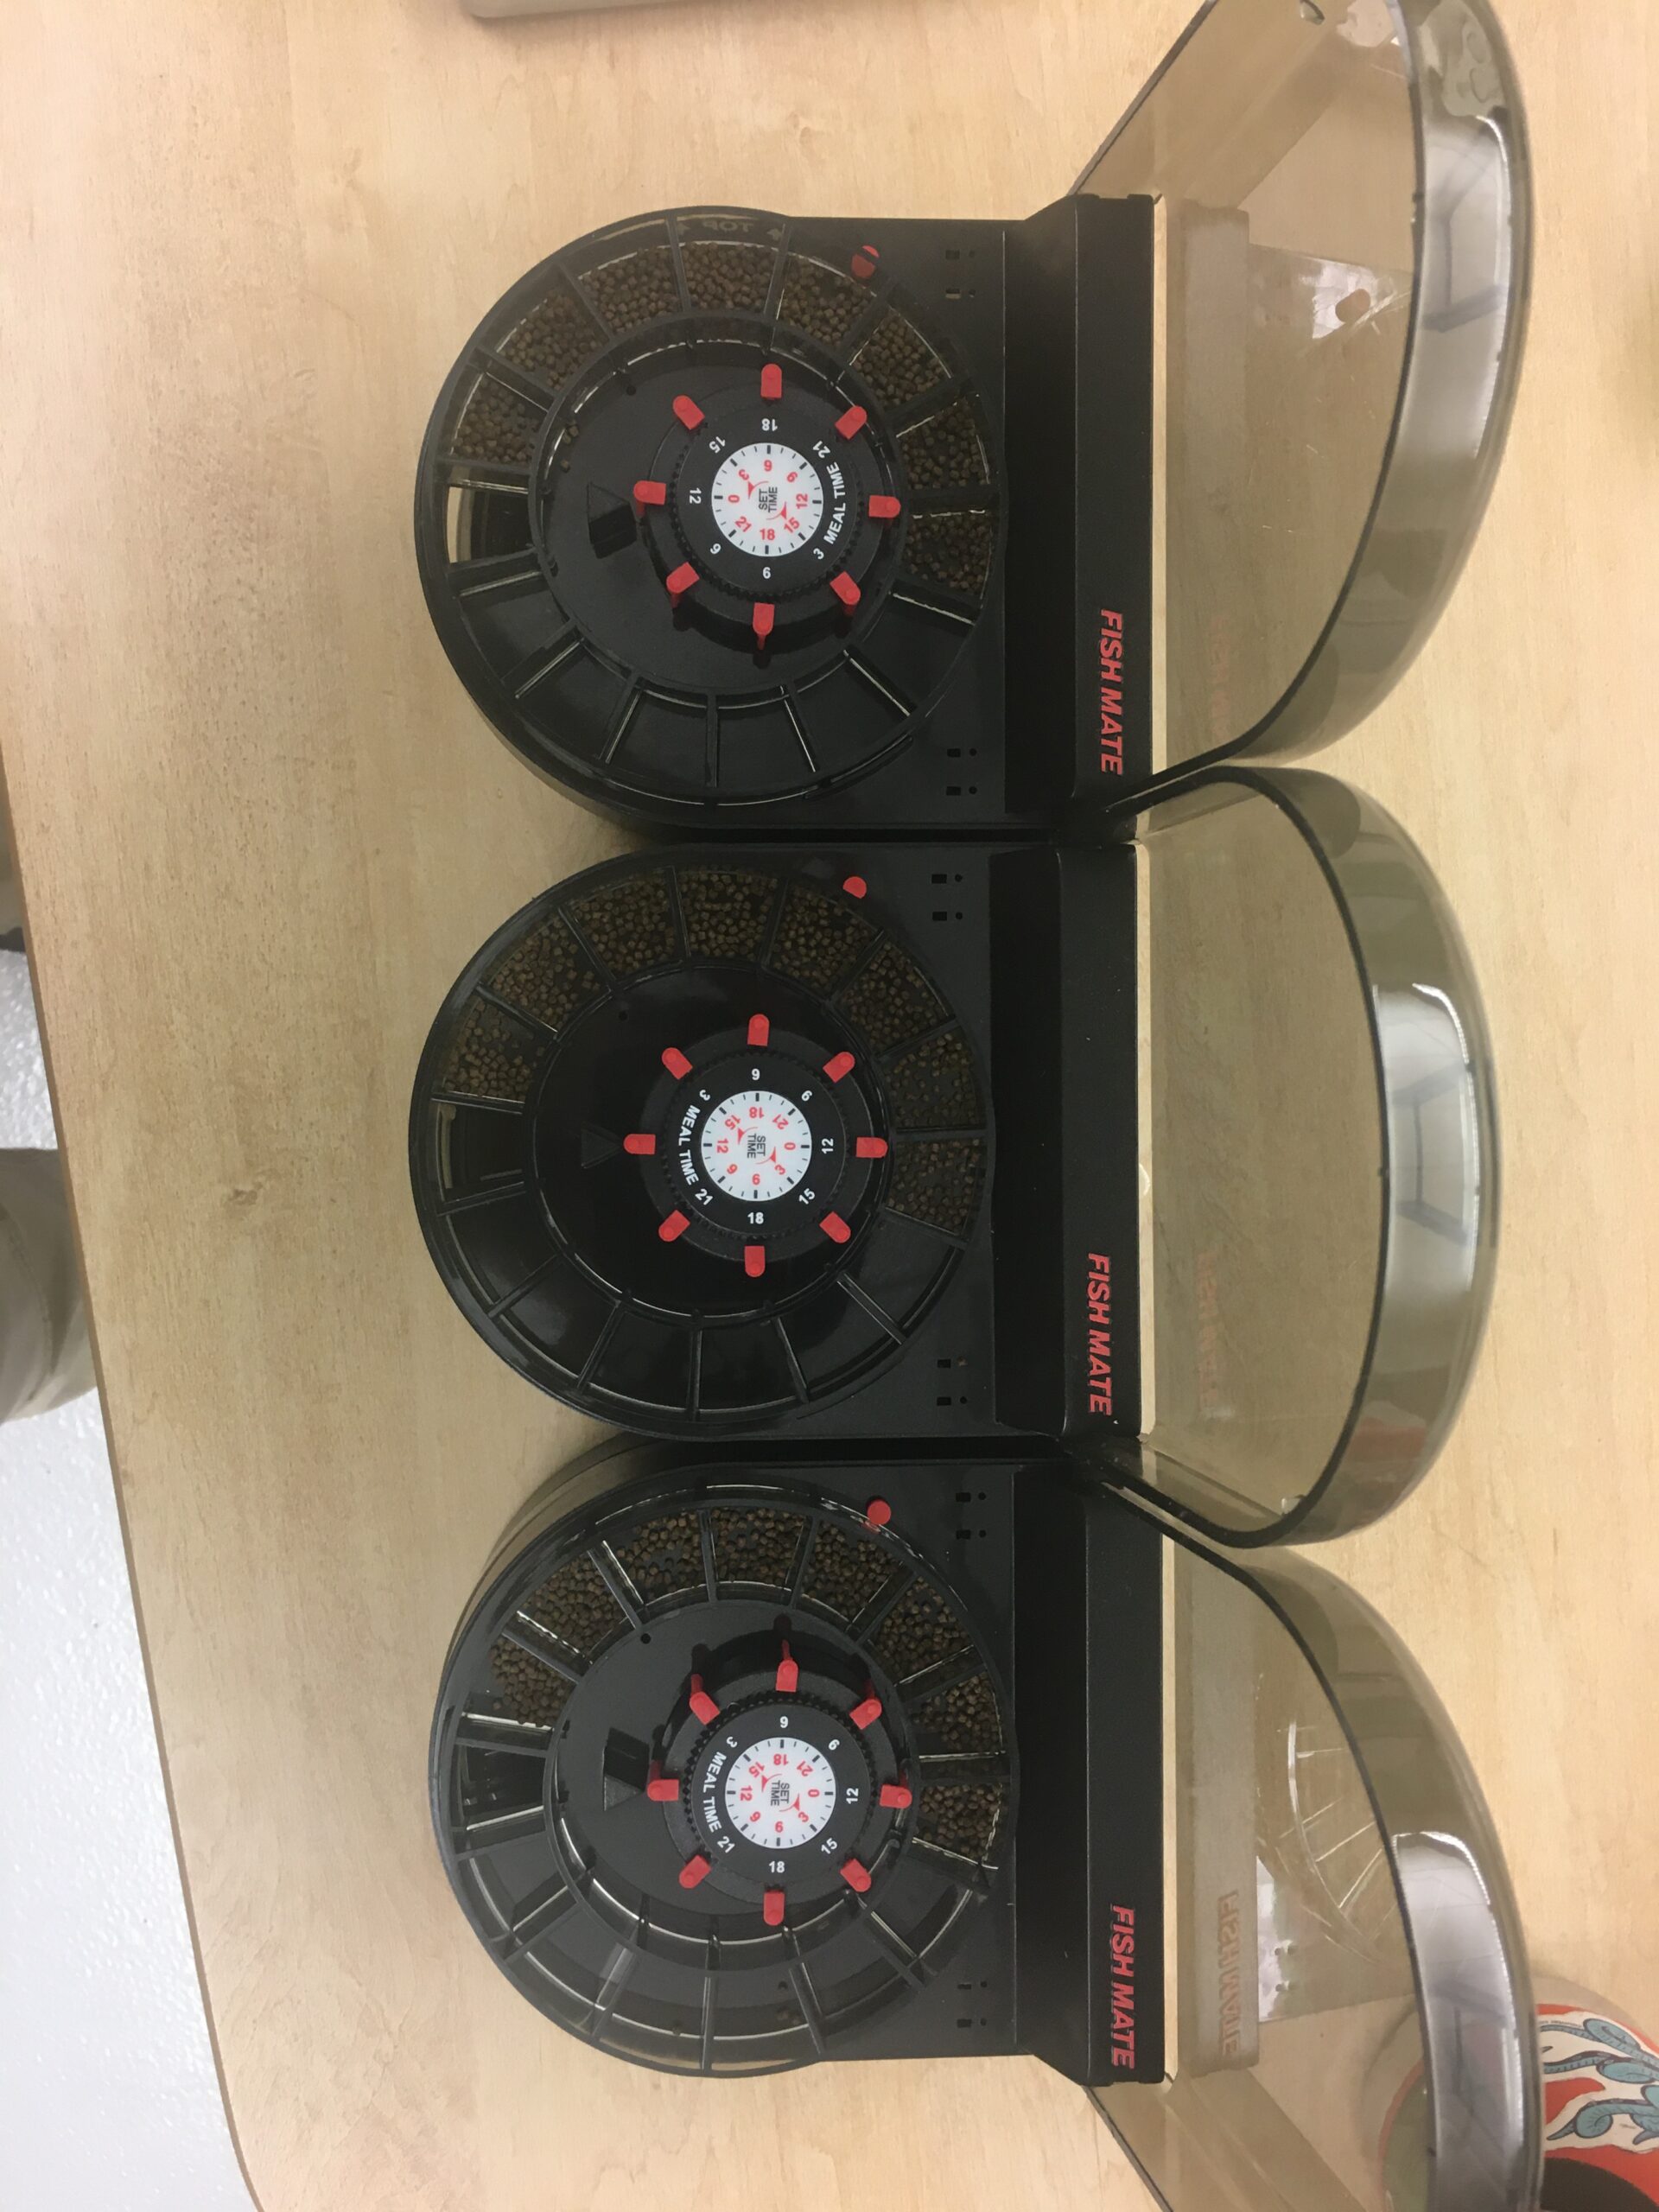
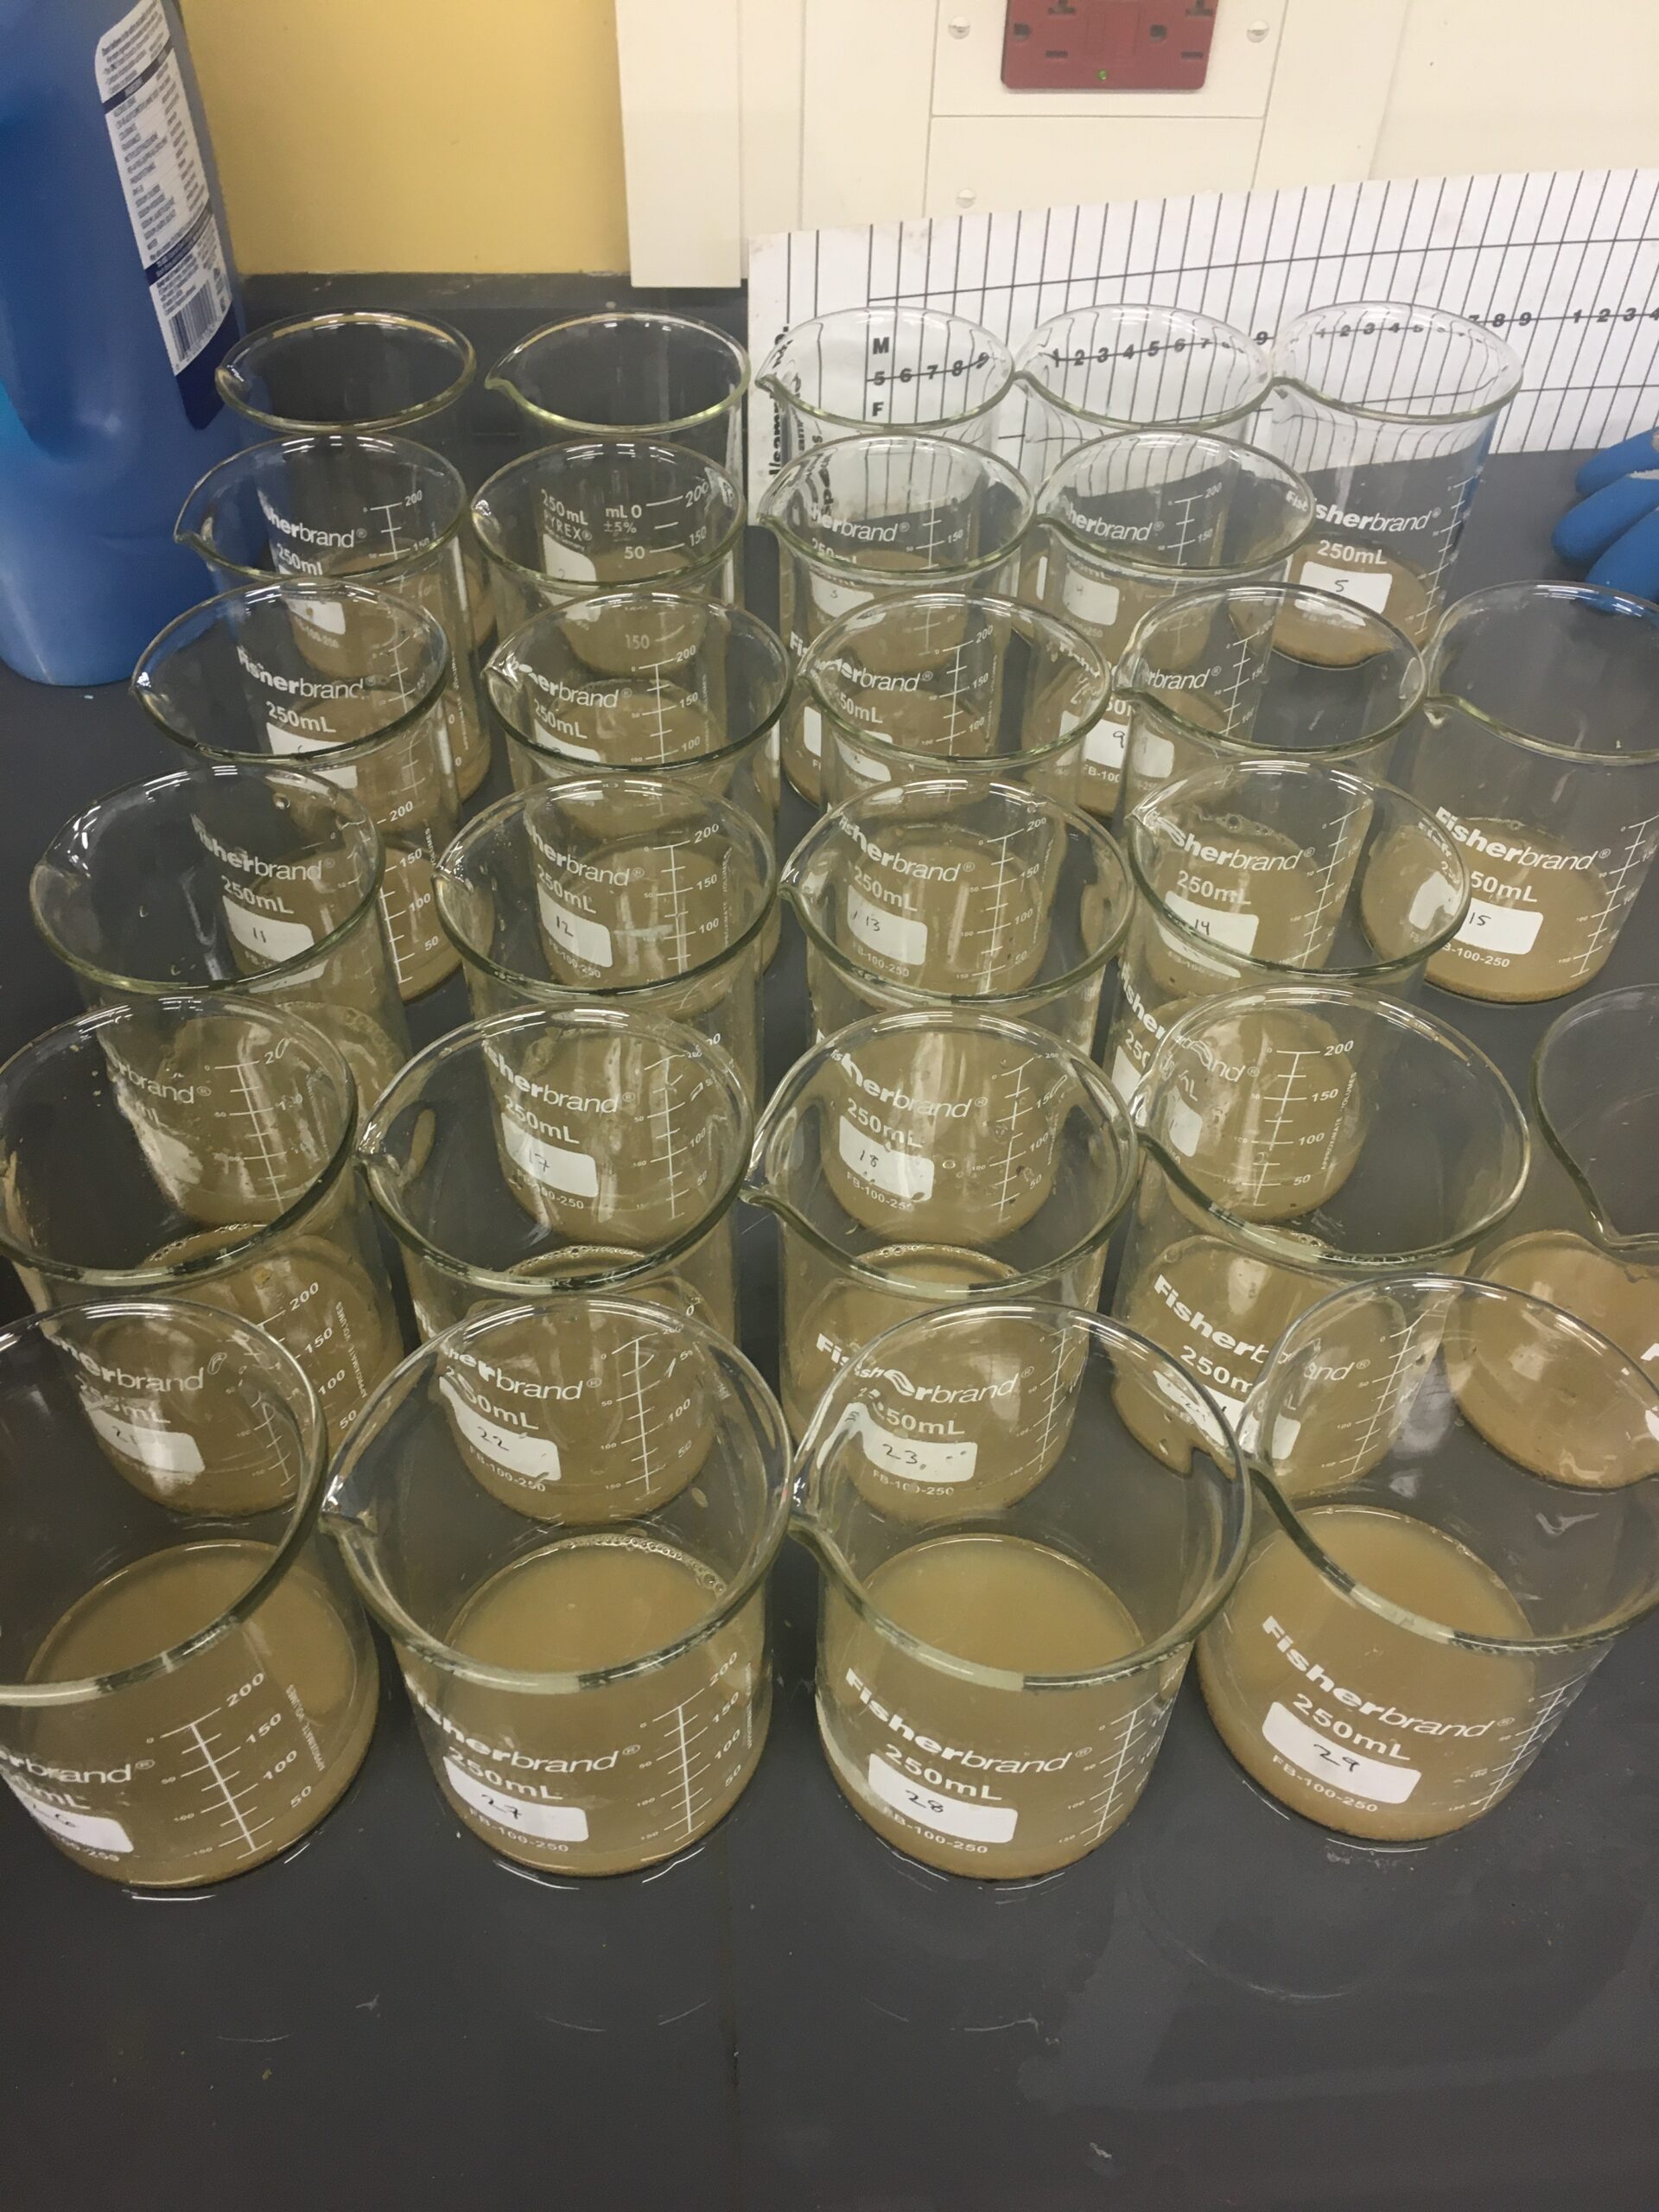
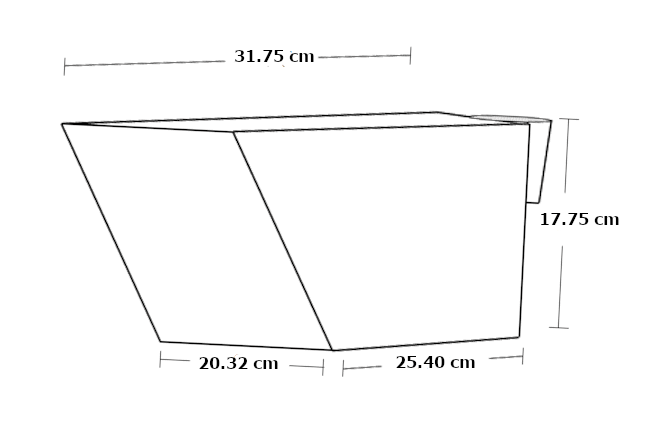
Figure 7: Tank dimensions for 9L used in this study
Pellet Leaching
As soak time increased, the pellets lost weight at a linear rate. Observed values were used to fit a linear equation (y = -0.0148x + 1.8114, R2=0.8608) and generate predicted values for all the time intervals represented in the experiment (Figure 8). Observed leaching rates were used to calculate predicted values for all the feeding frequency time intervals.
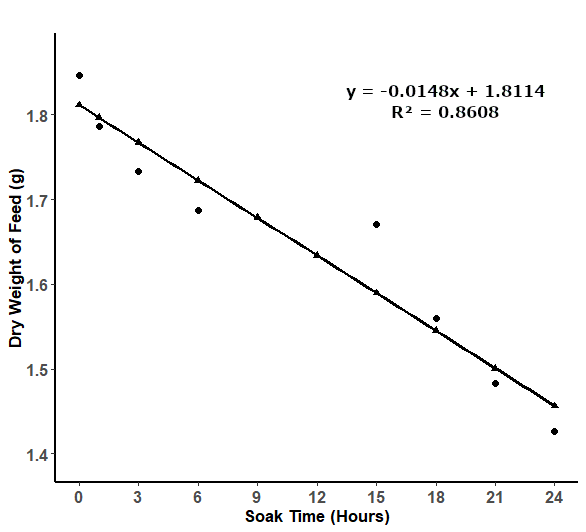
Figure 8: Linear relationship expressed between the average dry weight of commercial pellets (n=3) used in this experiment after time spent soaking in recirculating aquaculture system. The average observed values were used to generate a series of predicted values which were used in equations [1], [2], & [3] to account for leaching in each of the treatment groups.
Consumption
Water quality was routinely monitored for temperature (x̅ =20.40 ºC ±SE= 0.011) and dissolved oxygen (x̅ =96.43 % ± SE= 0.178).
The relationship between adjusted consumption and feeding frequency was determined significant by a one-way analysis of variance (ANOVA: F statistic= 5.53, p<0.005). Average consumption was significantly higher for the ‘2x’ and ‘4x’ feeding frequencies when compared to the ‘8x’ treatment group (Tukey HSD, p<0.05) (Table 8). There was no difference between the ‘2x’ and ‘4x’ feeding treatments (Table 4, Figure 9). Additionally, consumption was tracked for individual fish and presented in figure 10. At the individual scale, results were significant for one fish, #5 (ANOVA: F statistic= 11.56, p<0.04) who consumed less food under the ‘2x’ treatment compared to the ‘8x’ and ‘4x’ treatments (Tukey HSD, p<0.05). While other fish displayed minor differences, none of the observed trends were determined significant by one-way ANOVA tests.
Table 4: Tukey honest significant differences post-hoc test determined significance between the ‘8x’ feeding frequency and the ‘4x’ and ‘2x’ frequencies, but not between the ‘2x’ & ‘4x’ treatments. Significance was determined for p-values < 0.05.
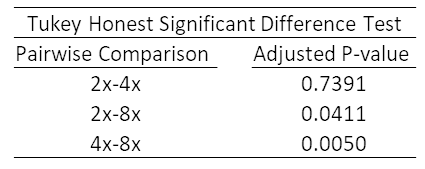
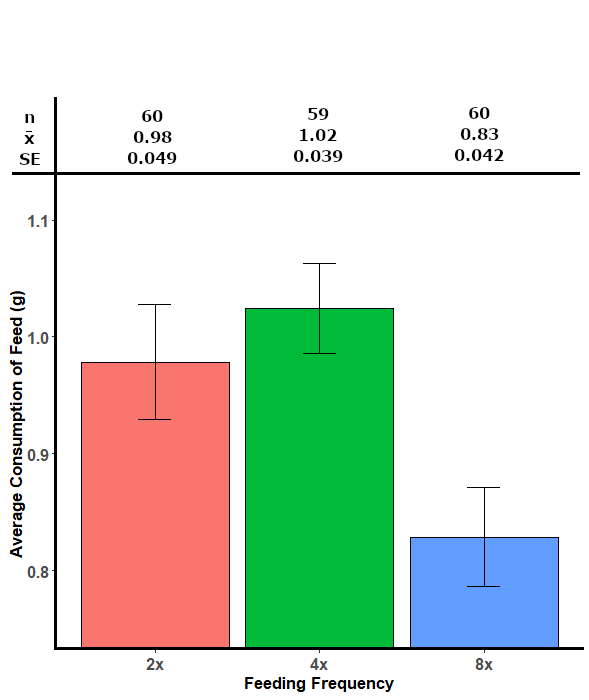
Figure 9: Bar plot and table showing the average consumption (g) compared across 3 different feeding frequencies with sample size, mean, and standard error explicitly stated for each treatment.
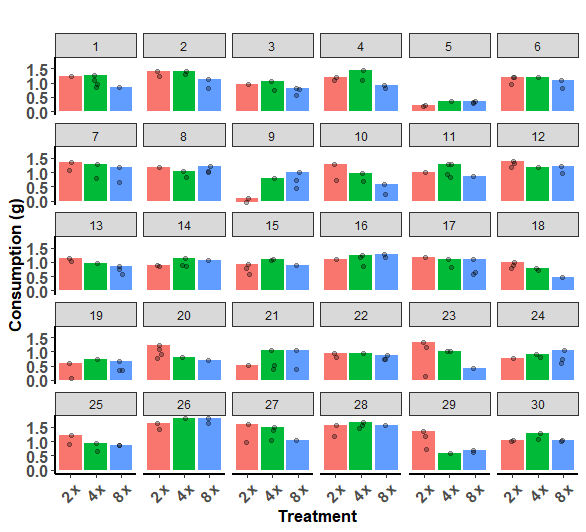
Figure 10: Consumption trends for individual fish (n=30) illustrated by the different feeding frequency treatments used in the experiment. Randomized treatment assignment meant that some fish received treatments more than once, and in some cases, more than others. Each set of bar graphs corresponds to the fish ID (#) directly above. Each bar represents the highest amount of consumption for that treatment, while points within the bar plot represent consumption values for different treatment days.
Results revealed a ceiling for the frequency of meals in relation to average consumption. It was observed that significantly less consumption occurred in the ‘8x’ treatment compared to the other two feeding regimes, although there was no difference between the control (2x) and ‘4x’ experimental group. Less frequent meals resulted in higher average consumption. When looking at individual results (Figure 10), fish were not representative of this pattern, and this could be due to a small sample size (n=6) for the individuals. Further testing at the individual scale and using larger sample sizes for individual fish may reveal significant patterns, however discrete personalities of wild fish appear consistent with consumption across treatments. The only fish (#5) that expressed a significant result saw the lowest consumption during the ‘2x’ treatment. This fish also embodied the lowest overall consumption out of any individual. One fish, (#9) represented the opposite trend regarding the average consumption data. Feeding frequency was the test variable; yet confounding variables may have contributed to the results presented in this study. Wild tautog foraging behavior, differences among individuals, lighting, and stocking density should be acknowledged within the context of tautog aquaculture.
Most fish do not forage for food 24 hours per day (López- Olmeda et al., 2012) and tautog are selective foragers (Auster, 1989; Rice, 2008), generally found to be inactive at night (Olla et al., 1974). The F14 automatic fish feeder (Figure 5) used in this study spin a circular hopper slowly during a 24-hour period. The circular hopper contains individual compartments representative of each meal. Each compartment is completely dispensed after approximately 2 hours, and the next feeding begins shortly after. This means that the ‘8x’ treatment was continuously administering pellets throughout the entire day. While there have been recorded benefits to increased feeding frequency in hybrid sunfish (Wang et al., 1998) and yellow-tail flounder (Dwyer et al., 2002) this appears to have negatively impacted average food consumption in juvenile tautog. Fish require periods of hunger to stimulate feeding rate and daily feeding times (Rubio et al., 2010).
Trends of consumption were consistent for tautog across different treatment groups. There was no difference in consumption for 96.7% of individuals, regardless of treatment. These were wild caught fish, which do not have the adaptive and productivity traits attributed to generationally farmed populations (Lind et al., 2012). Large farming operations breed fish to select for genetics that make them suitable for farming. Successful programs have resulted in hearty strains for some of the world’s most popular aquaculture products (Mehar et al., 2020). The variability in consumption may be linked to individual fish behavior before any genetic selection for commercially desirable traits. Tautog possess one of the lowest nucleotide diversity ratios for a marine teleost (Orbacz & Gaffney, 2000); however, authors indicated further exploration into more variable nuclear DNA sequences such as microsatellite loci, major histocompatibility complex genes, and introns may highlight genetic differences within tautog. A deeper understanding of genetic diversity could lead to identifying genetic markers when selecting brood stock for commercial tautog farming.
Light was maintained on a split -even schedule so that all three treatments received the same amount of food during both light and dark conditions. Wild tautog feed during the day and are inactive at night (Cooper 1967; Olla et al., 1974), but in tank culture, some individuals consumed food during light and dark conditions. Wild fish can change their feeding habits and some species are noted to display changes in their daily foraging behavior, sometimes changing from nocturnal to diurnal or vice versa (Madrid et al., 2001; López- Olmeda et al., 2012). Overall, there were consistent patterns of consumption in individual fish, although looking at differences in consumption between light and dark conditions was outside the scope of this study. Fish feeding at night may have been an artifact to prolonged time spent in captivity. Further research into tautog feeding behavior should include investigating light as an explanatory variable for food consumption.
At the individual scale, feeding frequency impacted consumption but not at a discernable pattern. Fish in this study were held in individual tanks to isolate the feeding frequency test variable. By comparison, commercial farms utilize much higher densities of fish to be economically viable. Results indicate that less frequent mealtimes increase the average consumption of treatment groups. This finding agrees with large-scale salmon farming practices where high culture densities require meals to be large enough for all fish to receive food, and therefore feeding frequencies need to be reduced (Cho & Bureau, 1997). Despite unlimited access to food, consumption was variable across individuals. Some fish ate the same amount of food regardless of treatment, and a cost-effective strategy for feeding should include mealtimes that reduce labor costs. Individual business economics will determine if it is cost effective to pay for manual or automatic feedings either two or four times each day. Further research into stocking density, competition, aggression, and the presence of hierarchies will need to be explored to refine commercial tautog aquaculture. Additionally, feeding frequency experiments at higher densities with competition may result in different consumption patterns. Notwithstanding individual trends, on average feeding regimes that use infrequent intervals will reduce food waste in tautog aquaculture.
Education & outreach activities and participation summary
Participation summary:
Results and products will be communicated to aquaculture industry participants who are interested in expanding current operations or starting a new fish farming operation. Mr. Coute, Dr. Ward, and Mr. Rillahan are active members within the regional aquaculture community. Presentations will be given at regional meetings, including the UMass Intercampus Marine Science Symposium. A factsheet will be produced at the completion of this project and distributed to all regional aquaculture extension offices and regional aquaculture centers. A peer-reviewed publication and master’s thesis are expected at the completion of this project. All data generated throughout the project (environmental, growth, survival, and economic) will be saved at the University of Massachusetts Dartmouth and will be provided as requested by stakeholders or interested parties.
At this time, I have presented to the Intercampus Marine Science Research Symposium (March 2021) and I have presented the findings from this study as part of my Master's Thesis defense. The thesis defense was successful and progress towards publishing peer reviewed publications will continue throughout the fall of 2021.
Project Outcomes
If feeding strategies are utilized, farmers will save money when it comes to feed waste. In addition to positive business economics, reducing feed waste also improves water quality.
Tautog aquaculture is novel business opportunity with no current farms in commercial operation. This project allowed me to continue my career in sustainable aquaculture and be on the cutting edge of research for a growing industry. My career direction is focused on aquaculture and future goals will be continuing research, outreach, and collaboration through academic institutions, funding agencies, and commercial farms.
New funding opportunities built upon this research have led to a collaboration between Ward Aquafarms, Rhode Island Commercial Fishermen's Association, and the NOAA lab in Sandy Hook, New Jersey to continue researching tautog as a novel aquaculture species.
Key to the project's success was the assessment of pellet leaching, which gave a more accurate representation of consumption. Future goals for research and areas of improvement with tautog aquaculture are focused in the conclusion section.