Final report for GNE20-230
Project Information
Corn growers have several options for at-planting pest control, including neonicotinoid seed treatments (NSTs), pyrethroids that can be applied in the planting furrow, and corn hybrids with plant incorporated protectants sourced from Bacillus thuringiensis bacteria (Bt); growers may also use all three together. Because these treatments target similar pests, using multiple products can be redundant. Targeting insect control and using the most effective product could reduce insecticide use, thereby increasing environmental sustainability and decreasing input costs. Insecticide treatments can also disrupt biological control. For example, NSTs can reduce slug predator populations in soybeans, causing economically damaging outbreaks of slugs. Because slugs are a concern in the Mid-Atlantic and difficult to control, it is important to determine if at-planting insecticides similarly impact biological control of slugs in corn. Lower corn prices may increase adoption of less expensive non-Bt corn, which has a unique pest complex for which at-planting applications must also be optimized. To improve pest management decision making in corn, we compared 1) an untreated control, 2) Capture LFR (an in-furrow pyrethroid insecticide), and 3) Poncho 250 (an NST) in a Bt and non-Bt hybrid. Fields were planted at three University of Maryland farms from 2020-2022. We found that insecticide treatments did not improve yield in either the Bt or non-Bt hybrid. Completely untreated corn performed well in almost all cases. While both insecticide treatments reduced total insect damage in non-Bt corn, insect pests were sporadic and tended to cause minor damage. In Bt corn, only Poncho 250 reduced insect pest damage, but pest damage was also generally low. Overall, insect pressure did not reach economic levels. We also found that insecticide treatments did not affect predation on slugs or flare up slug abundance or damage over the course of the study.
This study adds to previous evidence that Mid-Atlantic pest pressure generally does not warrant at-planting preventative insecticides and that combining these insecticides in Bt or non-Bt corn is unlikely to pay off. In many cases, insecticide inputs associated with Bt traits, neonicotinoid seed treatments, and in-furrow pyrethroids could be reduced or eliminated without cost to yield, especially those with redundant targets. Reducing these input costs helps maximize profits. In addition, our information on MD pest pressure will help improve insect pest management outcomes.
My goal is to provide information to help growers to tailor early season pest control tactics to their needs, increasing sustainability and profitability. In order to achieve this, my specific objectives are to:
Objective 1: Determine how NSTs and in-furrow pyrethroids affect pest pressure and damage when used against early-season pest complexes in three Maryland growing regions in separate Bt and non-Bt corn fields.
Objective 2. Determine the impact of NSTs and in-furrow pyrethroids on biological control of slugs by measuring slug activity abundance, slug damage, slug predator activity abundance, and predation rates on slugs in three Maryland growing regions.
Objective 3. Determine the impacts of NSTs and in-furrow pyrethroids on yield and evaluate late season ear and stand damage in three Maryland growing regions using separate Bt and non-Bt corn fields.
The purpose of this project is to increase the sustainability and efficiency of early-season pest control in Mid-Atlantic corn production by comparing at-planting management options in Bt and non-Bt hybrids. Growers can use multiple insect management products, including neonicotinoid insecticide seed treatments (NSTs), in-furrow pyrethroid insecticides, and Bt corn hybrids [1–3]. NSTs and in-furrow pyrethroids control assorted soil and seedling pests [4, 5], with significant overlap in their spectrum of control. In the Mid-Atlantic, these applications primarily target soil pests such as white grubs and wireworms [4, 7]. NSTs, pyrethroids, and Bt traits all target multiple lepidopteran pests, including black cutworm and armyworm [4, 6, 7]. Because these products were developed for corn belt pest complexes and target similar pests, comparing efficacy against Maryland pest complexes will allow growers to choose the most effective treatment and eliminate redundant insecticide applications.
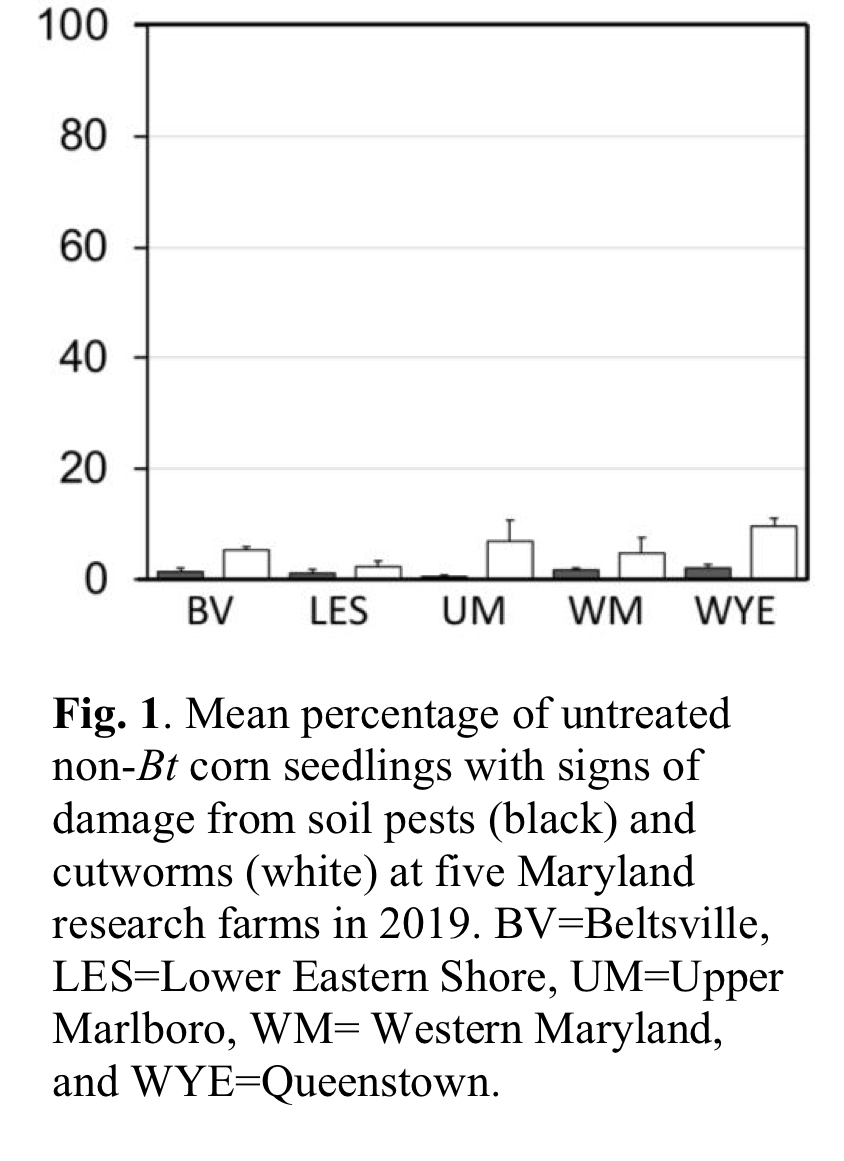
In addition to their inherent redundancy, insecticides do not provide yield benefits if target insect pest pressure is too low [9–13]. Many of the pests targeted by NSTs and in-furrow pyrethroids are sporadic and do not occur in economically important numbers in every field every year [13]. Preliminary data suggest that Maryland corn experiences relatively low pest pressure (Figure 1). Lepidopteran pests especially have declined following wide-spread Bt corn adoption [6]. However, Maryland is a geographically diverse state, so regional pest pressure varies (Figure 1). Additionally, soil pests are difficult to scout and impossible to control with rescue treatments [2], so at-planting treatments can be valuable in fields where soil pest pressure is anticipated. By measuring how treatments affect pests in different locations in Maryland we will determine the conditions and regions where applications are warranted and where they can be avoided, further reducing insecticide use.
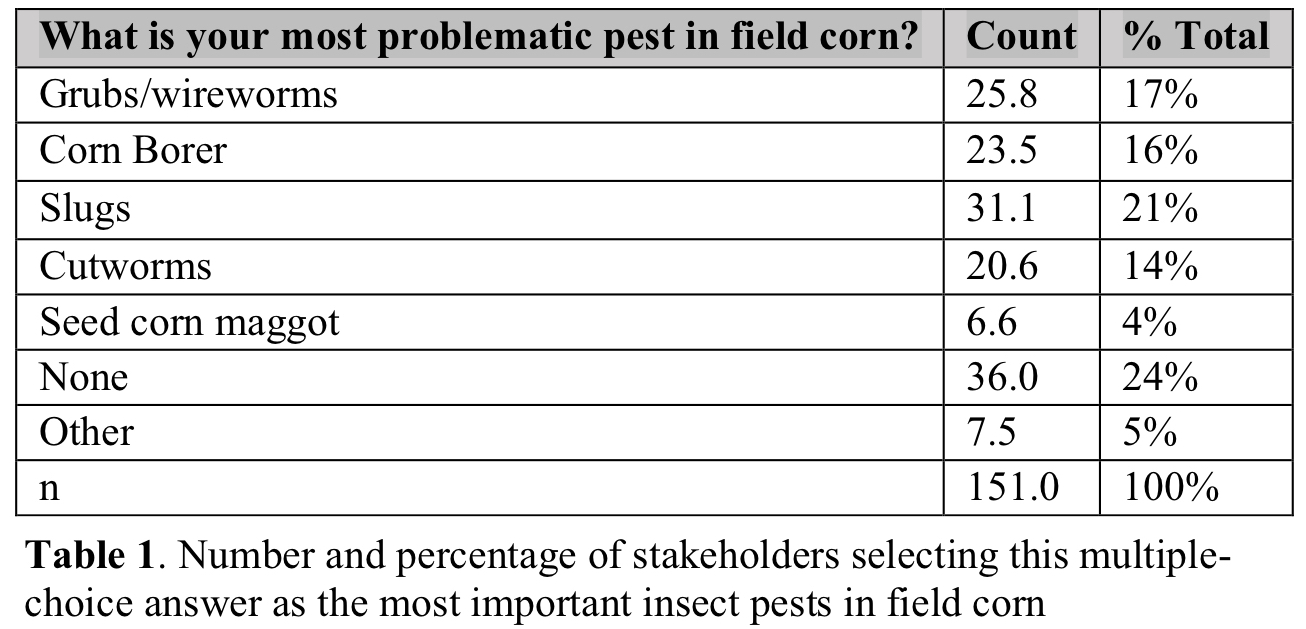
At-planting insecticides may also disrupt biological control and negatively impact non-target organisms. Biodiversity in agricultural systems provides pest suppression [14]. Non-target impacts to biocontrol organisms can cause secondary pest outbreaks, complicating pest management and potentially reducing yields [24, 15]. Impacts to non-target organisms have been associated with NSTs [9, 16–19] and foliar pyrethroid applications [20–23], although there are few studies on pyrethroids applied in the planting furrow. In soybeans, NSTs disrupt biological control of slugs [28], a key pest in Maryland corn (Table 1). Measuring the impact of at-planting insecticides on slugs and slug predators will help clarify how the treatments impact biological control of slugs in corn. This information will allow growers to conserve slug predators and better control these difficult to control pests.
Better understanding of how NSTs and in-furrow pyrethroids contribute to pest management will significantly improve on-farm decisions. Because falling grain prices may also incentivize planting less expensive corn lacking Bt traits, which experience a different pest complex [24], we will evaluate at-planting insect pest control in both Bt and non-Bt hybrids. Our results will allow growers to optimize profitability and environmental sustainability by selecting the treatments most suited to their pest pressure and production system, reducing unneeded insecticide applications, and enhancing biodiversity and biocontrol.
Research
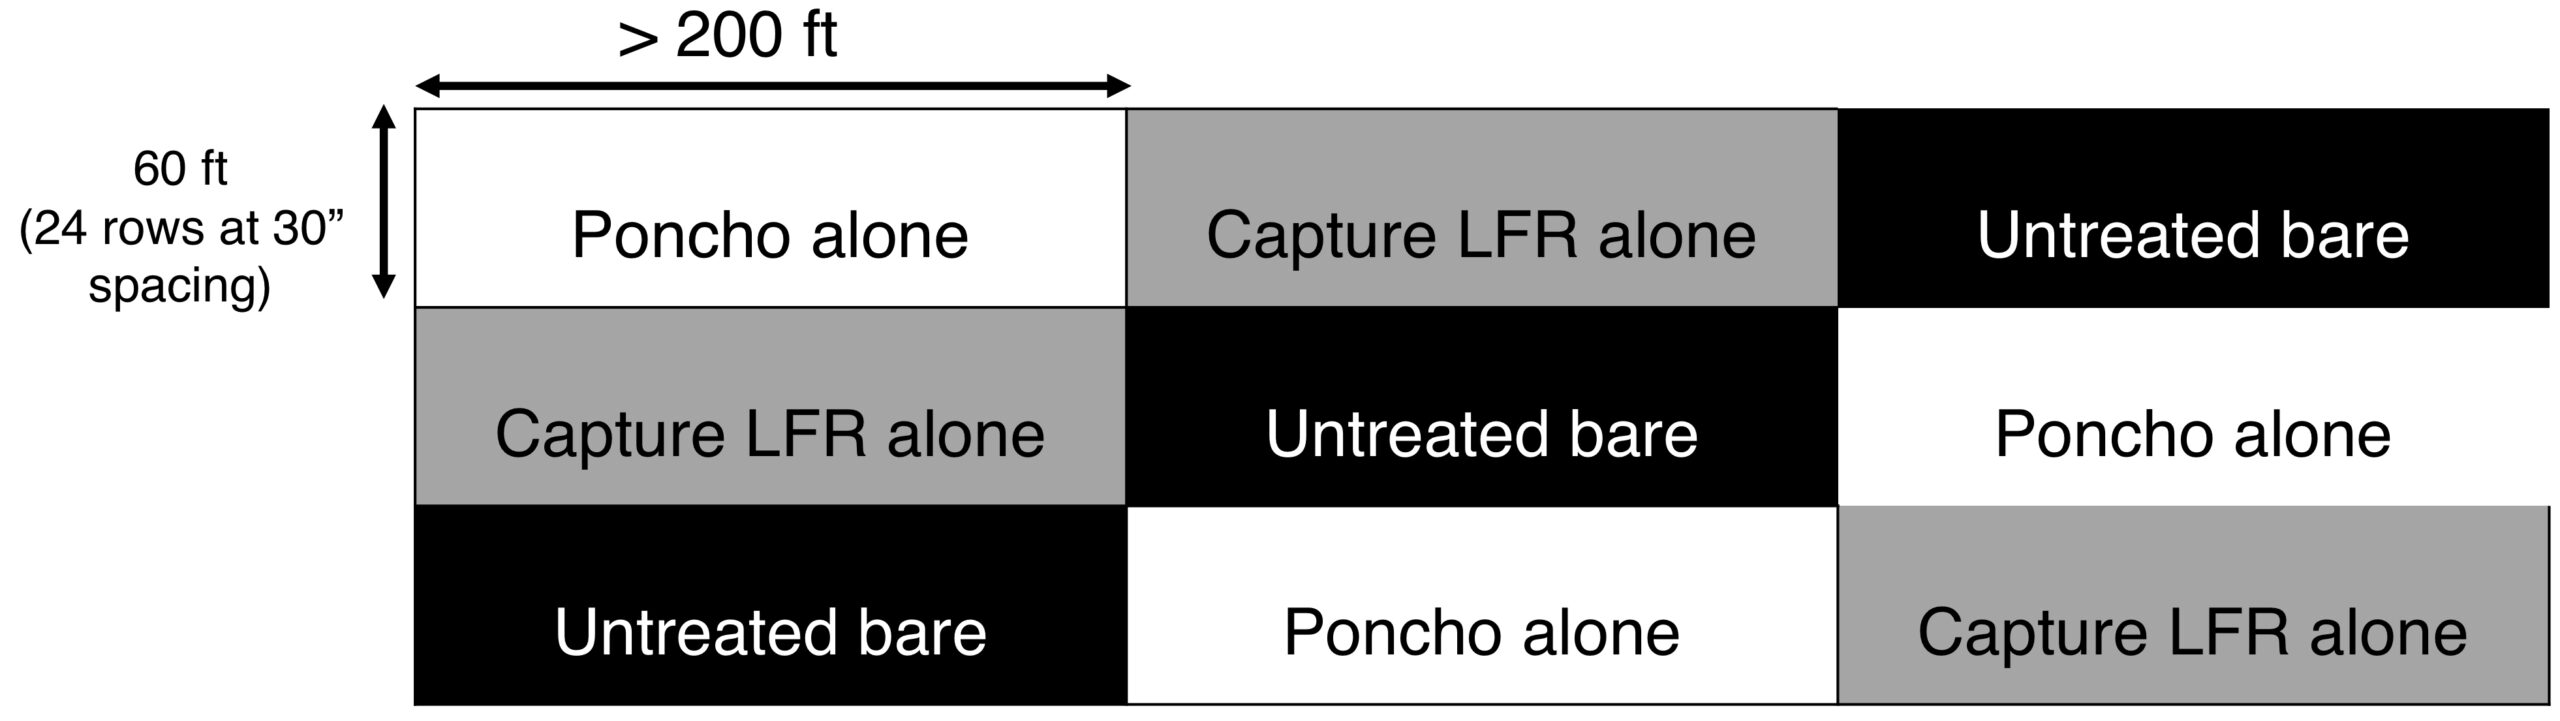
To investigate the pest and non-target impacts of insecticides applied at-planting in corn, we evaluated three different treatments: (1) bare, untreated seed with no insecticide applied in-furrow, (2) seed treated with the NST Poncho 250 (active ingredient clothianidin, 0.25 mg/seed), and (3) bare, untreated seed with the pyrethroid Capture LFR (active ingredient bifenthrin, 13.6 fl oz/acre) applied in-furrow. The three treatments were arranged in a Latin square with three replicate plots a minimum of 200 ft in length consisting of 24 rows at 30 inch spacing (60 ft) (Figure 2). We accounted for variability in weather and pest pressure by replicating across three University of Maryland research farms: Central Maryland Research and Education Center (Beltsville, MD), Wye Research and Education Center (Queenstown, MD), and Western Maryland Research and Education Center (Keedysville, MD) and three growing seasons (2020-2022). Planting, seedling sampling, and harvest dates for the farms in both years are shown in Table 2.
Due to differences in production strategy and potential overlap in the pests managed, we conducted this comparison in separate Bt and non-Bt corn fields at each replicate site, using the same plot design (Figure 2). The Bt hybrid LC1196 VT2P (Local Seed, Memphis, TN) was planted in 2020, with P1197YHR (Pioneer Hi-bred International, Inc. Johnston, IA) in 2021 and 2022. We used the conventional non-Bt hybrid, P1197LR (Pioneer Hi-bred International, Inc. Johnston, IA) in all three years. All hybrids are considered high yielding and had similar maturity dates. Because the Bt and non-Bt varieties were planted in different fields, they are treated as separate studies and analyzed independently. We used the exact same growing practices and sampling methods in the Bt and non-Bt fields.
Table 2. 2020 and 2021 planting, sampling, and harvest dates at UMD research farms (both Bt and non-Bt corn plots).
|
Year |
Location |
Planting date |
Seedling sampling date |
Harvest date |
|
2020 |
Keedysville |
May 18 |
June 8 |
Oct 9 |
|
Beltsville |
May 21 |
June 10 |
Oct 22 |
|
|
Queenstown |
May 13 |
June 3 + 4 |
Oct 5 |
|
|
2021 |
Keedysville |
May 14 |
June 1 + 4 |
Oct 7 |
|
Beltsville |
May 17 |
June 2 |
Oct 8 |
|
|
Queenstown |
May 4 |
May 25 + 26 |
Sept 21 |
|
|
2022 |
Keedysville |
May 26 |
June 10 |
Oct 18 |
|
Beltsville |
June 2 |
June 21 |
Oct 28 |
|
|
Queenstown |
May 12 |
May 31 |
Sept 22 + 23 |
Objective 1: Determine how NSTs and in-furrow pyrethroids affect pest pressure and damage when used against early-season pest complexes in three Maryland growing regions in separate Bt and non-Bt corn fields.
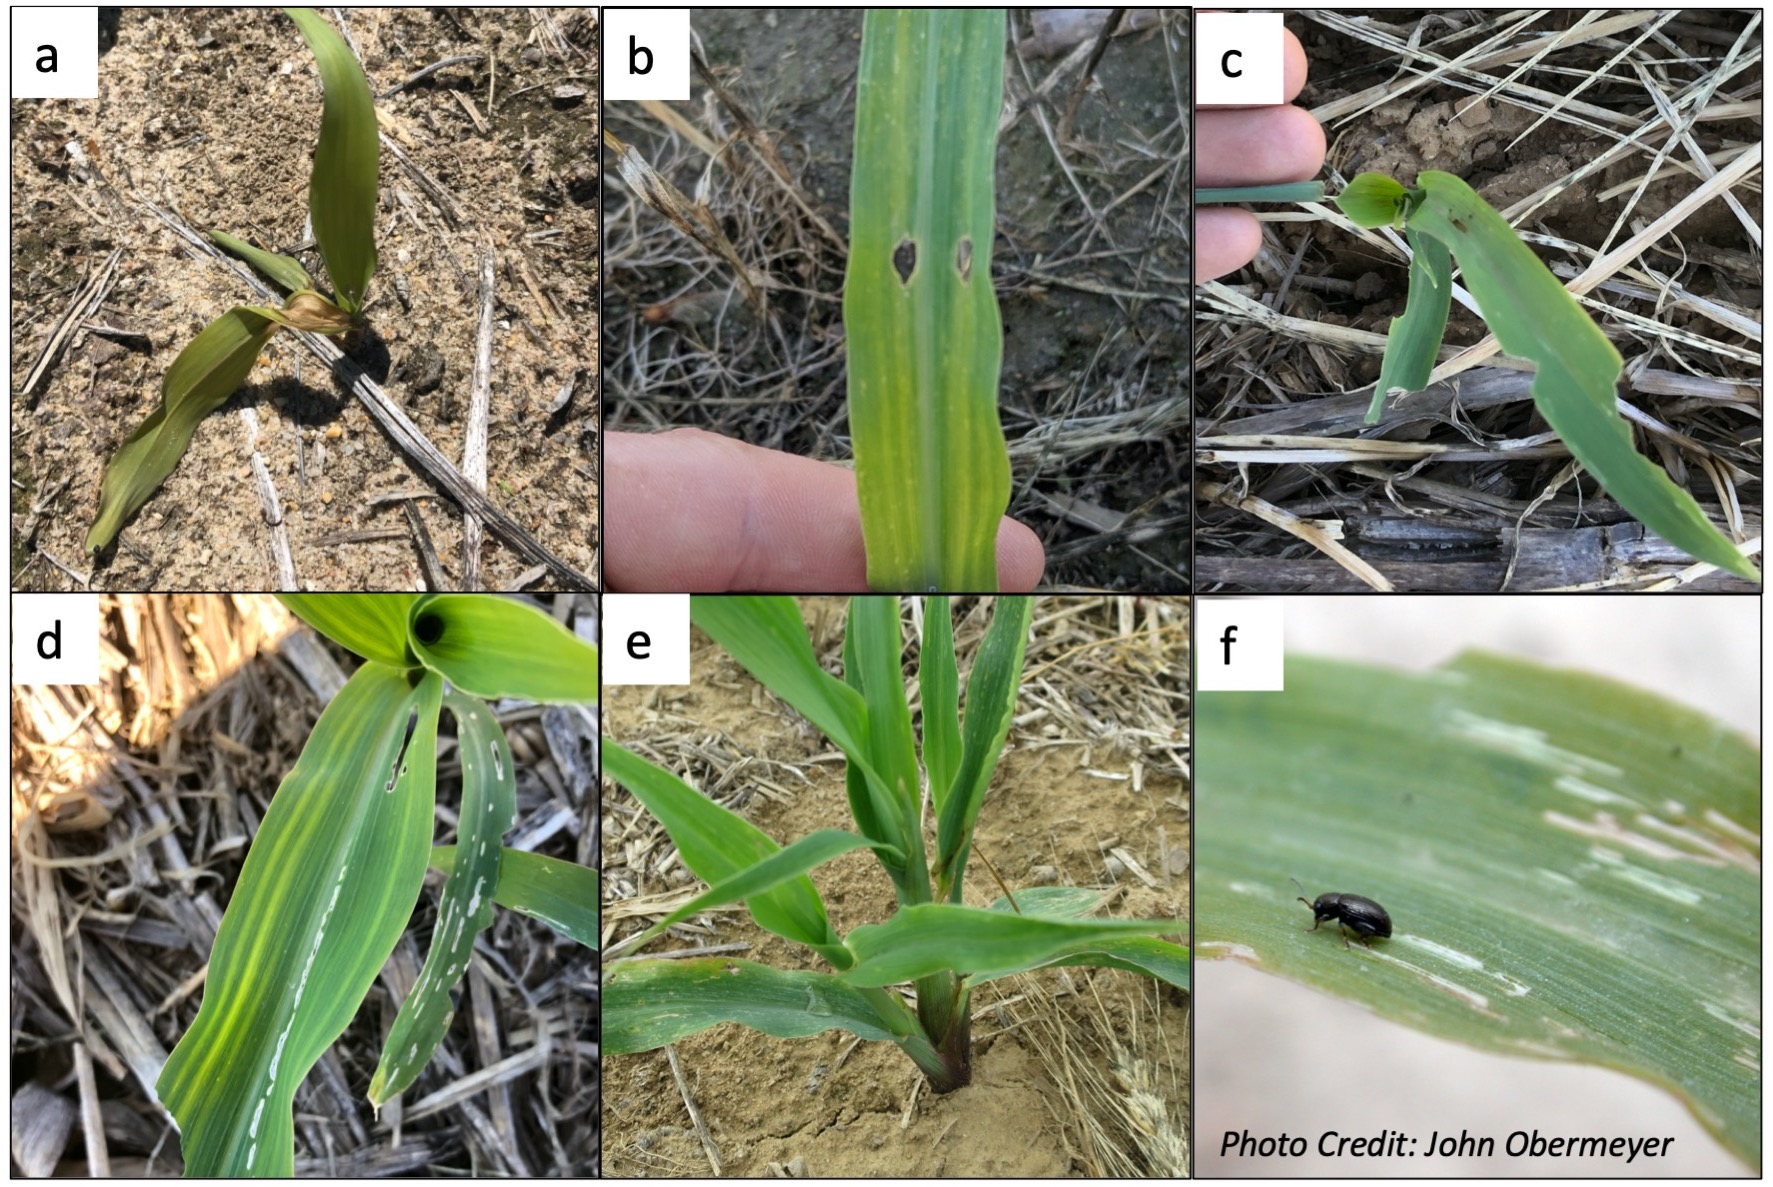
To evaluate the impact that NSTs and in-furrow pyrethroids have on soil pests at planting, we sampled seedlings in the V2-V4 growth stage 3-4 weeks after planting (Table 2). The number of healthy, stunted, and pest damaged plants were counted in three subsamples per plot (50 ft sections of row in three different locations). Plants estimated to be less than half the size of the average healthy plants, but without signs of serious pest damage, were considered stunted. We excavated plants with signs of soil pest damage (yellowing or wilting of center leaves or entire plant) to confirm presence of soil pests (Figure 3a). If identifiable feeding damage or the pest itself was present, plants were categorized as damaged by soil pests. We classified foliar pests feeding by pest category: lepidopteran chewing damage, which included signs of cutworm (holes in rows or plants cut off at the soil) or armyworm (leaf-margin feeding), slugs (rasping that removes leaf tissue in this stripes), and non-lepidopteran foliar feeding (abnormal growth from piercing-sucking damage, small feeding holes from leaf beetles) (Figures 3b-f). Only one type of damage, whatever affected the greatest area, was recorded for each plant. In 2021 and 2022, we measured severity by quantifying the area of foliar damage using a plastic transparency with a 1 cm grid. In all years we measured plant height to determine whether overall plant vigor was affected by the treatments.
Depending on data structure, subsamples were either summed or averaged prior to analysis. Stand counts were summed across subsamples and then were converted to the number of plants per acre. We averaged plant height across subsamples. We summed pest damage data across subsamples. Because damage by any one pest was too inconsistent to analyze, we combined all types of insect damage for analysis. We weighted these total insect counts per plot by the number of plants sampled. We analyzed stand counts, plant height, and insect damage by linear mixed model in R studio version 1.3.1093 using the lme4 package. Insecticide treatment was the fixed effect and year and location were specified as random effects. Assumptions of normality and homogeneity of variances were checked. Data were not normal in all cases, but linear mixed models are robust to non-normal data. Where treatment had a significant effect (p<0.05), we compared treatment means using Tukey’s HSD in the emmeans package.
Objective 2. Determine the impact of NSTs and in-furrow pyrethroids on biological control of slugs by measuring slug activity abundance, slug damage, slug predator activity abundance, and predation rates on slugs in three Maryland growing regions.
To determine whether NSTs and pyrethroids impact slug pressure in corn, we sampled slug activity-abundance, slug predator activity-abundance, and predation by slug predators. Slug damage to seedlings was measured during foliar sampling for Objective 1. The majority of our sampling occurred within 4 weeks of planting when slugs impact corn yields [35]. We measured slug activity-abundance following the procedure described by Raudenbush et al. [36] who found that the addition of a pitfall trap to the traditional shingle trap increased captures. Traps consisted of nested 12 oz cups (WebstrauntStore, Lancaster, PA), sunk into the ground, filled with soapy water. These were covered with a 1 ft2 roof shingle secured with a heavy stone or ground staples. We placed two slug traps per plot and counted slugs once a week for eight weeks following planting in 2020 and 6 weeks in 2021 and 2022. We checked slug traps in the morning when temperatures were lower, roughly between 7:00 and 11:30 AM on every date except for July 15th 2020 in the non-Bt plots at Queenstown, which were sampled between 11:20 and 12:10 PM. We inspected the area under the shingle footprint, within the pitfall trap, and under the pitfall trap for slugs and slug eggs, and the number of each recorded. The soapy water solution was replaced after sampling each week. No slug eggs were found in 2020, but eggs were found at Queenstown in early June in both 2021 and 2022.
We measured slug predator activity-abundance using dry pitfall traps at Queenstown twice starting one week after planting in 2020. Traps consisted of nested 12 oz cups (WebstrauntStore, Lancaster, PA), sunk into the ground and covered with 1 ft2 of stiff plastic. Three carriage bolts were attached to each plastic piece, allowing them to be secured in the soil and slanted for water runoff. We placed two pitfall traps per plot. Pitfall traps were deployed for 12 hours overnight, corresponding with the two deployments of sentinel prey (described below) at Queenstown. Trap contents were collected in the morning and immediately be frozen and stored at -80° C. After the two dates at Queenstown in 2020, we used antifreeze-filled traps for all dates and locations in order to increase captures. These pitfall traps were collected weekly, filtered, and contents stored in 70% ethanol. We counted the taxa credited with slug control [30, 36, 37] and pinned all carabid beetle specimens. These are being identified to species to differentiate between feeding guilds [38].
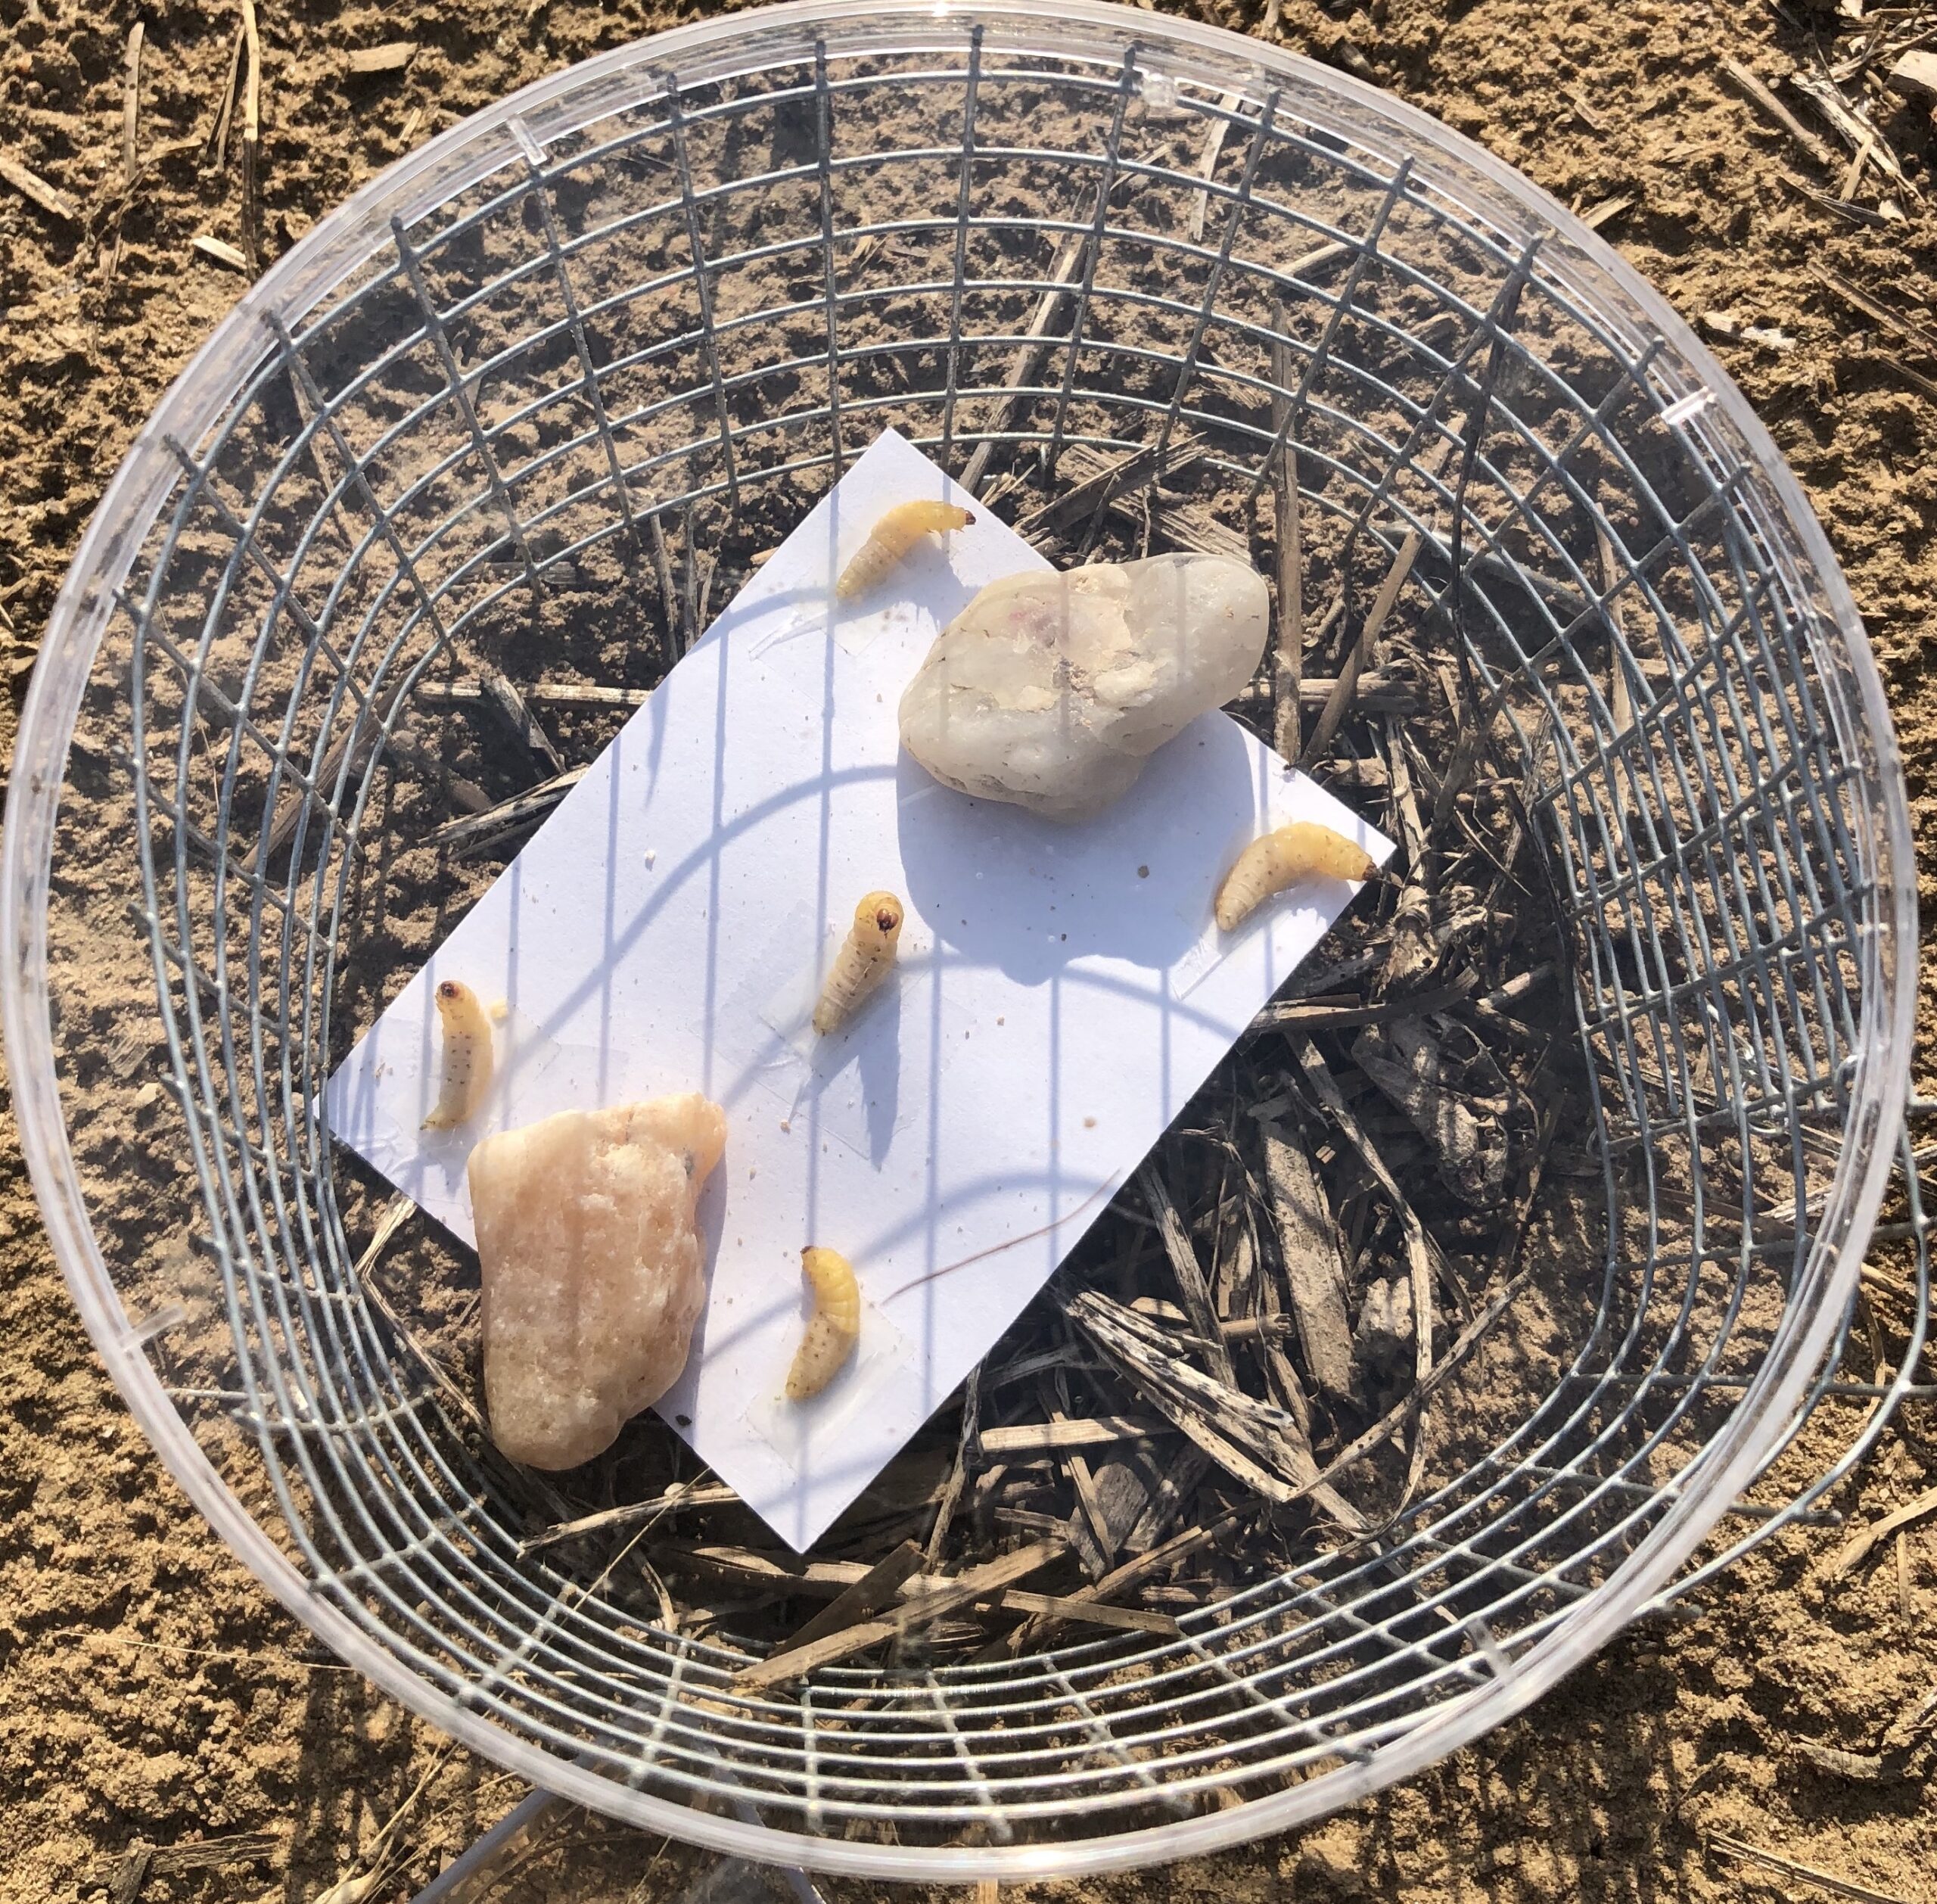
We measured the activity of slug predators using sentinel prey. We used waxworm caterpillars, Galleria mellonella L., as a stand-in for slugs [38], because of difficulty in restraining slugs and as predation on G. mellonella correlates with large carabids that are slug predators [28]. We secured five healthy waxworm larvae (Grubco, Fairfield, OH) to each index card (four cards per plot) using double-sided hem tape (Jo-Ann Stores LLC, Hudson, OH) and clear scotch tape. We prepared index cards the day of deployment and transported them to the field in a cooler with ice packs. To exclude vertebrate predators, we placed index cards in circular cages made from ½ inch mesh, 19-gauge hardwire cloth (The Home Depot Inc, Atlanta, GA) secured to the ground with two ground staples [38]. We covered cages with clear 6 inch by ½ inch petri dishes (Figure 4). We deployed waxworms in the field for approximately 12 hours overnight, collected them in the morning, and immediately evaluated or froze them for later evaluation. We counted larvae showing signs of damage, and recorded the number of intact, predated, and missing larvae per card.
As previously described, we performed separate analyses for Bt and non-Bt experiments and slug seedling damage was analyzed as in Objective 1. The activity density of slugs was compared by averaging the captures between the two traps in each plot, then comparing the average number of slugs counted per week. Sentinel prey data were converted to the percent of prey damaged out of the original 20 deployed per plot. Slug damage, slug activity abundance, and sentinel prey percentage were all analyzed by linear mixed model, specifying insecticide treatment as the fixed effect and year and location as random effects. Assumptions of normality and homogeneity of variances were checked. Data were not normal in all cases, but linear mixed models are very robust to non-normal data. Slug predator abundance will be analyzed with a linear mixed model once all specimens have been identified to species. This work is ongoing, but will be included in an extension publication when complete.
Objective 3. Determine the impacts of NSTs and in-furrow pyrethroids on yield and evaluate late season ear and stand damage in three Maryland growing regions using separate Bt and non-Bt corn fields.
While NSTs and pyrethroids applied at-planting will not affect stalk or ear damage, Bt controls some lepidopteran stalk and ear pests. To better understand stalk and whorl pest pressure and ear pest pressure and damage given regional pest suppression [32, 33], we sampled whorls and ears for pest damage. Sampling dates are presented in Table 3.
Table 3. 2020 and 2021 whorl and ear sampling dates at UMD research farms (both Bt and non-Bt corn plots).
|
Year |
Location |
Whorl/stalk sampling date |
Ear sampling date |
|
2020 |
Keedysville |
July 20 |
August 14 |
|
Beltsville |
July 23 |
August 10 |
|
|
Queenstown |
July 22 |
August 7 |
|
|
2021 |
Keedysville |
July 9 |
August 5 |
|
Beltsville |
July 6 |
August 12 |
|
|
Queenstown |
July 7 |
August 3 |
|
|
2022 |
Keedysville |
July 7 |
September 2 |
|
Beltsville |
July 19 |
September 7 |
|
|
Queenstown |
July 6 |
August 10 & 11 |
To assess late-season pests that might attack the stalk, we sampled 10 plants in 4 different locations per plot. In 2020 we assessed one eye-level leaf from R2 plants for damage from boring lepidopteran larvae, Japanese beetles, grasshoppers, and stinkbugs, and measured any area damaged in cm2 to the nearest ½ centimeter. In 2021 and 2022 we looked for the same types of pest damage in the whorl stage and used a rating system from 1-5 instead to assess degree of damage. 1= unblemished plant, 2= minor feeding, 3= significant feeding, but stalk intact, 4= feeding that damaged the stalk or tassels, and 5= completely defoliated plant. In both years we field-identified any pests present, and collected or photographed them for later identification.
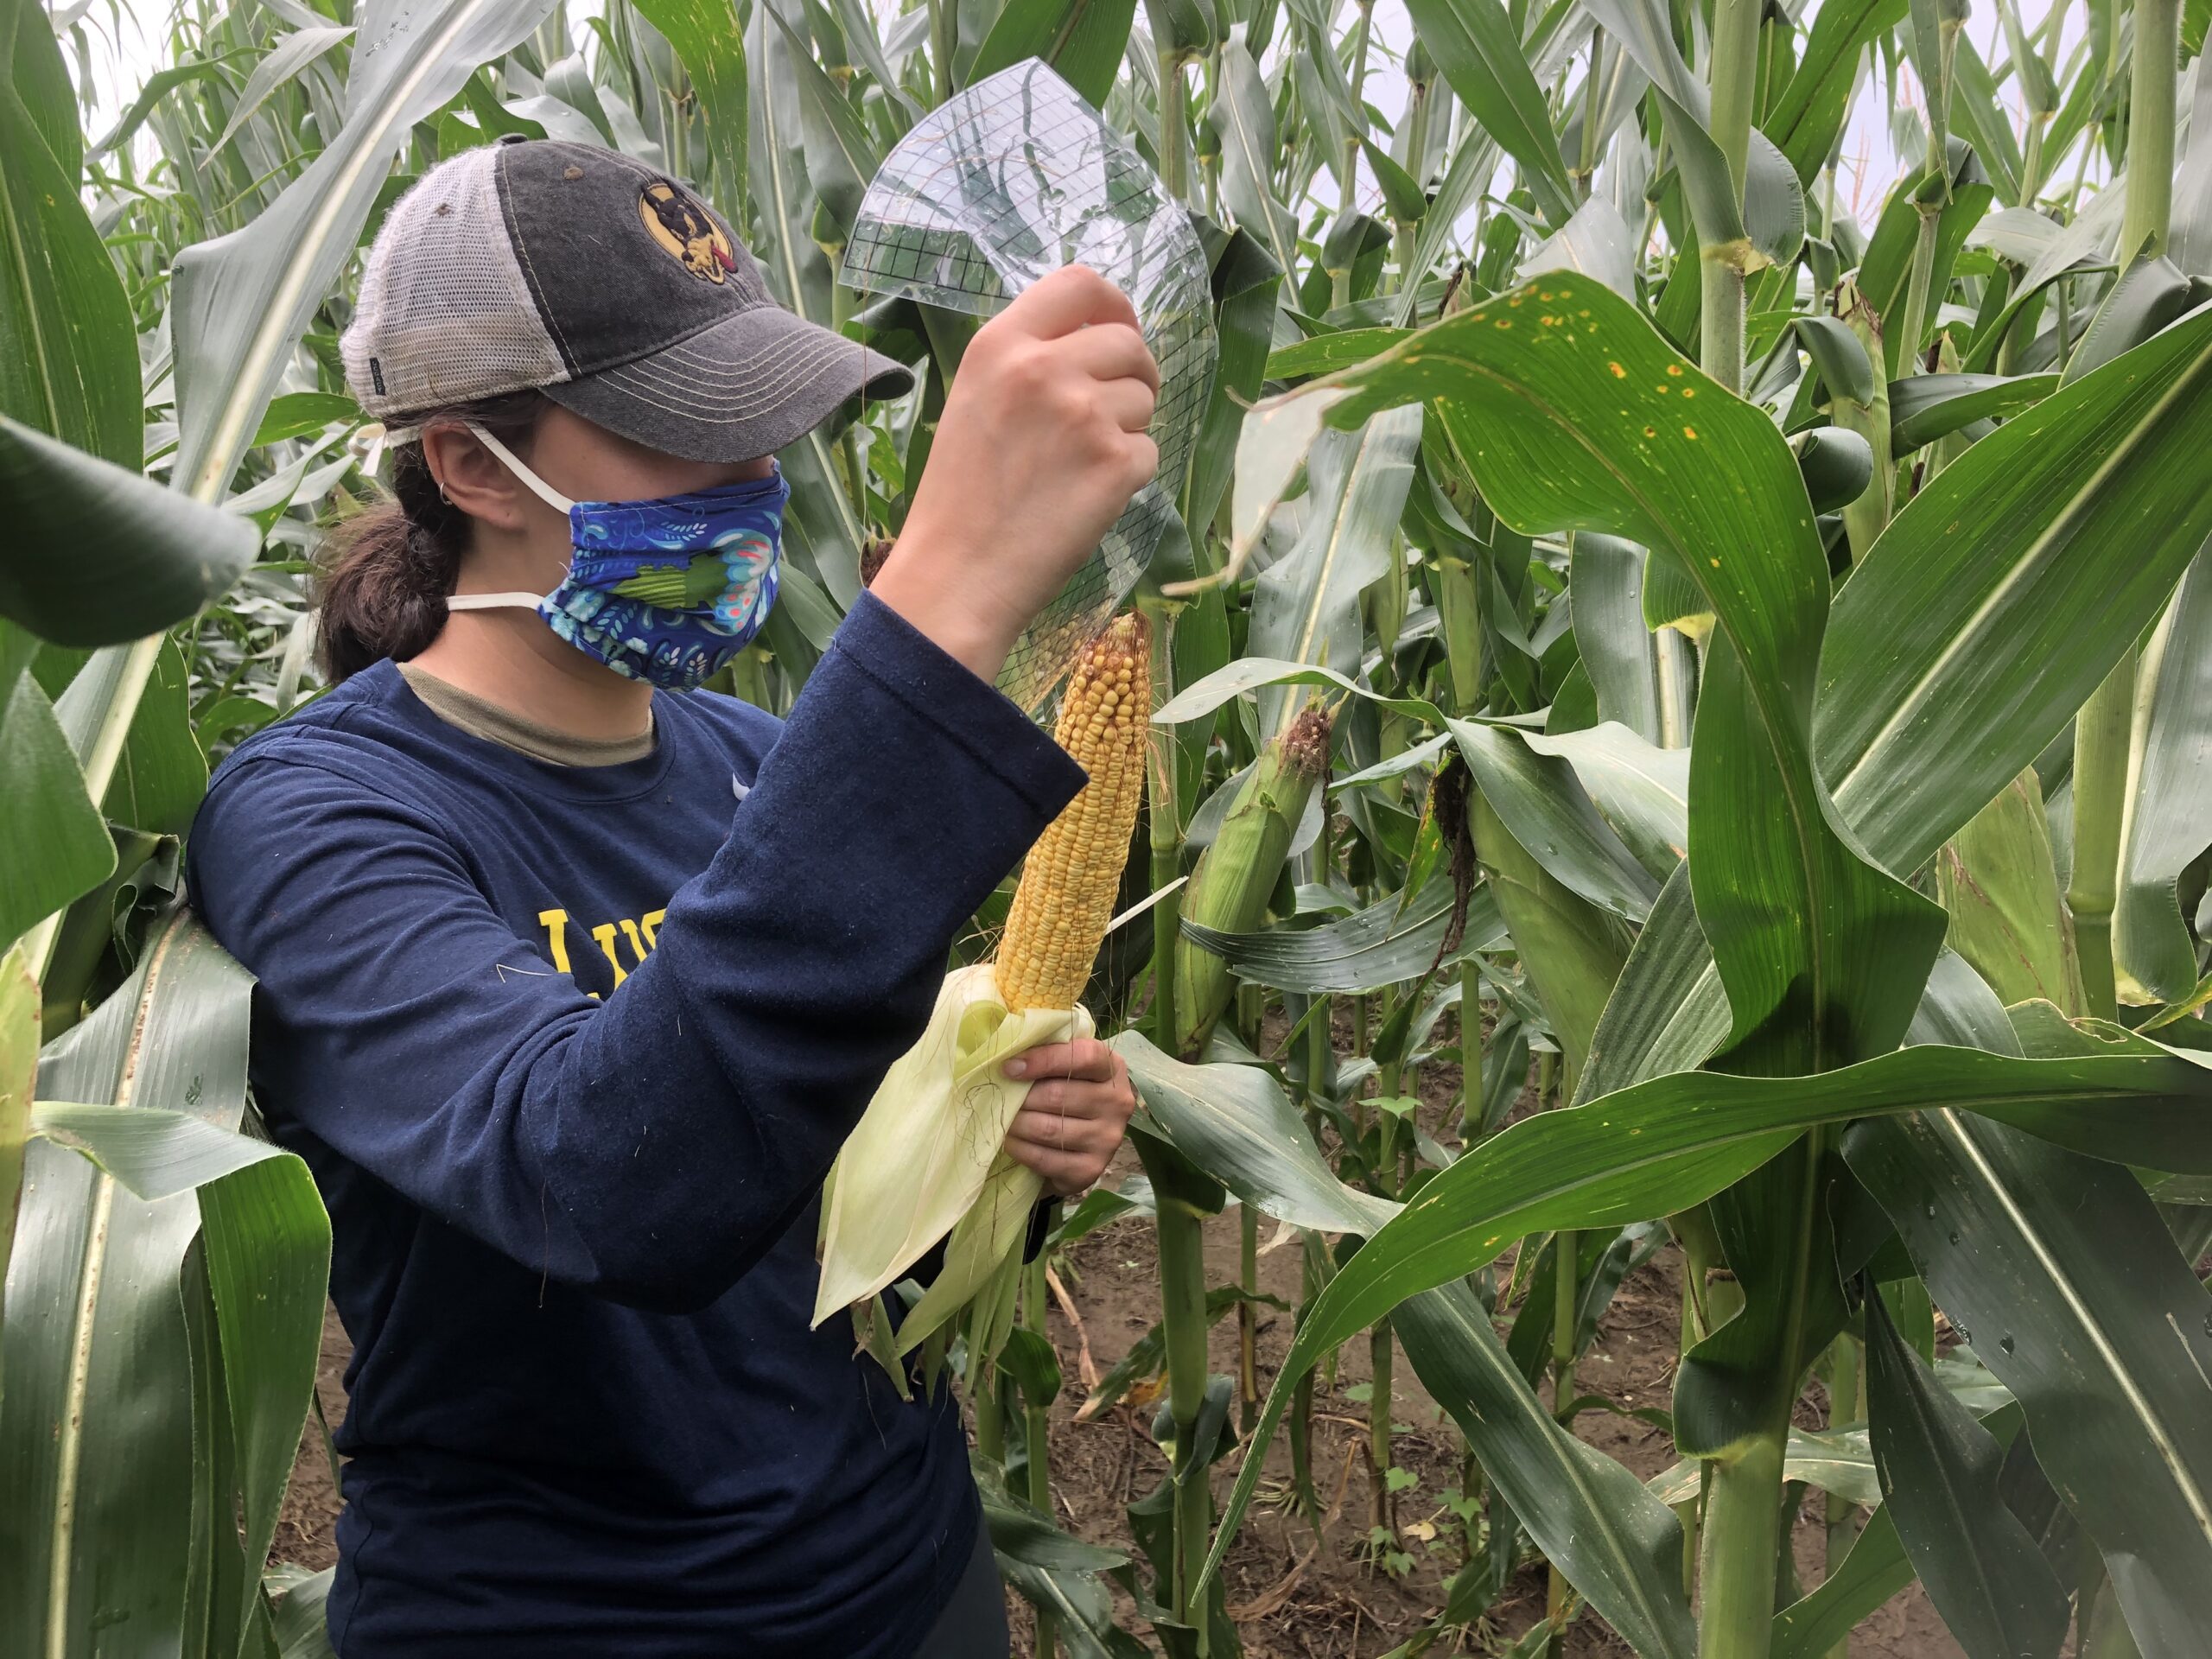
For ear sampling in all years, we also sampled 10 plants in 4 locations per plot. We removed ears from the stalk, husked them, and counted the area of kernels damaged in cm2 using a transparent grid (Figure 5). Damage was classified as (1) caterpillar damage, (2) stink bug damage, and (3) sap beetle damage. Any pests present were identified and recorded. If the caterpillar was present, it was identified.
At maturity, whole plots were harvested by a combine harvester. Yield was taken at harvest using a calibrated combine, weigh wagon, or truck scale, depending upon the equipment available at each farm. We converted the weight to bushels per acre corrected to 15.5% moisture.
All data were analyzed separately in Bt and non-Bt experiments. Whorl damage was almost completely absent so we did not analyze it. Subsamples of ear damage were summed at the plot level, and the percent of ears damaged was calculated for incidence. For ear damage severity, the average area damaged per ear was calculated for each plot. Ear damage incidence and severity, and yield were all analyzed with linear mixed model. Insecticide treatment was included as a fixed effect while year and location were specified as random effects.
Results and discussion
Objective 1: Determine how NSTs and in-furrow pyrethroids affect pest pressure and damage when used against early-season pest complexes in three Maryland growing regions in separate Bt and non-Bt corn fields.
Non-Bt seedling stand and pest damage. We expected to see the highest insect pest pressure in non-Bt corn because it has no built-in protection from plant incorporated insecticides, but we generally saw low pest pressure of all kinds across all sites and years. When we combined damage from all of the insects sampled (soil pests, armyworm, cutworm, and other foliar feeders), Capture LFR and Poncho 250 both had significantly less damage than the untreated control (Figure 6). However, when we looked at any of the pest damage types by themselves, there were many years and locations where specific pests were entirely absent. For example, soil pests affected more than 5% of untreated plants in only one site-year out of nine. Similarly, caterpillar pest pressure was low – armyworm and cutworm damage never reached treatment thresholds in any site-year. In addition to low incidence, the area damaged by foliar insect pests per plant did not differ by treatment and the number of plants per acre was also not affected by treatment. These finding suggest that although we found significant differences in pest incidence, they are unlikely to drive yield differences. Finally, plant height was not affected by treatment, suggesting that insecticide treatments were not impacting general plant health.

Bt seedling stand and pest damage. As with the non-Bt corn, we did not see high insect pest pressure in the seedling stage, and we combined all insect damage to perform statistical analyses. When we analyzed combined insect damage, Poncho significantly reduced the percent of plants with damage compared to the untreated or Capture plots (Figure 7). However, even in the untreated and Capture, damage was quite low. As in the non-Bt corn, soil pests only exceeded 5% damage in the untreated plots in one site-year out of nine. Again, armyworm and cutworm damage did not reach treatment thresholds. Insecticide treatments did not affect the leaf area damaged by insects. Unlike in the non-Bt corn, we did see a treatment effect on plant stand (F2, 74=3.60, p<0.05). The Poncho plots had a higher mean number of seedlings per acre than the untreated control (25,731 ± 456 and 23,623 ± 714, respectively) while the Capture (24,699 ± 633) was not different from either.

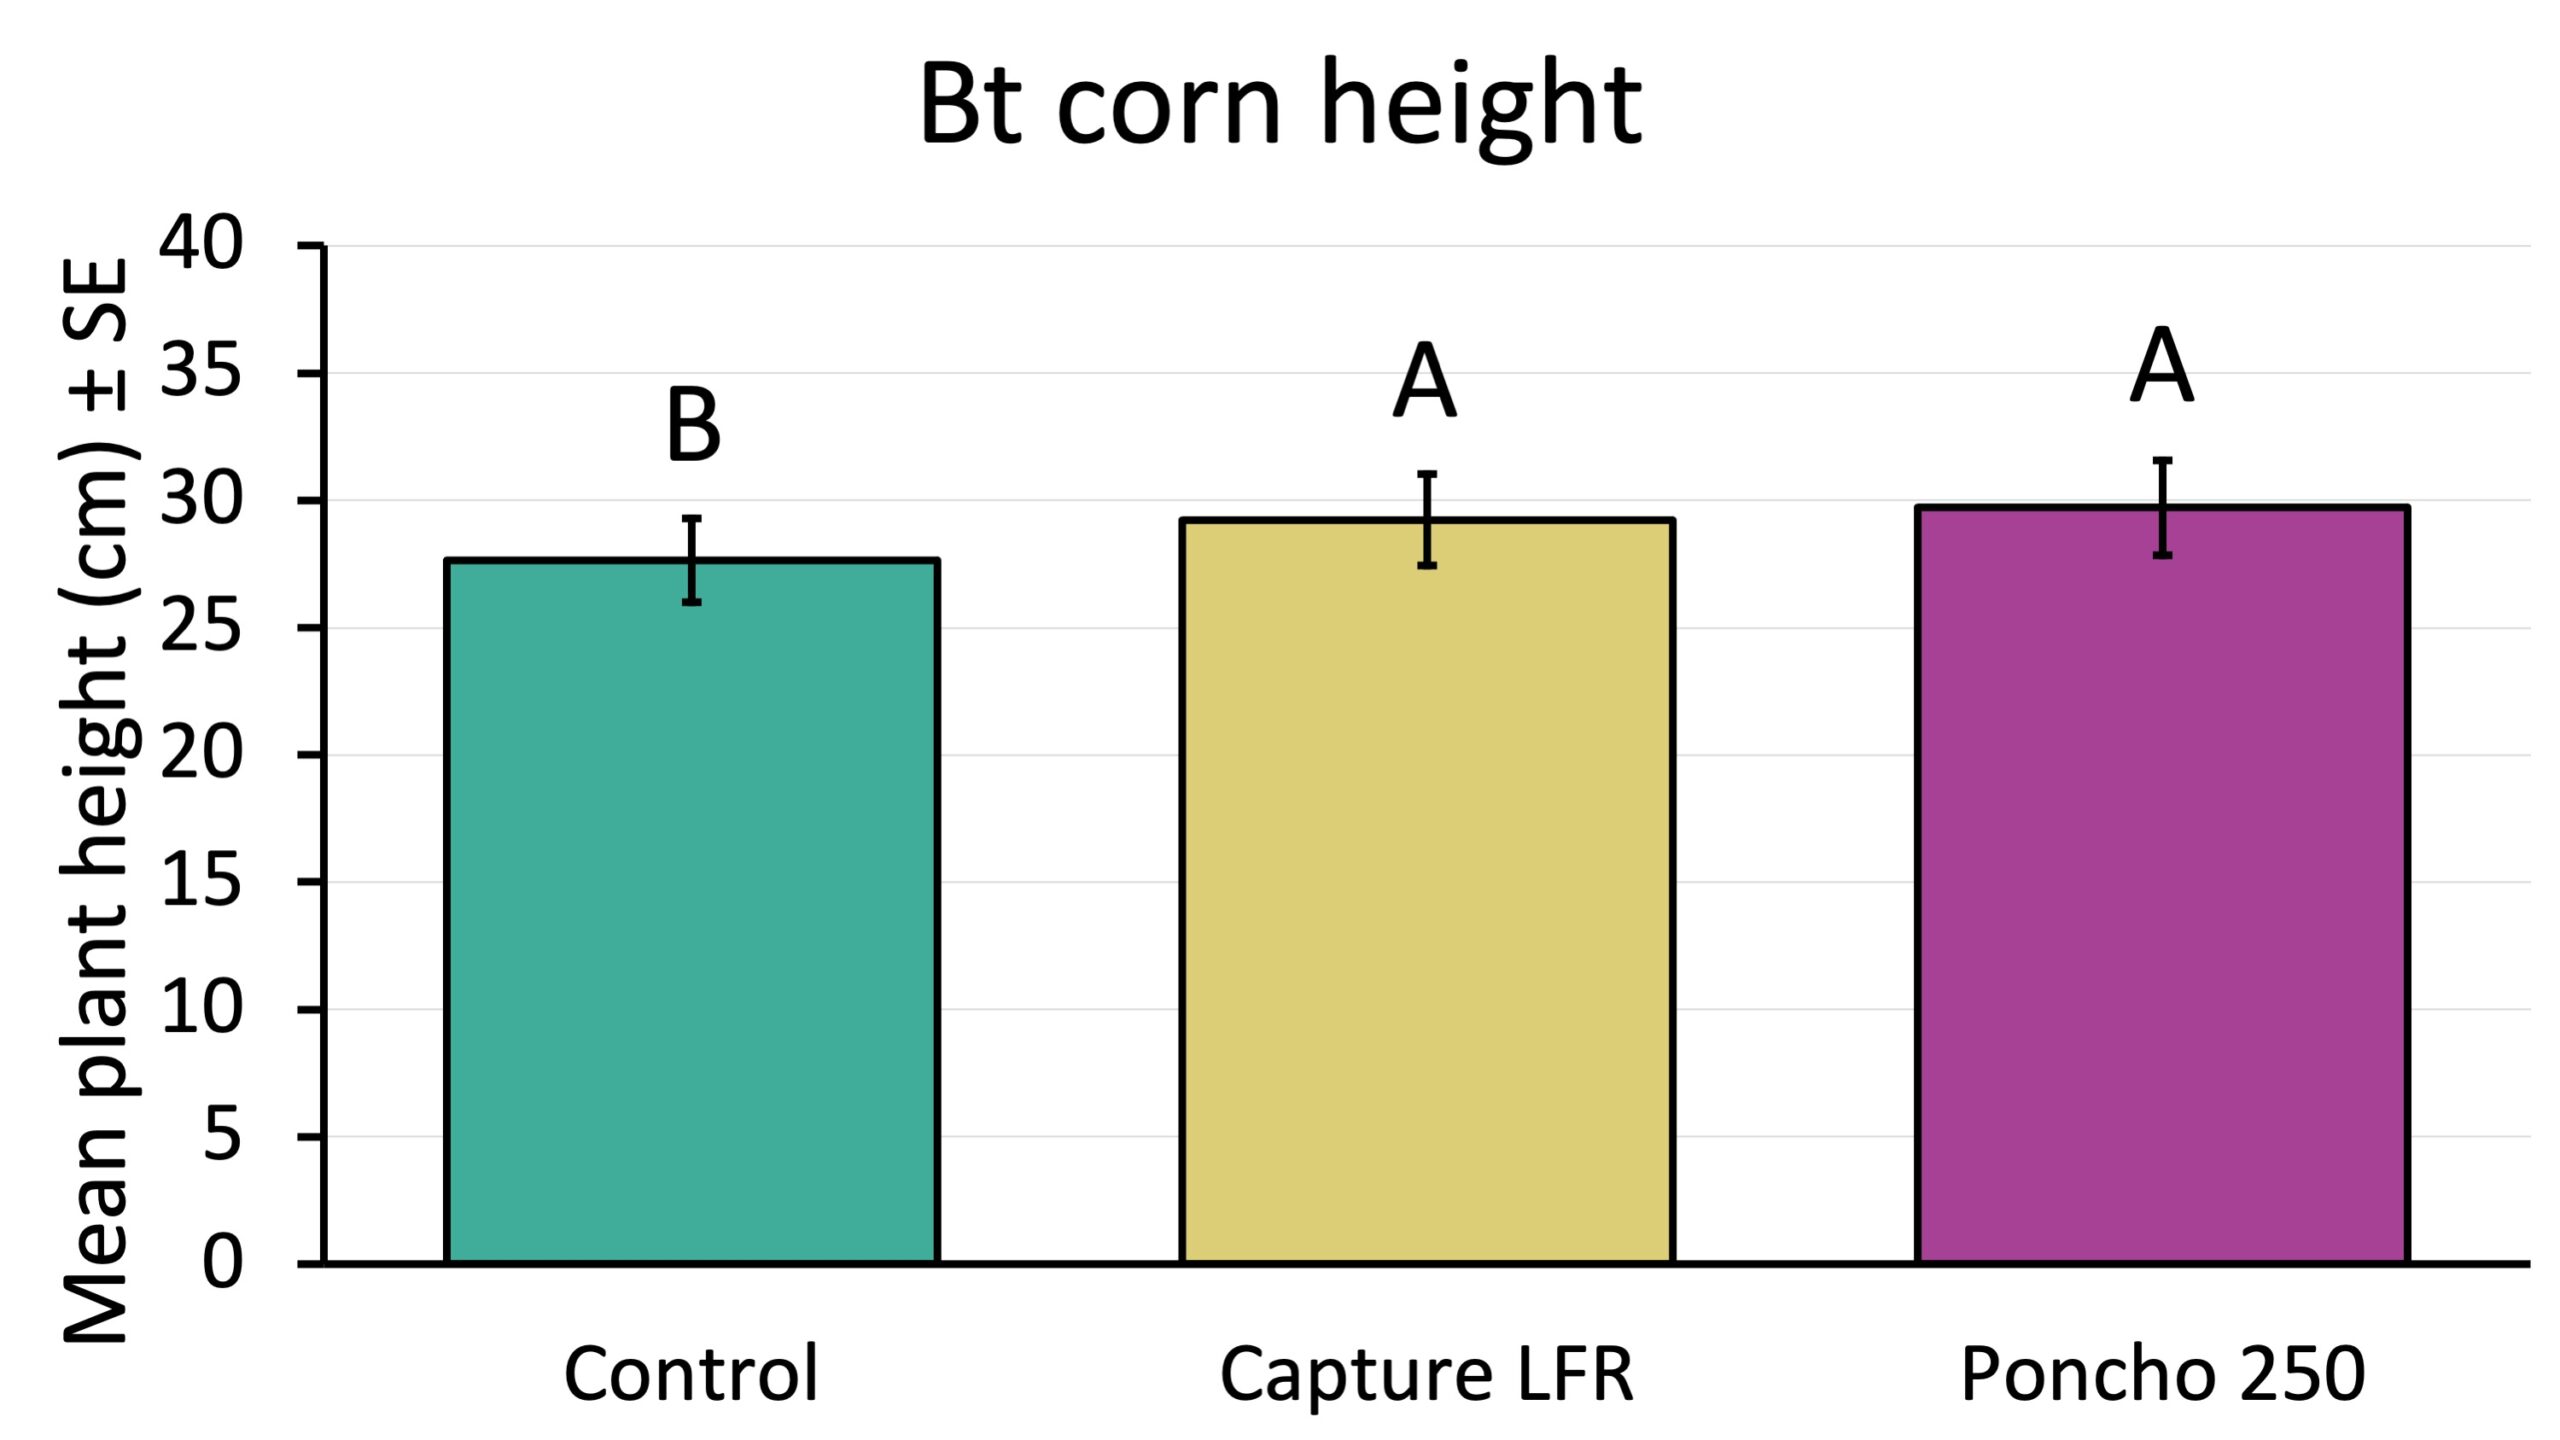
Plant height was significantly affected by treatment (Figure 8), with taller plants in both insecticide treatments compared to the control. However, the magnitude of the differences was small. Capture increased plant height by 5.4% compared to the untreated control, while Poncho increased height 7.2%.
Objective 2. Determine the impact of NSTs and in-furrow pyrethroids on biological control of slugs by measuring slug activity abundance, slug damage, slug predator activity abundance, and predation rates on slugs in three Maryland growing regions.
Predator abundance. We are still in the process of identifying predators collected from pitfall traps. We have broadly sorted predatory arthropods from all of the traps into 5 categories (carabid beetle adults, staphylinid adults, predatory beetle larvae (larvae of carabids and staphylinids, as well as fireflies), spiders, and centipedes). However, not all species within these categories are necessarily slug predators, so finer identification is necessary in order to fully understand whether biocontrol agent populations are directly affected by treatments. When we complete identification and analysis of predator species abundance, we will share results in newsletter articles and extension talks.
In summaries of the broad categories of predatory arthropods, there was no obvious effect of treatment on trap capture of any of the predators (Tables 4 and 5). We tended to capture more carabid and staphylinid adults and spiders across treatments, while beetle larvae and centipedes were less abundant. Opilionids (harvestmen) are also a well-known slug predator that are very abundant in some corn-growing regions, but were never captured in our study. It is important to note that historic use of neonicotinoids in our fields may generally suppress predator abundance and make it difficult to see an effect from not using insecticides in a single season.
Table 4. The mean number of predators captured per week in non-Bt corn ± SE. Data are averaged across three UMD research farms from 2020-2022. Statistical analysis was not performed.
|
Treatment |
Mean carabids ± SE |
Mean staphylinids ± SE |
Mean beetle larvae ± SE |
Mean spiders ± SE |
Mean centipedes ± SE |
|
Untreated |
3.3 ± 0.6 |
2.7 ± 0.9 |
0.6 ± 0.1 |
13.7 ± 5.4 |
0.6 ± 0.2 |
|
Capture |
3.3 ± 0.4 |
1.8 ± 0.4 |
0.5 ± 0.1 |
7.0 ± 2.4 |
0.8 ± 0.2 |
|
Poncho |
3.7 ± 0.6 |
1.6 ± 0.5 |
0.6 ± 0.2 |
3.2 ± 0.5 |
0.6 ± 0.1 |
Table 5. The mean number of predators captured per week in Bt corn ± SE. Data are averaged across three UMD research farms from 2020-2022. Statistical analysis was not performed.
|
Treatment |
Mean carabids ± SE |
Mean staphylinids ± SE |
Mean beetle larvae ± SE |
Mean spiders ± SE |
Mean centipedes ± SE |
|
Untreated |
2.8 ± 0.6 |
2.6 ± 0.6 |
0.9 ± 0.3 |
7.7 ± 3.5 |
1.0 ± 0.3 |
|
Capture |
1.8 ± 0.3 |
1.7 ± 0.3 |
0.4 ± 0.1 |
4.2 ± 0.8 |
1.4 ± 0.3 |
|
Poncho |
2.2 ± 0.3 |
2.4 ± 0.6 |
0.6 ± 0.2 |
3.6 ± 0.5 |
1.2 ± 0.3 |
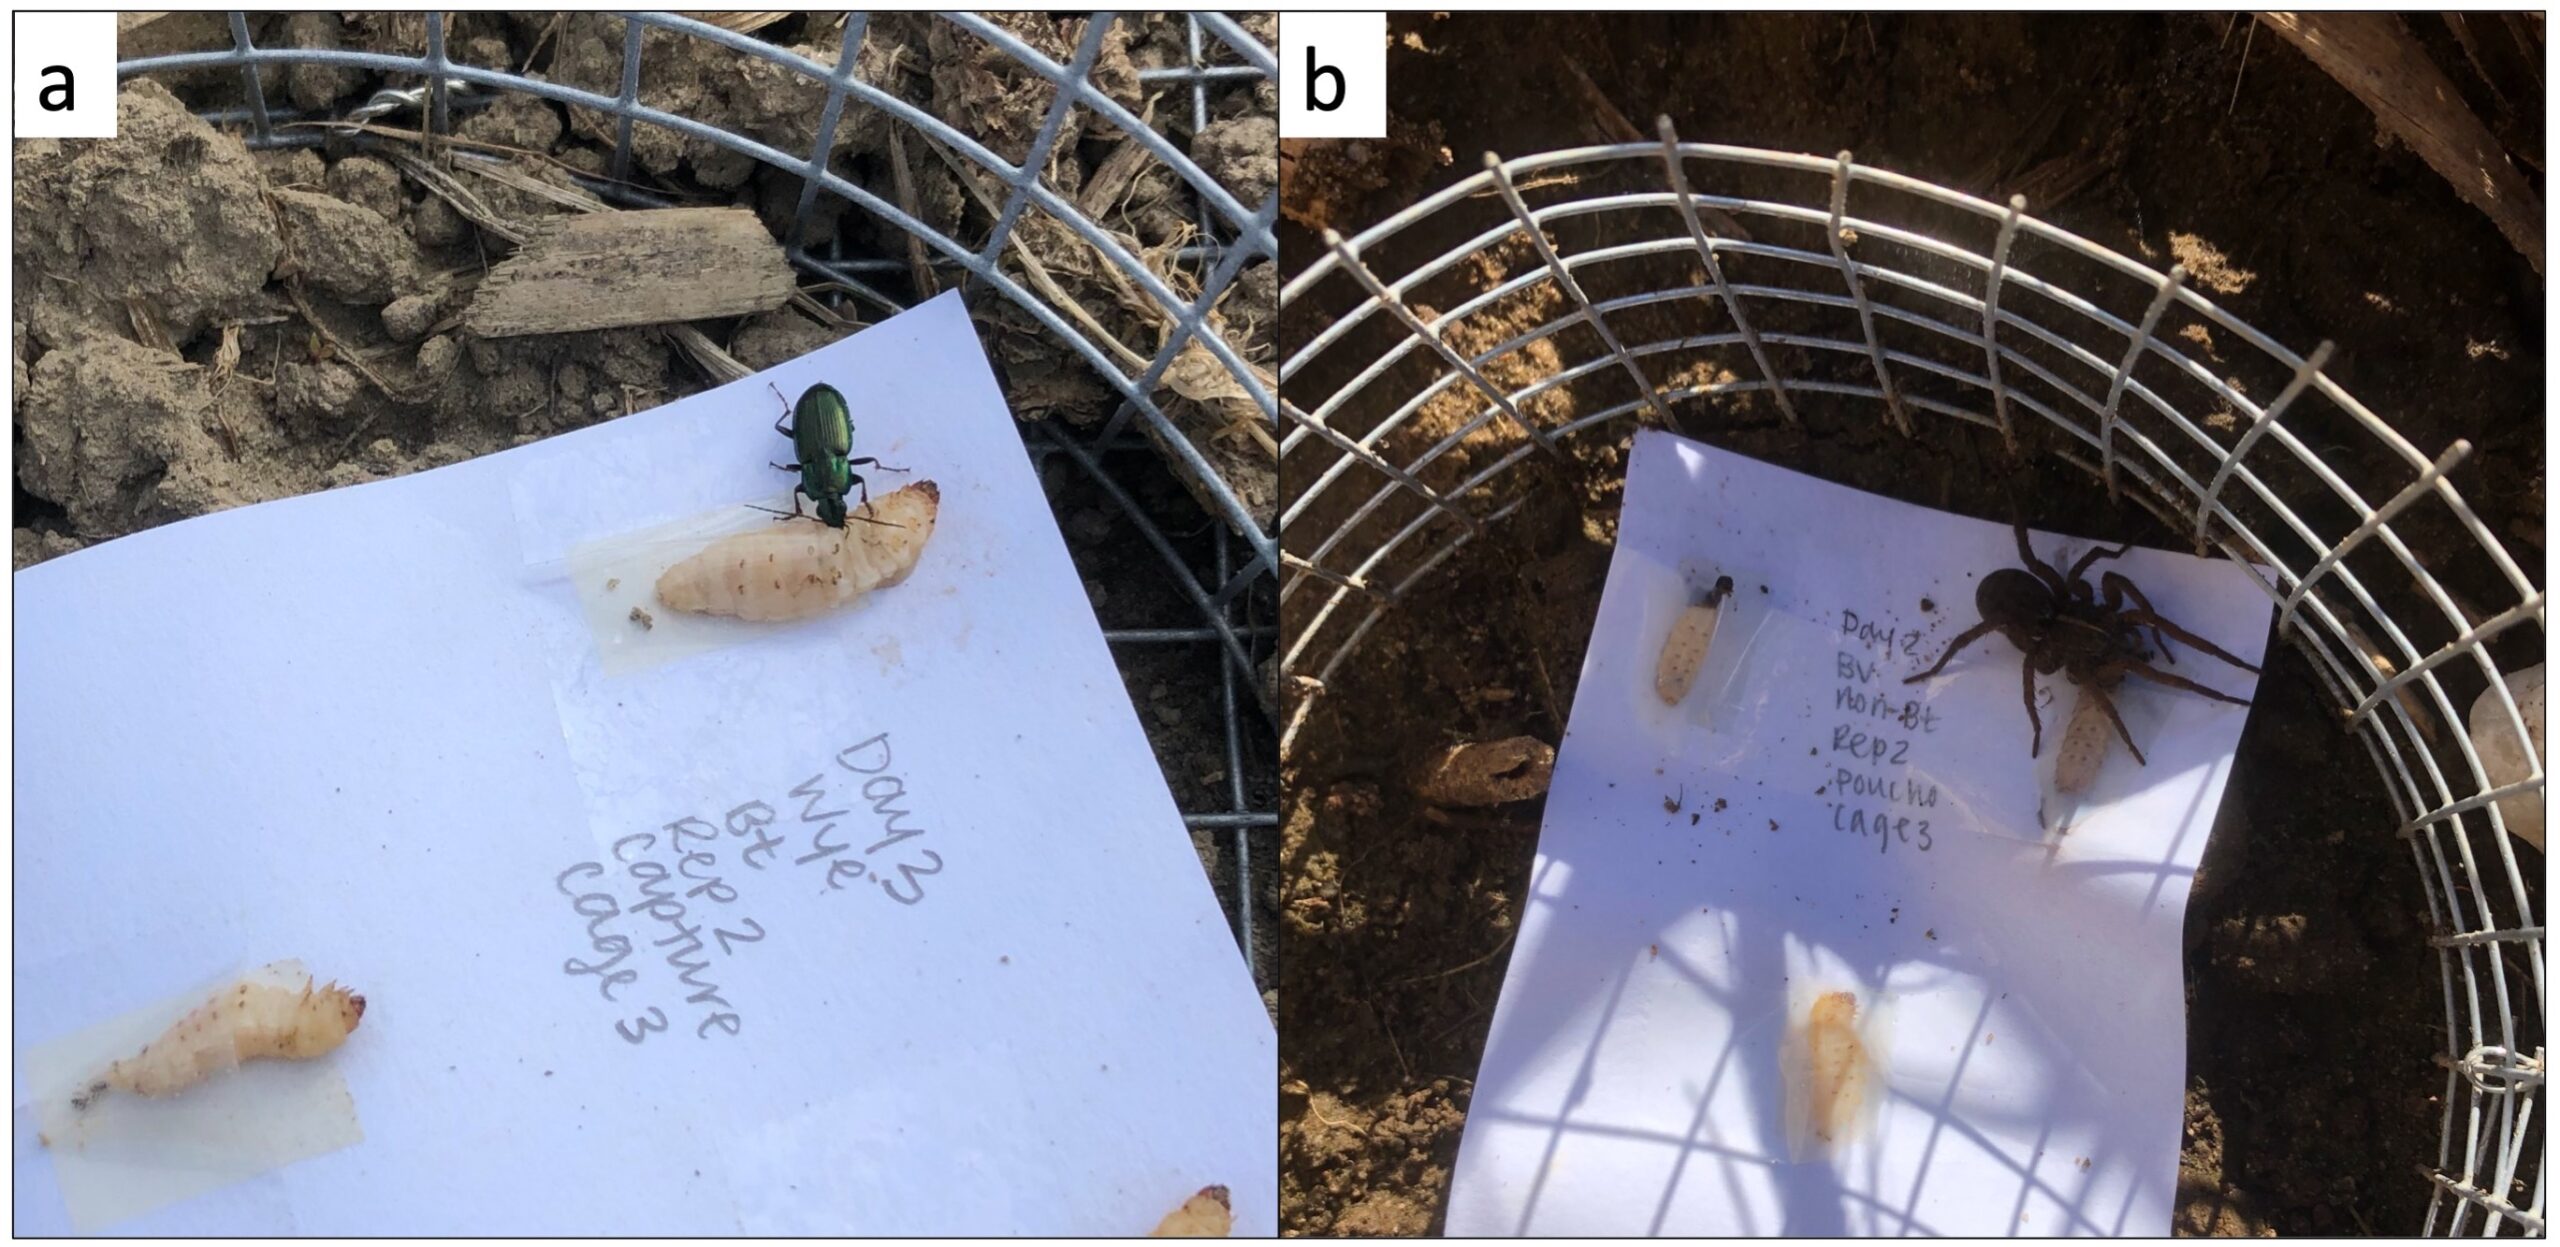
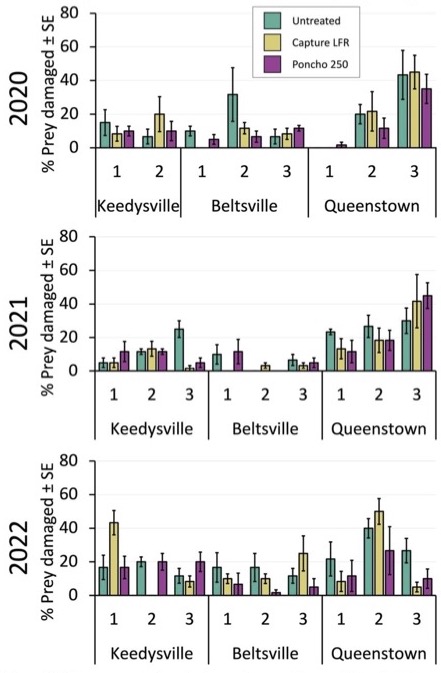
Sentinel prey. We measured the percent of sentinel prey placed in plots overnight that were damaged by predators. Predators consuming the sentinel prey included carabid beetles and wolf spiders known predators of slugs (Figures 9a and b).
We saw no relationship between treatment and predation rates (Figure 10 shows predation rates in Bt corn. Non-Bt was similar and is not shown). This suggests that the at-planting insecticides tested are not decreasing predator activity in treated plots. It is also possible that predators that are sensitive to insecticides have already been removed from the cropping system due to historic insecticide use on the research farms. Another possible explanation is that this predation is caused by mobile predators that readily move throughout the field. We did generally see some level of predation all weeks at our locations. In Bt corn, predation ranged from 0.5% to 41% across sampling dates in the different years and locations, with 18 out of 26 samples having more than 10% predation. In Non-Bt plots, predation ranged from 2% to 62% with 16 out of 26 having more than 10% predation. These results show that predators are consistently active in corn fields throughout the state, including in the earliest sampling weeks after planting when corn is most vulnerable. However, it should be kept in mind that our planting dates were sometimes later than some would plant due wet field sites and variability in planting time throughout the state.
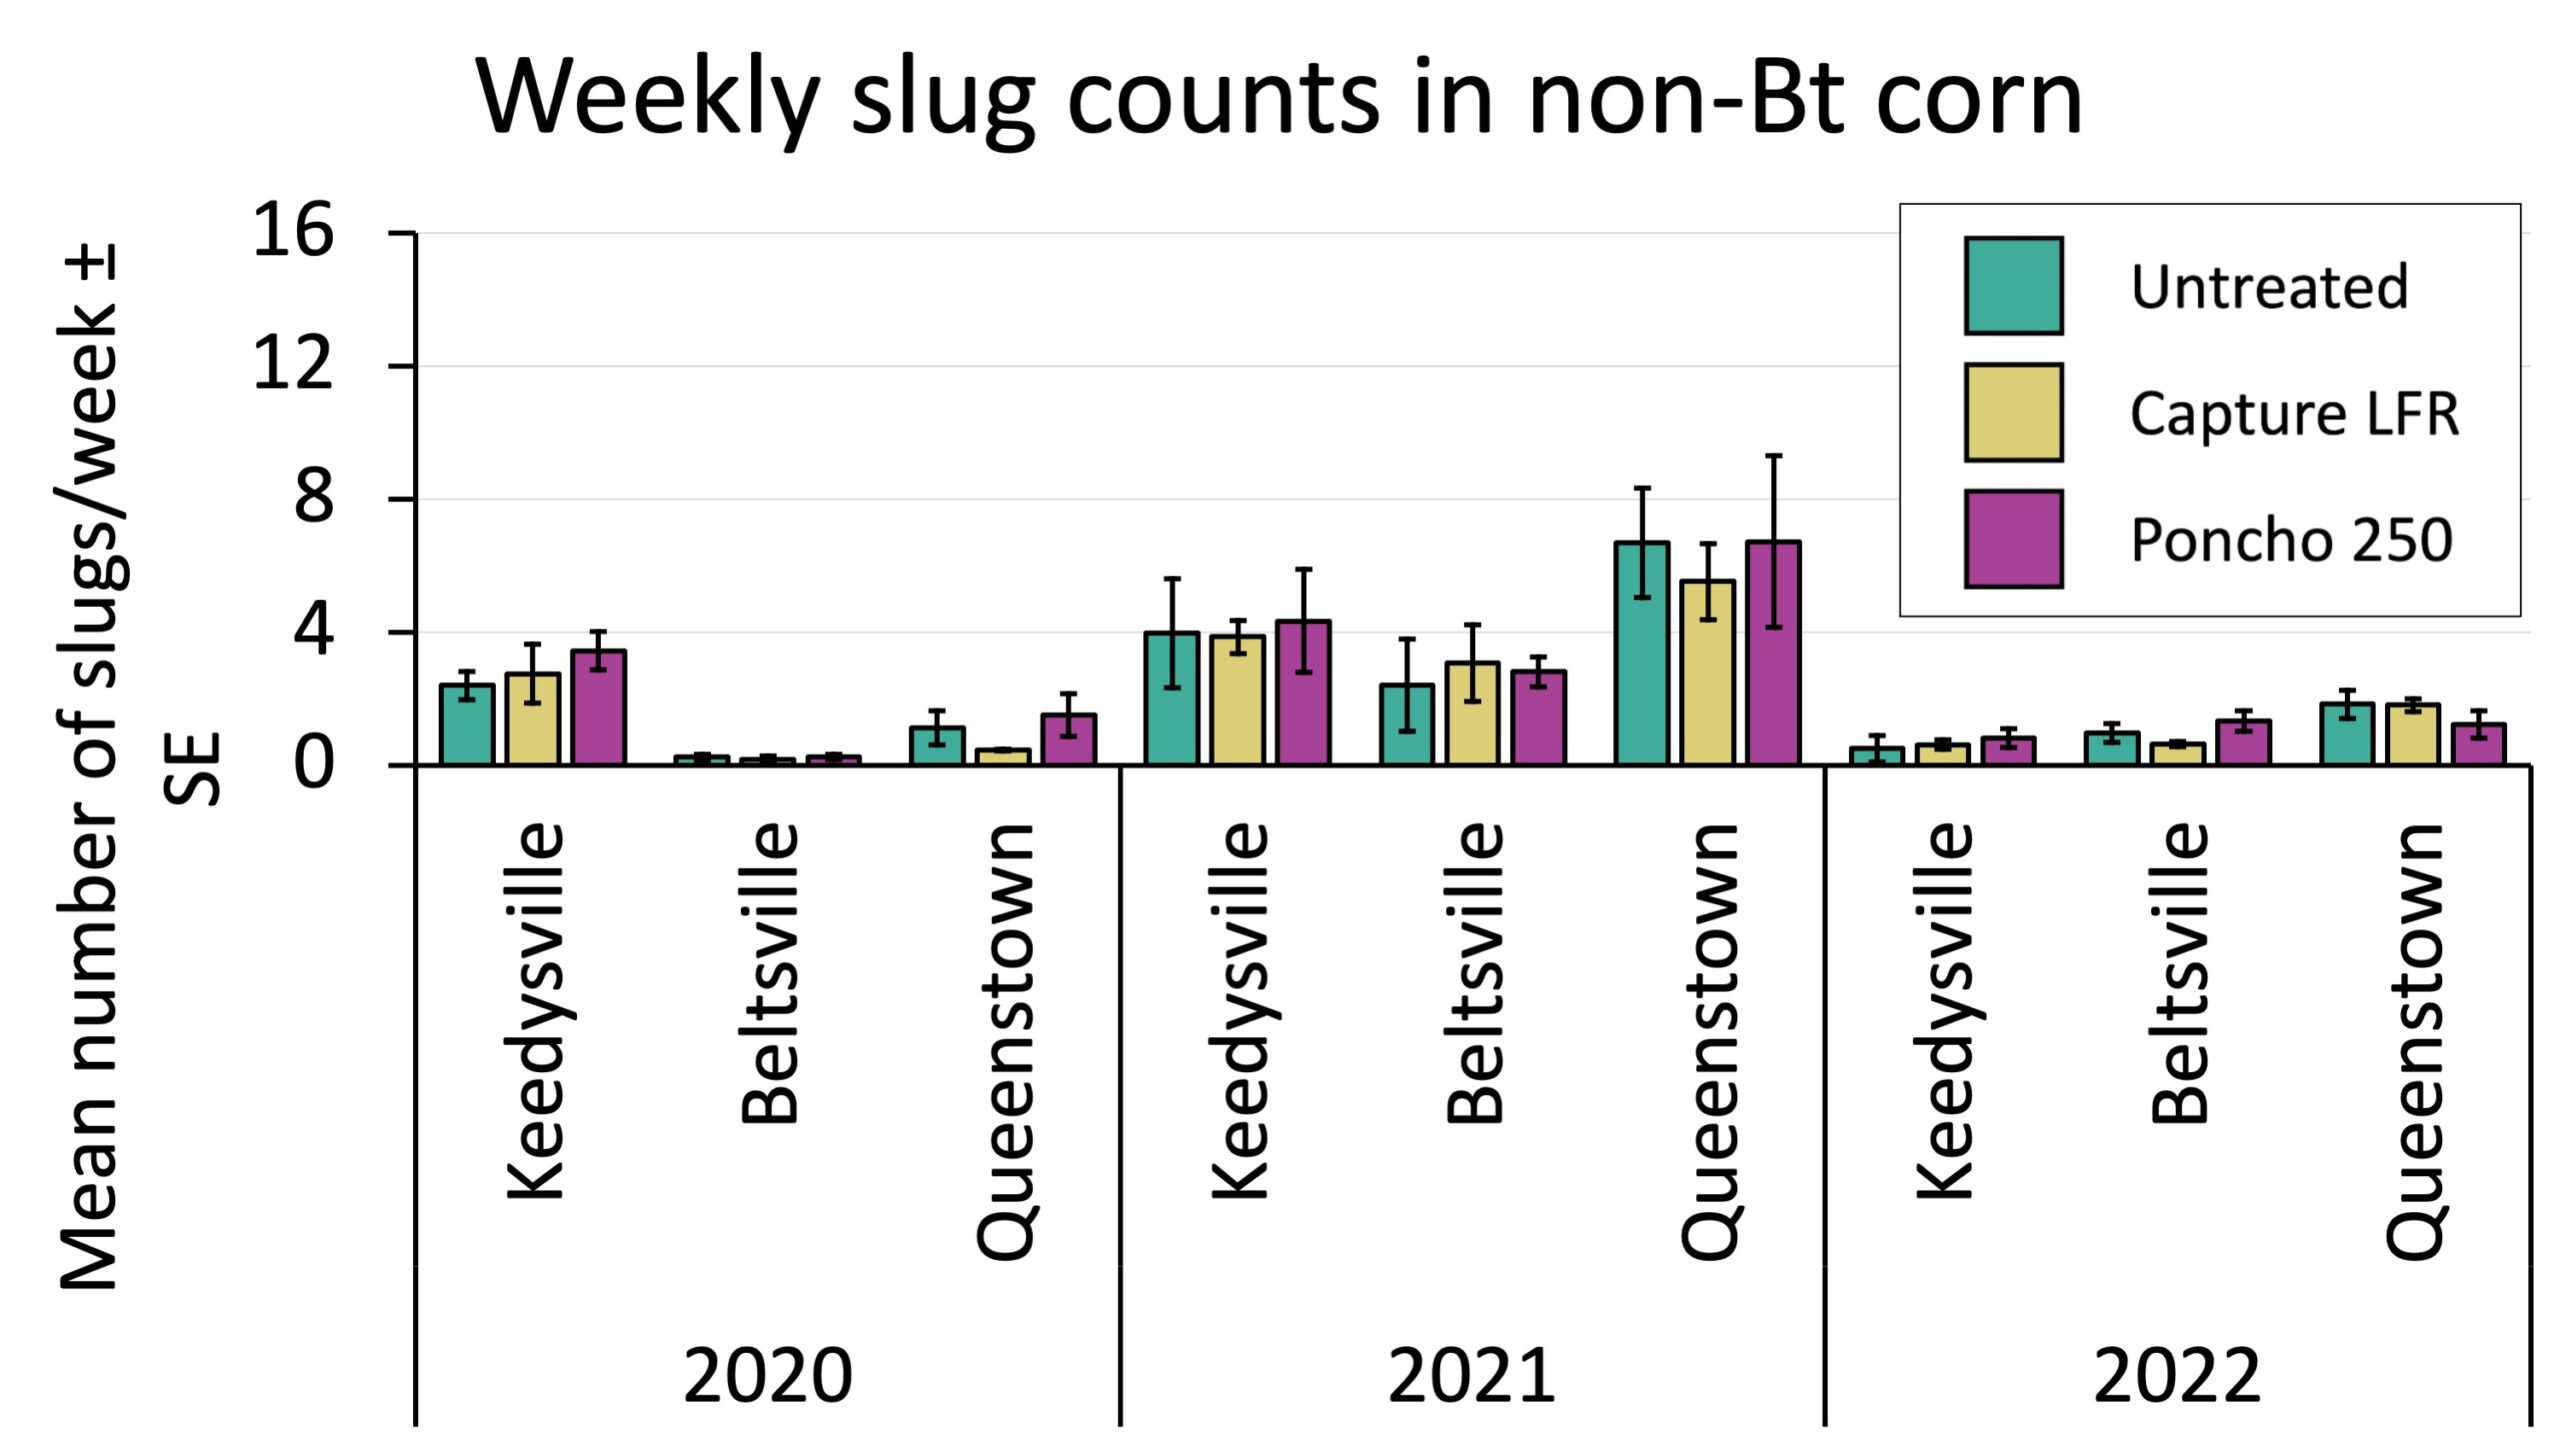
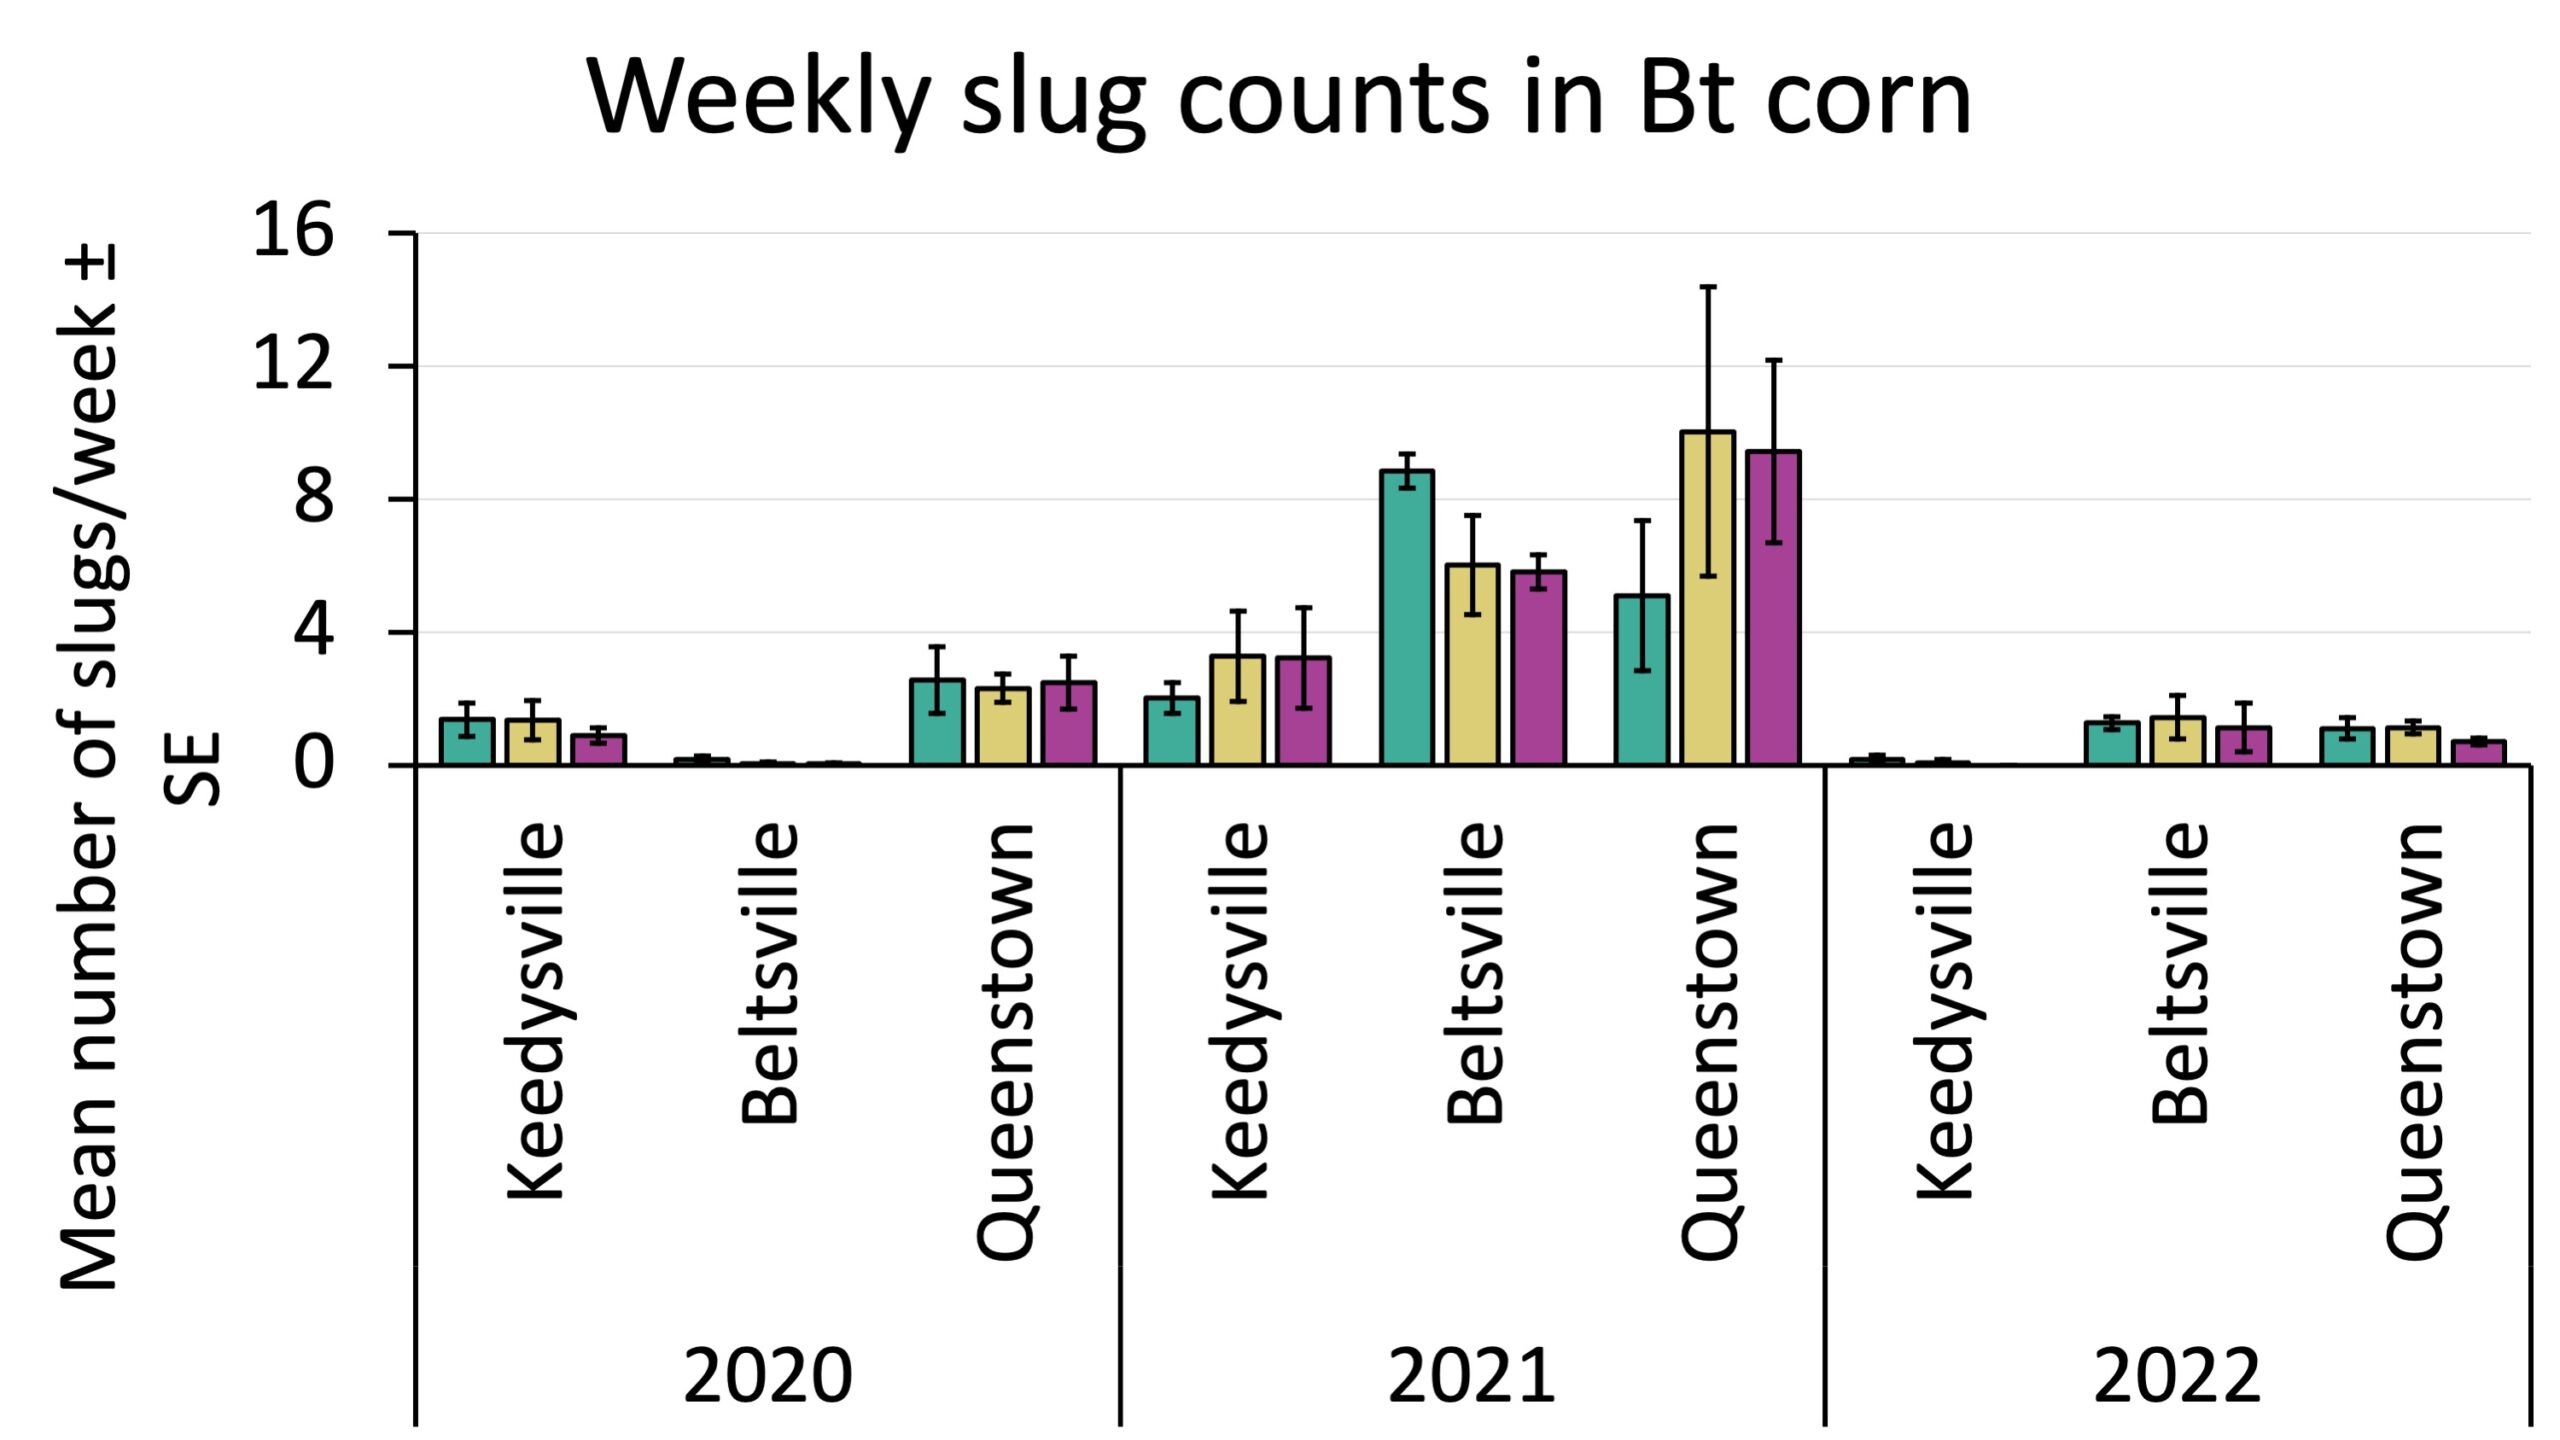
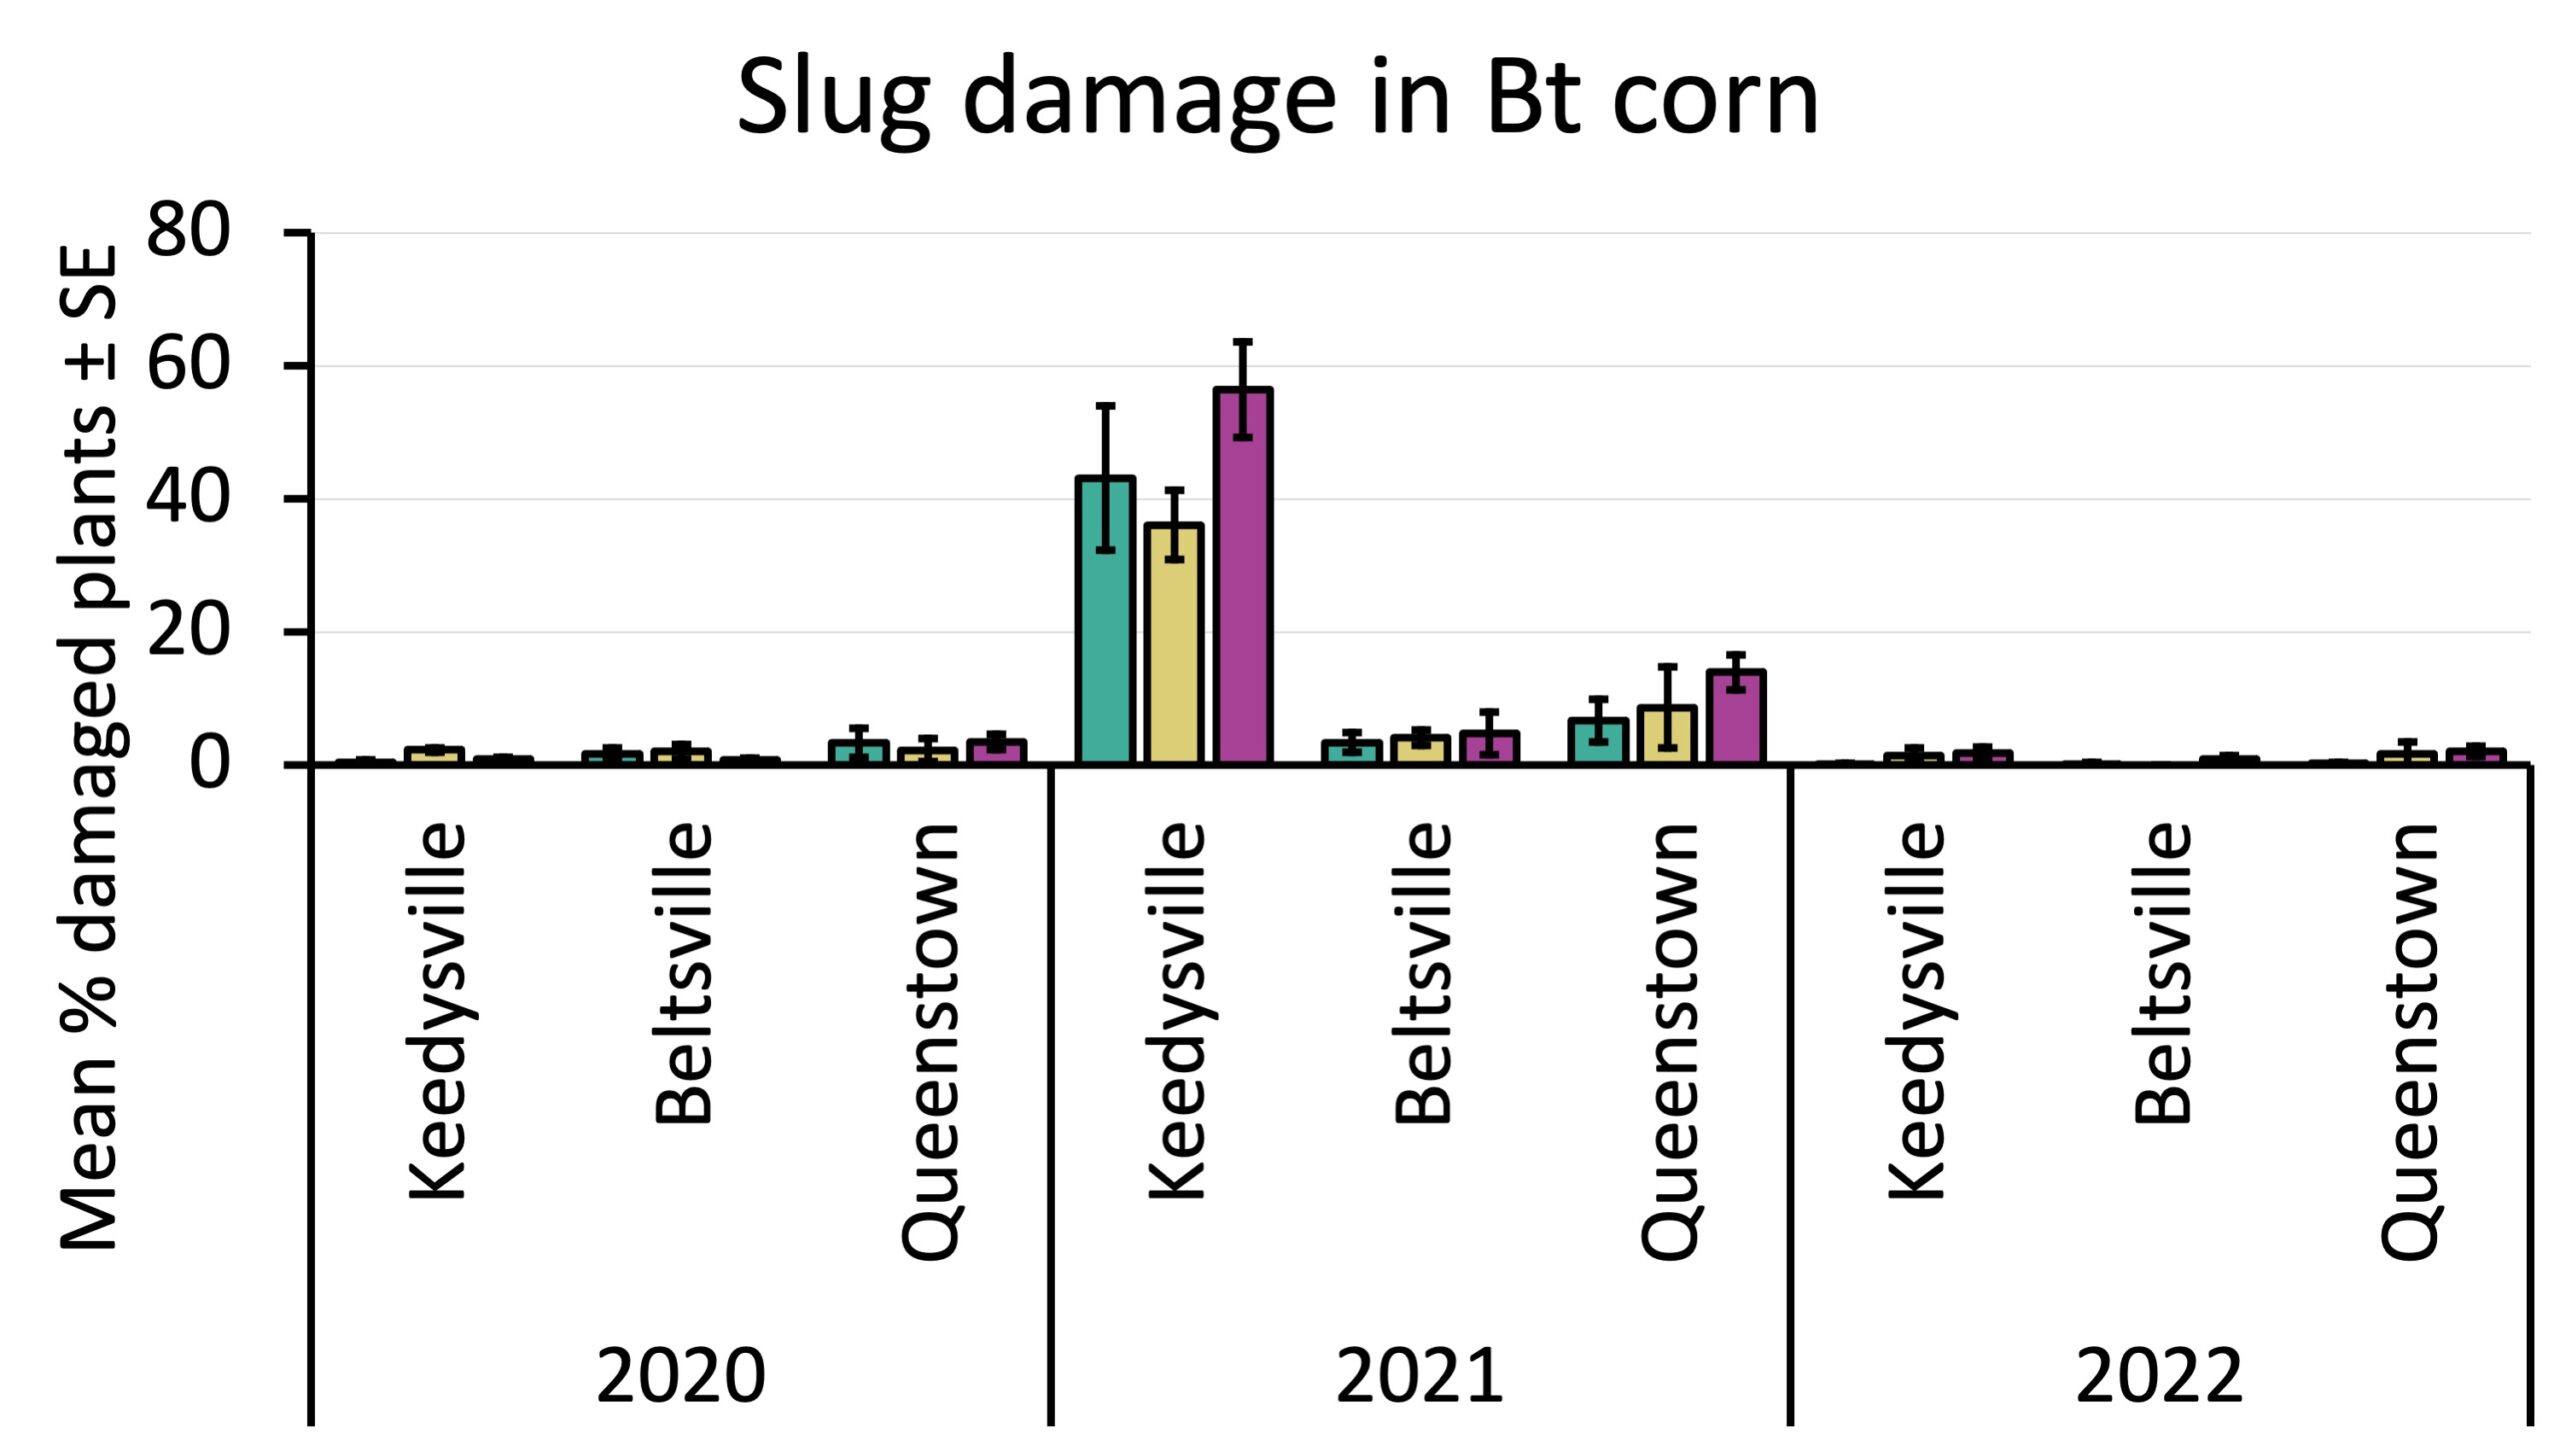
Slug activity abundance. There were no differences in slug abundance between the treatments (Figures 11 and 12). We saw greater weekly slug counts in 2021 than in 2020 or 2022 (Bt: 6.0 ± 0.8 versus 1.3 ± 0.2 and 0.8 ± 0.1, respectively. Non-Bt: 4.4 ± 0.5 versus 1.4 ± 0. 3 and 1.1 ± 0.1, respectively)), which matched observations by research farm staff and growers in Maryland. However, even under consistent slug pressure, treatments did not impact slug populations. As previously discussed, this may have been because of historic insecticide-use and suppression of predatory species, or predator mobility. Additionally, slug traps give a rough measurement of slug abundance and can be difficult to correlate with actual slug populations and crop damage. Still, we would have expected to see a difference between counts if treatments were having a biologically significant impact on predation.
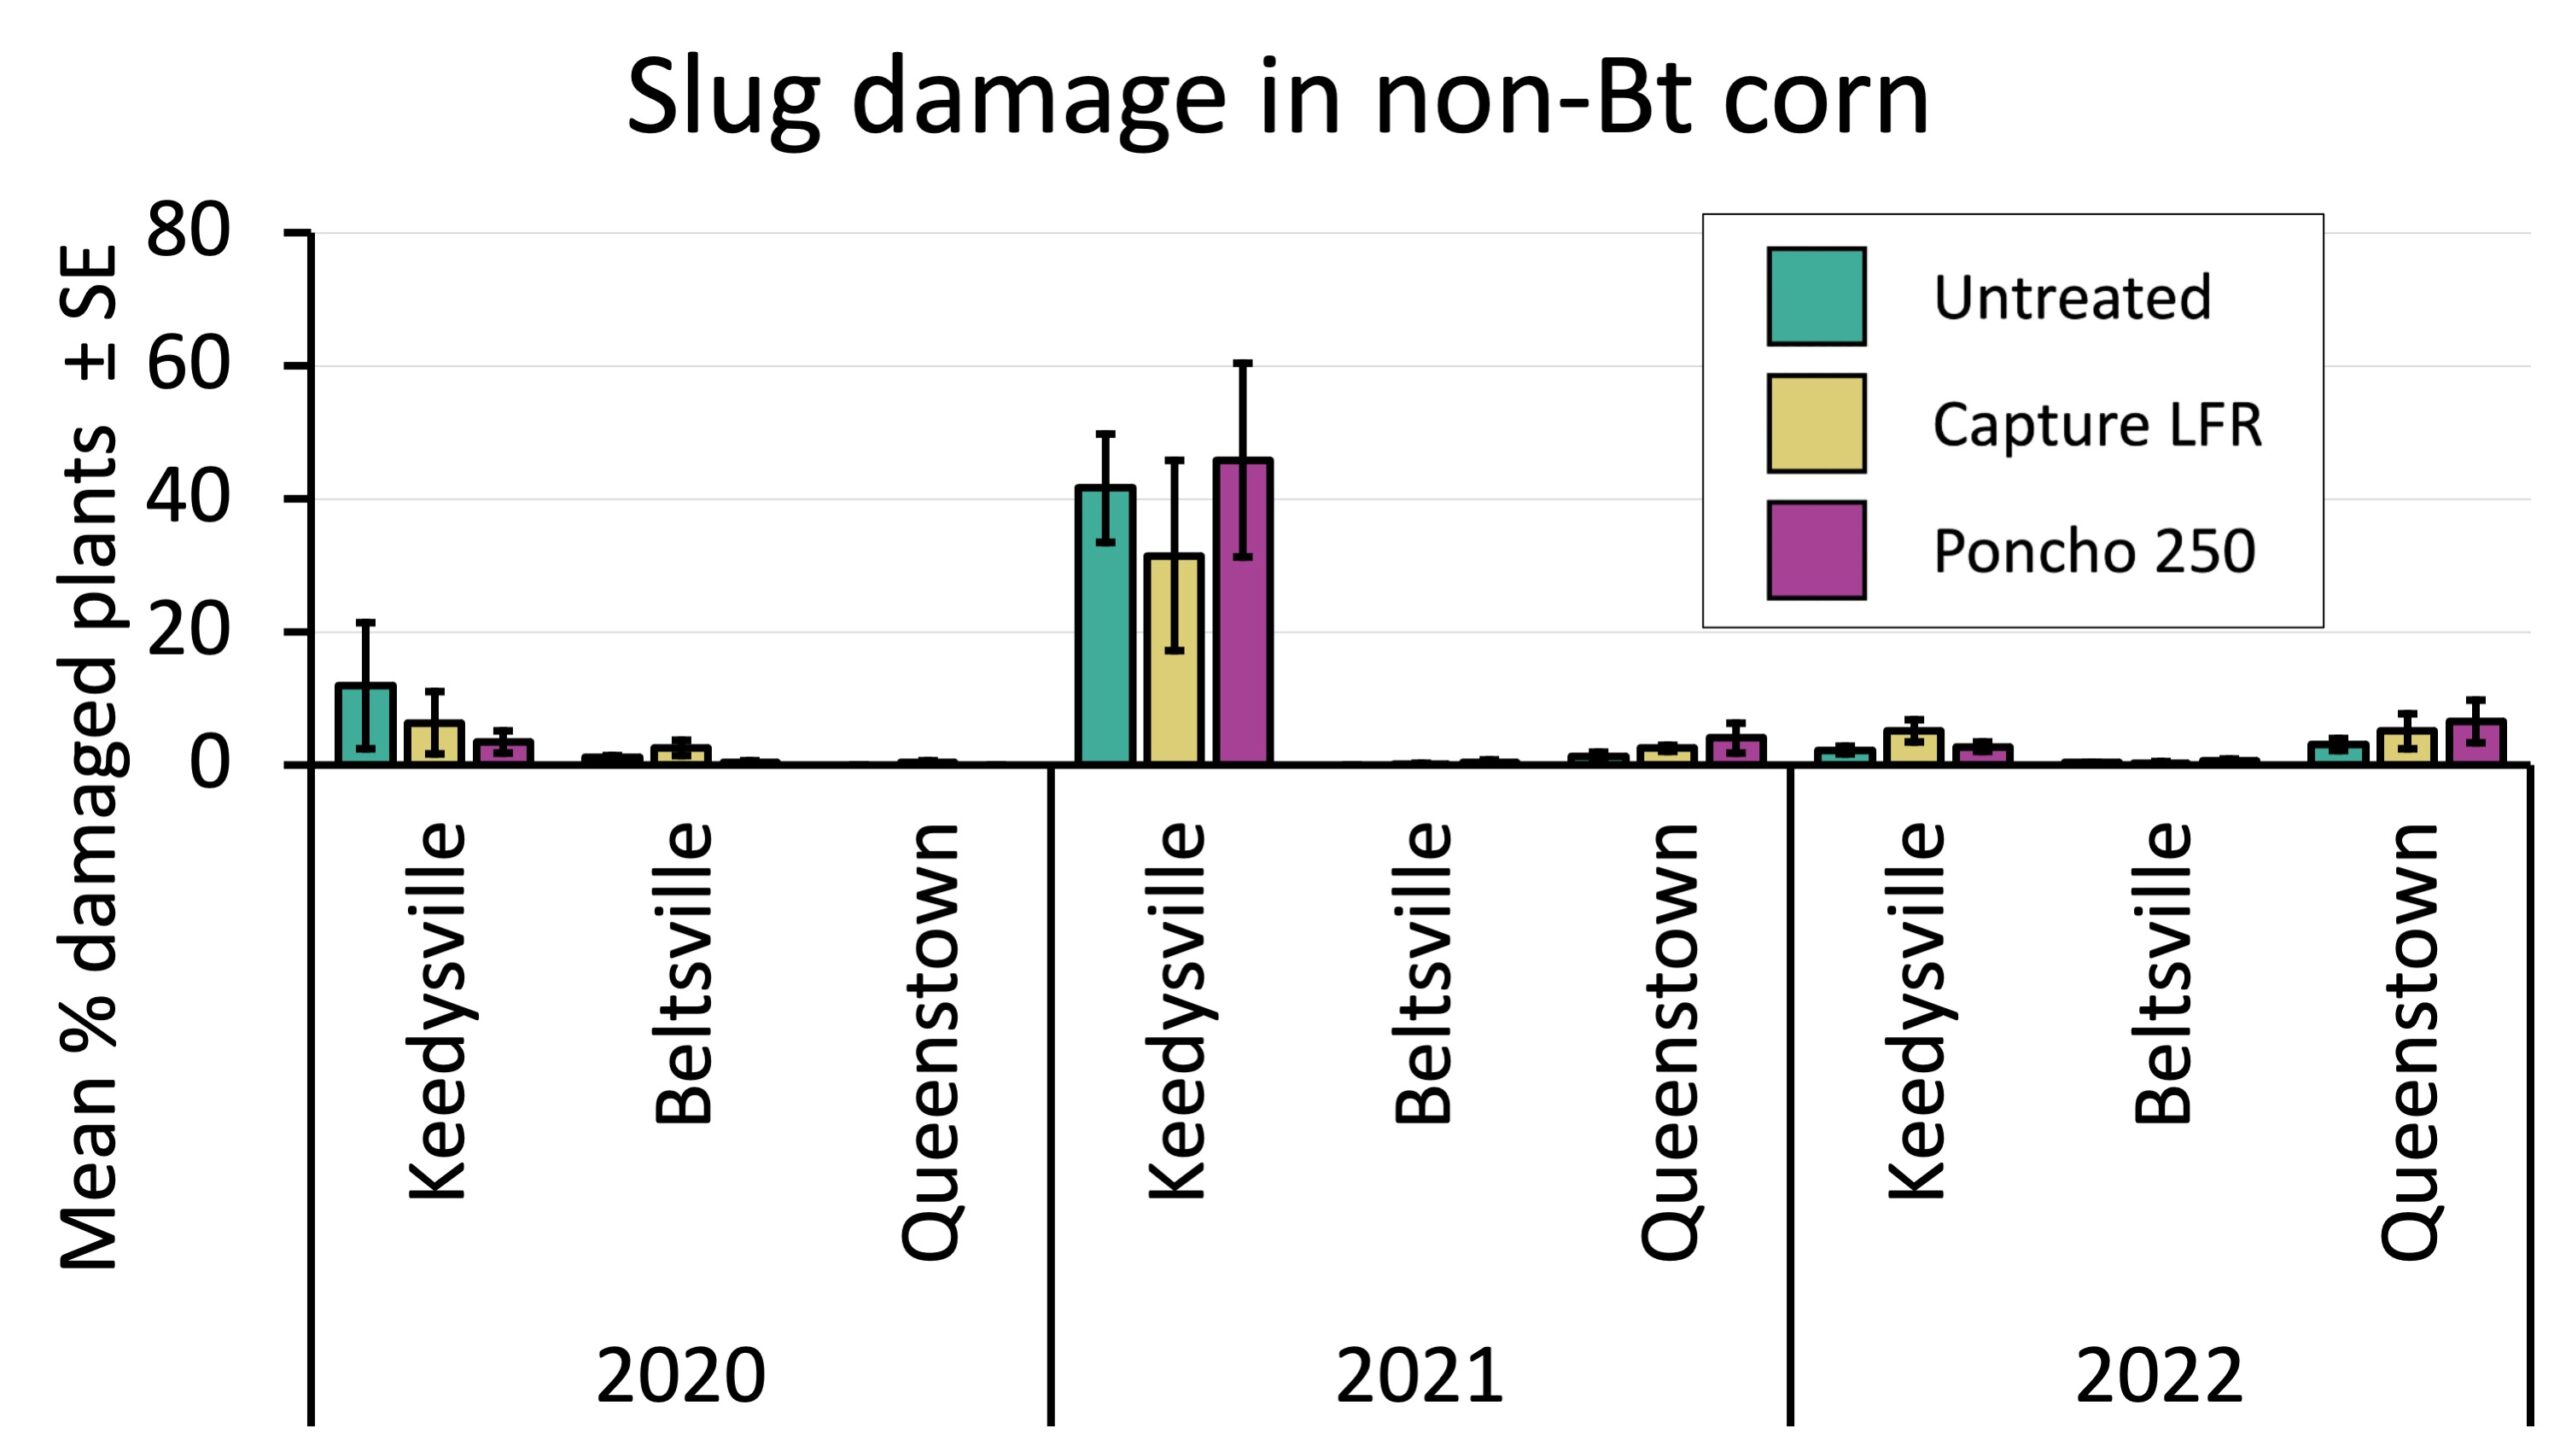
Slug damage. If treatments affected predator abundance and predation, we would expect to see more damage in the insecticide plots. However, treatments did not have a significant effect on the percent of plants with slug damage. This was likely because predator abundances and predation were similar across treatments. Slug damage tended to be low across years and locations except in 2021 at Keedysville (Figures 13 and 14). We saw a trend of greater damage in the Poncho treatment in 2021 Bt corn, which had the most consistent slug damage of the study (Figure 14), but it was not significant. This trend also did not carry over to other locations and years. Even where a high proportion of seedlings were damaged by slugs at Keedysville in 2021, we did not see an associated decrease in stand or yield. The area damaged per plant did not vary by treatment in either corn hybrid, and seedlings were able to outgrow the slug damage as the weather warmed, even when they appeared severely defoliated.
Objective 3. Determine the impacts of NSTs and in-furrow pyrethroids on yield and evaluate late season ear and stand damage in three Maryland growing regions using separate Bt and non-Bt corn fields.
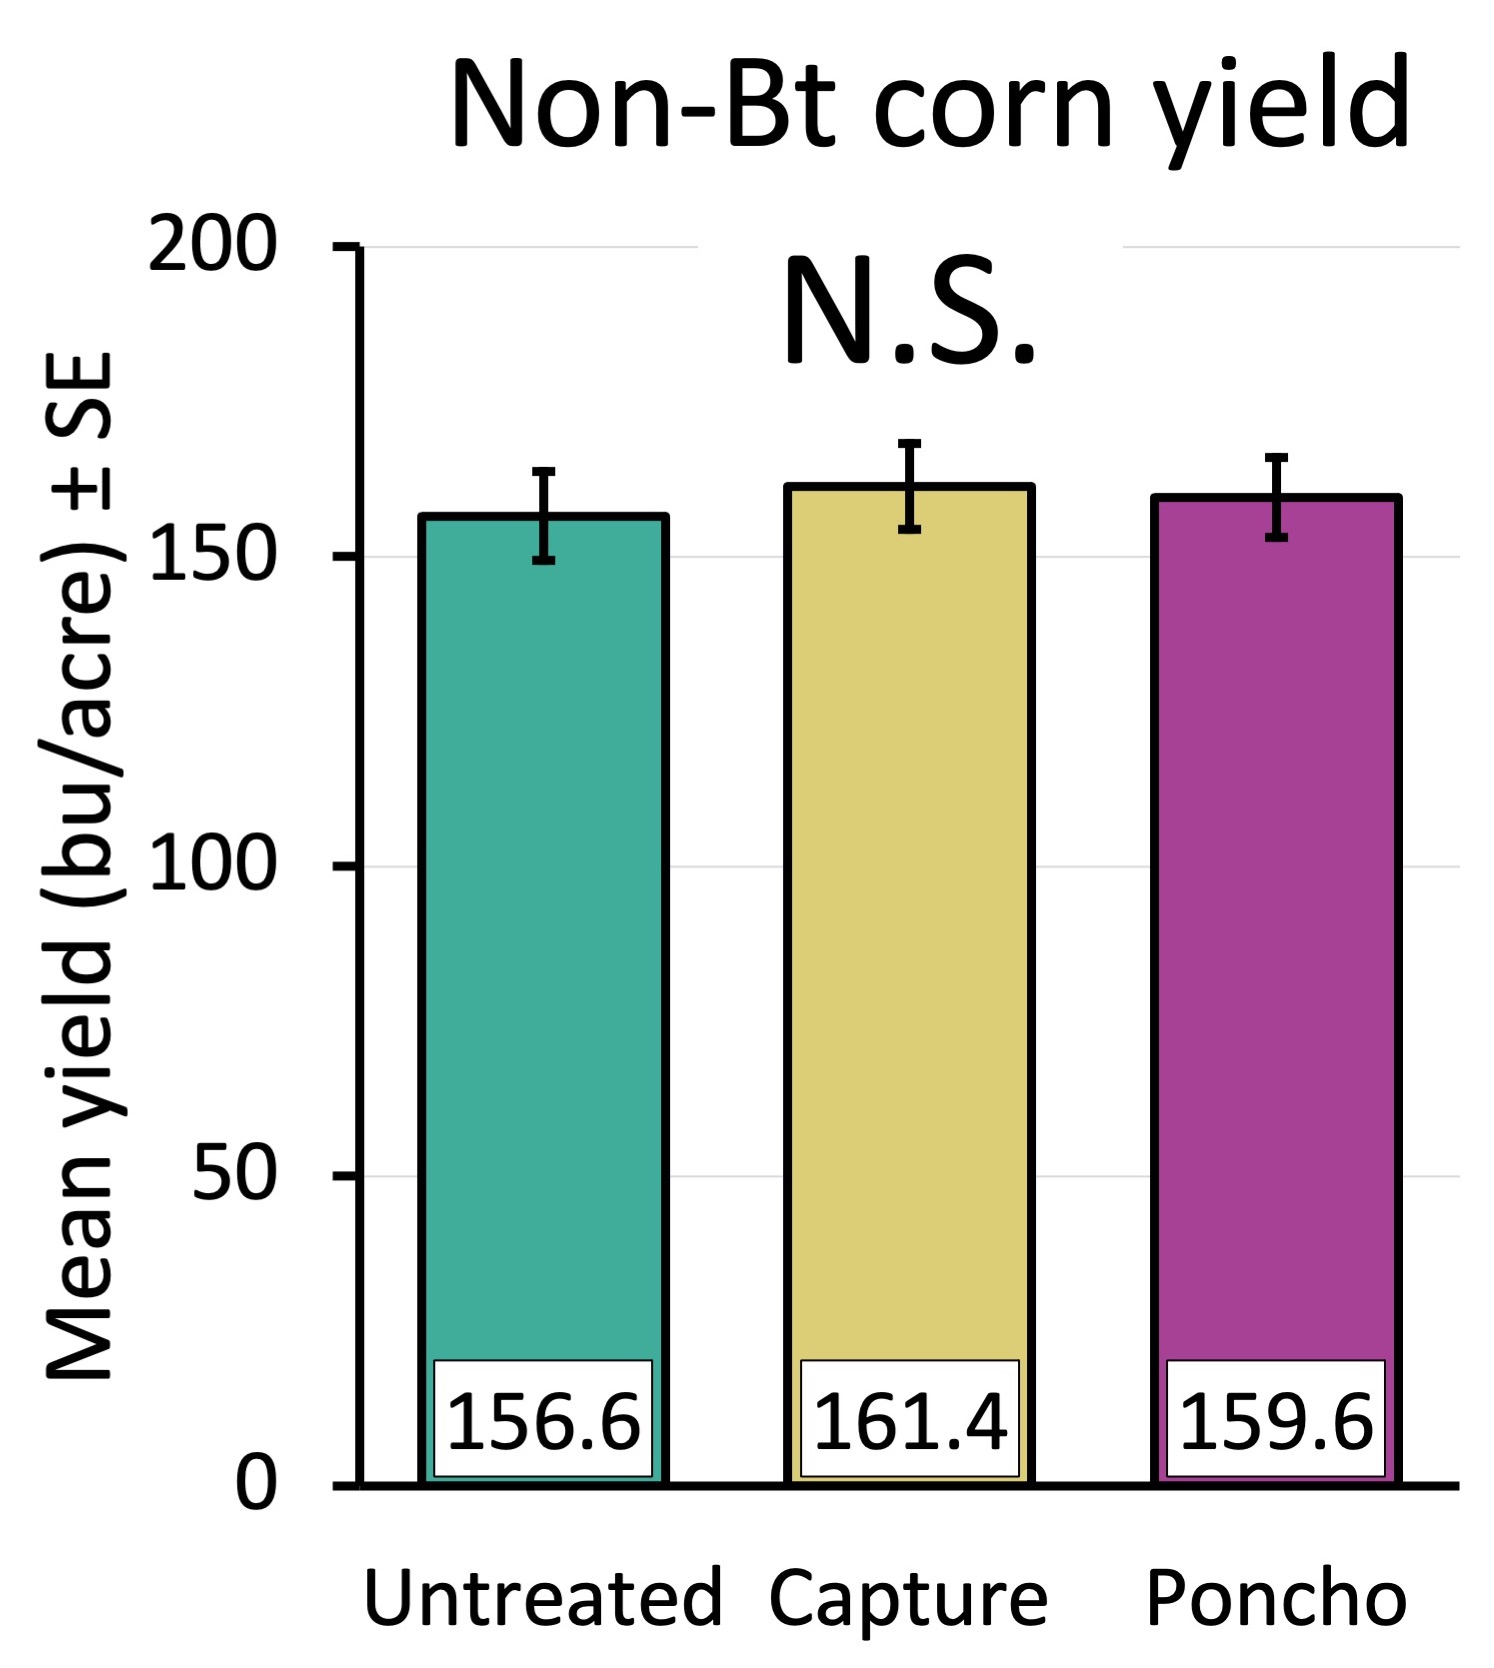
Non-Bt yield. Despite insecticide treatment having a significant effect on the percentage of plants with insect damage (Objective 1), this did not translate into yield benefits. Capture and Poncho did not have higher yields than the untreated control (Figure 15). This is likely because insect pests were often below-threshold (cutworm and armyworm, for example).
Non-Bt stalk pests. Early season seed and in-furrow treatments do not control pests after the first several weeks after planting and we saw no treatment differences in pest pressure. Despite the non-Bt hybrid having no in-plant protectant against caterpillars, there was almost no damage during R2 and the whorl stages. In 2020, fewer than 6% of plants had any caterpillar feeding, and the area never exceeded 1 cm2. In 2021and 2022, fewer than 0.5% of plants were damaged by caterpillars, and the amount of damage was minor.
Non-Bt ear pests. Similarly, early season products will not control ear pests, and we saw no treatment differences in the incidence or severity of ear damage. In all years, fewer than 25% of the ears had corn earworm (CEW) damage (Table 6). Beltsville had more ears damaged than the other farms all years. In the first two years, the area damaged by CEW was small (with a maximum of 1.3 cm2 damaged). In 2022, the area damaged by CEW was much higher (mean of 9 cm2 per ear); however, this may be because sampling was at a later maturity stage than in other years and caterpillars may have had more time to cause damage. The proportion of ears with stinkbug damage was higher in Queenstown than at other farms. At Queenstown in 2021 and 2022 the mean area damaged by stinkbugs was also high at 7.1 cm2 and 8.2 cm2, respectively. At other locations and other years, it was less that 3 cm2 per ear.
Table 6. Mean ± standard error corn earworm (CEW) and stinkbug ear damage in the conventional non-Bt hybrid P1197LR. 40 ears of corn were assessed per plot.
|
Year |
Treatment |
Mean % ears damaged by CEW |
Mean area (cm2) damaged by CEW |
Mean % ears damaged by stinkbug |
Mean area (cm2) damaged by stinkbug |
|
2020 |
Keedysville |
10.3 ± 2.2 |
0.6 ± 0.1 |
40.3 ± 3.3 |
1.9 ± 0.2 |
|
Beltsville |
18.1 ± 2.3 |
1.3 ± 0.4 |
43.6 ± 3.9 |
2.0 ± 0.3 |
|
|
Queenstown |
4.2 ± 0.9 |
0.4 ± 0.1 |
60.6 ± 3.3 |
2.8 ± 0.4 |
|
|
2021 |
Keedysville |
9.4 ± 2.3 |
0.2 ± 0.1 |
21.7 ± 2.7 |
0.3 ± 0.1 |
|
Beltsville |
20.3 ± 2.8 |
0.7 ± 0.1 |
26.9 ± 3.9 |
0.3 ± 0.1 |
|
|
Queenstown |
8.3 ± 1.6 |
0.5 ± 0.1 |
98.3 ± 0.9 |
7.1 ± 0.4 |
|
|
2022 |
Keedysville |
5.6 ± 0.6 |
1.6 ± 0.2 |
6.2 ± 0.8 |
0.8 ± 0.1 |
|
Beltsville |
20.8 ± 0.6 |
9.0 ± 0.4 |
1.9 ± 0.5 |
0.3 ± 0.1 |
|
|
Queenstown |
2.5 ± 0.3 |
0.7 ± 0.1 |
24.4 ± 0.2 |
8.2 ± 0.3 |
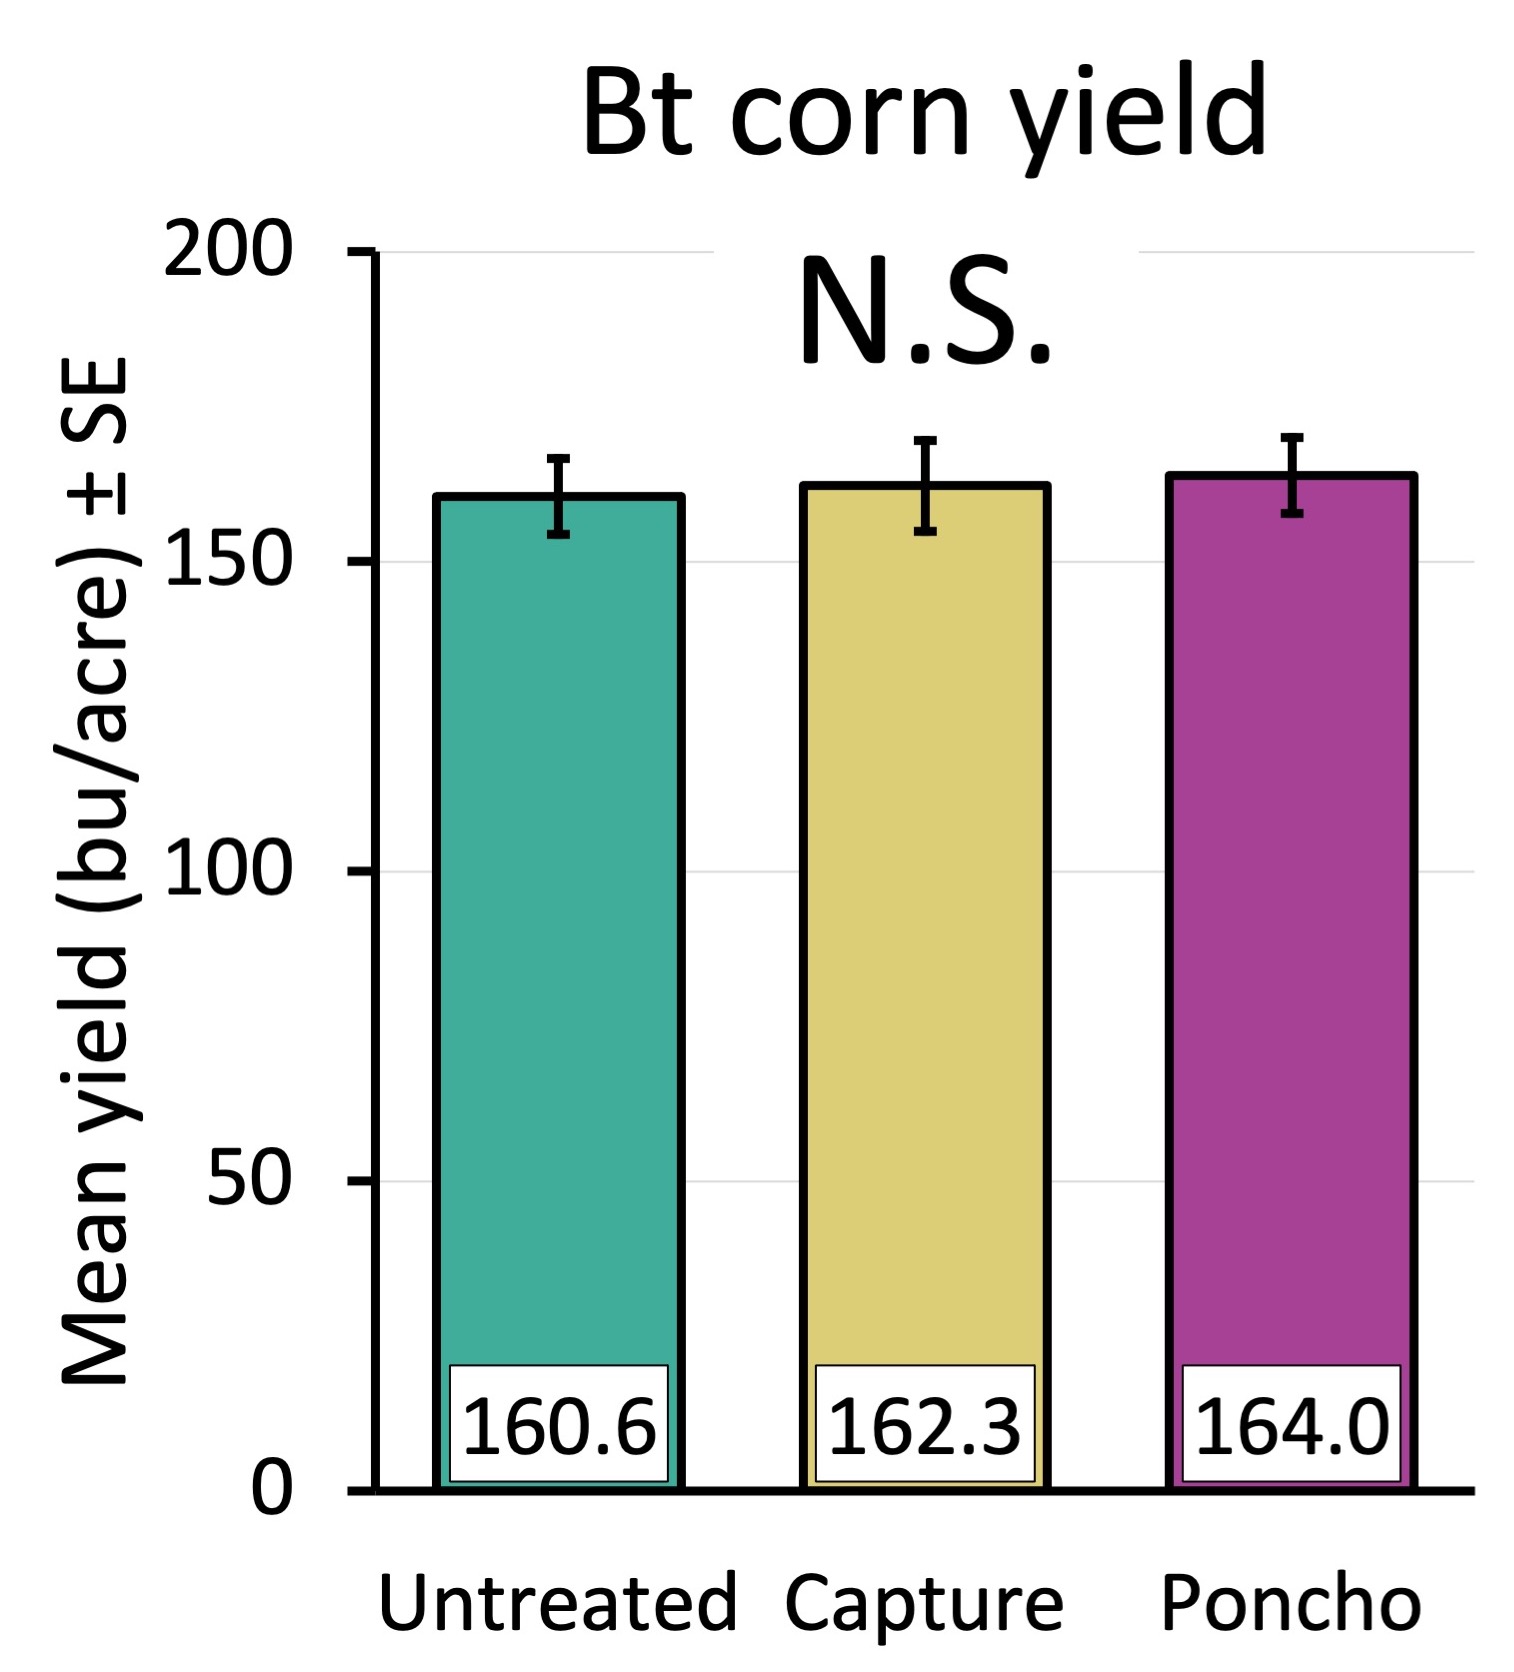
Bt yield. In Bt corn there were no yield differences between at-planting treatments in Bt corn across 2020 and 2021 (Figure 16). Again, this agreed with a lack of economically important early season pests, and the short window of efficacy that the at-planting treatments have. Given the significant difference in seedling stand between the untreated and Poncho (Objective 1), it shows that some level of stand reduction can be tolerated without yield losses.
Bt Stalk pests. Early season seed and in-furrow treatments do not control pests after the first several weeks after planting, and there were no treatment differences in whorl damage. Bt hybrids suppresses some stalk-boring caterpillar pests. In 2020, fewer than 3% of plants had caterpillar damage and there was almost no damage at all during the whorl stage in 2021 and 2022 (fewer than 0.5% of plants were damaged by caterpillars, and less than 2% by grasshoppers for all treatments in all locations). As with the non-Bt corn, severity was extremely minor, with only a few holes made in leaves and very little whorl-feeding or stalk-boring.
Bt ear pests. Treatments did not affect the incidence or severity of ear pests. In the ear stage, fewer than 20% of ears had any CEW feeding in any year (Table 7). As with the non-Bt corn, Beltsville had higher numbers of CEW-damaged ears. In 2020 and 2021, the area damaged tended to be low, with a mean of 2 cm2 and 0.5 cm2, respectively. There was greater damage in 2022 with almost 9 cm2 of CEW damage per ear. As with the non-Bt corn, this may have come from later than normal ear sampling. Queenstown had higher stink bug damage than the other locations, with about 41% of ears damaged in 2020, 72% in 2021, and 16% in 2022. The severity was low, however, with never more than 3 cm2 of kernels with signs of feeding.
Table 7 Mean ± standard error corn earworm (CEW) and stinkbug ear damage in hybrids LC1196 VT2P and P1197YHR over 2020 and 2021. 40 ears of corn were assessed per plot.
|
Year |
Treatment |
Mean % ears damaged by CEW |
Mean area (cm2) damaged by CEW |
Mean % ears damaged by stinkbug |
Mean area (cm2) damaged by stinkbug |
|
2020 |
Keedysville |
6.1 ± 1.2 |
0.3 ± 0.1 |
23.1 ± 3.8 |
0.6 ± 0.2 |
|
Beltsville |
16.9 ± 1.9 |
2.1 ± 0.2 |
10.0 ± 2.4 |
0.3 ± 0.1 |
|
|
Queenstown |
7.5 ± 1.6 |
0.6 ± 0.2 |
41.4 ± 3.4 |
1.3 ± 0.2 |
|
|
2021 |
Keedysville |
3.3 ± 1.0 |
0.1 ± 0.0 |
2.8 ± 0.9 |
0.0 ± 0.0 |
|
Beltsville |
16.1 ± 1.8 |
0.5 ± 0.1 |
3.6 ± 0.7 |
0.0 ± 0.0 |
|
|
Queenstown |
5.0 ± 1.4 |
0.2 ± 0.1 |
71.9 ± 4.9 |
2.4 ± 0.4 |
|
|
2022 |
Keedysville |
5.6 ± 0.7 |
2.1 ± 0.2 |
3.5 ± 0.5 |
0.4 ± 0.1 |
|
Beltsville |
19.0 ± 0.9 |
8.9 ± 0.4 |
1.1 ± 0.4 |
0.1 ± 0.1 |
|
|
Queenstown |
2.8 ± 0.5 |
0.6 ± 0.1 |
15.8 ± 1.1 |
2.8 ± 0.2 |
Objective 1 conclusions. Throughout this three-year study, the NST Poncho 250® consistently reduced the number of seedlings damaged by early season pests, while the in-furrow pyrethroid Capture LFR® only reduced the number of pests damaged in the non-Bt corn. However, in both Bt and non-Bt hybrids insect damage was very low, with only one site-year out of nine having notable soil pest pressure and no site-years having threshold-level caterpillar damage. Overall, Bt corn tended to have a slightly lower proportion of seedlings affected by lepidopteran pests, so, as expected, insecticides may be more redundant in Bt corn. However, there were no yield-limiting differences in either system. Although we did not consistently have soil pest pressure, soil pests can present a challenge to growers, because they require treatment for before or during planting. Our 2018-2019 study of soil pest control which was conducted in a field with known wireworm issues indicated that and NST or in-furrow pyrethroid could reduce yield-limiting soil pest damage, but that combining them does not provide any additional protection. This suggests that in cases with known soil pests, choosing one treatment is sufficient. In the case of sporadic pests, appropriately timed foliar insecticides are likely to be more effective than a prophylactic treatment. In general, if a field does not have a history of soil pests, our results suggest that prophylactic NST or in-furrow pyrethroid applications are probably not necessary for pest control in our region.
Objective 2 conclusions. It does not appear that the insecticides used in our study reduced slug predators and their activity or increased slug populations and damage. Natural enemy identification is ongoing, so it is possible that treatment effects on specific slug predators may emerge. Across site-years predator abundance and predation was fairly consistent, suggesting that these natural enemies are present and providing some level of biocontrol across Maryland farms. Because of this, it is possible that practices that enhance natural enemy populations may be beneficial for slug control here. It is important to keep in mind that natural enemies may be broadly suppressed by historical use of NSTs and in-furrow pyrethroids, and so differences between treatments may not emerge in a single growing season. Additionally, non-target effects from NSTs have been broadly demonstrated for a range of crops and insects, so even a lack of effect in this study should not be taken as a sign that there is no non-target risk.
Objective 3 conclusions. Throughout this three-year study, neither insecticide increased yield in Bt or non-Bt corn at any of our locations. This suggests that NSTs and in-furrow pyrethroids could be eliminated in many cases without yield loss. The at-planting insecticides also did not impact whorl or ear pest damage, which is expected from their window of efficacy. Bt toxins are effective against European corn borer, the key pest target of Bt hybrids and a main whorl, stalk, and ear pest, so widespread Bt corn adoption is likely keeping pressure low. The incidence and severity of ear pests varied by location, and corn earworm and stinkbugs were the main ear pests. Corn earworm damage was at similar levels in both Bt and non-Bt corn, which may have been the result of area-wide Bt adoption, or more likely, widespread resistance of corn earworm to the Bt toxins expressed in our Bt corn variety. These results suggest that at the moment, given pest suppression from Bt use, non-Bt corn may be grown with relatively few pest issues. It is important for growers to remember that pest problems do sporadically occur, and monitoring is important for avoiding unexpected losses. However, our results confirm that in the absence of a history of pest issues, most fields are not benefited from using prophylactic insecticides.
Education & outreach activities and participation summary
Participation summary:
The results from this project benefit Mid-Atlantic grain growers, extension specialists, and researchers by providing region-specific, science-based evidence to help choose at-planting insect management products. The results benefit both growers producing high-input genetically engineered corn hybrids with Bt traits and growers producing low-input non-Bt corn. In order to communicate information with each stakeholder group we are sharing and will continue to share results through a number of different channels.
Due to Covid-19, many of the usual avenues for communicating this research were not available at the beginning of the project. In 2020 and 2021 we presented results virtually at the Maryland Grain Producer’s Utilization Board January meeting. In July 2021 and 2022 we presented posters at the Commodity Classic, a large meeting for grain producers (typical audience of 300). Results from this study have also been incorporated into extension talks on pest management in grain crops, reaching a total audience of about 150 people. Results were included in the 2021 CMREC Upper Marlboro Roots in Research, an extension publication updating stakeholders on agricultural research at the University of Maryland. As we finalize slug predator ID and analysis, results will be also published in Agronomy News, a popular newsletter from UMD extension. This free publication reaches a readership of approximately 3,000 and serves as an easy-to-access reference for stakeholders. We will also continue to present to stakeholders at extension meetings and tours.
We have also been sharing the results of this study with scientific audiences, including researchers and extension specialists, through presentations at scientific conferences such as the annual national Entomological Society of America (ESA) meeting in 2020 and 2021, the annual Eastern Branch ESA meeting in 2021 and 2022, the Eastern Branch summer meeting in 2022, and a UMD departmental seminar in 2022. We are currently preparing the manuscript for a scientific article on this study. Presenting to scientific audiences adds to the growing body of research on how prophylactic insecticides impact insect pests and non-targets, and fosters collaboration and innovation with other researchers working on related projects.
Project Outcomes
By studying the effects of commonly-used prophylactic treatments, we are able to give growers information about how those products perform in the Mid-Atlantic. Because we found low pest pressure and no yield differences across site-years, we can recommend growers forgo at-planting insecticides where soil pests are not a consistent problem. We also showed that non-Bt hybrids can be grown without a serious increase in pest pressure. While these findings are influenced by agricultural practices like widespread Bt adoption, rotation, and weed management with herbicides, they show insecticides can be skipped in many cases. Avoiding unneeded insecticides can save money for growers, improve the image of agriculture, and reduce the environmental costs of farming. With the high prices of agricultural inputs at the moment, growers have already responded to our results with interest. Additionally, growing non-Bt corn without insecticides can open up profitable organic markets.
Although we have not found an effect of at-planting insecticides on slug predators and slugs so far, this project has given us the opportunity to talk to growers about sustainable slug management. Many growers are interested in ways to manage slug damage without using expensive molluscicides, and our results on the presence and activity of slug predators help growers understand biocontrol as an option.
One challenge in applying any research on NSTs is the difficulty for growers in sourcing untreated seed. As we continue to present to scientific audiences, growers, and educators, we hope our findings will lead to policy changes making it easier for growers to opt in or out of treatments, choose their own products and rates, and understand the associated costs.
This project required me to conduct an extensive field study for three years, managing a team of technicians and adapting to weather, the schedules of the research farms, and a global pandemic. While I gained many indispensable skills in sampling techniques, experimental design, and statistical analysis, I think the most valuable thing I learned was how to manage a large project, especially with the amount of planning and scheduling that had to take place. I was also helped out on countless occasions by other members of my lab, teaching me the value of teamwork and paying help forward. These are all lessons I can take forward into other studies. I feel like this research trained me to be an effective field researcher.
I am passionate about IPM research and extension, and this project has helped focus my interest and advance my career. As I continue my doctoral research I will build on aspects of this study, digging into the behavior of slugs and their predators. After earning my doctorate, I hope to work in agricultural extension where I can address grower concerns and make the latest advances in IPM accessible. Working on this study has given me opportunities in grant management and extension to stakeholders that will help me move onto these next career steps.
We hypothesized that there might be a mismatch between the pest-management approaches Mid-Atlantic growers take at planting and the actual pest pressure occurring. This proved to be true, illustrating how pest management strategies driven by the corn belt are not necessarily the best for our area. At the same time, our personal communication with local agronomic growers has showed that they are interested in saving money as input costs, including insecticides, rise. For these reasons, it is important to keep doing research that evaluates current and upcoming pest management approaches, many of which come from recommendations for other areas or even from chemical companies. Surveys to establish baselines of pest pressure in Maryland and trials that compare preventative treatments to controls are key for better insecticide-use. Continuing this type of work in additional corn growth stages and more crops a will give MidAtlantic growers specific information which they are eager for.