Final report for GNE20-232
Project Information
The Pseudomonas syringae species complex (PSSC) has been co-evolving with plants since before the emergence of angiosperms, and has diversified into one of the most economically important groups of plant pathogens in the world, with a collective host range spanning almost every major food crop grown today. Critically, while there are many pathogens within PSSC, there is also a wide range of virulence exhibited throughout the species complex, including several non-pathogenic plant epiphytes. The ability to discriminate between lineages predict potential pathogenicity of novel lineages is crucial for preventing epidemic outbreaks, detecting emerging pathogenic strains, and untangling correlations between virulence factors carried by a pathogen, its host range and its virulence. Although the efforts to catalog the diversity of the PSSC and to understand the molecular determinants of disease caused by it have yielded great insights into their ecology and behavior, currently there is no efficient way to leverage these insights to predict the identity and pathogenicity of newly discovered PSSC strains. Here, I 1) investigated the potential for leveraging publicly available data combined with existing single amplicon PCR assays to improve phylogenetic resolution in classification models, 2) hypothesized that increased resolution would lead to the ability to predict virulence-associated gene content of unknown PSSC isolates, and 3) sought to develop an online tool for PSSC researchers to quickly characterize PSSC isolates using single amplicon sequencing data.
The research approach involved performing in-silico tests of 16 PSSC primer sets against over 2,000 PSSC genomes deposited in GenBank, developing naive Bayes classification models for the best performing primer sets, and assessing the performance of each classification model. Nine classification models were built, each capable of classifying unknown isolates into genomic clusters sharing a mean average nucleotide identity (ANI) of 97-98%. This resolution often provides sub-phylogroup classification, and was sufficient to allow prediction of the absence/presence of 77 type III effector protein subfamilies with 80-94% accuracy. With the development of improved classification models over the current methodology, and a demonstrated potential for prediction of important virulence factors from single amplicon data, I developed an online portal for rapid analysis of PCR amplicon data, hosted at syringae.org, allowing researchers to upload amplicon data to obtain phylogenetic and function characterization of their isolates, and explore the results with an interactive dashboard.
The main impact of this research is to greatly improve the amount of actionable information obtained from cost-effective single amplicon sequencing of PSSC isolates, allowing researchers to investigate the pathogenic potential of newly isolated strains more efficiently. As future research clarifies the roles of virulence factors carried by plant pathogens as determinants of host range and severity of disease, this work might provide a means to rapidly predict host range and disease outcomes of PSSC pathogens
In this project, I proposed to develop a classification tool for researchers to detect and monitor a broad range of PSSC lineages associated with disease in food crops, and investigate the potential for single amplicon data to be used to predict virulence-associated genes carried by newly isolated PSSC strains.
The specific objectives of my proposal are:
- Assess the performance of 16 PCR primer sets commonly used to identify PSSC isolates. Expected outcomes: Some primer sets would allow for more consistent amplification throughout the species complex, and some amplicons generated by the primer sets would allow for greater classification resolution due to having greater sequence variability.
- Build classification models for the best performing primer sets. Expected outcomes: At least one classification model would allow for phylogenetic classification beyond the phylogroup level, and that this classification level would allow for accurate prediction of gene content that is correlated with pathogenicity traits such as host range and virulence.
- Develop a software pipeline and online application to predict identities and virulence factors carried by unknown isolates detected through PCR-based assay. Expected outcome: This objective will provide extension faculty and plant pathologists with a simple, accurate approach for analyzing the data obtained from PCR-amplification with currently used primers. The output of the pipeline will include most probable identities of unique lineages detected as well as summaries of suspected virulence factors carried by the unknown isolate based on closely related reference strains.
The expected outcome for all three objectives together was to provide a diagnostic tool for extension faculty and epidemiologists to characterize PSSC isolates efficiently and accurately.
The Pseudomonas syringae species complex (PSSC) consists of many closely related plant pathogens 1. With host ranges and symptomology that can overlap, proper identification of isolates can be difficult 2. Aside from whole genome sequencing, which is costly and often impractical for routine identification, marker gene sequencing is the most effective method for specific and sub-specific classification of unknown PSSC isolates 3–5. This method has been used to aid in the identification of new pathogenic species and expand our view of host range in known pathogens 6–8, highlighting the importance of amplicon sequencing for broadening our understanding of the species complex. However, although there have been many proposed PCR primer sets designed to amplify broadly within the species complex, there are open questions about the relative performance of each. Specifically, it’s not clear if all primers allow for reliable amplification for all phylogroups in the species complex, or which primer sets allow for the greatest classification resolution. Further, while a primary goal of pathogen identification is often to predict pathogenic potential of the unknown isolate, it isn’t known if the classification resolution obtained by any of the currently published primers is sufficient to predict genomic features associated with host range and virulence.
- Sarkar, S. F. & Guttman, D. S. Evolution of the Core Genome of Pseudomonas syringae, a Highly Clonal, Endemic Plant Pathogen. Appl. Environ. Microbiol. 70, 1999–2012 (2004).
- Morris, C. E., Lamichhane, J. R., Nikolić, I., Stanković, S. & Moury, B. The overlapping continuum of host range among strains in the Pseudomonas syringae complex. Phytopathol. Res. 1, 4 (2019).
- Borschinger, B. et al. A set of PCRs for rapid identification and characterization of Pseudomonas syringae phylogroups. J. Appl. Microbiol. 120, 714–723 (2016).
- Guilbaud, C., Morris, C. E., Barakat, M., Ortet, P. & Berge, O. Isolation and identification of Pseudomonas syringae facilitated by a PCR targeting the whole P. syringae group. FEMS Microbiol. Ecol. 92, 146 (2016).
- Berge, O. et al. A User’s Guide to a Data Base of the Diversity of Pseudomonas syringae and Its Application to Classifying Strains in This Phylogenetic Complex. PLoS One 9, e105547 (2014).
- Dutta, B., Gitaitis, R., Agarwal, G., Coutinho, T. & Langston, D. Pseudomonas coronafaciens sp. nov., a new phytobacterial species diverse from Pseudomonas syringae. PLoS One 13, (2018).
- Keshtkar, A. R., Khodakaramian, G. & Rouhrazi, K. Isolation and characterization of Pseudomonas syringae pv. syringae which induce leaf spot on walnut. Eur. J. Plant Pathol. 2016 1464 146, 837–846 (2016).
- Moretti, C., Fakhr, R. & Buonaurio, R. Calendula officinalis: A New Natural Host of Pseudomonas viridiflava in Italy. https://doi.org/10.1094/PDIS-08-11-0691 96, 285–285 (2012).
Research
Genome collection, validation, and phylogroup assignment
2,467 Genomes labeled as belonging to the Pseudomonas syringae group were obtained from the RefSeq database from NCBI in November 2021. Genomes were checked for completeness and assembly quality with BUSCO v 5.3.2 using default settings and the pseudomonadales_odb10 lineage. Genomes scoring > 99 made up the final dataset used for assessing primers. As the majority of genomes used were not assigned to a phylogroup, phylogroups were assigned based on average nucleotide identity (ANI) with phylogroup reference genomes produced by (Berge et al. 2014). While Berge et al. suggest taking a simple nearest neighbor approach to assigning phylogroup, 173 genomes within our dataset shared less than 95% ANI with any phylogroup reference genome, indicating that they were either misclassified at the time of depositing into GenBank as belonging to PSSC, or that they might represent new phylogroups. As a result, these genomes were left unassigned to a phylogroup. Eventually a curated set of 2,161 genomes was used, with 1,988 assigned to a phylogroup.
Assigning phylogroups to genomes
Phylogroup assignment of each genome was based on ANI shared with previously classified reference strains representing Phylogroups 1a,1b,2a,2b,2c,2d,3,4,5,6,7,9,10,11, and 13 (Berge et al., 2014). Reference strains for phylogroups 8 and 12 were not found among the 2,161 genomes characterized by SYRINGAE, either due to either not being represented in the GenBank database, or not making it past the BUSCO quality check described above.
A genome was assigned to a given phylogroup if it was the most closely related to the reference strain for that phylogroup, based on ANI. To minimize inaccurate phylogroup assignments, any genome sharing less than 95% ANI to any reference strain was left unassigned.
In-silico PCR
In-silico PCR was performed with in_silico_PCR (Ozer 2020) allowing for one mismatch per primer. The identity of amplicons was confirmed by visually inspecting multiple sequence alignments performed with MAFFT, using Geneious 2019.1.3 (https://www.geneious.com). The amplification rate reported is the percentage of the 2,161 genomes that resulted in successful amplification of the target gene fragment.
Correlation of amplicon sequence similarity with ANI
Pairwise ANI values for all genomes were computed with fastANI v1.33 (Jain et al. 2018). For each primer set with amplification rate greater than 50%, amplicon sequences were aligned using MAFFT version 7 (Katoh and Standley 2013) with the options ‘globalpair’ and a ‘maxiterate’ of 1000. For amplicon sequence similarity, pairwise hamming distances for the aligned sequences were then computed with the ‘DistanceMatrix’ function in the R package DECIPHER (Wright 2015). To quantify the correlation between amplicon sequence distances and ANI of the source genomes, the mean squared deviation of amplicon sequence similarity from ANI was computed as the sum of squared distances between the two values for each genome pair. As ‘DistanceMatrix’ reports distance in the range of 0-1, ANI values were normalized to the same range by dividing by 100.
training Naïve Bayes classifiers
Using QIIME2’s v2022.2 feature-classifier (Bolyen et al. 2019), naïve Bayes classifiers were trained on the unaligned in-silico amplicon sequences generated above. Primer sequences were left untrimmed from amplicons. Classification models require taxonomic descriptions of known genomes for training, however, nomenclature in PSSC is largely inconsistent (Gomila et al. 2017), which can significantly reduce the predictive power of classification models. We therefore implemented instead a strict hierarchical taxonomy based on ANI, generated by the hierarchical the clustering algorithm utilized by LINbase (Tian et al., 2020). Briefly, a randomly selected genome in the set is assigned to clusters representing twenty ANI values from 80-99%, each given a numeric signature of ‘0’. All other genomes are iteratively assigned to clusters based on the closest already-assigned genome, and given the same numeric signature for all ANI values up to the point which the two genomes differ, wherein the numeric signature is iterated (e.g. if genome #2 shares 97.5% ANI with genome #1, genome #2 will be assigned to cluster ‘0’ along with genome #1 for all ANI values except 98%, where it will be assigned a numeric signature of ‘1’). The resulting taxonomy file consisting of twenty taxonomic levels representing ANI values from 80-99%.
Type III effector protein screening
Reference sequences for T3E subfamilies included in the Pseudomonas syringae type III effector compendium (PsyTEC) (Laflamme et al. 2020) were aligned using MAFFT with default settings, and the alignments input into the HMMER v3.1b2 (hmmer.org) function HMMbuild to generate HMM profiles. Using HMMsearch, these 77 HMMs were run on the set of 2,161 genomes and an e-value of 10-20 was used as the threshold for considering a subfamily to be present in a genome.
Prediction of Type III effector protein subfamilies
For each genome, T3E predictions were made based on genomic clusters at the 98% ANI level, with final prediction of gene absence/presence was determined by simple majority within the cluster.
References
Berge, Odile, Caroline L. Monteil, Claudia Bartoli, Charlotte Chandeysson, Caroline Guilbaud, David C. Sands, and Cindy E. Morris. 2014. “A User’s Guide to a Data Base of the Diversity of Pseudomonas Syringae and Its Application to Classifying Strains in This Phylogenetic Complex.” PLOS ONE 9 (9): e105547. https://doi.org/10.1371/JOURNAL.PONE.0105547.
Bolyen, Evan, Jai Ram Rideout, Matthew R. Dillon, Nicholas A. Bokulich, Christian C. Abnet, Gabriel A. Al-Ghalith, Harriet Alexander, et al. 2019. “Reproducible, Interactive, Scalable and Extensible Microbiome Data Science Using QIIME 2.” Nature Biotechnology 37 (8): 852–57. https://doi.org/10.1038/S41587-019-0209-9.
Gomila, Margarita, Antonio Busquets, Magdalena Mulet, Elena García-Valdés, and Jorge Lalucat. 2017. “Clarification of Taxonomic Status within the Pseudomonas Syringae Species Group Based on a Phylogenomic Analysis.” Frontiers in Microbiology 8 (DEC): 2422. https://doi.org/10.3389/FMICB.2017.02422/BIBTEX.
Jain, Chirag, Luis M. Rodriguez-R, Adam M. Phillippy, Konstantinos T. Konstantinidis, and Srinivas Aluru. 2018. “High Throughput ANI Analysis of 90K Prokaryotic Genomes Reveals Clear Species Boundaries.” Nature Communications 2018 9:1 9 (1): 1–8. https://doi.org/10.1038/s41467-018-07641-9.
Katoh, Kazutaka, and Daron M. Standley. 2013. “MAFFT Multiple Sequence Alignment Software Version 7: Improvements in Performance and Usability.” Molecular Biology and Evolution 30 (4): 772–80. https://doi.org/10.1093/MOLBEV/MST010.
Laflamme, Bradley, Marcus M. Dillon, Alexandre Martel, Renan N.D. Almeida, Darrell Desveaux, and David S. Guttman. 2020. “The Pan-Genome Effector-Triggered Immunity Landscape of a Host-Pathogen Interaction.” Science (New York, N.Y.) 367 (6479): 763–68. https://doi.org/10.1126/SCIENCE.AAX4079.
Ozer, Egon A. 2020. “In_silico_pcr.” https://doi.org/10.5281/zenodo.7114609.
Wright, Erik S. 2015. “DECIPHER: Harnessing Local Sequence Context to Improve Protein Multiple Sequence Alignment.” BMC Bioinformatics 16 (1): 1–14. https://doi.org/10.1186/S12859-015-0749-Z/FIGURES/6.
1. Assess the performance of 16 PCR primer sets commonly used to identify PSSC isolates.
Primer choice significantly impacts amplification rate
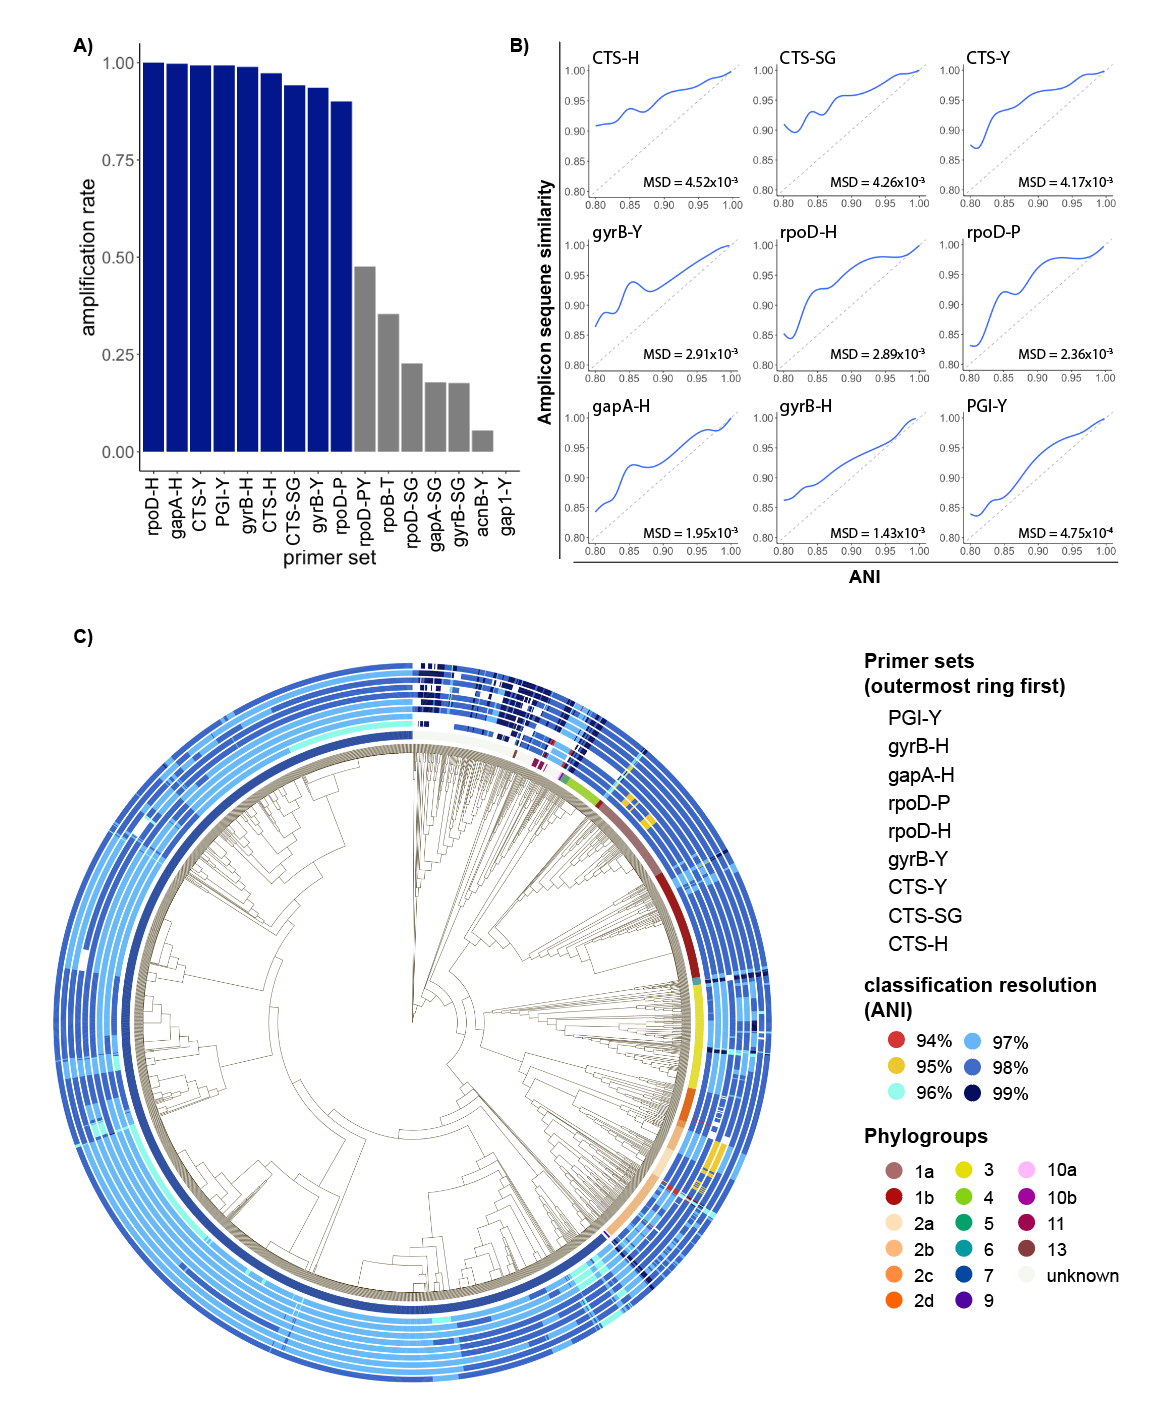
As all primers used in this study were designed to work broadly on strains within the species complex, we first tested amplification rate of each primer set. Surprisingly, when tested on a comprehensive set of genomes representing the full known diversity of PSSC, 7/16 primer sets tested had an amplification rate of less than 50% (Fig 1a). These primers were removed from any further tests. For the remaining 9 primers, performance was substantially better, with amplification rates ranging from 91.37% (rpoD-P) to 100% (rpoD-H). These large differences in amplification rate are likely due to the significant degeneracy built into the best performing primer sets and highlights the importance of considering the known diversity of PSSC when designing primers.
Marker genes exhibit differences in conservation within PSSC
When choosing a marker gene, or region of a marker gene, to use for identification purposes, an important consideration is the level of conservation found within the region, as regions that are too conserved result in reduced taxonomic resolution. To investigate the amount of conservation found within amplicons generated by each primer set, we compared pairwise amplicon similarity (represented by their Jaccard index) with ANI of the genomes from which the amplicons were derived (Fig 1b). Of the primers tested, amplicons from citrate synthase showed the highest level of conservation, indicating they might not provide the best resolution when used for classification contrary to previous suggestions. On the other hand, amplicons generated by PGI-Y, targeting phosphoglucose isomerase, exhibited a mean squared deviation from ANI almost 10 times lower than any primer targeting CTS (Fig 1b), indicating a very good congruence between the diversity at this locus and the one retrieved at the genome level.
2. Build classification models for the best performing primer sets.
Classification resolution varies with phylogroup and primer choice
To compare performance of primers in classifying individual strains throughout PSSC, classification models were trained on amplicons generated by each primer set, and then used to classify each strain in the training set. The relative performance of the classification models mirrored the amount of conservation observed above (fig 1b), although the practical differences in classification resolution were minimal. Remarkably, every primer set allowed for classification beyond phylogroup level, with mean ANI of predicted clades ranging from 97.22% (CTS-H, CTS-Y & CTS-SG) to 97.93% (PGI-Y). Surprisingly, while the CTS gene has been suggested to be a particularly informative marker gene for PSSC, the three primers targeting this gene performed slightly below the other primers tested. While mean performance of classification models suggest PGI-Y as the best primer set, it doesn’t consider biases in the representation of each phylogroup in our dataset, and so we sought to analyze any discrepancies in primer performance among phylogroups (Fig 1c). We found that overall, PGI-Y, gyrB-H, and gapA-H to be the most informative primer sets.
Amplicon sequencing allows for prediction of type III effector protein repertoires
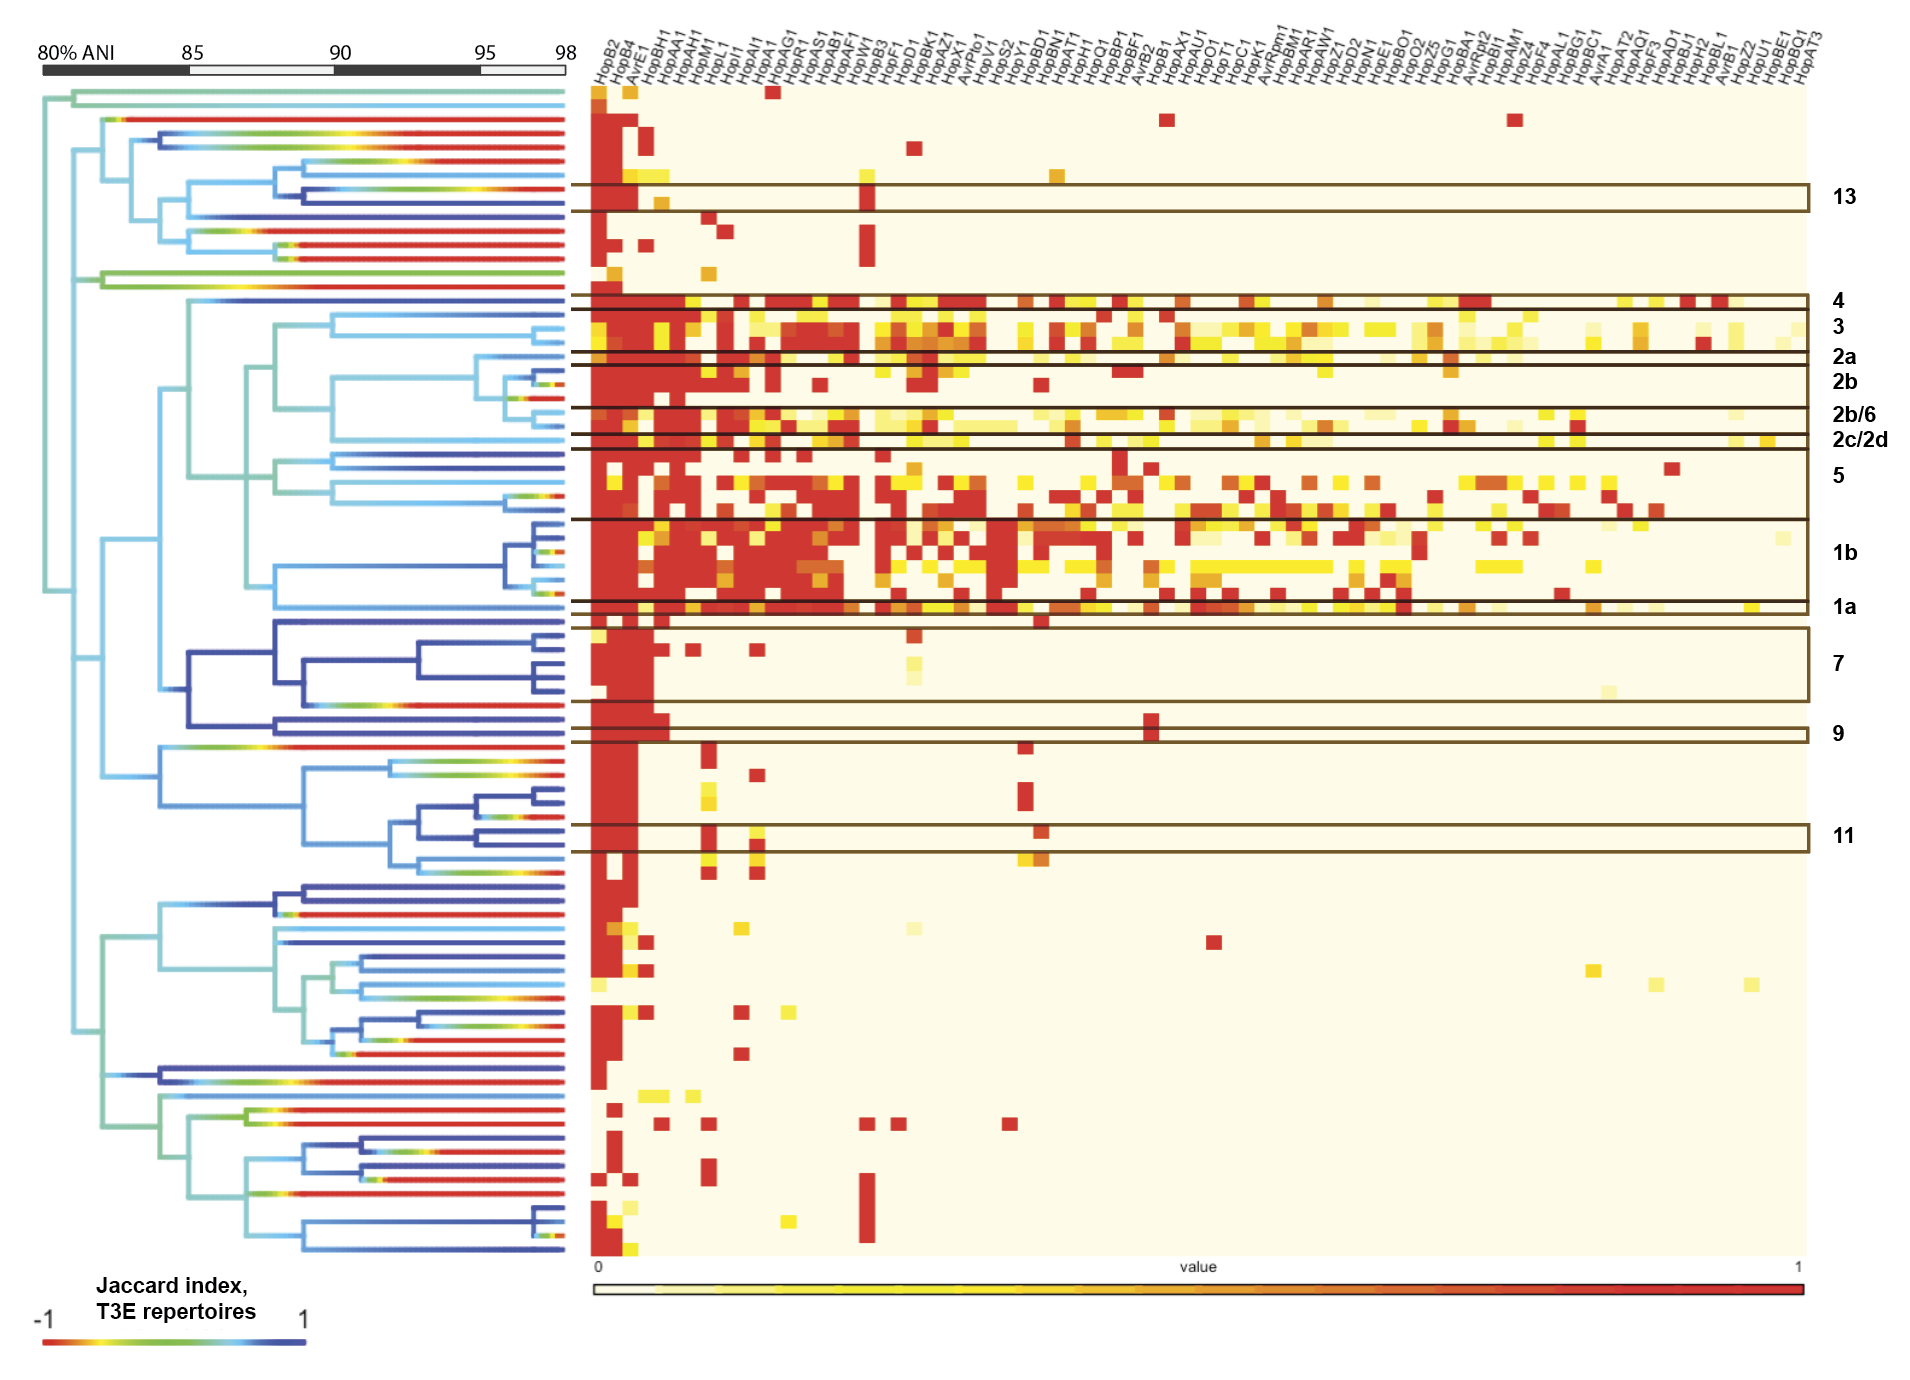
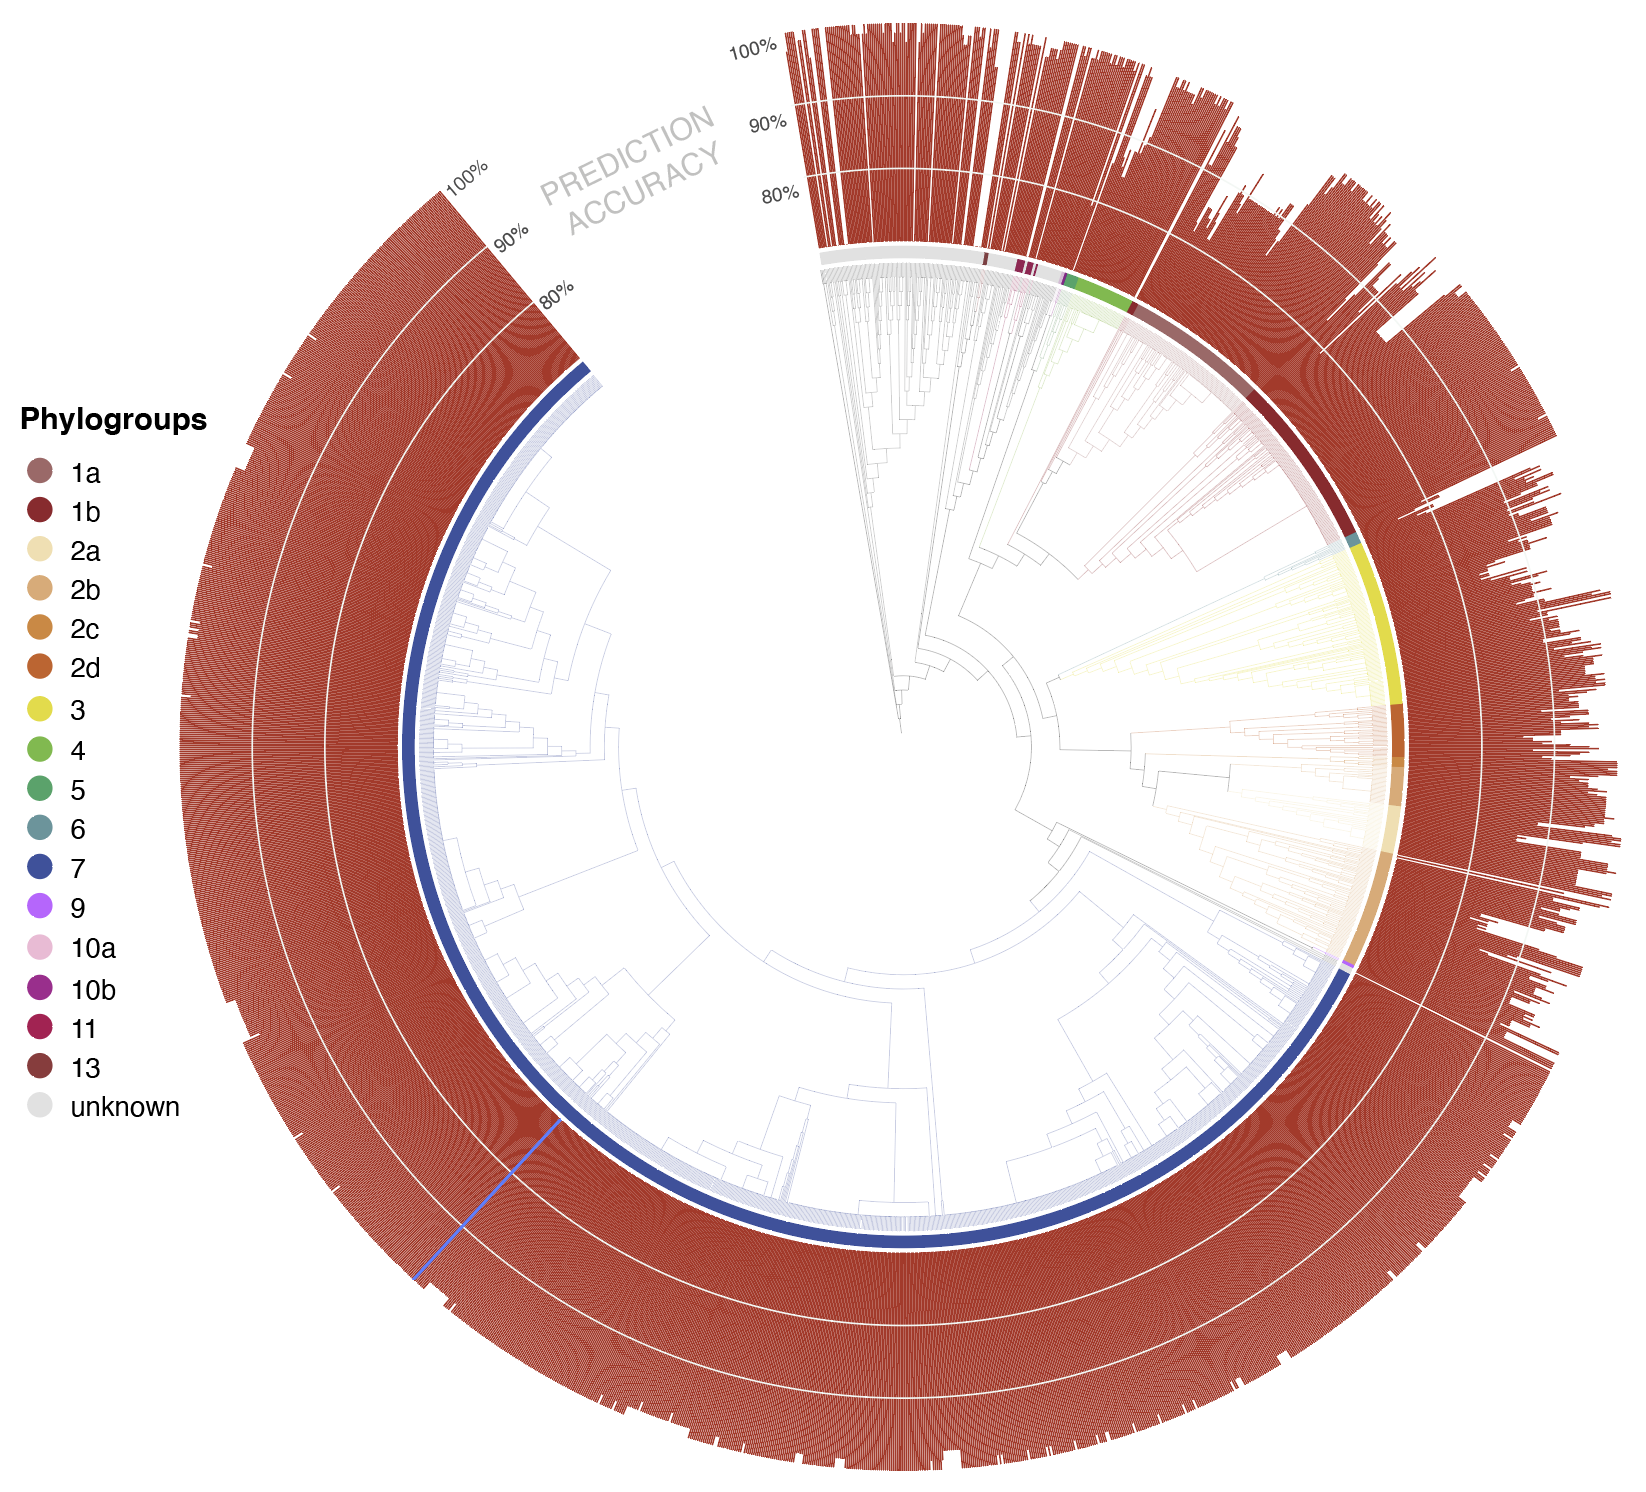
As classification based on single amplicon sequences resulted in fairly high genomic resolution (97-98% ANI), we sought to explore the possibility of predicting gene content of a target strain using gene content of predicted relatives. As type III effector proteins (T3Es) are important determinants of virulence in PSSC, we focused here on T3Es by first assessing the prevalence of each T3E subfamily within genomic clusters sharing at least 98% ANI (fig 2). While there were several clusters that contained only a single genome (i.e., no genome in the dataset shared more than 98% ANI with them), even among better represented clusters, there was considerable similarity in T3E repertoires. This suggested that unknown isolates placed into these clusters should exhibit a predictable T3E repertoire. Perhaps not surprisingly, clusters representing phylogroups that contain most of the agricultural pathogens within PSSC exhibit many more T3Es as well as a greater diversity in repertoires between strains, indicated by the average Jaccard index within a given cluster (fig 2). When the T3E repertoires of the 2,161 genomes were compared against the consensus repertoires (defined by taking the most common state of each T3E subfamily; absent or present) of their 98% ANI clusters, 75.3-100% of actual T3E states recapitulated the intra-cluster consensus (fig 3).
To further test the feasibility of T3E repertoire prediction, five genomes not included in our initial training set underwent in-silico PCR for the nine primers tested above, classified using the trained naïve Bayes classifiers, and screened for T3Es. Actual T3E repertoires were then compared to the average repertoire within the predicted LIN group of the unknown strain, and prediction accuracy for the repertoire was assessed (Fig. 3). Classification resulted in the placement of three strains into phylogroup 3, one in phylogroup 4, and the last into a cluster containing strains from both phylogroup 2c and 2d. For isolates placed into phylogroup 3, some primer sets were only able to classify to 97%, while other classified to 98% ANI, allowing us to also compare the accuracy of gene content predictions at difference classification resolutions. Prediction accuracy, measured as the proportion of effector protein subfamilies in the unknown isolate that could successfully be predicted by their frequency within the predicted cluster, ranged from 79.2-94.8% (fig. 4). As more PSSC genomes are sequenced and deposited in public repositories, it is likely that our ability to predict T3E repertoires, as well as the presence of other important virulence factors, from amplicon sequencing will improve. This, coupled with recent research that indicates that host range can in part be inferred from virulence factors such as T3Es suggests that amplicon sequencing remains a powerful method for studying disease dynamics, predicting pathogen spread, and rapidly detecting problematic PSSC strains.
3. Develop a software pipeline and online application to predict identities and virulence factors carried by unknown isolates detected through PCR-based assay.
A web portal for the comprehensive analysis and exploration of PSSC isolate characterization from single amplicon sequencing was built using the react framework and is available for use at www.syringae.org. A summary of the web portal features follows:
Identify
The primary functionality on syringae.org is the rapid characterization of isolates from single amplicon sequences.
Input:
untrimmed amplicon sequences generated from primer sets targeting the genes gyrB, CTS, gapA, PGI, or rpoD in FASTA or multiFASTA format.
Outputs:
- A list of genomes predicted to be most closely related to the unknown isolate
- phylogenetic classification for each unknown is also displayed as a phylogenetic tree rooted at the most recent common ancestor of all genomes in the Syringae database predicted to be closely related to the unknown isolate. By default, the tree only shows the most closely related genomes, but users can zoom out to show more distant relatives to view the predicted placement of the unknown isolate in a larger phylogenetic context. The predicted shared ANI with the unknown isolate is displayed as a radial bar chart around the perimeter of the tree
- For the currently displayed tree, the abundance of represented species, phylogroups, and pathovars are given.
- A summary of the virulence factors found among the most closely related genomes of the unknown isolate.
To quickly learn more about any genomes predicted to be similar to the unknown isolate, users can utilize the Explore and Search functionalities.
Explore
An interactive visualization tool for exploring the phylogenetic and genetic diversity of PSSC. Users can filter the 2,161-genome phylogenetic tree Syringae uses for visualizing classification data by taxa (phylogroup, species, and pathovar), and annotate up to six features, including multiple taxa and presence/absence of up to 3 NCBI-annotated genes.
Search
A search tool for quickly finding metadata for any genome in Syringae’s database. Search results include a list of the closest PSSC relatives in the dataset, as measured by fastANI.
Users can also search for any NCBI-annotated gene names or virulence factors annotated by us for Syringae. Search results include a list of all genomes in our database carrying the gene of interest, as well as each unique protein accession number associated with the gene name found within the species complex.
They key conclusion of this work is that single amplicon sequences are sufficient to provide sub-phylogroup classification, and that this classifiication resolution allows for accurate prediction of gene content associated with pathogenicity.
Education & outreach activities and participation summary
Participation summary:
Poster presentations:
"Predicting Virulence Factors In The Plant Pathogen Pseudomonas syringae", the international phytobiomes conference in Denver, Colorado, 2022 & ICDS Fall 2022 symposium, State College, Pennsylvania, 2022
"SYRINGAE: A web tool for characterizing plant pathogens in the Pseudomonas syringae species complex", Changing microbiomes symposium in Boalsburg, Pennsylvania 2022
Project Outcomes
This project greatly increases the utility of PCR assays for PSSC isolates. The main products - naive bayes classifiers, and an online portal for accessing the classifiers analyzing the output - are immediately available to researchers, allowing for faster, more informative characterization of isolates with low-cost amplicon sequencing. In turn, we hope this allows plant pathologists and extension faculty to more accurately identify disease causing agents and assess outbreak spread and disease potential in PSSC-infected fields.
Developing and working on this project has allowed the opportunity to gain invaluable bioinformatics and phylogenetics research skills and a deeper appreciation for the diversity of pathogens found with the Pseudomonas syringae species complex. Future directions for the project include using syringae.org as a means for collecting data on spatiotemporal distributions of PSSC pathogens through user-uploaded amplicon sequences, allowing for larger-scale epidemiological studies and further insights into co-occurrence networks within the species complex.