Final report for GNE20-235
Project Information
Oyster reefs provide a source of sustainable seafood, shoreline protection, and improved water quality (Weaver et al., 2017). Oyster farms have the potential to provide the same benefits to communities and ecosystems as their natural counterparts. To date, there has been little research focused on feedbacks between oysters, farming gear, and coastal environments in the Northeast Atlantic region. The goal of this study was aimed to improve the understanding of the relationship between oyster farms and coastal resiliency by implementing low cost sensors to characterize local impact to the hydrodynamic flow field.
From an oyster life cycle perspective, this project examines the role of waves and currents which have implications regarding oyster growth, nutrient fluxes to and from oysters, and the structural stability of farming gear. From a coastal resiliency perspective, this project will address the role oyster farms play in preserving coastline environments such as saltmarshes and beaches. Project questions are addressed through a series of field experiments where arrays of pressure temperature sensors were deployed across different oyster farming gear types. The project leveraged an ongoing collaboration between the University of New Hampshire (UNH) and Rutgers University providing access to a site containing a shallow water oyster farm in Barnegat Bay, NJ.
Insights from the field experiments can be used to inform lab experiments in order to develop empirical inferences regarding feedback mechanisms between oysters, farming gear, and the local flow field. Furthermore, the findings will be communicated to farmers through presentations and research briefs. Societal benefits of this project will be increased awareness of the hydrodynamic conditions on oyster farms that relate to both productivity of oyster farms and increased resiliency of our coastlines in areas where oyster farms are located.
Objective 1: Identify flow regimes in a range of oyster farm environments. Flow regimes including tidal currents, waves, steady mean flow, and flow magnitudes are identified using field data collected in Barnegat Bay, New Jersey during the summer of 2021. Low cost pressure and temperature sensors were developed in the UNH Coastal Processes Lab to achieve the spatial resolution necessary to determine localized affects that oyster farms have on nearby shorelines.
Objective 2: Quantify the feedback mechanisms. The results from Objective 1 are used to develop empirical inferences between oyster farm characteristics and coastal resiliency. The study provides a model that can be used by farmers and permitting bodies to monitor oyster farms and inform quantify the hydrodynamic response of gear density and type to both typical and storm environments. Deploying provides insights that can be used to help determine the ideal, maximum, and minimum depths for gear and farm operation as it relates to coastal resiliency.
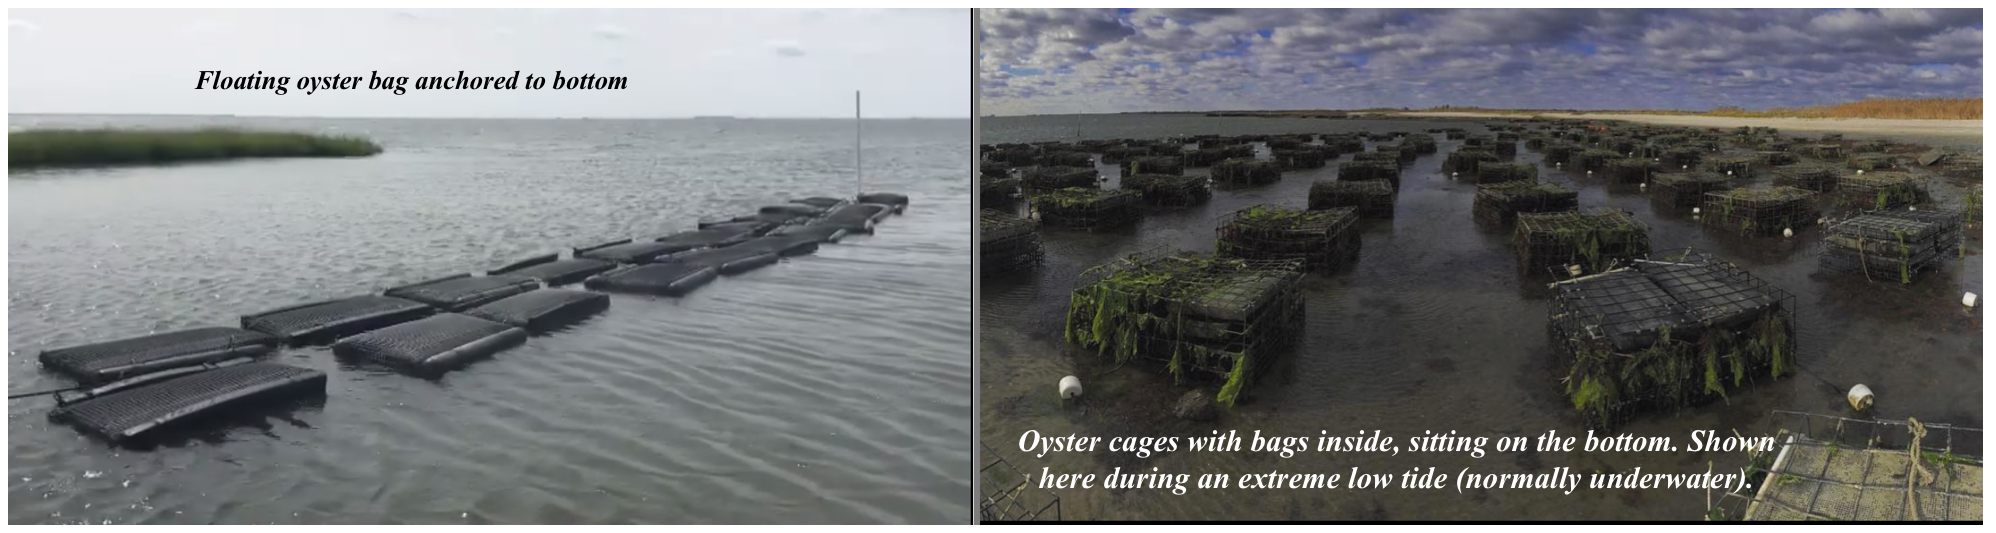
Objective 3: Develop deployment strategies. While gear types used by farmers are widely varied, two main type of gear are used on oyster farms in the Northeast: floating mesh bags and bottom resting oyster cages with seeded mesh bags inside. There are also limited cases of farmers foregoing equipment and seeding the oysters directly on the bottom. Each case will simulated in the lab by placing mimicked oysters of various life stages and gear deployment strategies in the EFWT. Using both observed (e.g. typical tidal flows) and extreme (e.g. storms) hydrodynamic regimes identified in Objective 1 and the model oysters and gear from Objective 2. The hydrodynamic effect of different deployment strategies will be quantified using particle image velocimetry (PIV), and pressure gradient measurements made in the UNH EFWT. This data will be used to determine the highest energy gear and individual oysters can withstand before being carried away and/or damaged and will confirm conditions under which shoreline protections may exist. Tests will also be performed on individual oysters and free standing oyster structures to mimic natural oyster reefs to compare to existing data.
The goal of this project was to advance understanding of the oyster farm, hydrodynamic feedback by addressing 1) how oyster farms may improve coastal resilience by acting as a nearshore breakwater during times of storms or enhanced flows and 2) how resilient the various life stages of the oysters and farm gear configurations are to coastal wave and current conditions.
Natural oyster reefs have historically served as a fundamental component of Atlantic coastal ecosystems unfortunately, overfishing and changes in habitat caused by climate change have dramatically diminished the number and size of these naturally occurring oyster reefs (Zu Ermgassem et al., 2013). Globally, more than 85% of natural oyster reefs have been lost (Beck et al., 2011). The disappearance of natural oyster reefs has left shorelines more vulnerable to erosion, causing property damage to homeowners and municipalities alike (La Peyre, et al., 2015; Powell, et al., 2019). Efforts to restore natural habitat are necessary but expensive, and oyster farms could provide a profitable mutually beneficial alternative.
Oyster farms are typically located in coastal regions with easy access to the water, good water quality, and daily water circulation provided by tides or rivers (Flimlin et al., 2010). Oyster farmers start with oyster seed from nurseries (3 mm) which are grown out on land in raceways or upwellers, or in sheltered waters in floating upwelling systems to reduce losses. Once the oysters are larger (20 mm) they are moved to higher energy environments with larger waves and tidal currents to reach market size (76 mm) and develop signature market traits such as a deeper cups and thicker shells (Flimlin et al., 2010). The gear choice can be influenced by wave conditions, bottom sediment type, temperature, salinity, and numerous other environmental variables. Oyster farmers can choose to use floating mesh bags or bottom resting cages for the final stages of growth, which is typically 12-48 months. Oysters require constant water circulation in order to have a consistent supply of food and to carry away waste. Thus, farming gear will necessarily interact with tidal flows and waves generating feedbacks between the gear and the environment which will impact oyster growth (Fulford et al., 2010), the longevity of gear, and local coastlines.
Aquaculture farmers must identify locations where flows are large enough to allow sufficient nutrient flux and waste removal and small enough to minimize damage to gear. The farmers’ challenges are compounded if they are also asked to also consider how the farm can increase coastal resiliency to storms by acting as a nearshore breakwater. There has been increasing interest in advancing our understanding of the oyster farm life cycle and its potential role in coastal resiliency. Farming equipment placed in an environment where there might be intermittent large storms, tidal currents, or river flows has the potential to increase coastal and economic resiliency by decreasing storm impacts and stabilizing the shoreline.
Research
Field data was collected on an oyster farm during several successive deployment periods in August trough October 2021 under the scope of a previously funded USACE project awarded to a collaborative of Rutgers University and UNH researchers. The field study was performed in Rose Cove, a small inlet located in southern Barnegat Bay, NJ. The Rutgers-UNH team developed a simple sensing package that was deployed in three arrays across the farm. These low-cost instruments were developed by our UNH lab and include a pressure sensor to measure water depth and localized wave excursions. A temperature sensor was also included to provide a proximate measurement of environmental parameters. The Blue Robotics pressure temperature instruments, henceforth referred to by their acronym BRPT, sample at 16 Hz, a frequency sufficient to resolve the pressure signatures of incident and breaking waves. The BRPT has an approximate battery life of 7-14 days which, over the course of several deployments, was sufficient to characterize wave dynamics in Rose Cove.
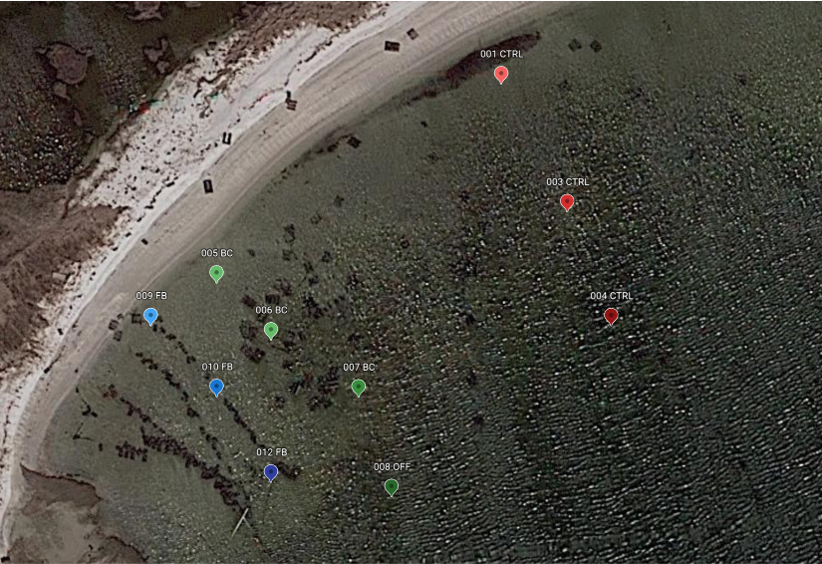
The instruments were bottom mounted in three cross shore arrays shown in Figure 1. The rightmost array was located away from farming gear and acted as a control. The other arrays were located within the farm near two different gear types. The middle array was associated with bottom seated oyster cages, and the leftmost array was associated with the floating bag gear. In addition, two YSI EXO1 Sondes measuring temperature, conductivity, dissolved oxygen (DO), and pressure were purchased and deployed as reference instruments. The YSI instruments are capable of providing some spatial resolution in the cross-shore direction of the environmental parameters listed. However, due to faulty power management boards in both instruments no data was recovered from field efforts.
The statistical parameters of particular interest from these deployments were mean wave height, maximum wave height, magnitude of mean flows, and the spatial distribution of these parameters (e.g. offshore of the farm, over the farm, and shoreward of the farm). The collected observations wereused to inform the contributions of floating bag and bottom resting cage gear types to wave dissipation compared to the control area where no gear is present.
Significant wave height, Hs, is calculated using Equation 1.
Hs = 4σ (1)
where σ is the standard deviation of sea surface elevation which is found using Equation 2.
 (2)
(2)
where flow is the lowest wave frequency (1/25 Hz), fhigh is the highest wave frequency (1 Hz), S(f) is the spectral energy density, and bw is the frequency bandwidth. Wave energy per unit surface area , E, is related to the square of the significant wave height and is estimated using Equation 3.
E = 0.25*ρgHs2 (3)
where ρ is the density of sea water, g is the gravitational acceleration, and Hs is the significant wave height. The quantity of wave energy is a useful way to quantify the diss
The field study at Barnegat Bay can be expanded upon by comparing the flow fields with those other active oyster farm environments. For example, the Great Bay Estuary in New Hampshire has a long history of a natural oyster reefs with more recent active oyster farms. At UNH we have access to three-dimensional hydrodynamic models of the Great Bay Estuary which predict wave velocities, periods, and tidal velocities in the vicinity of the farms. The models provide a second measure of the hydrodynamic conditions present at oyster farms on Northeastern coastlines. The Great Bay Estuary provides an interesting contrast due to the particularly large tidal range, varying over 3 m during large spring tides. Tidal flows in Great Bay contribute to significantly higher mean flows, 1-2 m/s, compared to virtually 0 m/s in Rose Cove. Flow characteristics, including maximum tidal flow, large wave events, and long-term average conditions are identified from the model to compliment the field data collected in New Jersey.
During the fall and winter months of 2020, the synthetic oysters and gear models were fabricated. This study focused on two common gear arrangements shown in Figure 2; floating mesh bags (left) and bottom seated cages with mesh bags inside (right). The size of the gear was limited by the 60 cm width of the test sections of the UNH Environmental Flows Water Tunnel (EFWT). Where possible, models are as close to full size as possible to reduce uncertainties due to scaling.
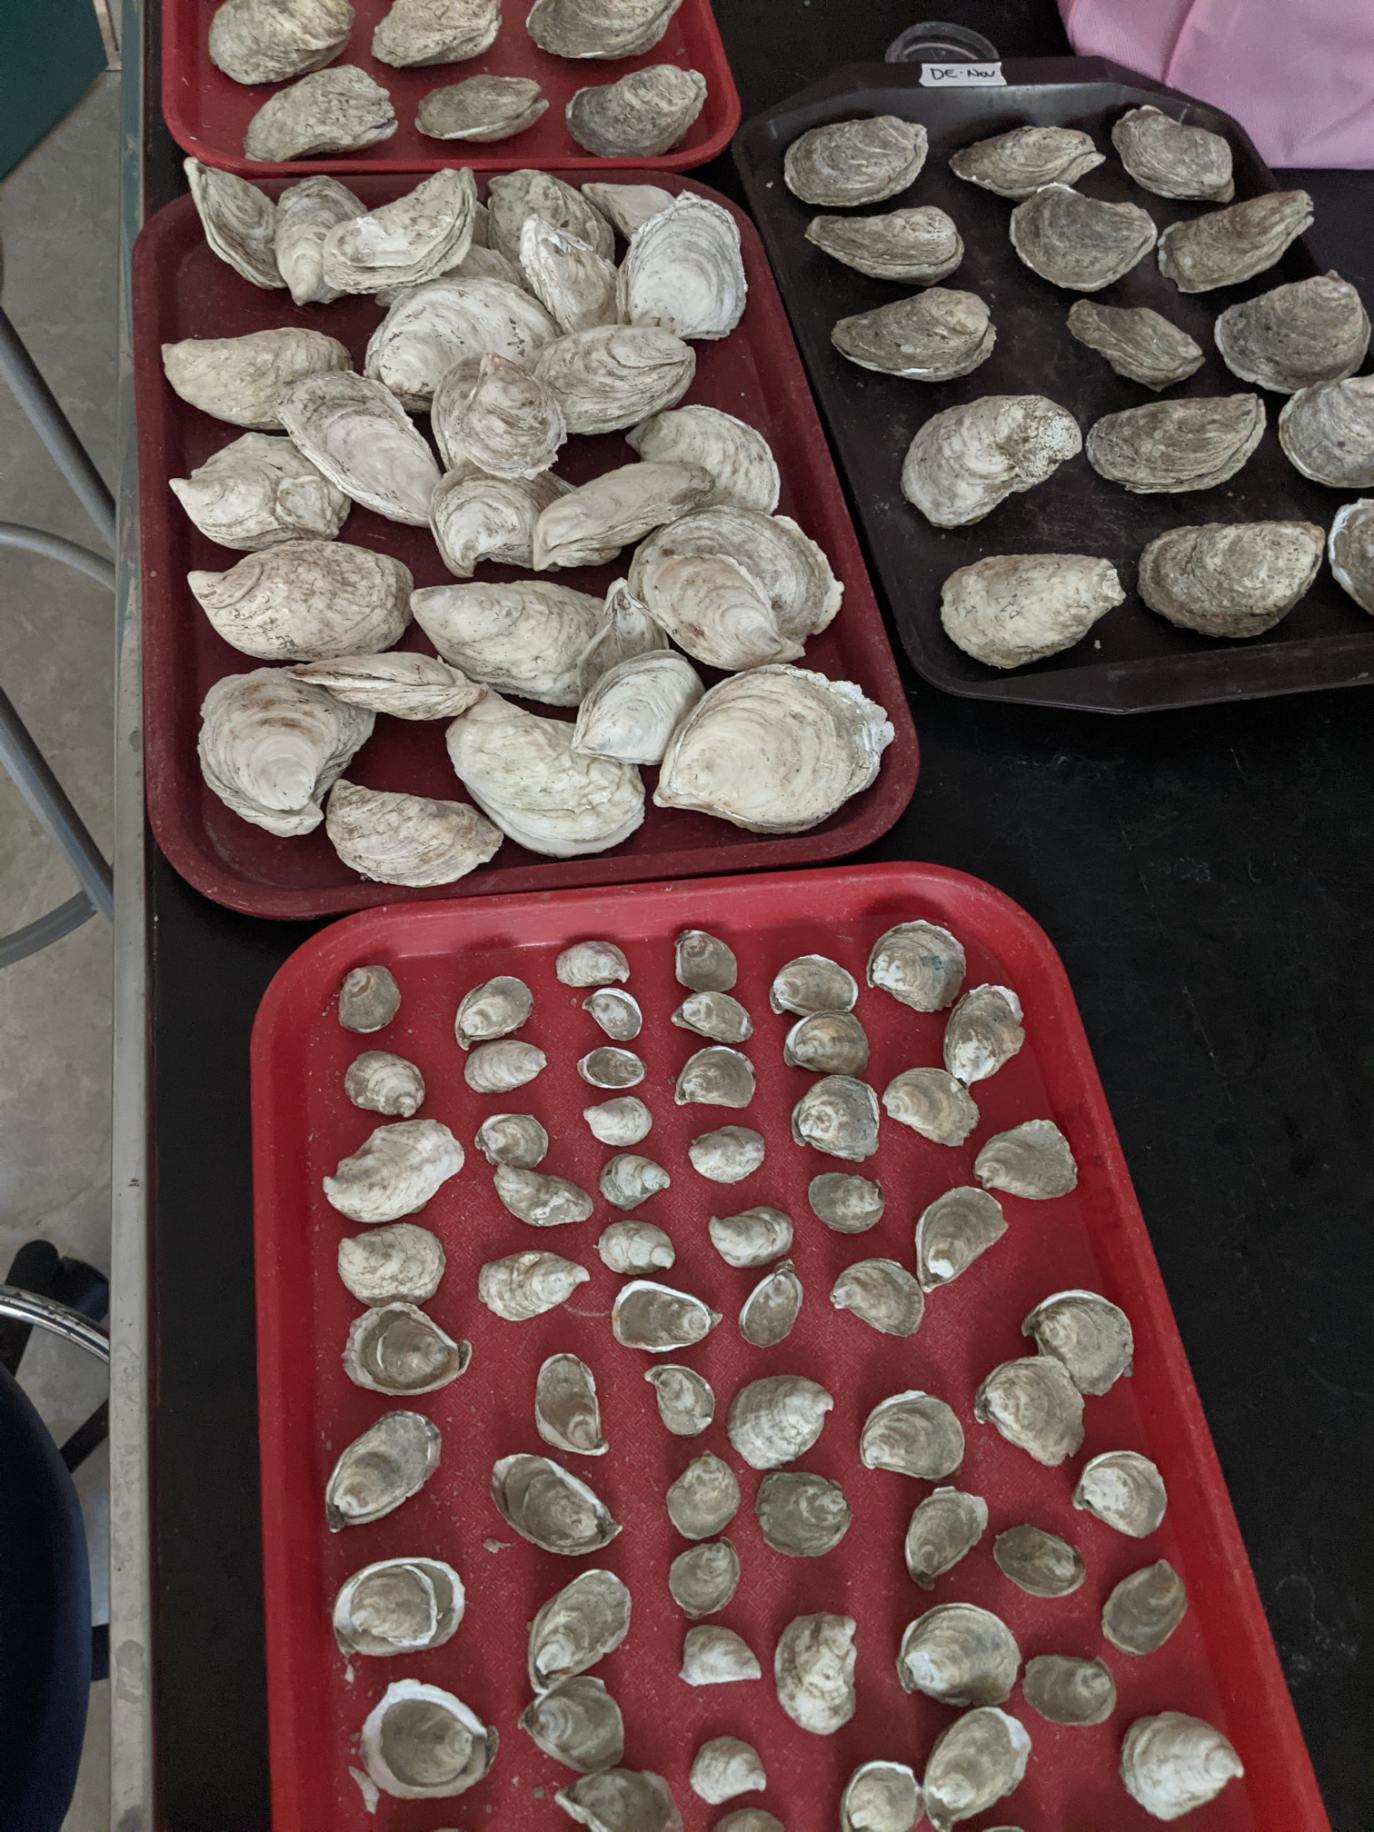
Given that the tunnel contains fresh water, using live oysters was not possible. Instead this study utilized fabricated synthetic oysters using available discarded oyster shells to assure full-scale flow behavior due to microroughness, and shape factors consistent with nature. The synthetic oysters were prepared by bleaching oyster shells collected from farms and filling the shells with silicon caulk. Silicon caulk has a comparable density to seawater, 1.035 g/cm3 (Momentive MSDS, 2009), making it a suitable replacement for a living oyster. Oyster shells from various life stages are used, with sizes ranging from 2-7 cm. The gear bags and cages were filled with synthetic oysters at various life stages, as shown in Figure 3.
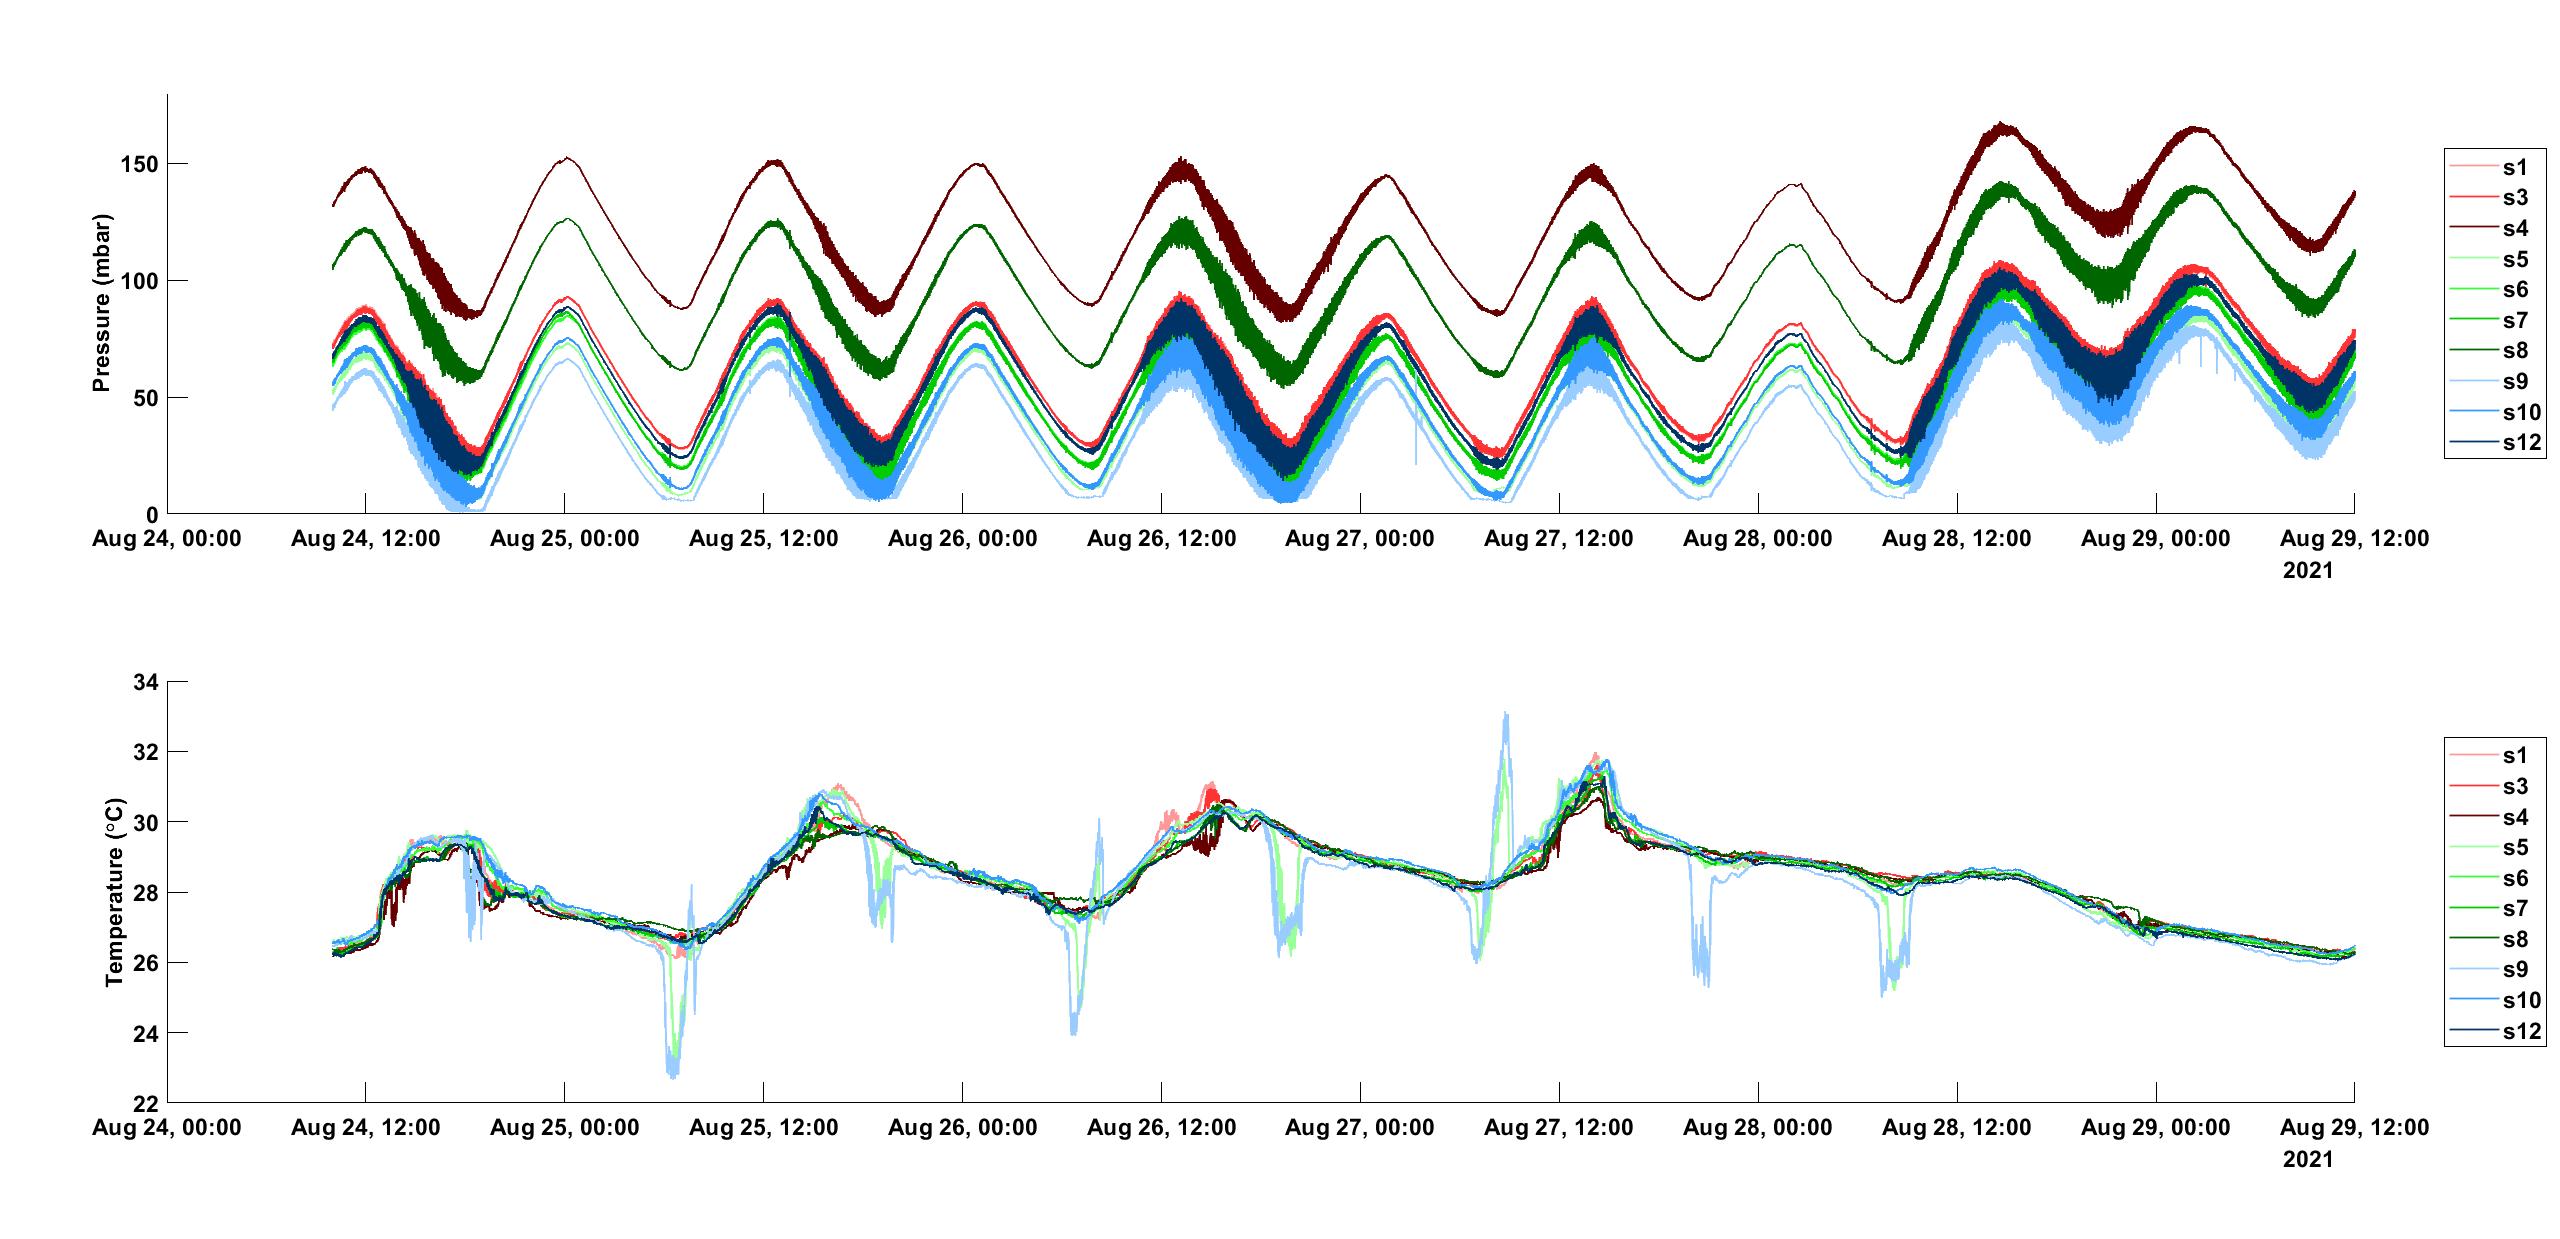
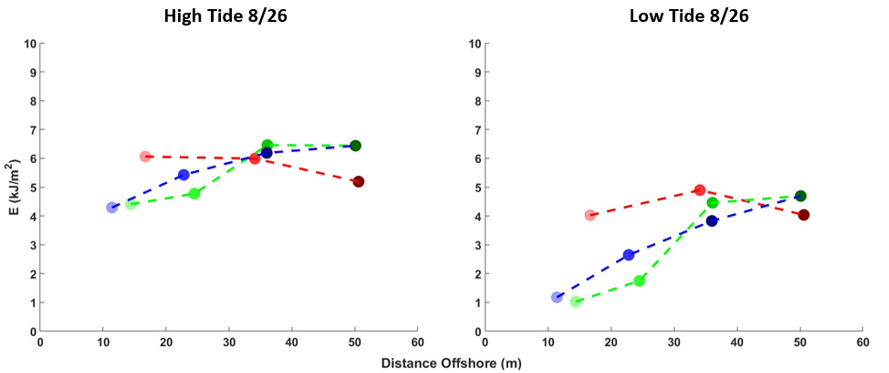
Time series data from August 24-29, 2021 are shown Figures 6-7. In this progression of figures, the color of the time series data is indicative of the sensor array: the control array is represented by shades of red, the bottom cage array is in shades of green, and the floating bag array is in shades of blue. Each sensor is assigned a unique shade that corresponds to it's distance offshore, where darker shades represent sensors further offshore and lighter shades indicate a sensor is closer to shore.
Figure 6 shows the pressure time series in the top panel and the temperature time series in the bottom panel over 5 days. Pressure trends are sinusoidal commensurate with the diurnal tidal cycle. The average tidal range in Rose Cove was on the order of 0.5 m during the deployment. Wave signals appear in the record as thicker lines and coincide with observed afternoon wind events. The accompanying temperature time series shows water temperature following daily trends, increasing to about 30 °C during the day and falling to about 26 °C at night. Abrupt spikes in the temperature time series from sensor 5 and sensor 9, that coincided with low tide, suggesting that during these periods the sensors were exposed to air and did not record a true pressure signal. Beginning on Aug 28, an extratropical low pressure system brought higher winds and caused a super elevation of water levels on the order of 10 cm. Water temperatures also fell during this event providing evidence that cooler offshore waters are mixing with onshore water masses during storm events.
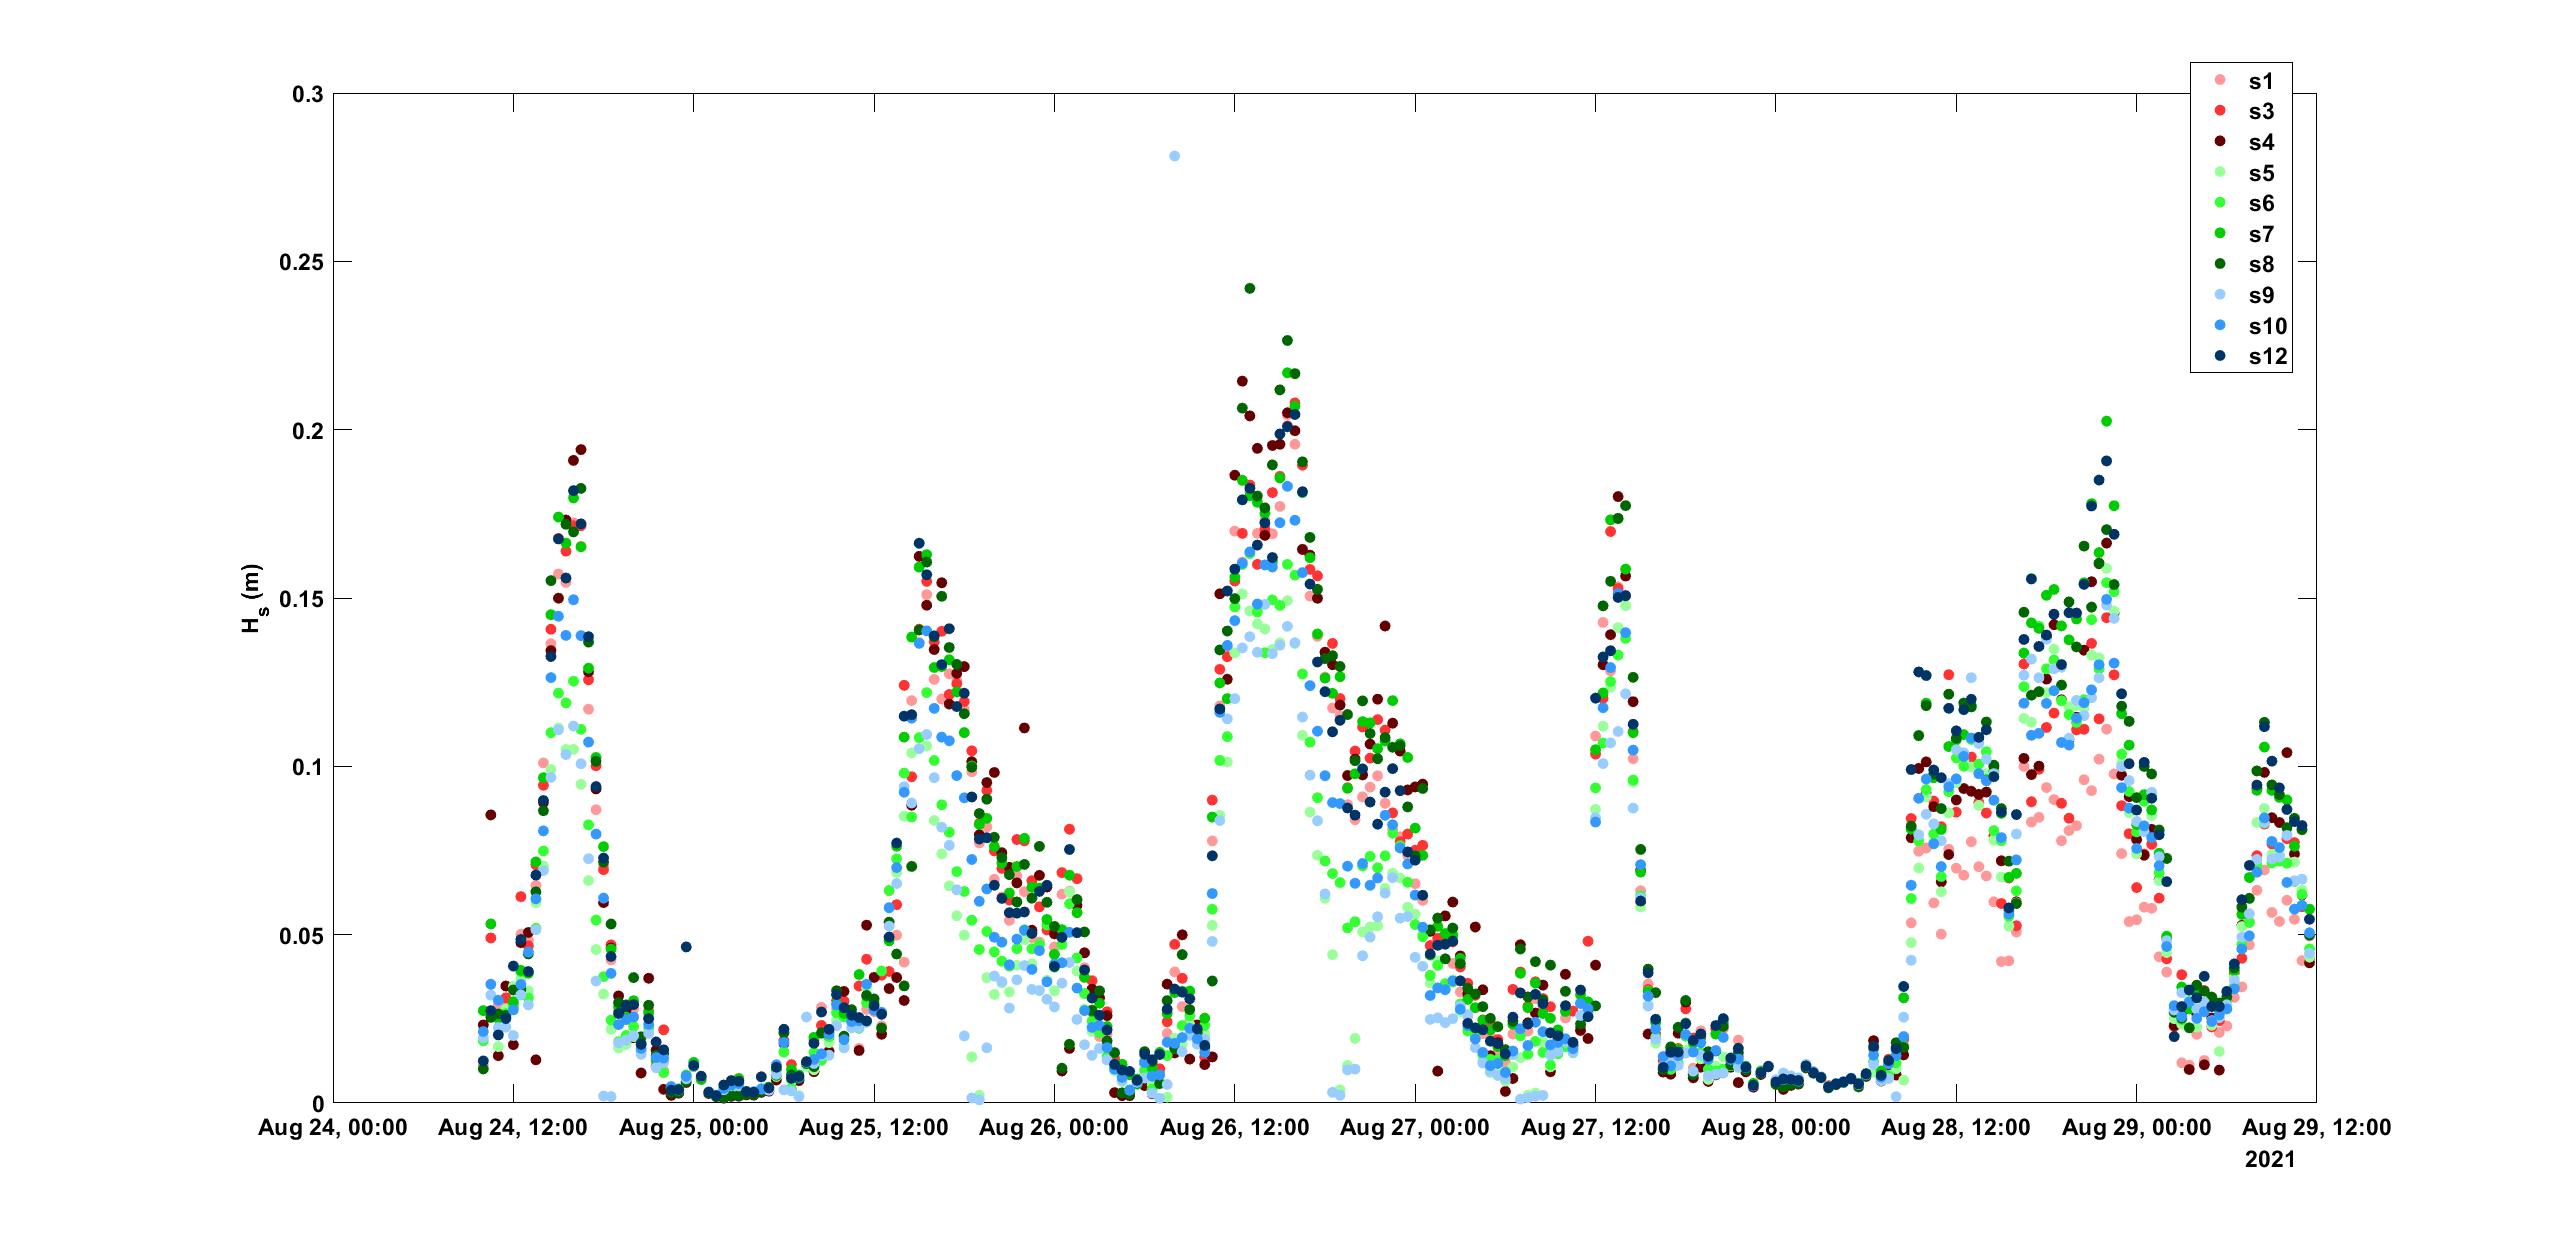
Time series data for significant wave height is shown in Figure 7. During the deployment spanning August 24-29 2021, Hs ranges from around 0-0.25 m, with peak wave heights occurring during the afternoon wind events. During these wave events the onshore sensors in the gear arrays, light green and blue markers, are markedly lower than the darker offshore sensors, representing evidence of wave dissipation.
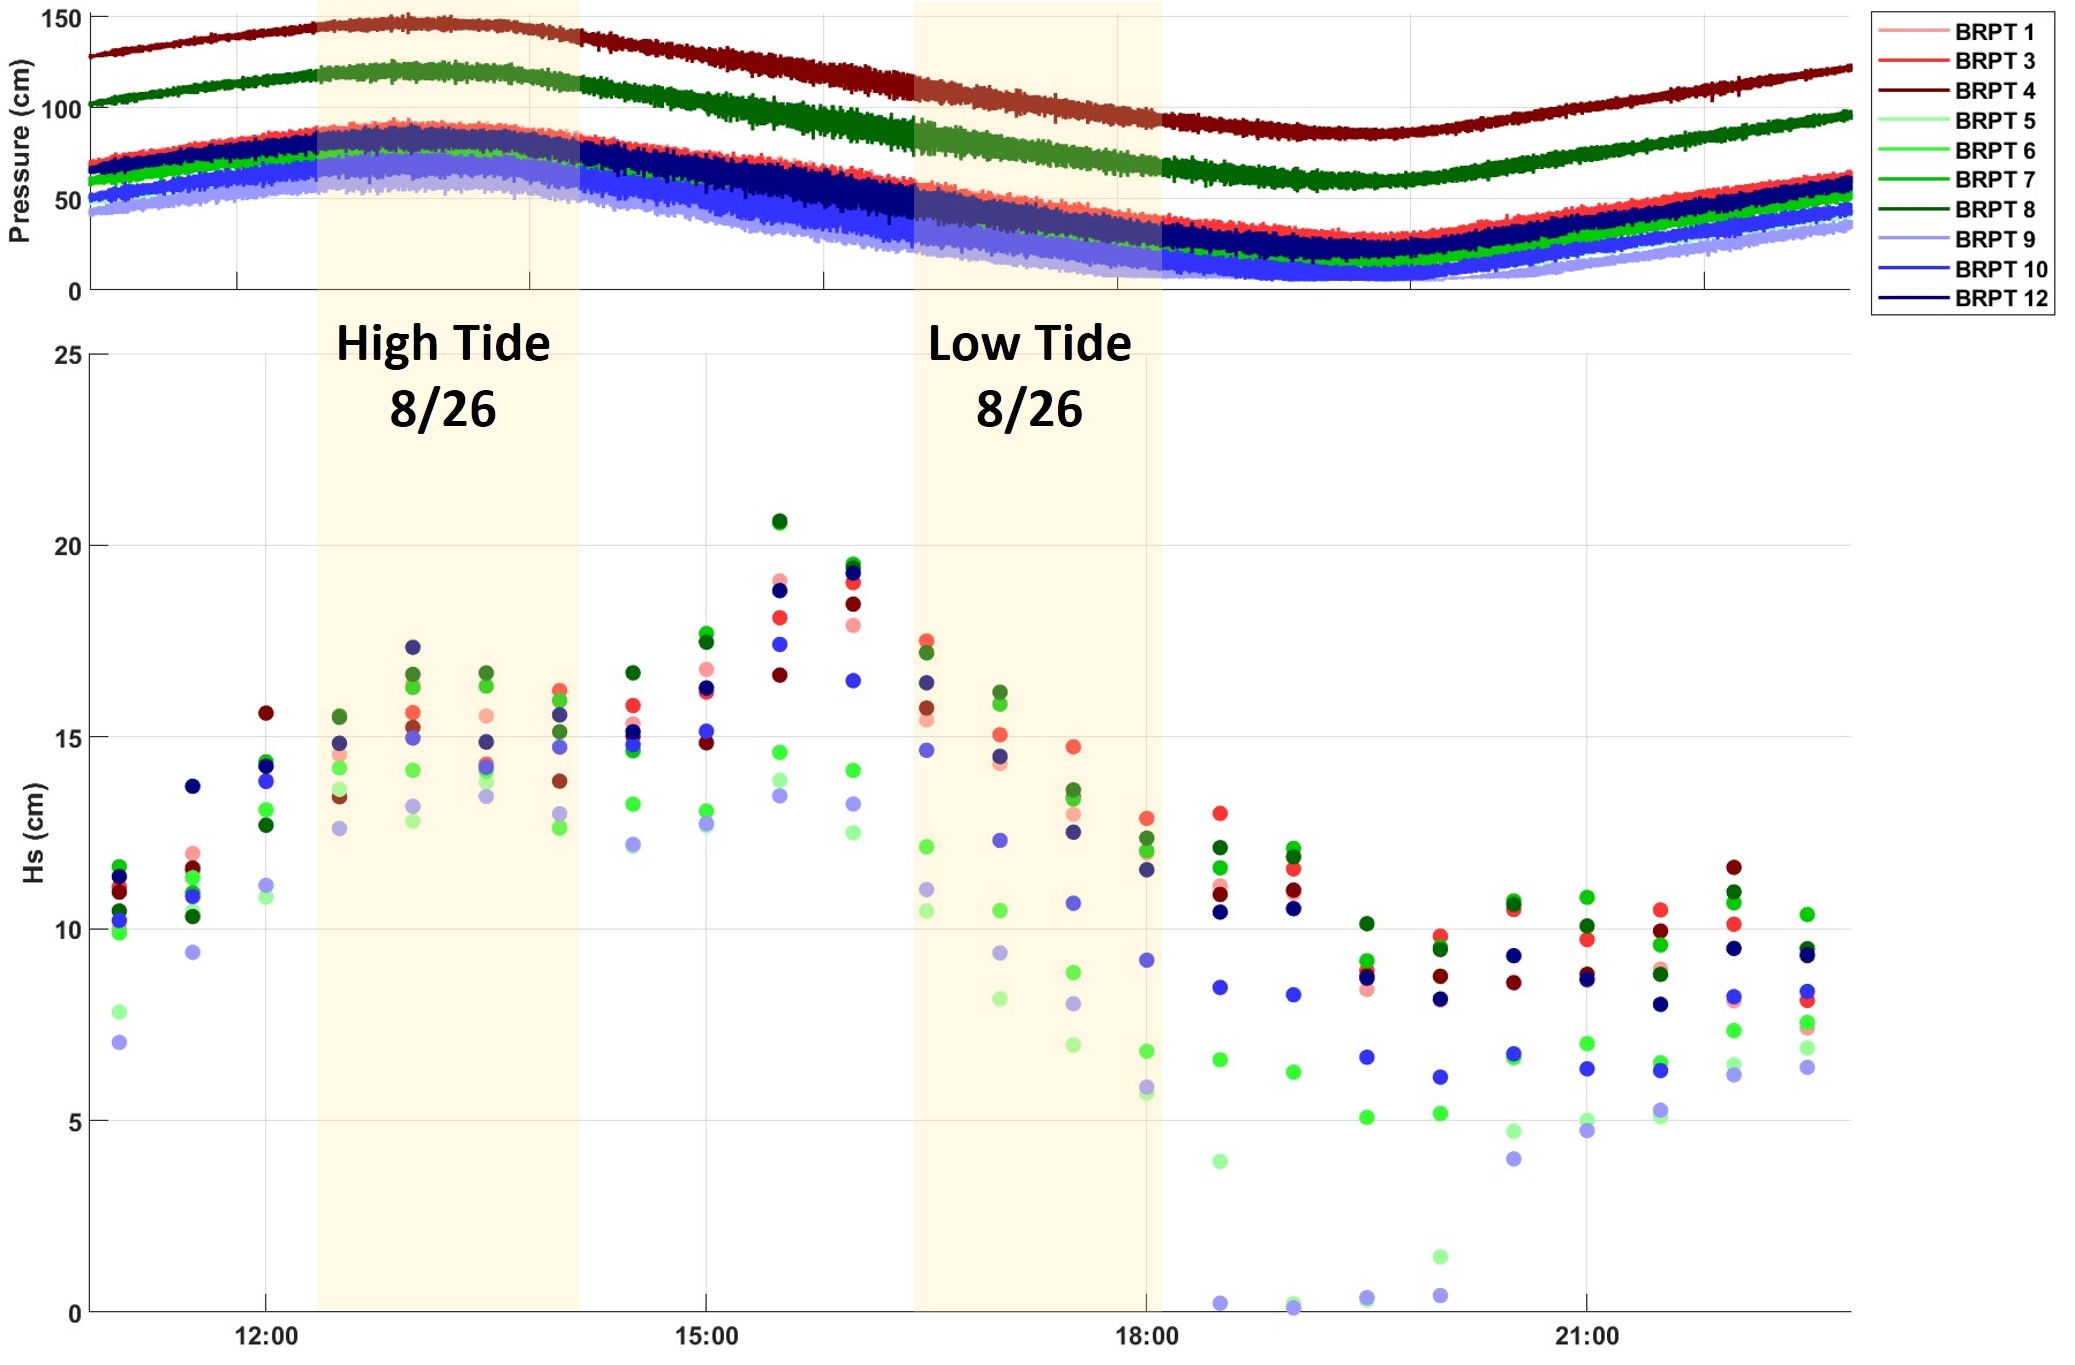
Further evidence of of wave energy dissipation caused by oyster farming gear in Rose Cove is provided in Figure 8, which shows two segments of the time series during a wind event on the afternoon of Aug 26. The periods are shown in Figure XX, where the pressure time series on Aug 26 from 11:00-22:00 is shown along with the significant wave height. The high and low tide windows are depicted with the highlighted regions which each include one hour of data. Note that the low tide section does not include data points during the period where the shallowest sensors, BRPT 5 and BRPT 9, are not submerged.
The first panel of Figure XX shows the spectral energy density and significant wave height during the high tide period. The second panel shows the same information for the low tide period. During high tide both spectral energy and significant wave height are nearly identical for all sensors, indicating that the wave climate is homogeneous and interactions between waves and farming gear is negligible. The water level during high tide is high enough and the waves are not large enough to break. During low tide the offshore sensors have spectral energy densities that are similar to high tide, while the onshore sensors, especially those located in the bottom cage and floating bag arrays show markedly different profiles, indicative of wave breaking. The significant wave height within the gear arrays decreases by 66% during low tide while the control array shows very little evidence of wave breaking and nearly no decrease in wave height.
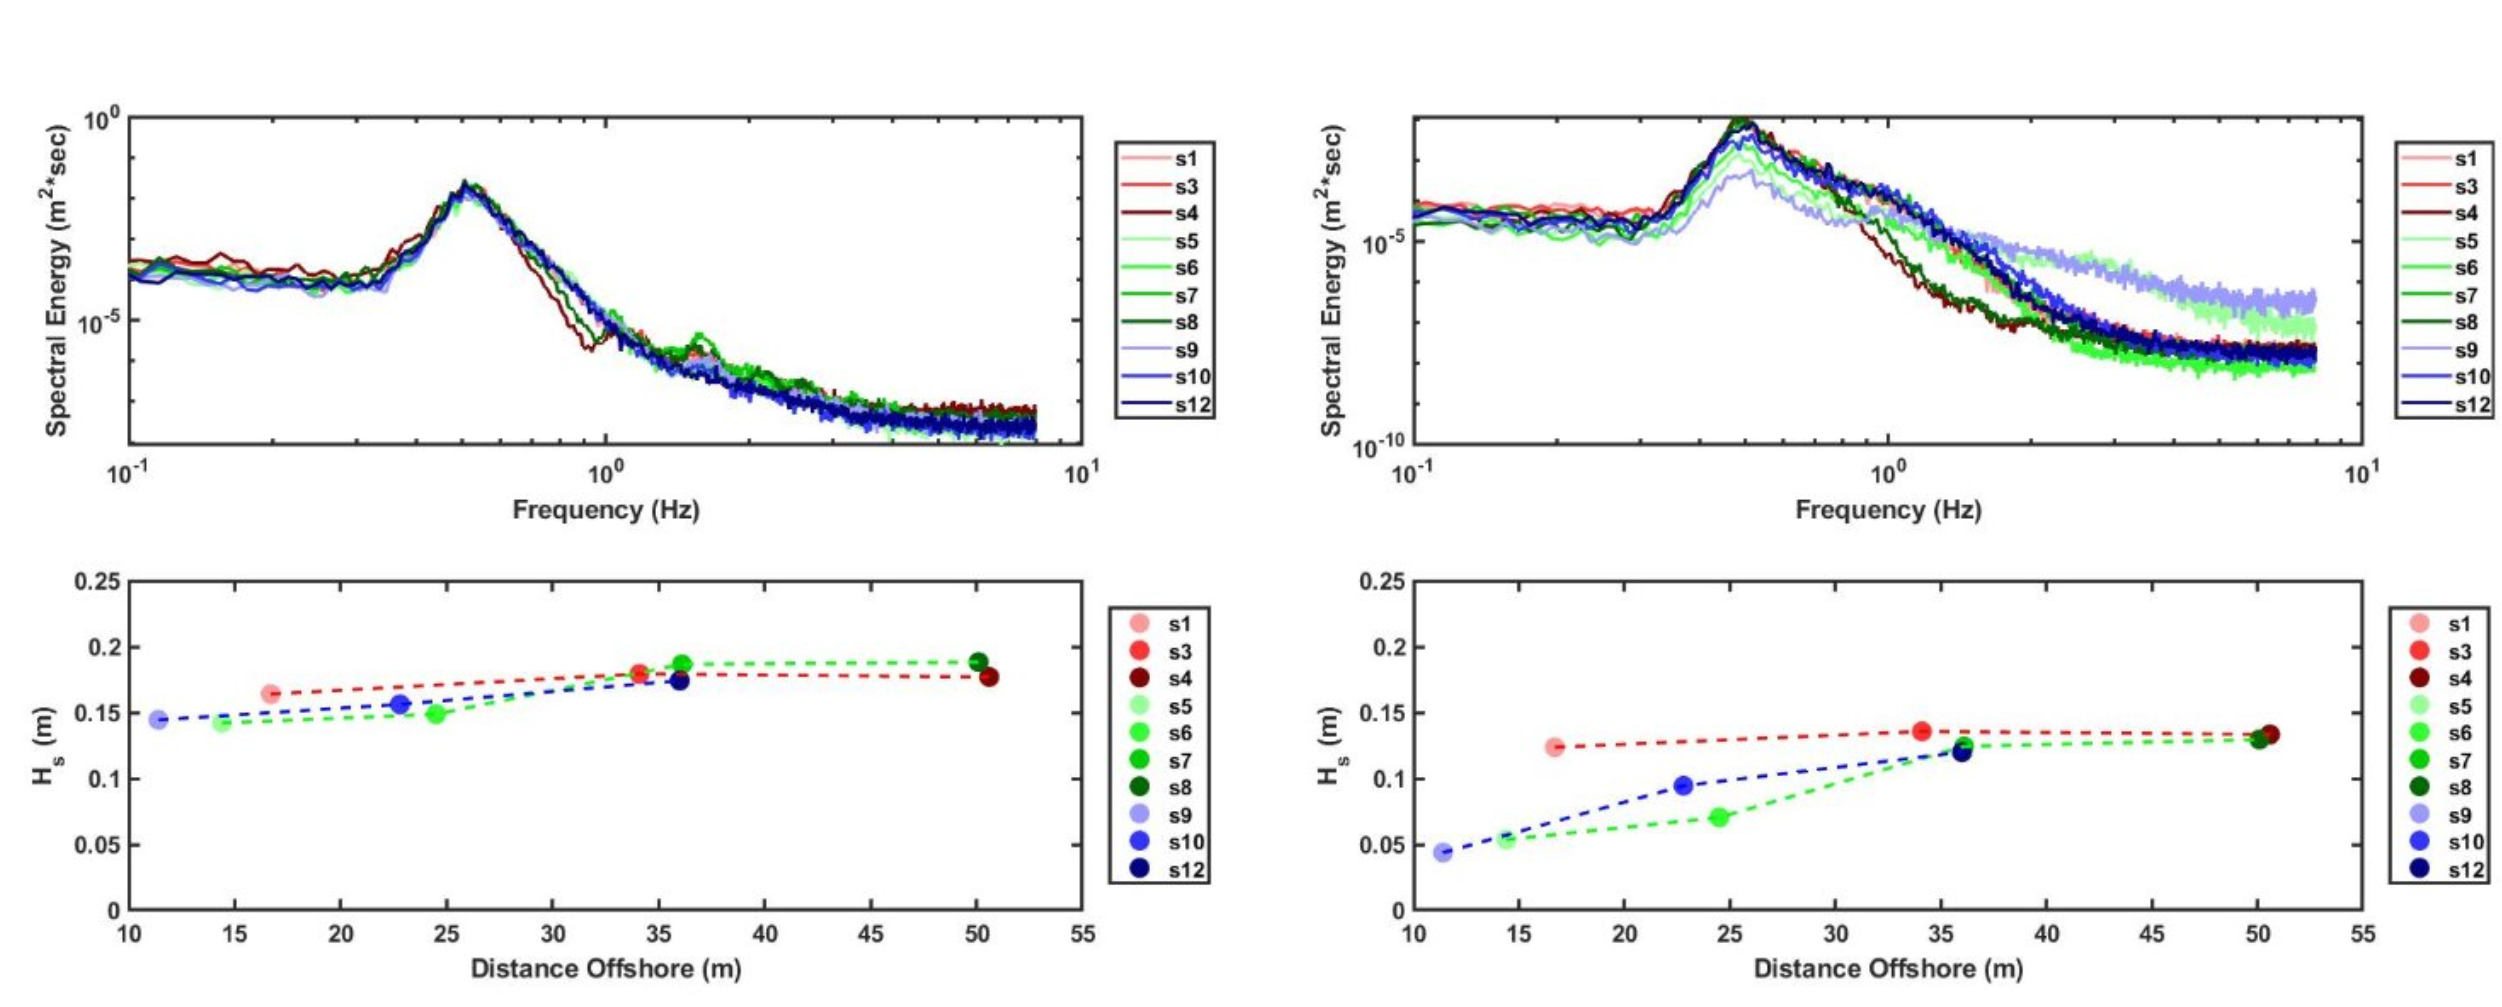
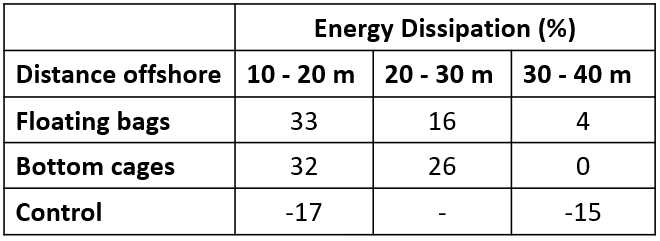
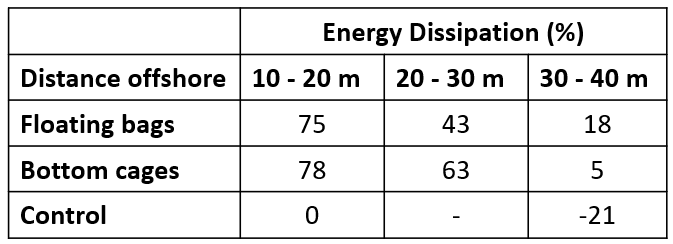
Energy dissipation from the high tide period is quantified in Table 1 and low tide in Table 2, where the percent dissipation is calculated based on comparing the total wave energy measured at the offshore sensors, BRPT 4 and BRPT 8 to each set of sensors in the onshore direction. FigureXX shows wave energy vs. distance offshore for the high and low tide periods. During the high tide period waves are dissipated within the geared arrays by about 30%. During the low tide period waves are dissipated by about 75% in the floating bag array and 78% in the bottom cage array when compared to the nearby control array.
This study highlights an implementation of low cost pressure and temperature sensors on an oyster farm in Barnegat Bay, NJ providing insight on the effect of farming gear on the localized hydrodynamic conditions. Based on the results from the field deployments of the BRPT instruments, tentative conclusions about the wave dampening effects of farming gear can be made. For the most part, the results are intuitive, obstructions to the incoming wave field, in the form of farming gear, act to decrease wave energy and provide shoreline protection in areas where gear is present.
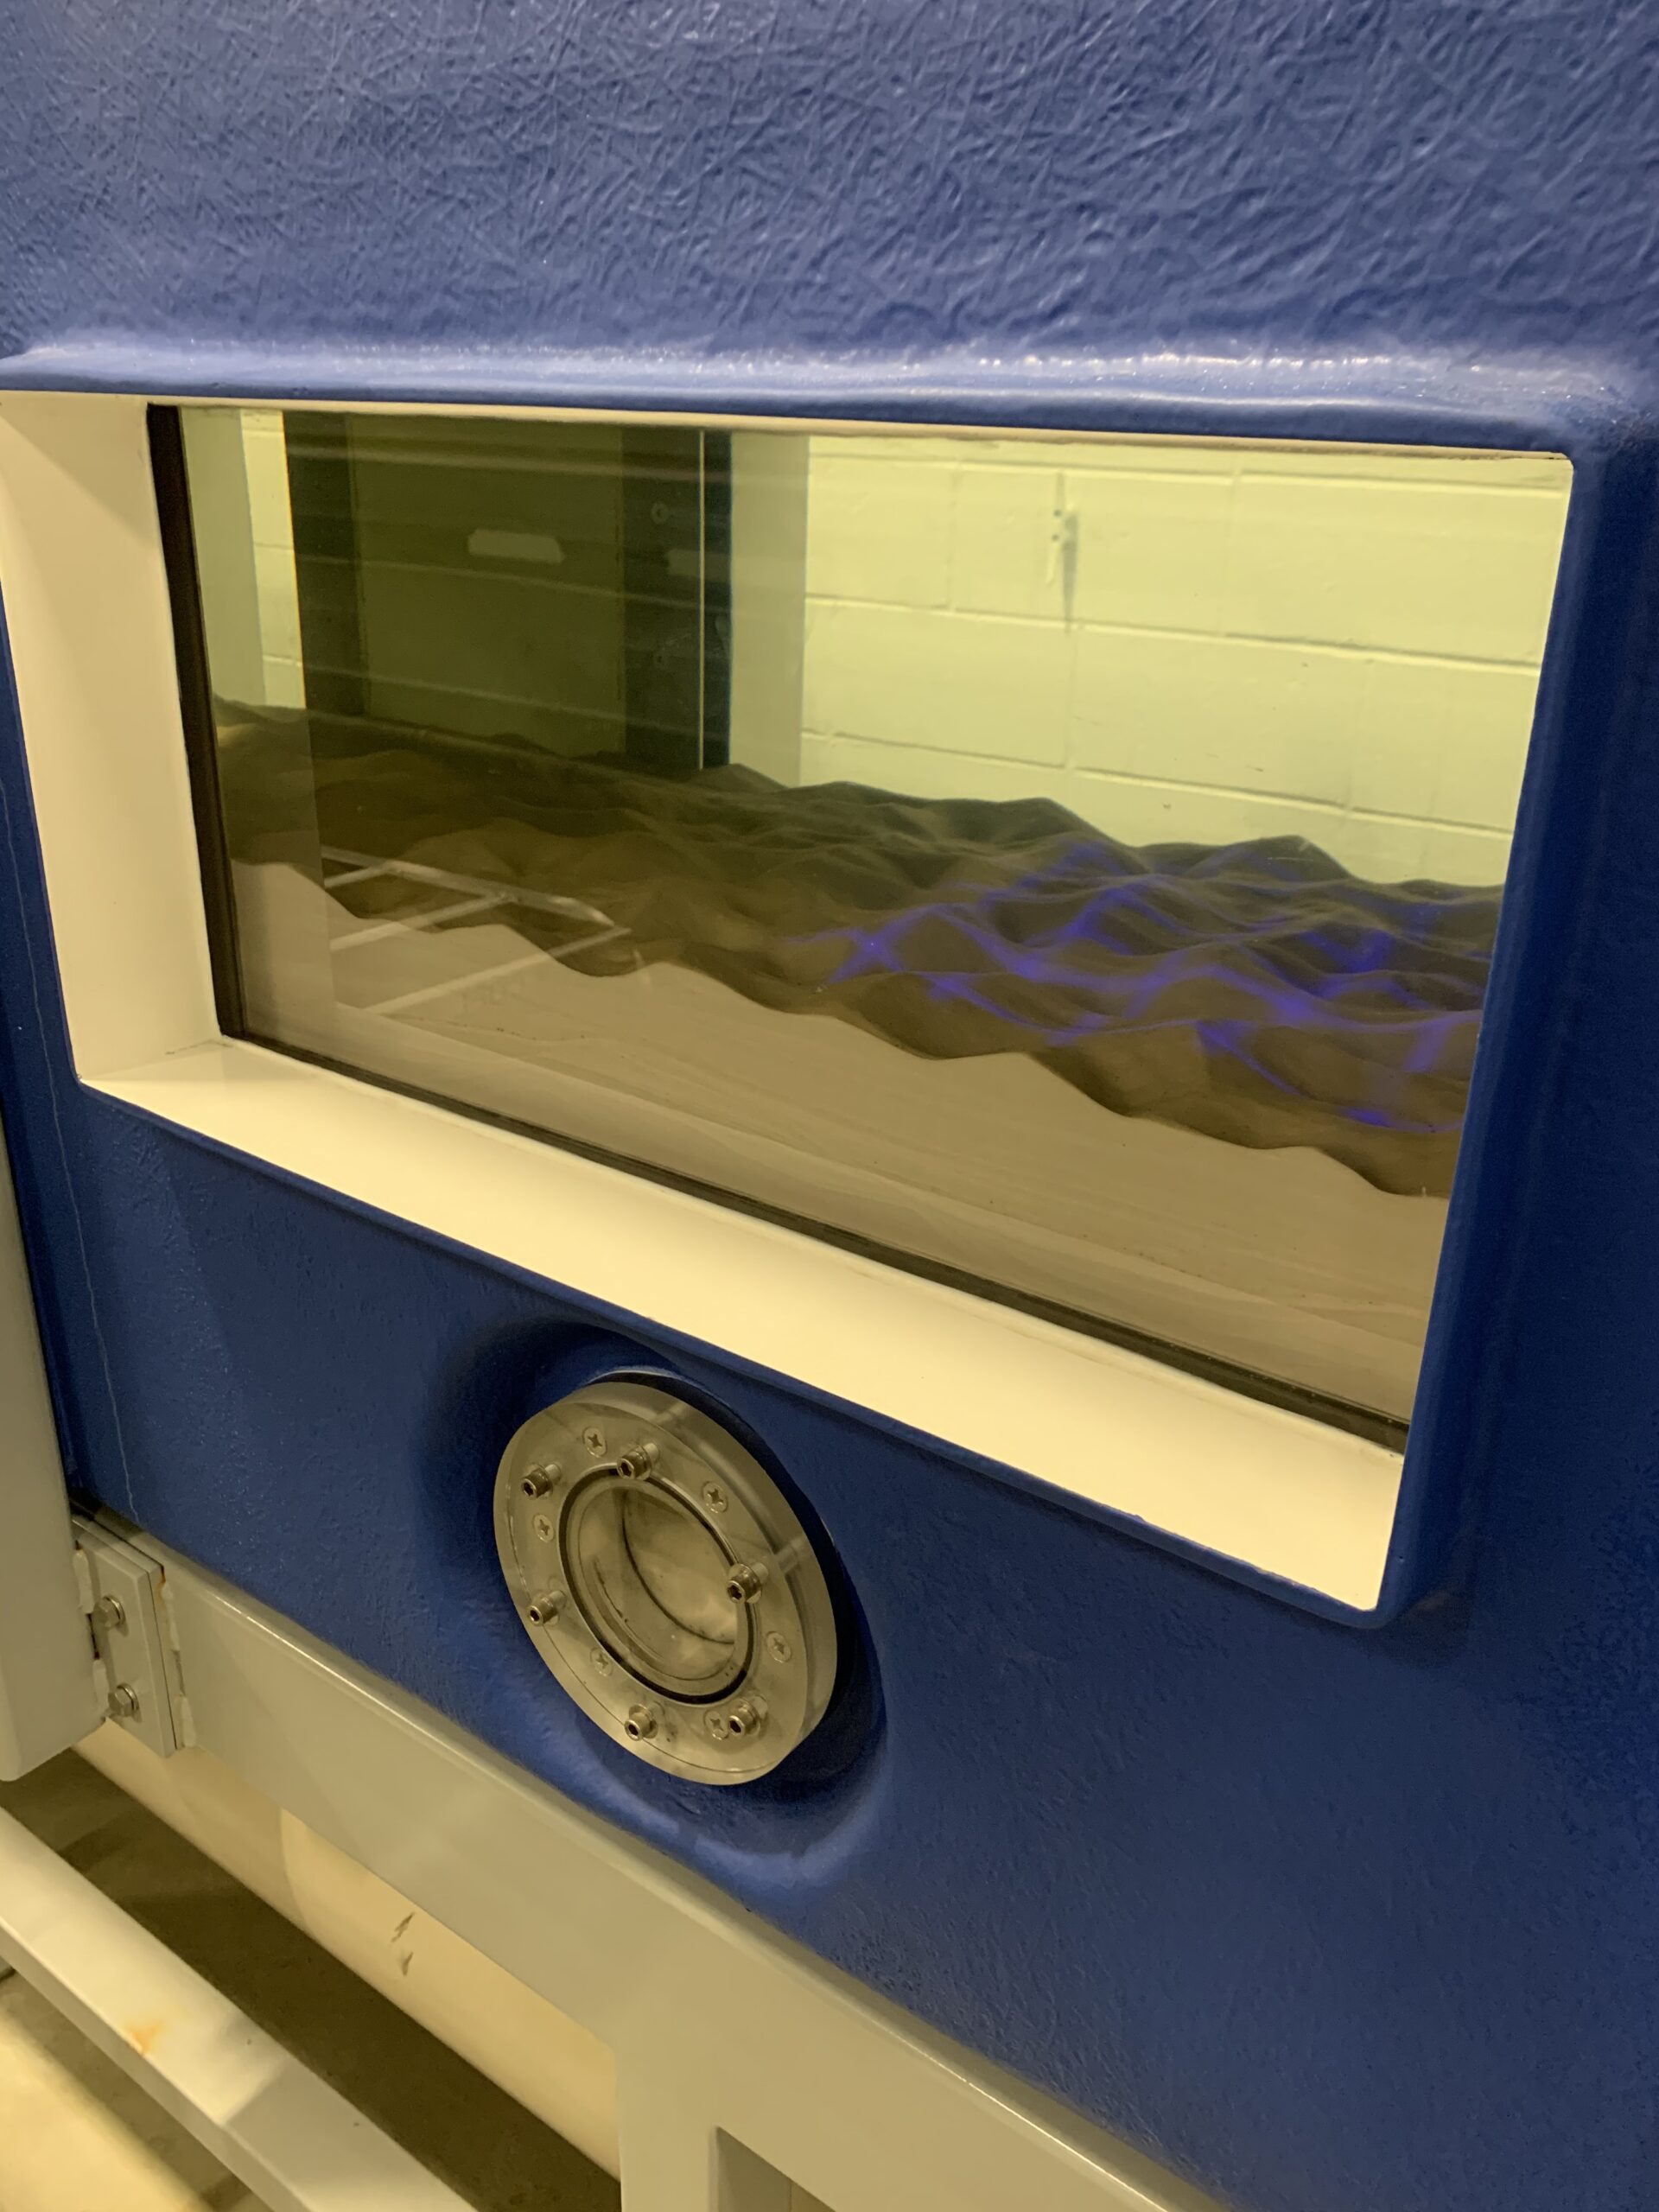
Future Work: Testing in the EFWT, shown in Figures 4-5 with the model oysters and gear types was initially scheduled to take place . The EFWT can produce fully developed mean flows greater than 2 m/s and oscillatory flows with periods ranging from 2 to 12 seconds and velocities of up to 1.5 m/s. The test section of the EFWT is 18 m long, 60 cm wide, and 1 m deep with a 40 cm sediment bed composed of fine-grained sand (d=0.1 mm) allowing gear to be tested in a wide range of realistic environmental conditions. The simulated flows will allow for the direct full-scale simulation of the observed flows from Objective 1. Over the range of hydrodynamic conditions, tunnel simulations will be performed with different gear types and also a gearless suite of bottom mounted oysters of different sizes (to consider the hydrodynamic drag at various life stages). Moreover, the system will allow for an evaluation of the gear under extreme events. The extreme events will be simulated by systematically increasing the mean and wave energy.
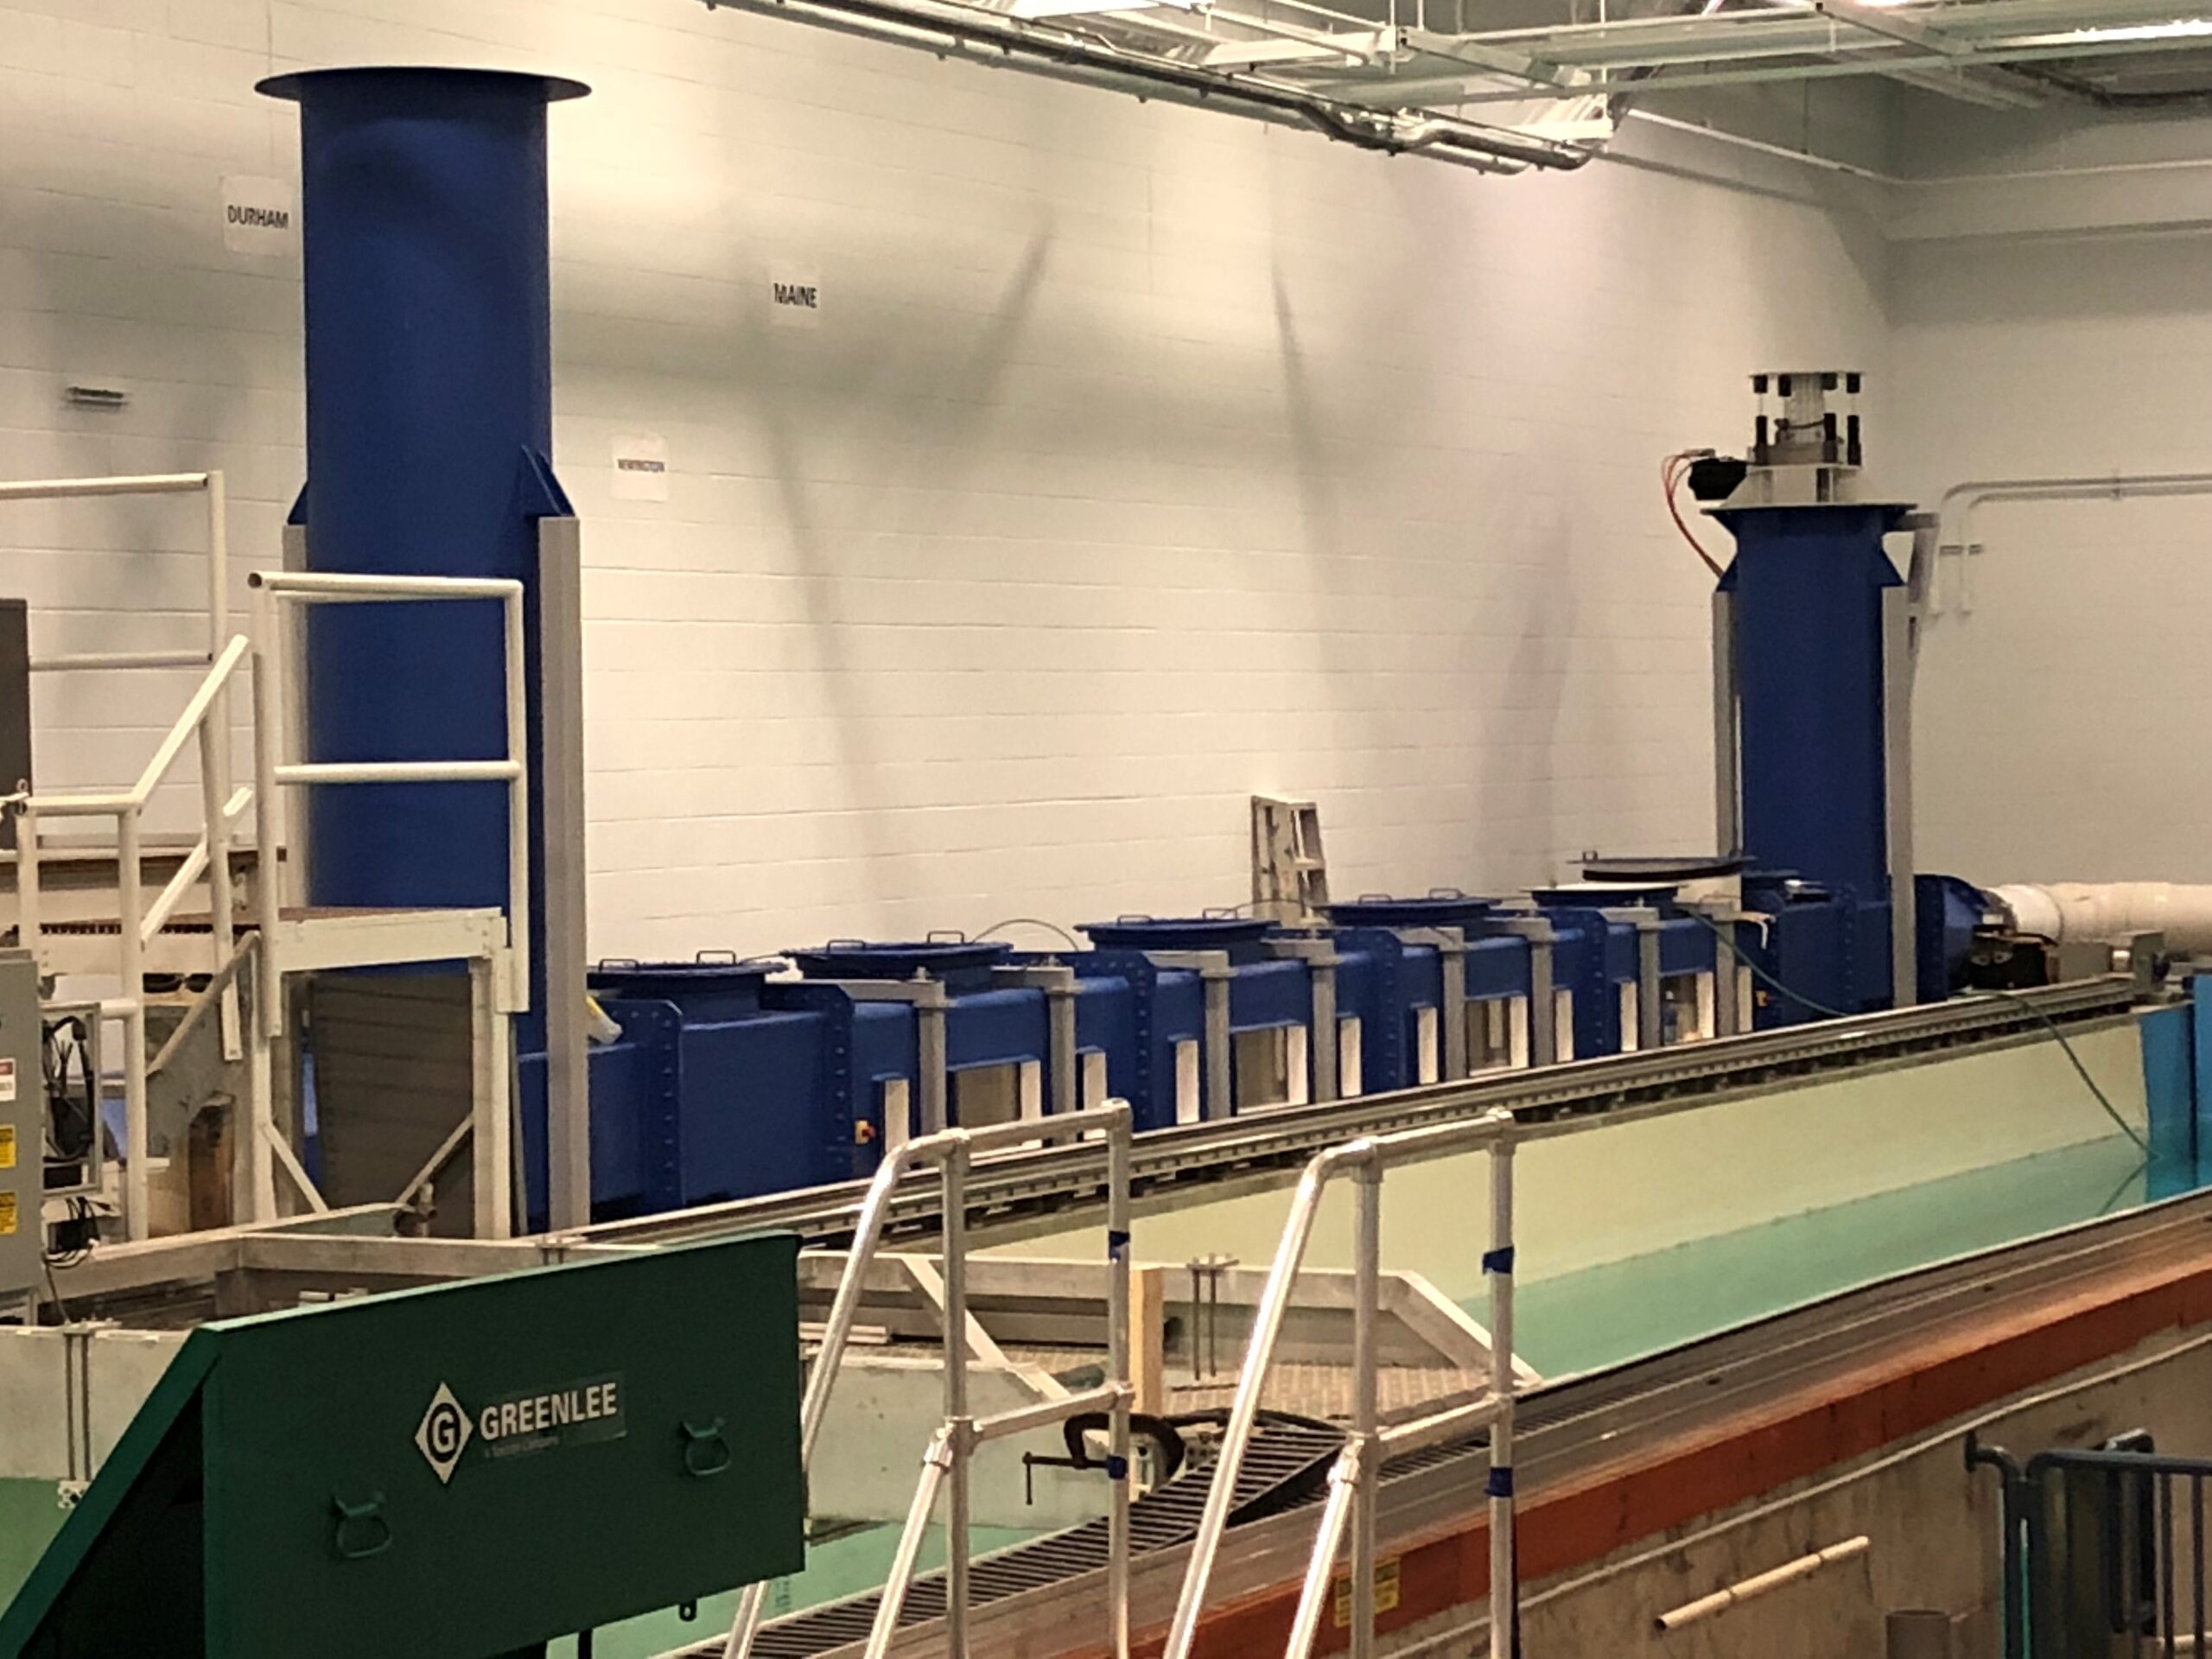
Characterization of the hydrodynamic feedbacks between gear and flow will be measured using Particle Image Velocimetry (PIV) and with a suite of acoustic Doppler velocity profilers. Measurements will be taken up and down stream of the gear placed in the EFWT in order to quantify the effect on flow. Qualitative measures of gear performance can also be readily made based on observation.
Three main deployment strategies will be simulated in this study: gearless, floating mesh bags, and bottom seated cages. Each strategy will be subjected to the same range of flow conditions to allow for direct comparison between gear types and their respective effects on dissipation of wave energy and sediment transport (e.g. shoreline protection and retention). Expected flow regimes will consist of a mean/steady current without waves, wave only (oscillatory) flow, and combined mean current and oscillatory flow. The magnitude of these flows will be determined in Objective 1.
The gearless scenario will consist of model oysters placed in the test section to mimic a natural oyster reef. This scenario will serve two purposes; first, as a control to calibrate the instruments and the flow tunnel, and secondly, it will provide insight on the hydrodynamic feedbacks of a natural oyster reef. Floating mesh bags will be filled with model oysters and placed in the test section and placed in the test section and run through the flow regimes. Similarly, the bottom seated cages will be filled with oyster bags and subjected to the same range of conditions. Each gear type can be tested individually or as an array. Individual tests will be useful for determining the lowest flow that causes gear to move, and arrays of gear will simulate a farm’s overall hydrodynamic effect. Test conditions for each deployment strategy will be run three times to ensure reproducibility.
Simulations will be performed for 5 different mean flows, where the 4th and 5th largest mean currents will simulate the king tide flows likely found in the Great Bay Estuary or due to large riverine flows. Simulations will also be performed for 5 different oscillatory flows where the 3rd highest flow will represent the wave field observed in Barnegat Bay. The 4th and 5th largest oscillatory flows will simulate the extreme conditions. Combined the simulations will provide an evaluation of oyster gear types in variable coastal environmental conditions.
Parameters of interest will be maximum flow conditions associated with storms when gear is most likely to be lost or damaged. Storms events are also associated with larger erosional events due to storm surge, large waves, and higher mean currents. These tests will quantify the highest flow conditions that oysters and typical farming gear can withstand before being carried away as well as their effectiveness at dissipating energy.
Objective 4 methodology: The data from Objective 3 will be used to develop empirical inferences between oyster farm characteristics and coastal resiliency. The time and frequency domain analysis of the data will be used to evaluate the bulk estimates of the energy dissipation provided by the gear. We also have the option of embedding an Inertial Motion Unit within the gear to quantify the gear response to the hydrodynamic forcing. Optical video analysis will allow for identification of the threshold for motion of the gear, groups of gearless oysters, and local sediment transport to the range of mean and wave flows. This information will be used to estimate the hydrodynamic drag, drag coefficient, and potential coastal protection provided by gear and collective gear deployments.
The bulk estimates of hydrodynamic drag from the individual pieces of gear will provide the drag coefficients necessary to estimate the protection provided by an entire farm. The integrated estimates of farm influence will be compared against the observations collected as part of the USACE Rutgers-UNH study. The bulk farm dissipation estimates will be compared against analytical models for energy dissipation due to sandbars and breakwaters.
The findings will be used to understand how large arrays of gear deployed at oyster farms will interact with flow. This can be achieved by the simulations in Objective 3. Based on the results in Objective 3 the extent of shoreline protection provided by different gear types will be estimated by calculating the amount of energy dissipation based on the PIV measurements. Hydrodynamic drag will be estimated by bulk estimates of energy dissipation and momentum upstream and downstream of the gear. Moreover, the hydrodynamic observations will be used to determine the near-oyster nutrient transport which may be used for informing decisions about when to move juvenile oysters to higher energy environments. Also, the simulations will provide insight into significance of mean flows (which can be significant to waste dispersal) relative to waves (which can be more agitative and disruptive to gear). Included in this analysis will be depth dependencies of gear deployment which will roughly define depth ranges where gear will interact with the flow environment. For example, gear in deeper water will dissipate energy differently than if it were close to the surface.
Education & outreach activities and participation summary
Participation summary:
This project will build on collaborative efforts between researchers at the University of New Hampshire and Rutgers University in New Jersey by extending work previously funded by the USACE. The relationship between UNH and Rutgers and their respective Sea Grant organizations will also be leveraged to increase outreach opportunities.
Results from this project will be incorporated into peer reviewed papers and will add valuable experimental data to supplement field observations collected for the purpose of understanding feedbacks between farming activity and the surrounding ecosystem. The USACE issues aquaculture permits based on expectations of local water quality and ecosystem impact. The permitting process does not currently consider the impact on coastal defense, though it is widely acknowledged that the farms can provide shoreline protection. Oyster farms have been shown to provide similar ecological benefits as wild or restored reefs, therefore, based on the results from this study, farms proposed in locations with threatened coastlines could be prioritized.
A goal of this effort is to provide oyster farmers and decision makers with a better understanding of the feedback between oyster farms and coastal ecosystems. We will produce a one-page marketing brief for oyster farmers that communicates the role oyster farms can play in improving coastal ecosystem health and resiliency. Such initiatives will also be discussed at farmer forums and regional collaboratives such as the Piscataqua Region Estuaries Partnership (PREP).
UNH researchers have an active collaboration with the Nature Conservancy and local oyster farmers. These findings will be incorporated into their outreach and public information efforts regarding the value of oyster farms the coastal ecosystems. Moreover, the results will be incorporated into an active outreach program that includes a UNH signature event called Ocean Discovery Day.
Project Outcomes
No project outcomes to date.
From an oyster life cycle perspective, this project examined the role of waves and currents on oyster growth, nutrient fluxes to and from oysters, and the structural stability of farming gear. Based on the results from the field deployments of the BRPT instruments, tentative conclusions about the wave dampening effects of farming gear can be made.