Final report for GNE20-241
Project Information
Cover crops are a common soil health management practice adopted by Delaware farmers who seek to capitalize on ecosystem services like nitrogen (N) fixation, nutrient scavenging, and soil cover. Cover crop termination timing can play a huge role in the level of ecosystem services provided to the following cash crop. Later terminated cover crops are able to establish more above and below ground biomass and, in return, can produce additional root systems that encourage microbial diversity or, in the case of legumes, fix more N. However, later terminated cover crops can inhibit seedling germination by reducing seed to soil contact at planting. We investigated different seeding rates of cover crop mixes to identify which seeding rate provided the most opportunity for ecosystem services from cover crops that did not inhibit the germination of the subsequent cash crop. We used drone imagery to observe and compare cover crop biomass with results from soil N tests. Drone technology can prove to be useful in predicting potential N from its biomass readings and stand counts, which is useful to improve decision making for timing cover crop termination. We shared our findings with farmers, crop consultants, and other researchers through interactive presentations, like ArcGIS Story Map, at Cooperative Extension events such as field days, Delaware Ag Week, or the Mid-Atlantic Crop Management School.
The goal of this project was to use drone imagery to quickly perform stand counts, assess cover crop biomass nitrogen (N) potential, and where cover crop biomass may inhibit corn seed planting and germination.
Objective 1: Use drone technology to capture imagery of the cover crop mixes to approximate biomass and ground cover to help determine potential cover crop N.
Objective 2: Verify the relationship between cover crops biomass and nitrogen content in the research plots by applying it to farmer-planted cover crops.
Objective 3: Improve farmer productivity using rapid drone assessments to determine potential planting issues related to cover crop biomass.
The purpose of this project was to determine if drones could provide rapid information on field-wide cover crop biomass to identify potential planting issues due to cover crop residues and to guide nitrogen (N) management by predicting N availability from cover crop biomass. The N content of cover crop biomass is directly related to various ecosystem services, yet it is hardly ever measured by farmers or researchers due to sampling and analysis expenses (White et al., 2019). Expanding our understanding of N content in cover crop biomass would provide for improved predictions of N needs for the following cash crop, allowing for farmers to use less N fertilizer, which is essential in minimizing environmental impacts (Bundy et al., 1999).
Accumulation of cover crop residue on the soil surface has provided many beneficial services, such as retaining moisture and regulating temperatures (among other services); however, cover crop residue can act as a mechanical barrier to seedling emergence, thereby interfering with development and growth of the cash crop (Kaspar and Erbach, 1998). Residue may also reduce light quality and quantity, soil temperature, and moisture regime (Loydi et al., 2012), all of which are all fundamental in seed establishment. If a cash crop is planted into a dense residue and seedlings are unable to thrive, poor stand and potential need to replant decreases the farmer productivity, increases production costs, and can result in negative environmental impact. Understanding the threshold of cover crop residue density that will not interfere with seed development can help farmers make important early season management decisions that are time and money conducive.
The goal of this project was to integrate consumer drone technology into cover crop scouting to improve productivity while maximizing cover crop effects on soil health. Drones provide quick observations of vegetation conditions and stand densities to provide insight on potential N availability and identify conditions that might deter seedling establishment.
Research
The experiment was conducted at the University of Delaware Carvel Research and Education Center in Georgetown, DE. The experiment included two cover crops and their mixture (rye, clover, and rye/clover mix) and a control (no cover). Each cover crop was seeded into 10 ft × 40 ft plots at four (4) rates (full DE Natural Resources Conservation Service (NRCS) recommended rate, 0.75 full rate, 0.5 full rate, and 0.25 full rate) and replicated three (3) times, with the control also being replicated three times to align with each cover crop. Cover crop planting was performed on October 6th, 2020 and terminated using a herbicide on April 26, 2021.
Objective 1: Use drone technology to capture imagery of the cover crop mixes to approximate biomass and ground cover to help determine potential cover crop nitrogen (N).
Drone imagery of the Carvel research plots was collected using a Matrice 200 drone equipped with a Micasense Altum multispectral camera at 250 feet above ground level with 75% image overlap. Flights were performed bi-weekly in the fall of 2020, once a month in the winter of 2021, and bi-weekly in the spring of 2021 until termination and cash crop planting. At biomass collection, a Phantom4 RGB (i.e. consumer version) drone was also flown to collect normal visual imagery.
Drone images were stitched together using Pix4D photogrammetric software (Prilly, Switzerland). In Pix4D, multispectral imagery was used to create the normalized difference vegetation index (NDVI) and normalized red edge vegetation index (NDRE) from the Altum camera. The visible atmospherically resistant index (VARI) was also produced from the Phantom4 camera. Images from the Phantom4 were stitched on the website Drone Deploy, which is more accessible to the public than Pix4D. The VARI index produced by DroneDeploy will be described as webVARI.
Prior to termination, cover crop biomass (or control plot weeds) was collected from each plot from a 18*18” section. Biomass samples from each plot were composited and oven-dried to a constant mass and then ground. Total carbon (C) and N content was determined by combustion using an Elementar Vario Max CN Analyzer (elementar Americas, Mt. Holly, NJ) at the University of Delaware (UD) Soil Testing lab. Composite soil samples (consisting of 12 soil cores) were be collected from each plot at a depth of eight inches four weeks after corn planting. Soil composites were air-dried prior to being sent to the UD Soil Testing lab. Total N was determined by combustion as described for biomass samples. Soil samples were also analyzed for ammonium-N (NH4) and nitrate-N (NO3) colorimetrically using a Bran & Luebbe AutoAnalyzer 3 (Buffalo Grove, IL; Bran+Luebbe, 1998) following extraction with 2 M KCl solution (1:10 weight:volume) following methods of Mulvaney (1996).
The VARI, NDVI, and NDRE measurements were be correlated to the weight of cover crop biomass, as well as cover crop biomass N and soil N contents using SAS statistical software. Features of cover crop data were also compared in a completely randomized design for each cover crop species (rye, clover, mix) separately.
Objective 2: Verify the relationship between cover crops biomass and nitrogen content in the research plots by applying it to farmer-planted cover crops.
The drone-derived biomass N availability rate curve was created in Microsoft Excel to be compared to three farmer cooperator fields. Participating farmers including a rye/clover mix (Laurel) and two rye cover crop fields (Georgetown and Harbeson). Each field was flown in late March/early April using the Phantom4 drone to produce a VARI map. The VARI map was loaded into ArcGIS and ten zones were created along each VARI gradient for each field. From those zones, ten sample sites were selected where cover crop biomass was later collected. Flights were performed again on the day of biomass collection to have a more accurate representation of drone imagery versus biomass. Cover crops were dried, weighed, and ground before being sent to the UD Soil Testing Lab for C and N analyses. The VARI index from both Pix4D and Drone Deploy was then correlated to the biomass and cover crop N.
Objective 3: Improve farmer productivity using rapid drone assessments to determine potential planting issues related to cover crop biomass.
Corn was planted after termination of our cover crops. At the V3 stage, stand counts were measured by counting the number of alive corn plants in the middle 17.5 feet of each plot and multiplied by 1000 to get plants per acre. Stands were then correlated to the dry weight of biomass density data collected from objective 1.
Cover Crop Planting Rate Curves
Cover crops were planted at their recommended NRCS rates for rye (100 lbs/acre), clover (15 lbs/acre), and their rye & clover mixture (40 and 10 lbs/acre), as well as 0, 25, and 75% of the maximum rate. The biomass produced by the planting rates had a logarithmic best fit, with R2 from 0.88 to 0.97 (Figure 1). Although rates were planted at 25% of their maximum, they still produced significant biomass, enough that a linear relationship couldn’t be established. This is positive news for cover crop planting, as lower rates still perform well, but the variability at each treatment rate could be significant (Figure 1). Biomass for all three treatments averaged 2146 lbs/acre, reaching a maximum of 3995 lbs/acre (Table 1). The C:N ranged from 12 to 43, which is within expected values for rye, clover, and their mixtures. The average nitrogen (N) that could be contributed to corn production was 47 lbs/acre.
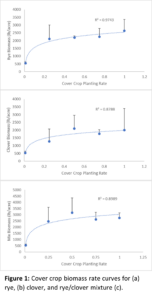
Both rye and mixed cover crops had higher biomass than control plots, but produced similar amounts between 25-100% of the recommended planting rate while no differences were observed across clover (Table 2). The lack of differences in clover is probably related to field variability in the plots, with wet spots and winter kill reducing plot consistency. The total N in the cover crop biomass (lbs N/acre) did not vary among planting rates, and was only higher than the control (weed) plots in rye and mix plots. Clover did have greater total N, but mixing with rye produced similar total N, but a higher C:N ratio (12 vs 20). Soil nitrate and ammonium did not vary by any of the cover crop rates and is not shown here, besides overall averages in Table 1.
Stand counts were made to determine whether cover crop biomass reduced corn emergence and growth, however no differences were observed. This may be due to the fact that total biomass was also similar between rates, outside of the control plots.
Rate Curves and Drone Indexes
Drone indexes observed similar differences in biomass, with NDVI being greater for plots with cover crop in rye and clover plots (Table 2), but not mixes. Differences weren’t detected by NDRE or VARI, but the webVARI was able to differentiate between any rye rate and the control plots.
Since there was a lot of variability in cover crop survival and biomass per treatment, data was combined to see if drone indexes would correlate to all biomass samples (Table 3). Besides the Pix4D Phantom4 VARI index, the other indexes had significant positive correlations to all plot biomass, with WebVARI having the strongest correlation. When biomass was turned into total N (lb/acre) in the cover crops, all indexes were significantly correlated, with NDRE, NDVI, and WebVARI all above 0.8 (Table 3). This probably represents the measurement of plant productivity that imagery picks up, versus leaf area index and plant height that biomass represents. As more farmers will be interested in the N availability in cover crops, and not just biomass, this is a positive result.
|
Table 1: Cover crop properties including N content and drone vegetation index values. |
||||||
|
Variable |
N |
Mean |
Std Dev |
Sum |
Minimum |
Maximum |
|
Biomass (lb/acre) |
39 |
2146 |
932 |
83698 |
396 |
3995 |
|
Biomass N (%) |
39 |
2.58 |
2.30 |
100.74 |
1.04 |
16.03 |
|
Biomass C (%) |
39 |
41.90 |
6.85 |
1634.00 |
3.43 |
47.20 |
|
Biomass C:N |
39 |
21.48 |
6.87 |
837.86 |
12.10 |
42.76 |
|
N (lb/acre) |
39 |
47.16 |
26.26 |
1839.00 |
5.35 |
114.37 |
|
Soil C:N |
39 |
12.28 |
0.85 |
478.90 |
9.70 |
14.10 |
|
Soil NH4 |
37 |
1.20 |
1.23 |
44.42 |
0.13 |
7.61 |
|
Soil NO3 |
39 |
13.61 |
6.41 |
530.60 |
0.13 |
35.80 |
|
NDRE |
39 |
0.13 |
0.02 |
5.03 |
0.10 |
0.17 |
|
NDVI |
39 |
0.34 |
0.10 |
13.41 |
0.20 |
0.56 |
|
VARI |
39 |
0.00 |
0.02 |
0.10 |
-0.02 |
0.05 |
|
WebVARI |
39 |
0.09 |
0.07 |
3.32 |
-0.03 |
0.26 |
|
Table 2: Biomass (lb/acre), N content (lb/acre) and drone vegetation indexes for each treatment and planting rate. |
||||||
|
Biomass (lb/acre) |
N (lb/acre) |
|||||
|
Rate |
Rye |
Clover |
Mix |
Rye |
Clover |
Mix |
|
0x |
536.6 b |
536.6 |
536.63 b |
10.2 b |
10.24 |
10.24 b |
|
0.25x |
2109.6 a |
1276.3 |
2471.6 a |
37.7 a |
43.55 |
57.61 a |
|
0.5x |
2193.4 a |
2101.1 |
3168.7 a |
35.6 a |
61.58 |
72.41 a |
|
0.75x |
2248.8 a |
1767.5 |
2632.1 a |
36.0 a |
52.89 |
59.22 a |
|
1x |
2637.7 a |
2006 |
2749.9 a |
46.2 a |
61.58 |
58.50 a |
|
p-value |
0.0097 |
0.1988 |
0.0186 |
0.02 |
0.2346 |
0.1082 |
|
NDVI |
NDRE |
|||||
|
Rate |
Rye |
Clover |
Mix |
Rye |
Clover |
Mix |
|
0x |
0.222 b |
0.222 b |
0.222 |
0.111 |
0.111 |
0.111 |
|
0.25x |
0.267 a |
0.313 ab |
0.37 |
0.115 |
0.123 |
0.132 |
|
0.5x |
0.281 a |
0.4200 a |
0.385 |
0.115 |
0.143 |
0.136 |
|
0.75x |
0.269 a |
0.4155 a |
0.416 |
0.12 |
0.138 |
0.144 |
|
1x |
0.292 a |
0.4311 a |
0.399 |
0.121 |
0.145 |
0.134 |
|
p-value |
0.1043 |
0.0946 |
0.1816 |
0.5835 |
0.3467 |
0.4035 |
|
VARI |
WebVARI |
|||||
|
Rate |
Rye |
Clover |
Mix |
Rye |
Clover |
Mix |
|
0x |
-0.004 |
-0.004 |
-0.004 |
-0.019 b |
-19 |
-0.019 |
|
0.25x |
-0.009 |
0.004 |
0.003 |
0.053 a |
0.049 |
0.100 |
|
0.5x |
-0.011 |
0.022 |
0.006 |
0.059 a |
0.119 |
0.145 |
|
0.75x |
-0.012 |
0.022 |
0.003 |
0.047 a |
0.117 |
0.128 |
|
1x |
-0.014 |
0.022 |
0.003 |
0.059 a |
0.136 |
0.124 |
|
p-value |
0.2026 |
0.3083 |
0.8105 |
0.0059 |
0.1785 |
0.1286 |
 Drone derived indexes also correlated to soil N and C measurements. As reflectance from cover crops makes up most of the drone imagery, this may be more of a sign of overall soil fertility. Soils with higher N or C may be more productive, increasing cover crop biomass, and therefore reflectance in each drone index. This was in opposition to cover crop tissue C and N, which did not correlate to drone indexes very well until they were converted to C:N, with each correlation being negative. So that as drone index values increase, C:N, and therefore mineralizable N availability, decreases.
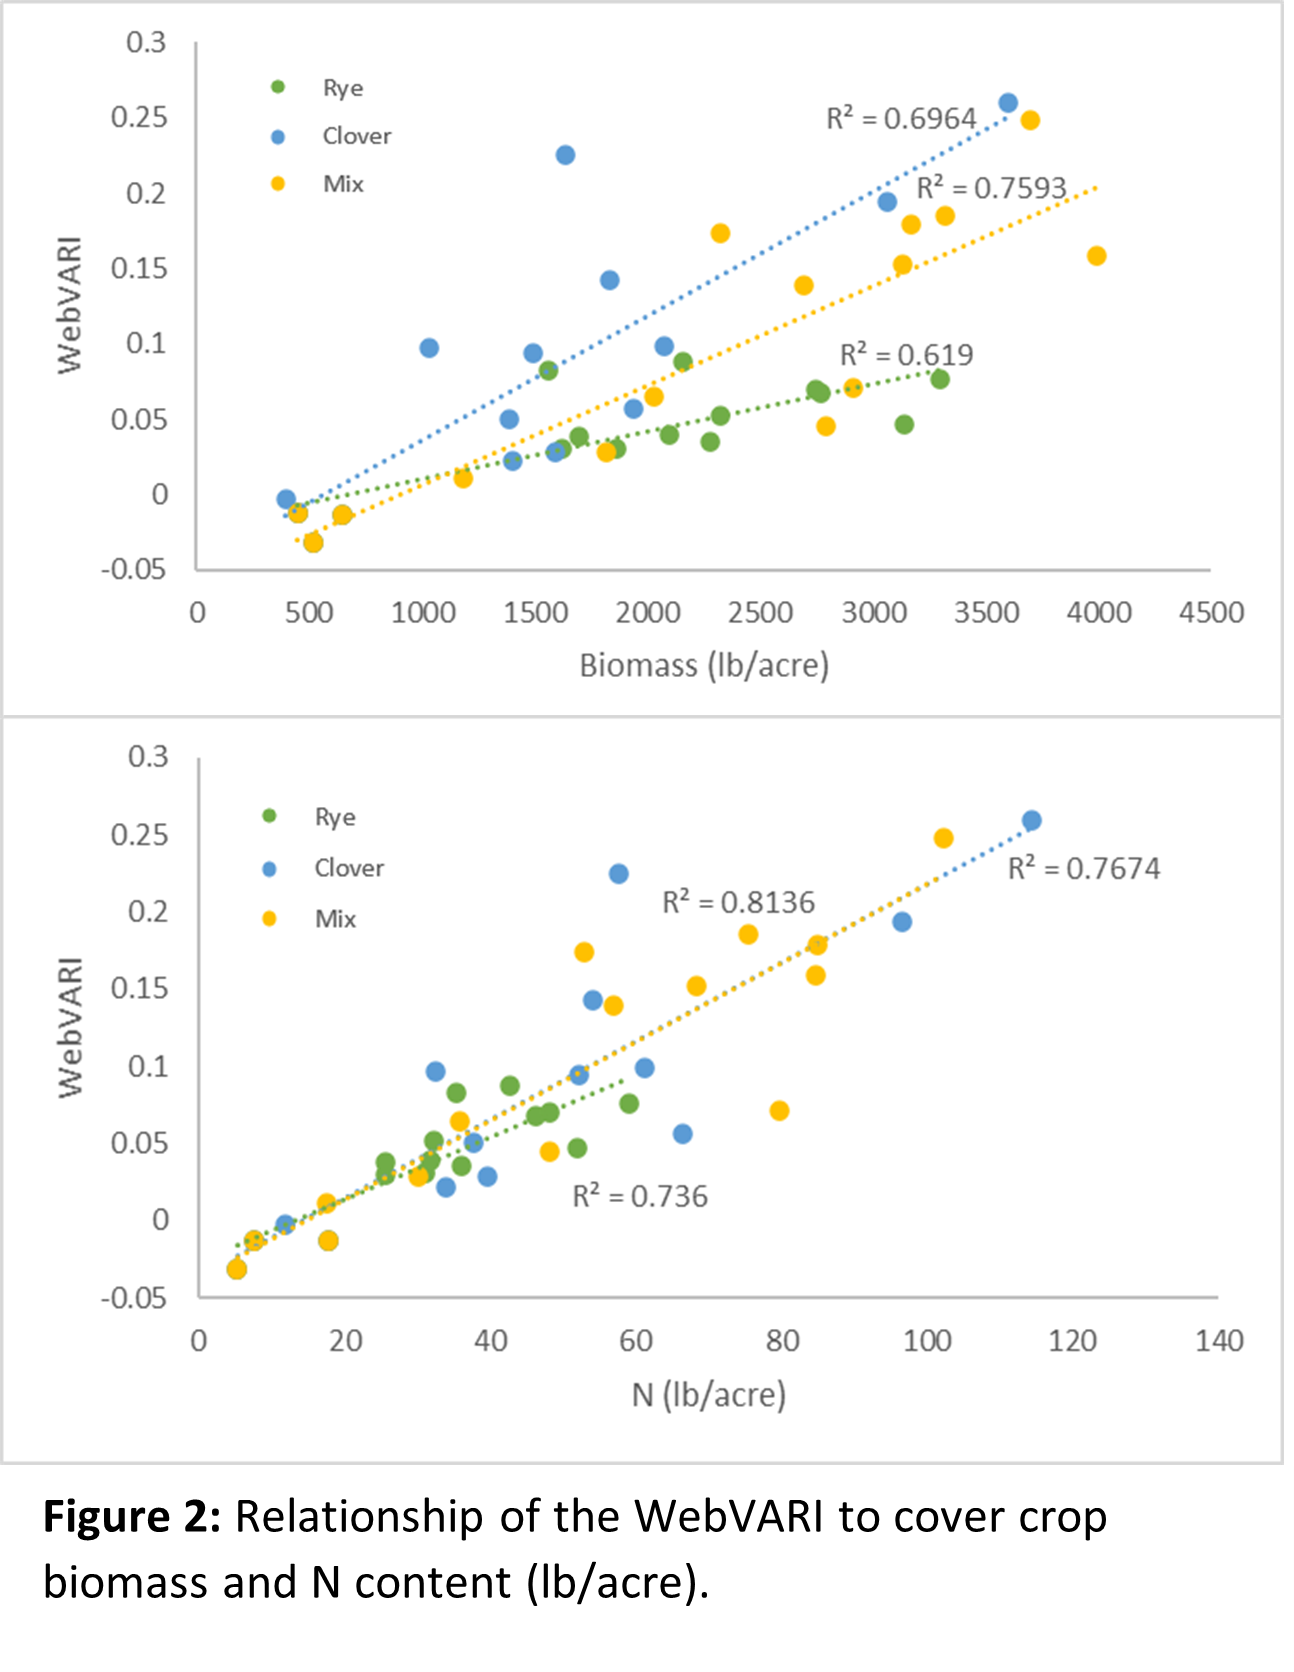
Another example of how N content of the tissue increases drone index predictive power can be found in Figure 2. In this case the webVARI index is being compared to all biomass measurements in each cover crop treatment. While biomass has respectable R2 with a linear fit, the conversion of biomass to N content (lbs/acre) improved all relationships. This figure also displays the difference each cover crop type may have in curve fit and the algorithm produced to predict biomass in other fields, which may not be repeatable year to year.
| Table 3: Correlation coefficients between cover crop, soil, and drone index values. | |||||
|
Biomass |
NDRE |
NDVI |
VARI |
WebVARI |
|
|
Biomass |
- |
0.57 |
0.54 |
0.21 |
0.68 |
|
- |
*** |
*** |
NS |
**** |
|
|
N (lb/acre) |
0.84 |
0.81 |
0.80 |
0.59 |
0.87 |
|
**** |
**** |
**** |
**** |
**** |
|
|
NDRE |
0.57 |
- |
0.97 |
0.82 |
0.94 |
|
*** |
- |
**** |
**** |
**** |
|
|
NDVI |
0.54 |
0.97 |
- |
0.86 |
0.95 |
|
*** |
**** |
- |
**** |
**** |
|
|
VARI |
0.21 |
0.82 |
0.86 |
- |
0.77 |
|
NS |
**** |
**** |
- |
**** |
|
|
WebVARI |
0.68 |
0.94 |
0.95 |
0.77 |
- |
|
|
**** |
**** |
**** |
**** |
- |
|
SoilN |
SoilC |
SoilCN |
NH4 |
NO3 |
|
|
Biomass |
0.40 |
0.40 |
0.27 |
0.26 |
0.30 |
|
** |
** |
* |
NS |
* |
|
|
N (lb/acre) |
0.46 |
0.46 |
0.22 |
0.34 |
0.32 |
|
*** |
*** |
NS |
** |
** |
|
|
NDRE |
0.48 |
0.49 |
0.27 |
0.32 |
0.22 |
|
*** |
*** |
* |
* |
NS |
|
|
NDVI |
0.39 |
0.40 |
0.22 |
0.21 |
0.15 |
|
** |
** |
NS |
NS |
NS |
|
|
VARI |
0.28 |
0.29 |
0.08 |
0.26 |
0.02 |
|
* |
* |
NS |
NS |
NS |
|
|
WebVARI |
0.47 |
0.48 |
0.32 |
0.28 |
0.18 |
|
|
*** |
*** |
** |
0.0947 |
NS |
|
TissueN |
TissueC |
TissueCN |
|||
|
Biomass |
-0.03 |
0.19 |
-0.03 |
- | - |
|
NS |
NS |
NS |
- | - | |
|
N (lb/acre) |
-0.07 |
0.29 |
-0.51 |
- | - |
|
NS |
* |
*** |
- | - | |
|
NDRE |
0.15 |
0.08 |
-0.53 |
- | - |
|
NS |
NS |
*** |
- | - | |
|
NDVI |
0.16 |
0.08 |
-0.58 |
- | - |
|
NS |
NS |
**** |
- | - | |
|
VARI |
0.26 |
-0.06 |
-0.62 |
- | - |
|
0.1054 |
NS |
**** |
- | - | |
|
WebVARI |
0.10 |
0.15 |
-0.49 |
- | - |
|
NS |
NS |
** |
- | - | |
Cover Crops Over the Winter Growing Season
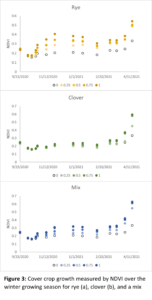
Another useful aspect of using a drone is the ease and frequency at which data can be collected. The dataset in Figure 3 represents NDVI from fall planting until biomass harvest. Although treatment differences for rye were not observed at biomass harvest, there was consistent separation between rye treatments and the control until winter temperatures (and possible soil saturation) decreased the highest cover crop rate. Past February 2020, all rye plots appear to grow at the same rate, and the standard rate never pulled above the 25-75% rates. Clover, on the other hand, never had significant growth until late March, at least which NDVI could detect. This may be useful information to Delaware farmers, who could possibly cut their application rates 25%, but only represents one year of data.
Farmer Field Results
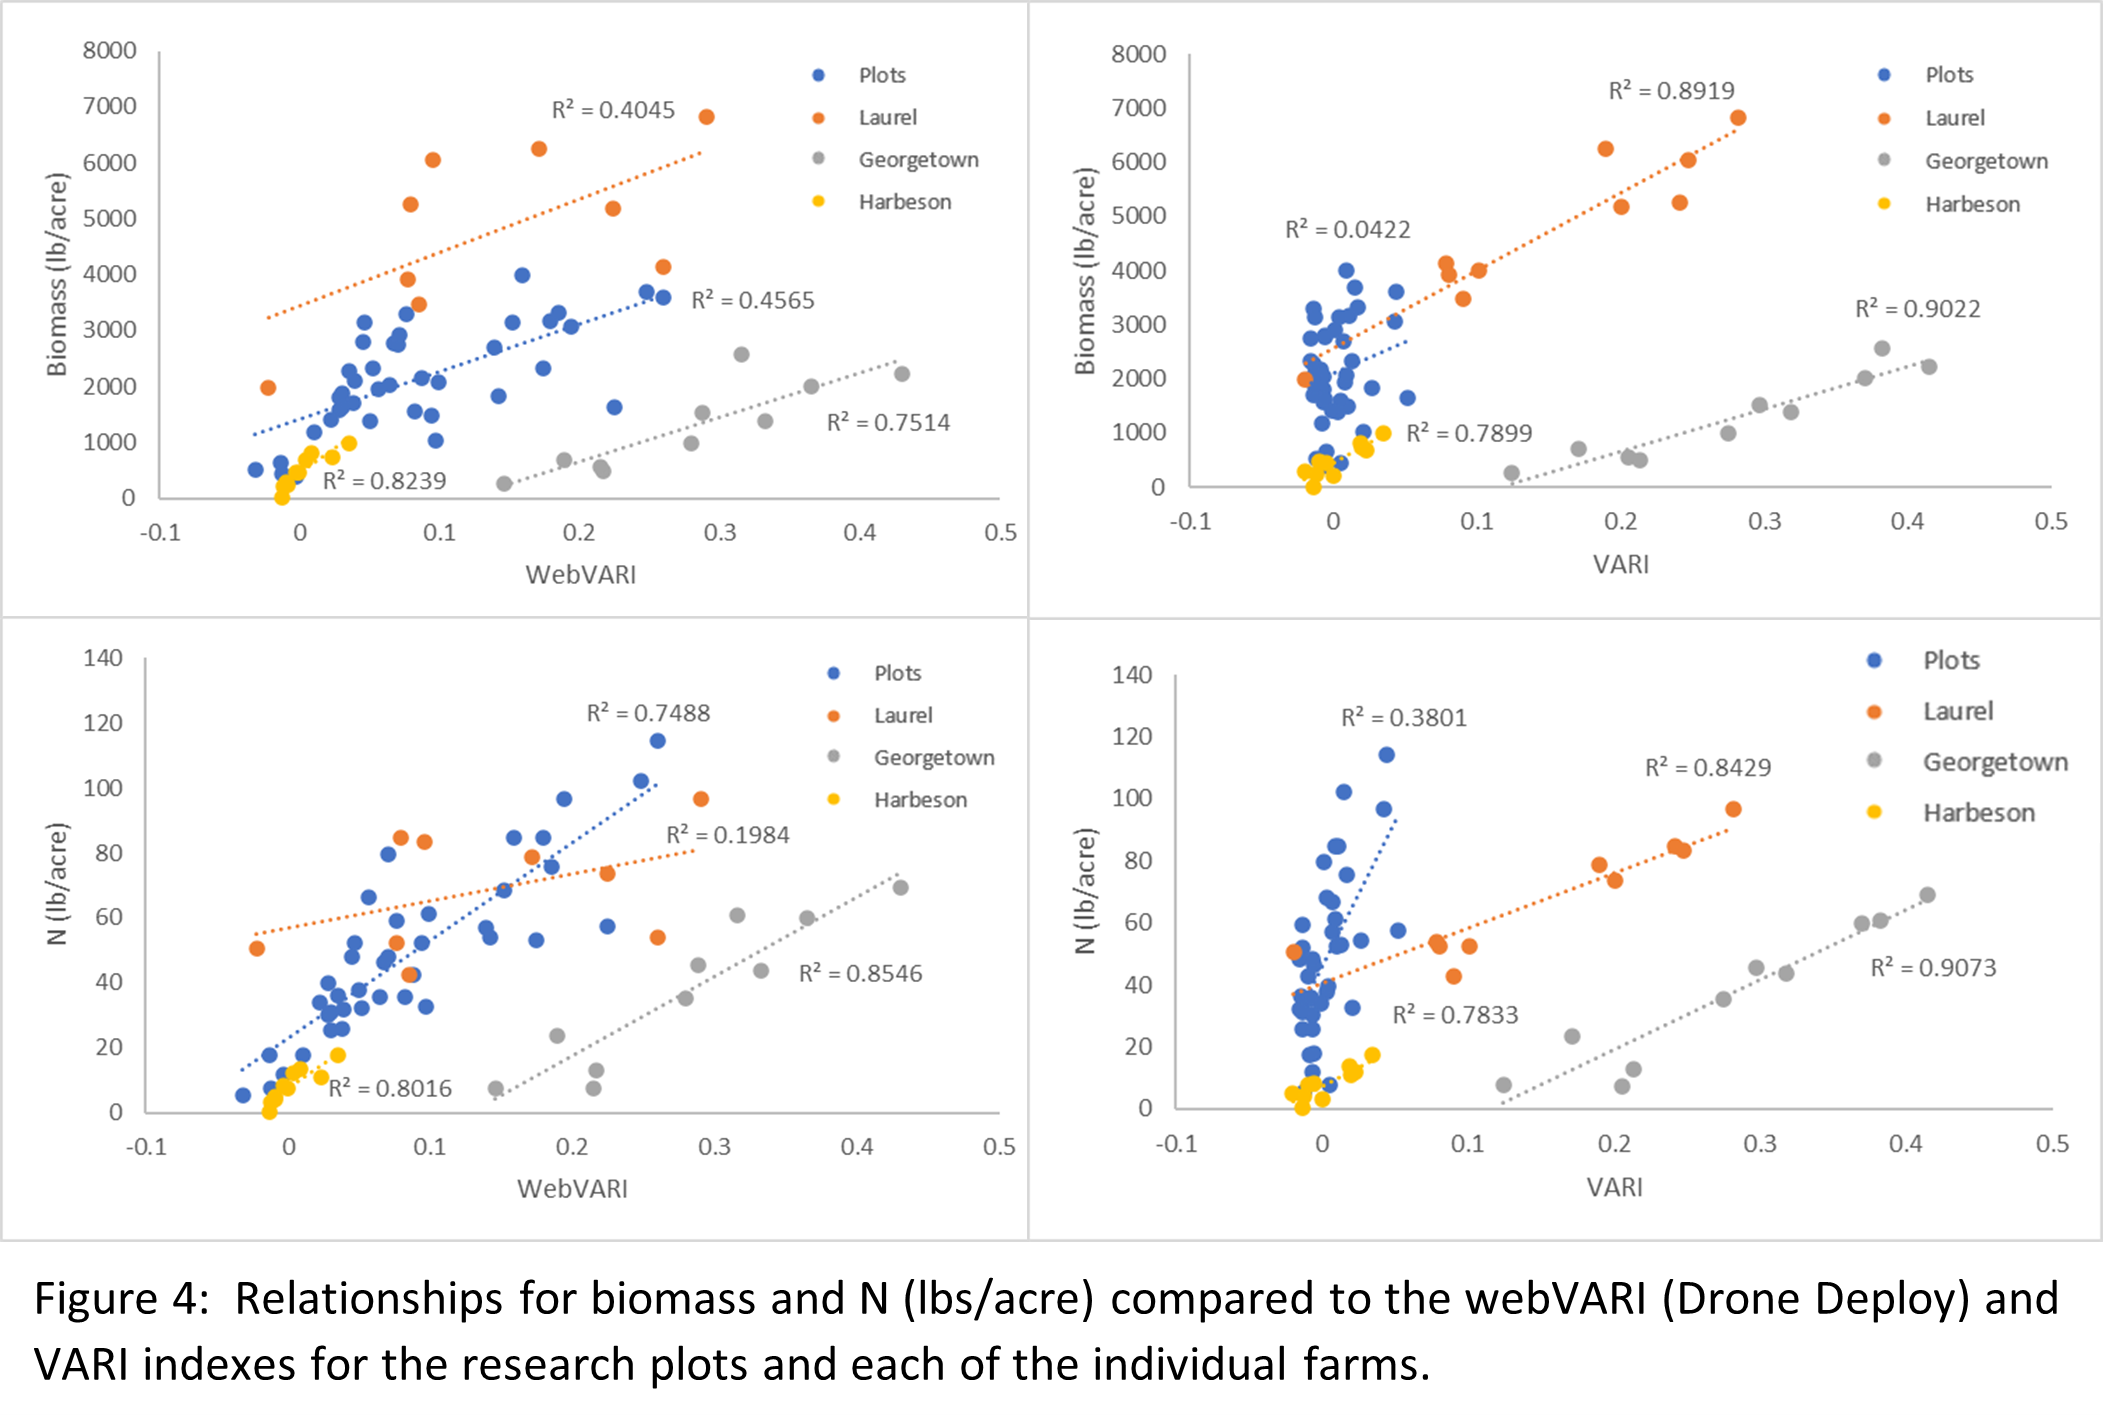
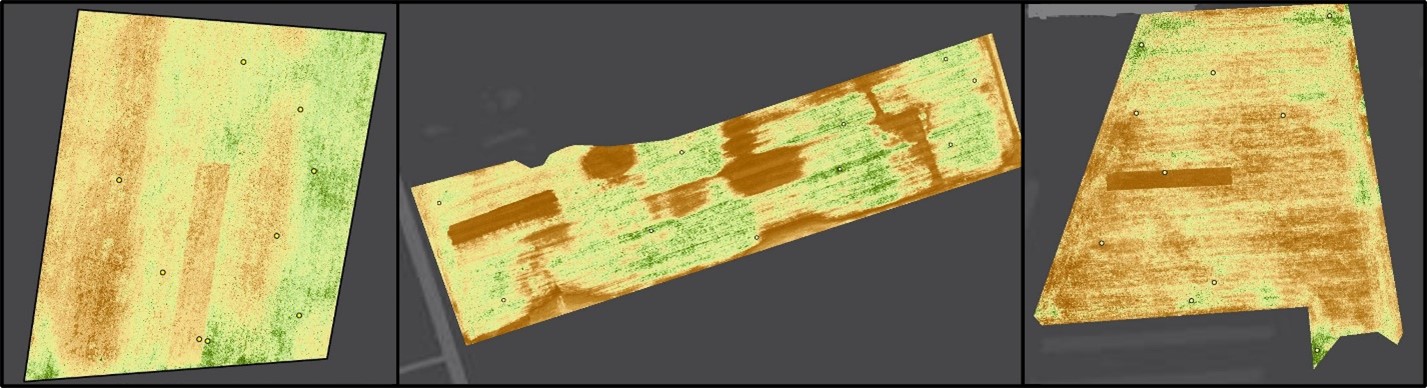
Most farmers and consultants will have access to more affordable consumer drones and web-based software, so predictive curves were compared using the Phantom4 and the VARI and webVARI data (Figure 4). For the research plots and the two rye (Georgetown, Harbeson) and one rye clover mix (Laurel), a different relationship was found in every field. Biomass from the research plots could not reliably predict biomass in any of the farmers’ fields, due to variability in cover crop planted, timing of sampling and varying field properties. However, flights on each farmer field still had a good relationship to biomass sampled (Figure 4), with R2 ranging from 0.78 to 0.90. While one year of rate curve plots at our research station did not yield a reliable prediction, field variability was uncovered through drone images. Flights could be performed prior to burn-down to predict cover crop biomass, although it would still require image stitching and biomass sampling to provide a realistic baseline. Still, a drone (or satellite) map could provide sampling points, similar to zone soil sampling, that help predict potential benefits (e.g. nitrogen) to the following corn or soybean crop.
Additional analyses of correlation coefficients between drone derived indexes and cover crop biomass were also strong for all three fields. The webVARI index had correlations from 0.64 to 0.91, while the VARI index ranged from 0.89 to 0.95 (data not shown). Similar results were observed when comparing N (lbs/acre), with values of N prediction only dropping for Laurel vs biomass, possibly because it was a mix of rye and clover, with uneven clover growth.
Producing biomass curves by planting different rates of cover crops was not successful, as winter conditions and soil properties created a lot of variability between replications. However, when all biomass was transformed into nitrogen (N) (lbs/acre), relationships improved. This helps display the dual nature of imagery, showing both overall plant growth, as well as the field conditions (N availability) that allow for better growth.
Poor rate curve production did not help predict cover crop biomass in farmers’ fields, however individual flights in each field were successful at creating their own biomass and vegetation index relationships. For farmers hoping to precision map available N, drone or satellite photos combined with minimal tissue sampling may allow for a better understanding of cover crop N availability.
Education & outreach activities and participation summary
Participation summary:
Initial results and methods from this project were shared through the virtual Agronomy Day presented by the University of Delaware Extension on January 20, 2021. This meeting was presented online to 163 individual attendees (including farmers, ag service providers, and government agencies) to discuss the reasons for monitoring cover crop biomass and the potential benefits from using drones to predict biomass and its subsequent nitrogen content.
An ESRI storymap was also created at the beginning of the project to outline the purpose of the project in an easily digestible webpage. This storymap (https://arcg.is/14OqCv) was updated through the project with the addition of our results on mapping cover crop nitrogen.
Outreach on cover crop termination and crop protection were shared on the University of Delaware Weekly Crop Update (http://extension.udel.edu/weeklycropupdate/) in the spring of 2021, which reaches more than 1000 readers in the Mid-Atlantic region. Following project completion, articles discussing both biomass measurements and field nitrogen mapping were shared through both the Weekly Crop Update and the Delaware Agronomy Blog (https://sites.udel.edu/agronomy/).
A field day was held at the Carvel Research and Education Center in Georgetown, DE in August 2021. Eight participants, including local farmers, government agents, and extension personnel were educated in the results of the project and the benefits of cover crops to soil health and cash crop production.
Final results from this project will also be shared at the UD Agronomy Day in January 2022 and a research article for the University of Maryland Extension Agronomy newsletter.
Project Outcomes
Working with our farmer collaborators, they were able to see how field variability in cover crop growth should change their expectations of potential N gains from legumes. Walking a field does not have the same affect as aerial imagery, which clearly showed you can't expect the same amount of cover crop growth, and therefore N cycling, across the field. In the future, this could provide better mapping of N cycling (or weed suppression) for precision agriculture applications.
We have discussed with farmers the potential N provided by cover crops in the past, but seeing the predicted N from cover crops in the drone maps opened our eyes to the amount of variability. To promote sustainable agriculture practices to farmers, we need accurate knowledge and predictions so they will manage and benefit from cover crops.
We learned that it was difficult to simulate different rates of cover crop biomass in plots. We should have planted higher and lower rates to maybe produce a better rate curve, but that may also have not been successful. It was interesting to see how farmers fields still had good predictions of biomass. So we learned that field variability produces enough biomass changes that a drone could map it. This fall another project that observes cover crop planting rates and drone imagery will be started to build off of these project results.