Final report for GNE21-250
Project Information
Agricultural management practices have been successfully used to promote soil health and to achieve multiple positive environmental outcomes, such as improving water quality. However, the climate change mitigation impacts of these best management practices (BMPs) are less well known, particularly regarding their impacts on CO2 and N2O emissions. No-till is a BMP that can increase soil health, reduce farming costs, and enhance soil carbon sequestration, thus offsetting CO2 emissions, but there is also evidence that no-till can produce more N2O emissions than conventional tillage in certain conditions. Similarly, manure injection, a BMP for manure application that can be used in no-till systems, provides agronomic and environmental benefits, including nitrogen retention and reduced manure runoff, but it can also produce more CO2 and N2O emissions than surface application of manure. There are multiple factors that could explain why manure injection increases CO2 and N2O emissions relative to surface application, and these factors may interact with changes in soil structure that result from no-till to enhance or diminish these fluxes. Therefore, through a lab-based incubation, we measured CO2 and N2O emissions after injecting manure into aggregates of two different size classes as well as homogenized soil (i.e., aggregate structure destroyed) to examine the factors that influence GHG emissions when no-till and manure injection are combined. We found that soil structure type on its own did not alter daily N2O fluxes and only slightly influenced daily CO2 fluxes, but manure injection did increase emissions compared to the unamended control. However, while neither CO2 nor N2O fluxes varied by soil structure type for most of the incubation, differences in N2O fluxes among the manure-amended 0.25-2 mm aggregates, 2-4 mm aggregates, and homogenized soil became more pronounced in the last 4 d of the experiment, with the homogenized soil having larger N2O fluxes than either aggregate size class. Thus, this study provides evidence that BMPs that promote soil aggregation may contribute to net N2O emissions reduction after manure injection. However, because we only observed this trend for a short period within our incubation, a longer duration experiment may further illuminate how this relationship changes over time.
This project was conducted as two experiments.
Experiment 1: Measuring N2O fluxes in response to manure injection into soils of different aggregate size classes as well as into homogenized (non-aggregated) soil
Objective 1: Quantify N2O emissions in response to manure injection into soils of different aggregate size classes.
Hypothesis: N2O emissions will be greatest from the largest soil aggregates and decrease as aggregate size also decreases because larger aggregates will be sufficiently aerobic (oxygenated) to prevent complete denitrification (which requires anaerobic, or oxygen depleted, conditions) of N2O to N2, while smaller, more anaerobic aggregates will favor complete denitrification of NO3- to N2 and thus produce fewer N2O emissions.
Objective 2: Quantify the role of aggregates in producing N2O emissions after manure injection by comparing N2O fluxes from intact macroaggregates to N2O fluxes from homogenized soil (i.e., no aggregates).
Hypothesis: N2O fluxes will be higher from intact macroaggregates than homogenized soil because the intra-aggregate pore space within macroaggregates will serve as important anaerobic microsites for N2O generation.
Objective 3: Quantify net nitrogen mineralization in response to manure injection into soils of different aggregate size classes.
Hypothesis: There will be no difference in ammonium (NH4+) concentrations across treatments, but NO3-concentrations will be higher in soil with larger aggregates, as denitrification (which reduces NO3- to N2 and N2O) rates will be lower in these more oxygenated soils.
Experiment 2: Measuring potential denitrification activity of soils of different aggregate size classes as well as homogenized (non-aggregated) soil
Objective 1: Quantify potential denitrification activity of aggregates of different size classes and of homogenized soil.
Hypothesis: There will be greater potential denitrification activity in the smaller aggregates due to their smaller intra-aggregate pore space limiting oxygen diffusion into the aggregate and thus favoring anaerobic conditions. This potential will decrease with increasing aggregate size. Potential denitrification activity will be lowest in the homogenized soil due to its lack of intra-aggregate pore space.
Agricultural management practices have been successfully used to promote soil health and to achieve multiple positive environmental outcomes, such as improving water quality. However, the climate change mitigation impacts of these best management practices (BMPs) are less well known, particularly regarding their impacts on CO2 and N2O emissions. BMPs adopted for their contributions to soil health, runoff prevention, and/or carbon sequestration have been shown to produce greater (e.g., Dittmer et al., 2020; Duncan et al., 2017) or lower (e.g., Gregorich et al., 2006) CO2 and N2O emissions. A better understanding of how and why BMPs impact these emissions is thus required to adequately account for their contributions to or mitigation of climate change.
No-till and manure injection are being increasingly promoted as BMPs, but these practices have variable impacts on GHG emissions. No-till can increase soil health (Nunes et al., 2018), reduce farming costs (Creech, 2017) and enhance soil carbon sequestration, thus offsetting CO2 emissions (Nicoloso & Rice, 2021; Sundermeier et al., 2011). While the USDA Natural Resources Conservation Service incentivizes no-till because it reduces greenhouse gases (USDA NRCS, n.d.), there is also evidence that no-till can produce more N2O emissions than conventional tillage in certain conditions (Rochette, 2008; Rochette et al., 2008a). Similarly, manure injection, a BMP for manure application that can be used in no-till systems, provides agronomic and environmental benefits, including nitrogen retention and reduced manure runoff (Maguire et al., 2011). However, manure injection can also produce more CO2 and N2O emissions than surface application of manure (Dittmer et al., 2020; Duncan et al., 2017; Phan et al., 2012; Rodhe et al., 2006), although N2O emissions are especially variable and can change with manure application timing and soil moisture levels throughout the growing season (Cambareri et al., 2017; Clemens et al., 1997; Dittmer et al., 2020; Sadeghpour et al., 2018).
Multiple factors could explain why manure injection increases CO2 and N2O emissions relative to surface application, and these factors may interact with changes in soil structure that result from no-till to enhance or diminish these fluxes. Soil aggregates are a key component of soil structure and are made of mineral particles held together by organic binding agents (Tisdall & Oades, 1982). In general, no-till tends to increase the formation of soil macroaggregates relative to conventionally tilled soils (Fernández et al., 2010). Soil aggregates play an important role in soil carbon sequestration by making carbon less accessible for microbial decomposition (Blanco-Canqui & Lal, 2004). Yet soil aggregates may also be important generators of N2O emissions via denitrification due to the creation of anaerobic conditions within intra-aggregate pore space (Wang et al., 2019). Manure injection may enhance N2O production in aggregates by simultaneously adding moisture and readily decomposable carbon via manure slurry directly into subsurface soils, creating conditions favorable for denitrification, which is enhanced by high soil moisture, high temperature, low soil oxygen, and high NO3- and carbon availability (Bremner, 1997; Butterbach-Bahl et al., 2013; Linn & Doran, 1984; Luo et al., 1999; Paul & Beauchamp, 1989; Stanford et al., 1975; Vallejo et al., 2005; Wallenstein et al., 2006; Xue et al., 2013).
However, there is uncertainty surrounding the relationship between soil structure and N2O production. There can be distinct environments among aggregate types, as the rate at which gases, water, and substrates (i.e., nitrogen and carbon compounds) diffuse into and out of aggregates depends on aggregate size (Wang et al., 2019). Small aggregates generally have small intra-aggregate pores (Dexter, 1988; Wang et al., 2019) that limit oxygen diffusion into the aggregate and favor denitrification (Wang et al., 2019). Indeed, Uchida et al. (2008) observed higher NO3- consumption in small (0-1.0 mm) versus larger aggregates, suggesting that denitrification was higher in the small aggregates. Furthermore, Sey et al. (2008) found that denitrification dominated N2O production in aggregates <0.25 mm, while nitrification dominated N2O production in aggregates >0.25 mm. (Nitrifiers use nitrite (NO2-) as an electron acceptor when oxygen is limiting, resulting in the production of N2O (Bollmann & Conrad, 1998; Bremner, 1997; Smith et al., 2003).) However, higher denitrification rates do not always translate to more N2O emissions. In smaller, more anaerobic aggregates, there may be more complete denitrification of N2O to N2 (Uchida et al., 2008). In fact, most studies on this topic have reported a positive relationship between aggregate size and N2O emissions (Wang et al., 2019), suggesting that larger aggregates, despite their lower denitrification potential, may produce more N2O, perhaps because of a combination of less complete denitrification of N2O to N2 as well as production of N2O from nitrification.
The purpose of this project was to examine the factors that influence CO2 and N2O emissions from agricultural soils when no-till and manure injection are combined. We aimed to build upon previous work on the relationship between aggregate size and GHG emissions to inform possible climate outcomes of combining manure injection with no-till and other soil health promoting practices. Through a lab-based incubation, we measured CO2 and N2O emissions after injecting manure into aggregates of two different size classes as well as homogenized soil (i.e., aggregate structure destroyed). For CO2, we hypothesized that emissions would be greatest in the homogenized soil, as aggregate disruption would provide enhanced access to soil organic carbon, but that emissions would be comparable for the two aggregate size classes. For N2O, we hypothesized that emissions would be greater for the larger aggregates due to enhanced oxygen diffusion into the intra-aggregate pore space compared to the smaller aggregates, allowing for incomplete denitrification, while the homogenized soil would have the lowest N2O emissions due to a lack of anaerobic microsites.
To our knowledge, no study has specifically examined the interaction between aggregate size and manure injection, although previous results suggest that aggregates may allow the development of microsites that promote N2O production (Adair et al., 2019). Overall, we aimed to contribute to a broader understanding of the benefits and tradeoffs of combinations of BMPs, as well as a better understanding of the mechanisms driving agricultural N2O emissions.
Cooperators
- (Researcher)
Research
Experiments 1 and 2: Site description (All Objectives)
We collected soil for this study from an ongoing trial established in 2011 at Borderview Research Farm in Alburgh, VT (45.005° lat., −73.308° long.). The objective of the trial is to assess the impact of corn cropping systems on overall soil health and crop productivity, and practices used in the trial include conventional tillage, cover cropping, and long-term no-till. Each treatment plot is 6 m x 15.2 m (20 ft x 50 ft) and is replicated four times. Soils are Amenia silt loam with a 0-2 percent slope with an average of 3.72% organic matter, 2.49% total carbon, 0.265% total nitrogen, and aggregate stability of 61.5% (2020).
All treatments received fertilizer at a rate of 64 kg N ha-1 before planting, 22 kg N ha-1 during corn sowing, and 103 kg N ha-1 (with urease inhibitor ContaiN Max) as topdress about a month after planting. Chemical weed control was also applied annually to the no-till plots shortly after planting.
We collected soil by digging a 40 cm2 by 15 cm deep pit at a random location within each no-till corn plot on 7 Oct 2021, after corn had been harvested. There was minimal crop residue remaining in the plots at the time of soil collection because the corn was grown for silage and the no-till plots were not planted with cover crops.
Experiments 1 and 2: Soil processing and incubation setup (All Objectives)
We air dried the soil for 2 weeks and then sieved it into two aggregate size categories: 2-4 mm and 0.25-2 mm. We also homogenized a portion of the 2-4 mm aggregates using a coffee bean grinder, for a total of three soil structure treatments: 0.25-2mm aggregates, 2-4 mm aggregates, and homogenized. We then carefully poured aggregate and homogenized soil into PVC cores (6 cm o.d., 5.5 cm i.d., 20 cm long) at a consistent bulk density (0.83 g cm-3). The bottoms of the PVC cores were closed with air-tight PVC caps before adding soil. There were 12 replicates of each soil structure type. Half of these received manure applications and half were left unamended as controls, for a total of 36 cores (six replicates per soil structure by manure treatment). At the time of core packing, we placed a wide straw at the center of each core and poured the soil around the straw (Fig. 1). The straw was later used to inject manure within the soil profile of each manure-amended core but was also placed in controls for consistency (Fig. 2).
We placed each core in a glass Ball jar (1.9 L, 24 cm tall), and we loosely covered each jar with polyethylene film to maintain moisture levels but allow oxygen exchange. We stored the jars at 20 ºC in incubation chambers for 7 d before adding manure and water. We did not add water at the time of core packing.
For the manure-amended cores, we poured 25 mL of liquid dairy manure (0.069 kg N; Table 1) into the straw while slowly lifting it out of the soil to allow manure slurry to seep into the core. We added distilled water to the manure-amended cores to achieve the same gravimetric moisture content (21%) as the fresh soil we collected in the field. Because the manure slurry was mostly water (Table 1), the final gravimetric moisture content of the manure-amended cores was 29% (35% WFPS). We then added distilled water to the control cores to achieve an equivalent moisture content as the manure-amended cores (29%). In total, soils were incubated for 14 d at 20 ºC in incubation chambers. On day six of the incubation, we weighed soil cores to assess moisture loss and added water (1-10 mL, depending on the jar) to return the cores to their original moisture contents. Except when measuring fluxes or adding water, we kept jars in the incubation chambers and loosely covered each jar with polyethylene film to maintain moisture levels but allow oxygen exchange.
After completing the incubation experiment (Experiment 1), we collected soil from each PVC core to subsequently measure the denitrification potential of the soil used in each treatment (Experiment 2; see below).
Table 1. Manure characteristics
|
Dry matter, % |
Organic N, kg L-1 |
NH4-N, kg L-1 |
Total N, kg L-1 |
|
5.19 |
1.89 |
0.86 |
2.76 |
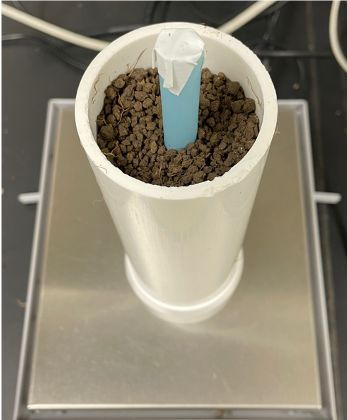
Figure 1. PVC core filled with 2-4 mm aggregates before the start of the 14 d incubation. The straw was used to inject manure into the soil for the manure treatment (Fig. 2) or to add water to the soil for the control treatment.
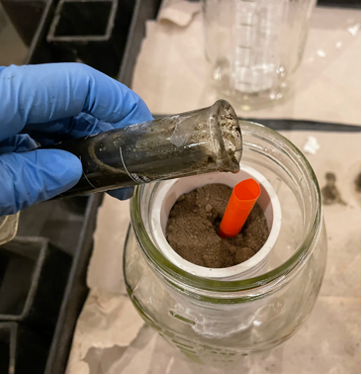
Figure 2. Dairy manure slurry being poured into soil using a wide straw to simulate manure injection at the start of the 14 d incubation. We slowly lifted the straw while pouring in the manure so that the manure was distributed vertically within the soil profile.
Experiment 1: Nitrous oxide and carbon dioxide measurements (Objectives 1 and 2)
We used a photoacoustic gas monitor (Model 1412i, Innova Air Tech Instruments, Ballerup, Denmark; calibrated as in Iqbal et al., 2013) to measure changes in CO2 and N2O concentration for 14 d following manure injection (Fig. 3). At the time of sampling, we fanned each jar for about 30 seconds to mix the jar headspace with ambient air before placing an air-tight lid fitted with two butyl rubber septa on each jar. We then measured initial gas concentrations immediately after lid deployment and again either 24 h (for first 3 d of experiment) or 3-4 h later. On day 3, we measured gas concentrations twice: at 24 h to complete the measurement period that was started on day 2, and then again 3-4 h after we flushed the jars and redeployed each lid. As a result, we report 15 different measurement days, even though the incubation only lasted for 14 d. We recorded 2-3 replicates of CO2 and N2O concentration at each gas measurement time point and averaged the replicates when performing flux calculations.
We calculated CO2 and N2O fluxes as follows:
Where F is CO2 or N2O flux (mg CO2-C kg soil-1 h-1 or µg N2O-N kg soil-1 h-1); ΔC/Δt is change in CO2 or N2O over time (µmol mol-1 h-1); ρ is the volume of 1 mole of gas at 20 ºC and 0.101 MPa, the conditions under which the photoacoustic gas monitor measures gas concentration (1 mol/24.04 L); V is the jar headspace volume, with the soil core volume subtracted (1.4 L); M is the molecular weight of CO2 or N2O (0.044010 mg µmol-1 or 0.044013 mg µmol-1), α is the ratio of C in CO2 or N in N2O (12.01/44.01 or 28.01/44.01), and s is the dry weight of soil in each jar (1/296.8 ± 0.18 kg across all jars).
We calculated cumulative CO2 and N2O emissions for each jar with the pracma package in R (Borchers, 2022; R Studio Team, 2020), which uses trapezoidal integration of the CO2 and N2O fluxes over time.
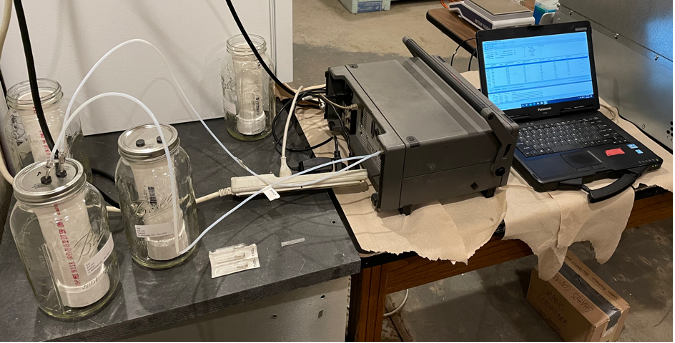
Figure 3. Measuring N2O and CO2 concentrations using a photoacoustic gas monitor during the 14 d incubation.
Experiment 1: Soil analyses (Objective 3)
At the start and end of the incubation, we extracted inorganic N using 2 M KCl and 5 g of soil from each jar, and we later measured NO3- and NH4+ concentrations using colorimetric methods. We also measured total carbon and nitrogen at the start and end of the experiment by combusting oven-dried soil (48 hours at 60 ºC) in an elemental analyzer (UNICUBE, Elementar, Ronkonkoma, NY).
Experiment 1: Statistical analysis (Objectives 1 and 2)
We used linear mixed effects models to determine differences in daily and cumulative CO2 or N2O fluxes by soil structure type (0.25-2 mm aggregates, 2-4 mm aggregates, and homogenized soil). Both daily N2O and CO2 were log-transformed to address heteroscedasticity in model residuals, and we used a variance structure to allow different variances by incubation day. For the CO2 daily flux model, the predictors were manure application (manure injection or unamended control), soil structure type, and day, and for the N2O daily flux model, the predictors were manure application, soil structure type, day, and CO2. For the cumulative CO2 emissions model, the predictors were soil structure type and manure application, and for the cumulative N2O emissions model, the predictors were soil structure type, manure application, and cumulative CO2. Jar was included as a random effect in all models.
Experiment 2: Measuring denitrification enzyme activity
Denitrification enzyme activity (DEA) was measured by blocking the activity of nitrous oxide reductase using acetylene, as described by Tiedje (1994). This activity describes potential denitrification, since ideal conditions for denitrification are created in the lab using an anaerobic environment and by adding required substrates.
Soils used in the two-week incubation experiment (Experiment 1) were kept in a fridge for 5 weeks after the competition of the incubation and before being used in the DEA experiment. We twice sampled 25 g of fresh soil from each soil core previously used in the incubation to create two sets of jars: one set to be combined with acetylene and another without acetylene as a method control, for a total of 72 jars. We placed each soil sample in a glass Ball jar (500 mL) and covered the jar with an air-tight lid fitted with a butyl rubber septum. We stored covered jars in a fridge (1-4 d of storage) before conducting the DEA measurements. We carried out the DEA measurements over the course of 3 d, with 24 jars used on each day. We divided each group of 24 jars into two batches: one group of 12 that included acetylene inhibition and one group of 12 that did not.
Immediately before beginning measurements on a batch of 12 jars, we added a nutrient solution consisting of 1 mM potassium nitrate (KNO3) and 1 mM glucose to each jar. After substrate addition, each jar was repetitively evacuated (3 min) and flushed with N2 gas (1 min) four times to create a low-oxygen atmosphere that inhibited nitrification (an aerobic process). If the batch was part of the acetylene-inhibited group, we then added 50 mL acetylene gas (i.e., to create a 10% acetylene atmosphere) to one jar at a time, immediately beginning sampling of each jar (i.e., collecting a T0 sample) after acetylene addition. Every 30 min for 90 min, we collected a 10 mL gas sample from each jar using a polypropylene syringe and immediately stored the sample in a 6 mL pre-evacuated glass vial (Labco, Lampeter, United Kingdom). We kept all jars on low speed on a shaker between collecting gas samples.
Ten weeks later, we measured N2O concentrations at each time point using a GC-2014 Gas Chromatograph (GC) (Shimadzu Instruments, Kyoto, Japan) equipped with a flame ionization detector (FID), electron capture detector (ECD), and a Hayesep N 80/100 Mesh 1/8in X 1.5M stainless pre-conditioned column. Potential denitrification was calculated as micrograms N2O-N g dry soil-1.
The methods we used to measure DEA did not produce workable results, but we did not have sufficient resources to repeat this experiment. Therefore, only the results for Experiment 1 are presented in this final report.
We found that soil structure type on its own did not alter daily N2O fluxes (p = 0.1847) and only slightly influenced daily CO2 fluxes (p = 0.0428), but manure injection did increase emissions compared to the unamended control (p < 0.0001; Table 2; Fig. 4). Likewise, cumulative N2O and CO2 emissions were higher with manure injection (p < 0.0001) and minimally impacted by soil structure type (p = 0.0176 and p = 0.0318; Table 3; Fig. 5). However, while neither CO2 nor N2O fluxes varied by soil structure type for most of the incubation, differences in N2O fluxes among the manure-amended 0.25-2 mm aggregates, 2-4 mm aggregates, and homogenized soil became more pronounced in the last 4 d of the experiment (day x soil structure type p = 0.0029; Fig. 4b).
Table 2. Analysis of variance results (p-values) for daily CO2 and N2O flux rates from all soil structure types. Treatment significance was assessed using F tests.
|
Predictor |
CO2 |
N2O |
|
Manure |
< 0.0001 |
< 0.0001 |
|
Soil structure type |
0.0428 |
0.1847 |
|
Manure x Soil structure type |
0.0013 |
0.4085 |
|
Day |
< 0.0001 |
< 0.0001 |
|
Day x Soil structure type |
< 0.0001 |
0.0029 |
|
Day x Manure |
< 0.0001 |
< 0.0001 |
|
Daily CO2 |
- |
< 0.0001 |
Table 3. Analysis of variance results (p-values) for cumulative CO2 and N2O emissions from all manure-amended soil structure types. Treatment significance was assessed using F tests.
|
Predictor |
CO2 |
N2O |
|
Manure |
< 0.0001 |
< 0.0001 |
|
Soil structure type |
0.0318 |
0.0176 |
|
Manure x Soil structure type |
0.0083 |
0.5733 |
|
Cumulative CO2 |
- |
0.0067 |
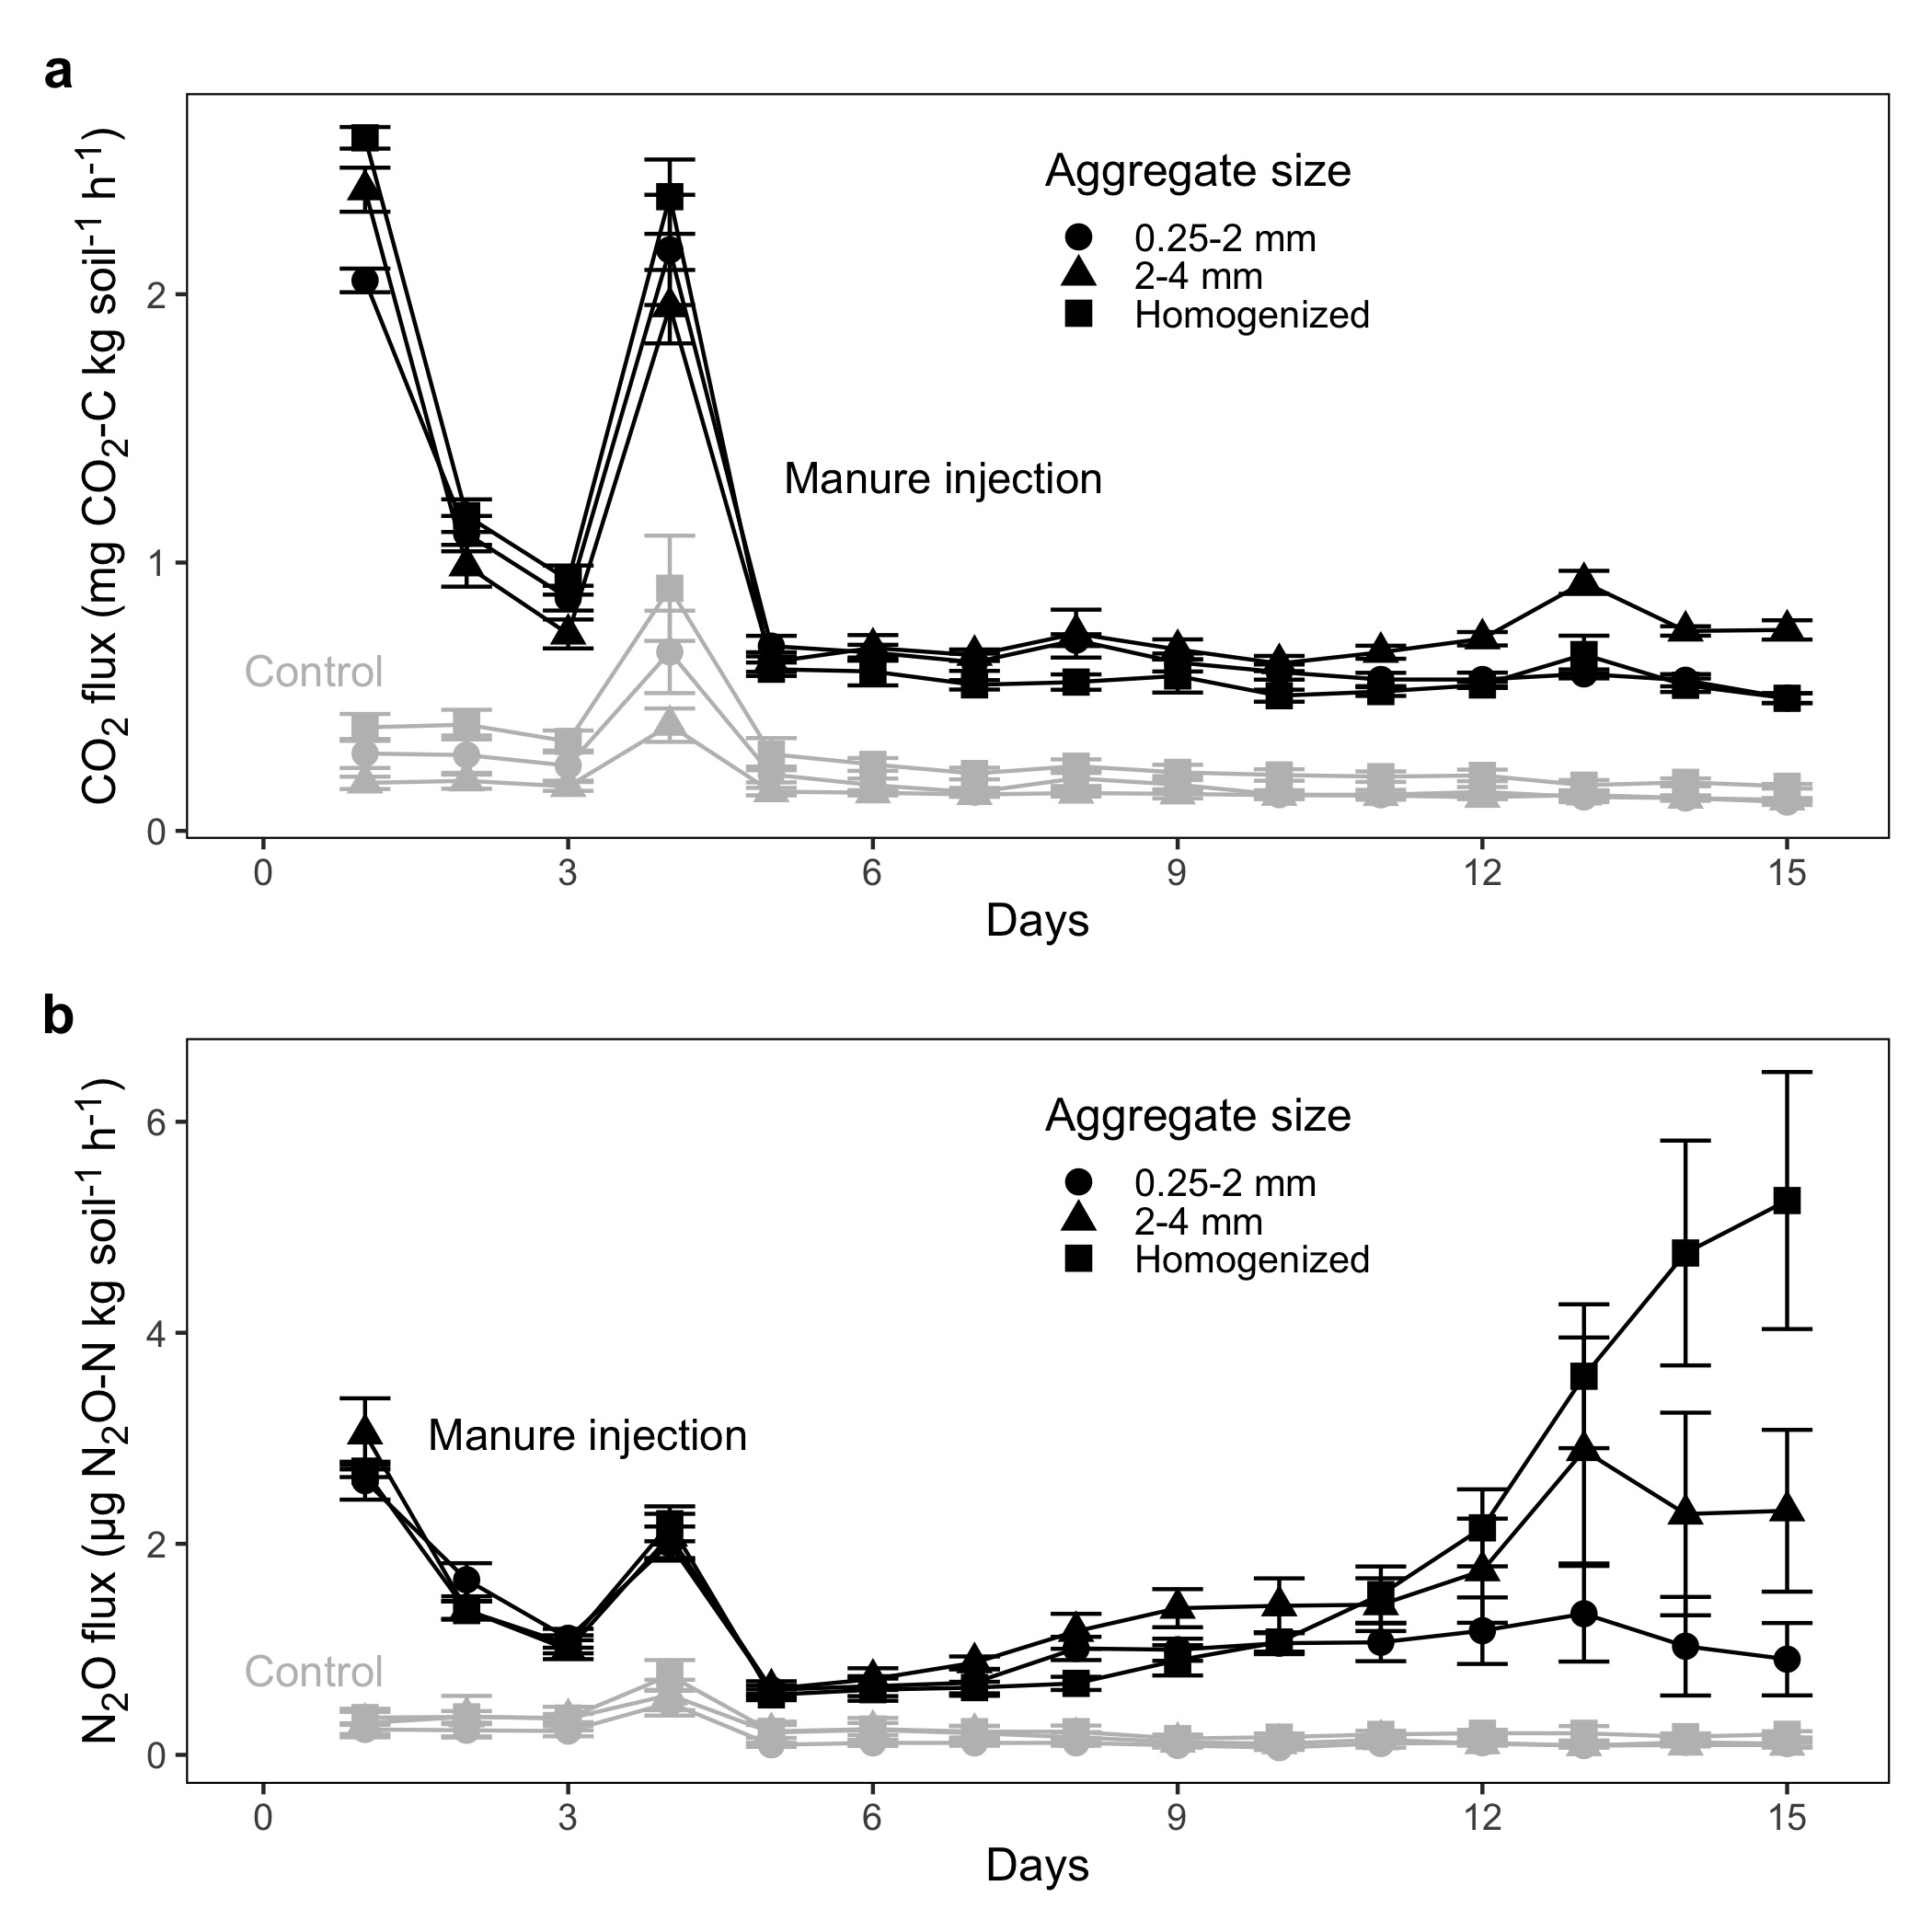
Figure 4. Daily (a) CO2 and (b) N2O fluxes for all soil structure types in the manure-amended and control jars. Note the different units for CO2 and N2O.
In the control cores, N2O fluxes remained low for the entire incubation and were not affected by soil structure type (manure x soil structure type p = 0.4085), while CO2 fluxes for the unamended homogenized soil were slightly higher than the fluxes from either aggregate size class early in the incubation (manure x soil structure type p = 0.0013; Fig. 4). These larger CO2 fluxes may have been a result of soil organic carbon being more available in the homogenized soil, as aggregate disruption allowed microbes to access organic matter that was previously occluded within aggregates (Han et al., 2016; Krull et al., 2003; Six et al., 2002). Mean cumulative CO2 emissions were also greater for the unamended homogenized soil than for the aggregate treatments (manure x soil structure type p = 0.0083; Fig. 5a), but only by a small amount, since CO2 fluxes across all control cores were similar during most of the incubation (Fig. 4a).
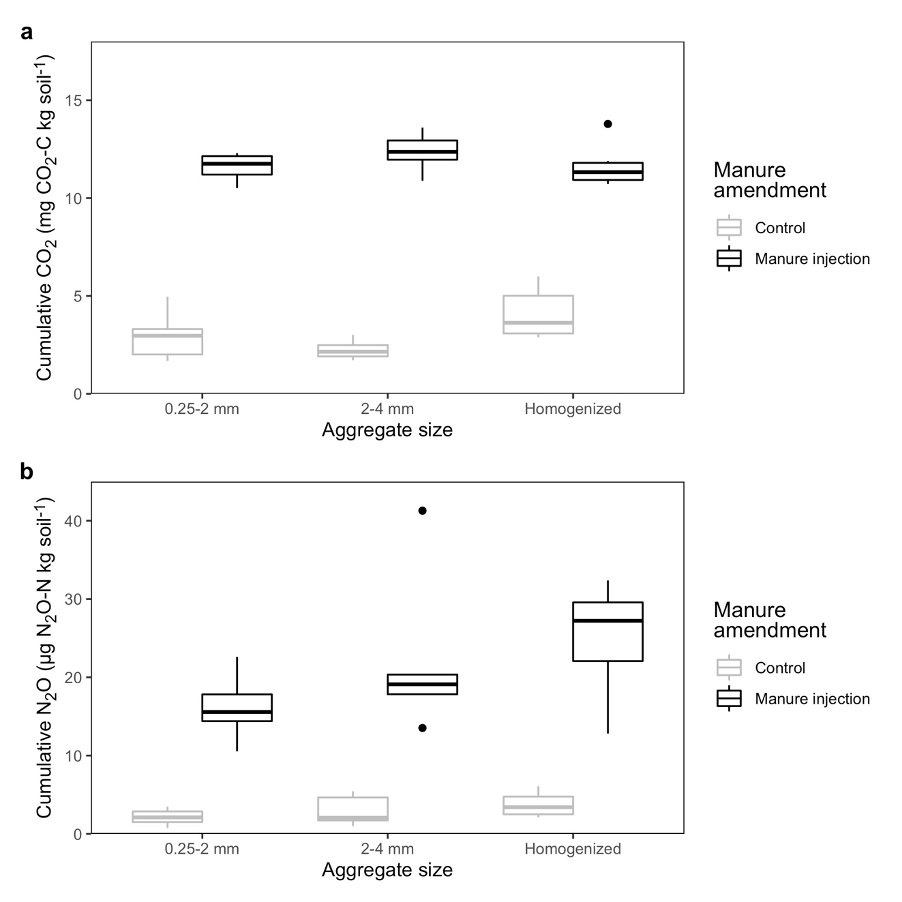
Figure 5. Cumulative (a) CO2 and (b) N2O emissions for all soil structure types in the manure-amended and control jars. Note the different units for CO2 and N2O.
Both CO2 and N2O fluxes were elevated immediately after manure application but quickly decreased in the following 2 d (Fig. 4). For CO2, this initial pulse was likely due to rapid decomposition of readily consumable organic carbon from the manure (Rochette et al., 2006; Van Kessel et al., 2000), and for N2O, this organic carbon may have provided substrate for heterotrophic microbes to reduce existing NO3- at the time of application (Table 4). On day 4, CO2and N2O fluxes increased, and it is not obvious what contributed to this temporary increase in emissions (Fig. 4). We switched from measuring fluxes every 24 h on day 3 to every 3-4 h on day 4, and the 24 h measurement for day 3 and subsequent 3-4 h measurement for day 4 occurred on the same day (see Methods: Nitrous oxide and carbon dioxide measurements), but it is not clear how our change in methods would have caused higher emissions. Alternatively, soil organic carbon and mineral N may have been more available during flux measurements on day 4, but we only recorded total C, NO3-, and NH4+ at the start and end of our incubation. Thus, it is not possible to determine why CO2 and N2O fluxes increased on day 4. For the remainder of the experiment, CO2 fluxes stabilized (mostly < 1 mg CO2-C kg soil-1h-1) in all soil structure types (Fig. 4a). In contrast, N2O began slowly increasing from days 6-12 and then rapidly increased in the homogenized soils from days 12-15 while stabilizing at an elevated flux rate for the 2-4 mm aggregates (Fig. 4b). In the last 4 d of the incubation, mean daily N2O fluxes for the manure-amended homogenized soil, 2-4 mm aggregates, and 0.25-2 mm aggregates were 3.94 ± 0.5, 2.31 ± 0.4, and 1.11 ± 0.2 µg N2O-N kg soil-1 h-1.
Table 4. Soil characteristics pre- and post-incubation
|
|
NO3- (mg kg soil-1) |
NH4+ (mg kg soil-1) |
Total C (%) |
Total N (%) |
||||
|
|
Pre |
Post |
Pre |
Post |
Pre |
Post |
Pre |
Post |
|
0.25-2 mm |
14.4 ± 3.38 |
88.9 ± 25.0 |
1.66 ± 0.205 |
9.32 ± 15.9 |
2.25 ± 0.0974 |
2.50 ± 0.276 |
0.252 ± 0.00957 |
0.277 ± 0.0264 |
|
2-4 mm |
28.3 ± 2.10 |
83.7 ± 18.4 |
2.02 ± 0.203 |
12.9 ± 10.6 |
2.23 ± 0.128 |
2.33 ± 0.294 |
0.248 ± 0.00500 |
0.257 ± 0.0250 |
|
Homogenized soil |
34.0 ± 0.830 |
105.1 ±13.3
|
2.02 ± 0.143 |
34.5 ± 13.1 |
2.24 ± 0.0830 |
2.35 ± 0.135 |
0.252 ± 0.00957 |
0.260 ± 0.0165 |
Denitrification as a source of N2O
There are competing justifications for the delayed peak in N2O emissions and the corresponding differences in soil structure types. The delayed response in peak N2O fluxes could suggest that denitrification was the dominant process driving N2O emissions. In aerobic agricultural soils (as in our soils, which had WFPS of 35%) nitrifiers usually quickly oxidize NH4+ to NO3- (Paul, 2014), so as NO3- concentrations built up over the course of the incubation, denitrification rates, and thus N2O production, may have increased (Bremner, 1997; Luo et al., 1999). Although we did not measure changes in NO3- and NH4+ throughout the course of the incubation to minimize soil disturbance, both NO3- and NH4+increased between pre- and post-incubation, with the greatest availability and rate of increase in the homogenized soil (Table 4). As manure provided a carbon source, NO3- may have been the most limiting substrate, so when NO3- increased, so did N2O.
Furthermore, without any aggregates, the bulk soil in the homogenized treatment may have had a simpler structure that allowed N2O to diffuse unobstructed out of the cores before being further reduced to N2. Meanwhile, the lower N2O fluxes from the 0.25-2 mm and 2-4 mm aggregates could be explained by more anaerobic conditions occurring within the aggregates, thus facilitating the complete denitrification of N2O to N2 (Sey et al., 2008). Alternatively, the heterogenous soil structure in the aggregate treatments may have slowed diffusion of substrates, i.e., NO3- and carbon, to denitrifiers, thus leading to lower denitrification rates and fewer N2O emissions.
Nitrification as a source of N2O
The explanation of denitrification as the driver of N2O fluxes when soil structure differences were most pronounced in the manure-amended cores is complicated by the fact that CO2 mostly did not increase with N2O during this period (Fig. 4). Although CO2 was a significant predictor of N2O (p < 0.0001; Table 2), CO2 fluxes only changed with N2O fluxes for 2-4 mm aggregates and did not rapidly increase for the homogenized soil (Fig. 4). Because denitrification is a heterotrophic process favored in anaerobic conditions, elevated CO2 production can directly promote N2O production while acting as an indirect indicator of denitrifier activity (Parkin, 1987). Therefore, the fact that the rapid increase in N2O for the homogenized soil did not correspond to a similar increase in CO2 combined with the fact that the homogenized soil had the highest NH4+ availability of the soil structure types, suggests that nitrification may have been responsible for N2O. In contrast, the change in N2O with CO2 production for the 2-4 mm aggregates suggests that denitrification was the dominant process in that treatment.
Conclusion
Regardless of whether N2O was produced by denitrification or nitrification, this study provides evidence that soil aggregates can mediate net N2O production after manure injection. However, we only observed this trend for a short period within our incubation, so a longer duration experiment may illuminate how this relationship changes over time.
Soil aggregates — compared to homogenized, i.e., structureless, soil — may reduce net N2O production after manure injection and therefore could play a role in reducing agricultural N2O emissions. Therefore, best management practices that promote soil aggregation may contribute to net N2O emissions reduction after manure injection. However, further research, potentially including additional lab experiments as well as field trials, on the effect of aggregation on N2O production after manure injection is needed before drawing any conclusions.
Education & outreach activities and participation summary
Participation summary:
This project was the second chapter of my master’s thesis in the Rubenstein School of Environment and Natural Resources at the University of Vermont. My thesis will be publicly available online in one year.
I shared the results of this project with UVM Extension staff to inform their work on greenhouse gas (GHG) emissions from agricultural production. I moved out of Vermont before the annual summer field day at Borderview Research Farm, so I could not participate in this outreach event. However, I generated a research summary that provided a general overview of manure injection and its relationship with GHG production to be shared at this field day. In general, opportunities for me to perform direct outreach regarding the results of this project were limited by the fact that I moved out of VT and began working as a PhD student in a new research program shortly after completing this project.
Project Outcomes
While the literature on the relationship between soil aggregation and greenhouse gas emissions (GHG) has focused on how soil aggregate size impacts net GHG production, this project not only compared N2O and CO2 fluxes from two different aggregate size classes, but also examined these emissions from structureless soil (i.e., aggregates disrupted). Because both the extent of aggregation as well as aggregate size distribution can change with management practice, this project contributed to our understanding of how such alterations in soil structure could influence environmental outcomes. Our experimental results indicate that although aggregates can be important microsites for GHG production (Wang et al., 2019), they may mediate net N2O production from manure injection compared to structureless soil. This has implications for sustainable agricultural management, as practices that increase soil health via aggregation could also reduce N2O fluxes and therefore have additional direct environmental benefits that are not yet widely discussed. Further experimentation, including longer-term experiments, field trials, and more advanced experimental techniques, could elucidate additional insights about how aggregation, a component of soil health, interacts with management practices to inform environmental outcomes.
This project expanded my training in experimental design and lab-based analyses, and it deepened my knowledge of agricultural best management practices. As a master’s student with little previous experience with field sampling or lab work, this project allowed me to cultivate additional skills that I otherwise would not have been able to learn during my master’s program. In addition, applying to and receiving the Graduate Student Research Grant provided me with my first opportunity to write a scientific grant proposal and oversee the management of project deliverables. I am applying lessons from both the successes and mistakes that I made while working on this project to my new role as a Ph.D. student.
My current research focuses on the role of sustainable agricultural practices, such as cover cropping, crop diversification, compost amendment, and no-till, in altering soil physical, biological, and chemical properties that may confer drought resilience. Although the questions I’ll be exploring in my Ph.D. research are not directly related to those in this project, I will translate the knowledge and skills I gained to my current and future research plans.