Final report for GNE21-251
Project Information
Botrytis bunch rot or gray mold, caused by the fungus Botrytis cinerea (Pers.:Fr), is one of the most destructive grapevine diseases worldwide. Managing Botrytis is challenging in the Northeastern United States due to ideal climatic conditions for the infections, leading to significant yield loss. Viticulturists primarily rely on canopy management and the prophylactic use of fungicides to control disease in their vineyards. However, there is increasing consumer demand for industrial pesticide-free fruits due to concerns of adverse effects of pesticides on non-pest species, soil microbes, human health, and the risk of fungal resistance to fungicide applications. One of the Integrated Pest Management program strategies is to use alternatives to synthetic fungicides to promote plant growth and suppress disease. Grapevines are known for their secondary metabolites production, which are documented to have antifungal and disease suppressive effects. Using grapevine debris (such as canes, wood, and leaves) from Vitis vinifera to suppress botrytis has been successfully demonstrated. However, there is limited research evaluating secondary metabolites with antifungal properties from cold-hardy grapevine varieties. The aim was to gather knowledge that could lead to the development of new botanical fungicides that could be used as an alternative to synthetic fungicides for disease management in vineyards. The overall goal of this research was to investigate the putative antifungal activity of field-collected grapevine leaves and cell suspension cultures obtained from cold-hardy grapevine varieties. Specific objectives were to (1) investigate the in vitro antifungal activity of field-collected grapevine leaf extracts against Botrytis cinerea (2) investigate the in vitro antifungal activity of cell suspension cultures against Botrytis cinerea (3) test the effectiveness of field collected grapevine leaf extracts in controlling Botrytis cinerea infection in grapevine leaves and berries (4) test the effectiveness of cell suspension cultures in controlling Botrytis cinerea infection in grapevine leaves and berries.
To achieve our objectives, experiments were conducted at UNH greenhouse facilites (MacFarlane greenhouses). For objective 1, two grapevine varieties Mars and Canadice field-collected leaves extract (water, ethanolic and methanolic) was prepared and tested the in vitro antifungal activity against B. cinerea. There was a significant interaction effect of treatment and time. Mars leaf extracts showed a potent antifungal activity compared to Canadice leaf extracts and respective controls (water, ethanol, and methanol). For objective 2, cell suspension cultures of Mars and Canadice were prepared and test for the antifungal activity against B. cinerea. There was a significant interaction effect of treatment and time. Mars cell suspension treated I plates had lower AFG of B. cinerea compared to control and Canadice cell suspension treated plates at days 2, 3, and 5, but by day 7 these differences disappeared due to overgrowth of fungus which is the typical growth pattern of Botrytis. For objective 3, Mars and Canadice leaf extracts were tested for their antifungal activity against B. cinerea on greenhouse grown leaves and store-bought berries. For leaves, there was no significant interaction effect of treatment and time. However, there was a significant effect of treatment, Canadice and Mars leaf ethanolic extract had significantly reduced lesions compared to water and ethanol control. Berries treated with Mars and Canadice leaf extracts (water, ethanolic and methanolic) had a significant interaction effect of treatment and time. Mars leaf extracts had a significantly lower area of fungal growth compared to Canadice leaf extracts and respective controls. For objective 4, Mars and Canadice cell suspension cultures were test for their antifungal activity against B. cinerea on greenhouse grown leaves and Mars berries. There was no significant interaction effect of treatment and time on berries however, there was a significant effect of treatment. Canadice suspension culture had significantly lower area of fungal growth of B. cinerea compared to the control.
Our results show that grapevine-derived extracts have antifungal activity in vitro and in detached berry experiments when challenged with B. cinerea, but the antifungal activity was not translated to in planta experiments. The metabolic profiling of senescent leaves and cell suspension cultures of Mars and Canadice identified an array of compounds, including some reported to have antimicrobial properties. Given the list of compounds that have been identified in cold-hardy grapevine-derived products, future work should examine these unique compounds present in the senescent leaves and cell cultures under controlled experimental conditions. While our results indicated that Mars- and Canadice-derived products have antifungal activity, the materials used in this study were crude extracts. Future studies should focus on using finer grapevine-products to test the efficacy against B. cinerea, not only in vitro, but also using pilot-scale greenhouse trials, and vineyard trials.
The overall goal of this research is to investigate the putative antifungal activity of field-collected grapevine leaves and cell suspension cultures obtained from cold-hardy grapevine varieties and demonstrate the potential of grapevine-derived products as an alternative to synthetic fungicides. The specific objectives are to:
- Investigate the in vitro antifungal activity of field-collected grapevine leaf extracts against Botrytis cinerea.
- Investigate the in vitro antifungal activity of cell suspension cultures against Botrytis cinerea.
- Test the effectiveness of field-collected grapevine leaf extracts in controlling Botrytis cinerea infection in grapevine leaves and berries.
- Test the effectiveness of cell suspension cultures in controlling Botrytis cinerea infection in grapevine leaves and berries.
This project aims at developing a new alternative for disease management to vineyards in New England. Botrytis bunch rot, caused by the fungus Botrytis cinerea, is one of the most destructive grapevine diseases worldwide (Sharma et al., 2009; Ky et al., 2012; Steel et al., 2013). Botrytis is a significant problem in grapevines in the Northeastern U.S. because of the warm, humid, and summer rains during the growing season that favor disease development (Hazelrigg and Kingsley-Richards, 2017).
The genus Botrytis consists of ~35 necrotrophic species, some having a vast range (B. cinerea and B. pseudocinerea), impacting ~1400 different plant species (Kassemeyer and Berkelmann-Loehnertz, 2009). Economically important crops are affected by this fungus and are the main contributor to food waste and loss and threats to global food security. This project focuses on B. cinerea infection on grapevines. Botrytis can grow on any succulent plant tissue (young and green), ripened fruit, or dead tissues (Elad et al., 2016). Botrytis can cause reduced fruit and wine quality, which is a significant concern for wineries (60), and affect the table grape sales in grocery stores. These scenarios can also be experienced in the New England wineries, which can decrease revenue to the growers (Moyer and Grove, 2011).
Currently, viticulturists rely on sanitation, canopy management, and fungicides to manage Botrytis. However, there is increasing consumer pressure to reduce the use of synthetic chemicals due to concerns over potential adverse effects on non-pest species, on soil microbiome, and on human health (Bolognesi and Merlo, 2011), as well as the risk of pathogen resistance (Gill and Garg, 2014). Several techniques such as leaf removal, maintaining canopy architecture, and microclimate have been developed to adopt more environmentally and economically sustainable practices to manage gray mold (Hed and Centinari, 2018; Kraus et al., 2018). Nonetheless, Botrytis continues to be a main challenge to grape growers. One possible alternative practice that could be used is the rotation of plant secondary metabolites with synthetic fungicides to suppress the disease (Langcake, P. , Irvine, J . A . and Jeger, 1981). I propose a strategy to use extracts of grapevine debris (leaves) or cell suspension cultures to control B. cinerea infection. Cell suspensions (liquid cultures of undifferentiated cells) of grapevines also have antifungal compounds and have the advantage of direct extraction without sacrificing the whole plant (Liswidowati et al., 1991; Donnez et al., 2009) and can be mass-produced in bioreactors (Efferth, 2019). Grapevine canes have been successfully analyzed and quantified as a source of bioactive stilbenes (Schnee et al., 2008a; Fernandes et al., 2013; De Bona and Vincenzi, 2020). The grapevine debris was also used for its phenolics in the pharma and nutraceutical industries (Georgiev et al., 2014). Therefore, it is expected that grapevine debris and cell suspension cultures can be used as a source of antifungal compounds to be used in pest management, thus reducing synthetic fungicide usage. This research directly addresses SARE’s mission to provide growers with innovations that improve environmental stewardship, resilience, and profitability. This project addresses four of the identified themes in sustainable agriculture by decreasing reliance on fungicides (reduce ecological and health risks, improve worker safety), improve the long-term health of agricultural systems (protection of natural resources), and reduce losses to disease (increase productivity).
Research
Objective 1: Investigate the in vitro antifungal activity of field-collected grown grapevine leaf extracts against Botrytis cinerea.
The antifungal effect of grapevine leaves depends on their secondary metabolite contents (Jeandet et al., 1992). Several studies investigated the antifungal effect of grapevine leaves against different types of fungal pathogens (Jeandet et al., 1995; Apolonio Rodríguez et al., 2017). In this objective, the antifungal activity of leaf extracts of field-grown cold-hardy table grapevines will be tested in vitro on B. cinerea. Additionally, leaf phenolic composition will be determined to identify metabolites responsible for the antifungal activity.
Field-collected leaves – Mars and Canadice senescent leaves were collected from the vineyard, and their extracts were used to test their antifungal properties. The leaves were collected, brought to the lab, washed with deionized water, patted dry, placed in conical centrifuge tubes and flash-frozen in liquid nitrogen and stored at -80°C. The frozen leaves were ground using liquid nitrogen, and about 50 g of leaf tissue (Mars and Canadice separately) were boiled in 100 mL of water for 20 minutes. The resulting extract was filter sterilized using 0.45 µm corning bottle top vacuum filters (Sigma Aldrich, MA) and used to test the antifungal activity in vitro (Fernandes et al., 2013; Maia et al., 2019). Similarly, leaf extracts were prepared for both Mars and Canadice in 70% methanol and 80% ethanol, respectively (50 g leaves in 100 mL of 70% methanol and 50 g leaves in 100 mL of 80% ethanol). Sterile water, 70% methanol and 80% ethanol served as control treatments.
Metabolic profiling: Mars and Canadice cell suspension cultures (50 mL) were centrifuged in a conical centrifuge tube (4500 rpm, 4°C, 5 minutes), and the pellets were retained. The pellet was then lyophilized in a freeze dryer (LabConco, AK). Mars and Canadice leaves were collected and placed in Ziploc bags in a lab cooler, washed well with deionized water, patted dry, placed in a conical centrifuge tube and flash-frozen in liquid nitrogen immediately upon harvest and stored at -80°C. The frozen leaves were ground and then lyophilized in a freeze dryer (LabConco, AK). About 100 mg of freeze-dried Mars and Canadice cell suspensions and leaf samples were sent to the Roy J. Carver Biotechnology Center (University of Illinois) to perform metabolic profiling using liquid chromatography-mass spectrometry (LC-MS). The analysis were done by using approximately 50 mg of each sample soaking in 1 mL of acetonitrile:isopropanol:water (3:3:2) for 1 hour, homogenized on bead mill 4 (Thermo, Germering, Germany), centrifuged at 20000 rpm for 10 min. 100 µL of supernatant were collected in a separate microfuge and spiked with internal standard (4-Chloro-DL-phenylalanine) and 20 µL was injected into the LC/MS system. The Dionex Ultimate 3000 series HPLC system (Thermo, Germering, Germany) with a degasser, an autosampler and a binary pump. The LC separation was performed on a Phenomenex Kinetex C18 column (4.6 x 100 mm, 2.6 µm) with mobile phase A (H2O with 0.1% formic acid) and mobile phase B (acetonitrile with 0.1% formic acid). The flow rate was 0.25 mL/min. The linear gradient was as follows: 0-3 min, 100% A; 20-30 min, 0% A; 31-36 min, 100% A. The autosampler was set to 15°C. Mass spectra was acquired under both positive (sheath gas flow rate:45; aux gas flow rate:11; sweep gas flow rate:2; spray voltage: 3.5 kV; capillary temp: 250°C; Aux gas heater: 415°C) and gas flow rate: 11; sweep gas flow rate: 2; spray voltage: 3.5 kV; capillary temp: 250°C; Aux gas heater temp: 415°C) and negative electrospray ionization (sheath gas flow rate: 45; aux gas flow rate: 11; sweep gas flow rate:2; spray voltage: -2.5 kV; capillary temp: 250°C; Aux gas heater temp: 415°C). The full scan mass spectrum resolution was set to 70,000 with scan range of m/z 67 ~ m/z 1,000, and AGC target was 1E6 with a maximum injection time of 200 ms. LC-MS data was further analyzed with Thermo Compound Discoverer software (v. 2.1 SPI) for chromatographic alignment and compound/feature identification/quantification. The workflow is Untargeted Metabolomics with Statistics Detect Unknowns with ID Using Online Databases (HMDB, 2022; KEGG, 2022). The following settings were used in Select Spectra: minimum precursor mass (65 Da) and maximum precursor mass ( 5,000 Da); in Align Retention Time: Maximum shift (1 min) and Mass tolerance (5 ppm); in Detect unknown compounds: Mass tolerance (5 ppm), Intensity tolerance (30%), S/N (3), and Minimum peak intensity (1000000) (Elolimy et al., 2019)
B. cinerea inoculum: To produce fresh fungal culture, a B. cinerea isolated from infected petunia (kindly donated by Dr. Poleatewich's lab, UNH) was cultured on fresh potato dextrose agar (PDA) (Hardy diagnostics, Santa Maria, CA). Moreover, to check if the B. cinerea could also infect grapevine parts, I tested by inoculating grapevine detached leaves of Mars and Canadice and store-bought grapes (variety unknown) and after confirmation of infection the isolates were sub-cultured and used for all the antifungal experiments. Thirty-six grams of PDA in one liter of deionized water was autoclaved and poured into the microbiological Petri plates. The fungus was sub-cultured in the PDA media, and fungal plates were incubated for 5 days at room temperature in the dark. Then the plates were exposed to 14 h darkness/12 h light at 21°C for 6 days to induce sporulation. The cultured plates were stored at room temperature in the dark until inoculum preparation. To obtain spore suspension, the culture plate was flooded with 10 mL of sterile Sabouraud Maltose Broth (SMB) containing 0.1% Tween 80 (VWR, Randor, PA). Conidia were dislodged using a sterile FisherBrand cell spreader (Fisher Scientific, Hampton, NH). Then the resulting suspension was filtered through 4 layers of sterile cheesecloth (De Bona et al., 2019). Spore concentrations were determined with a hemocytometer (Hausser Scientific, Horsham, PA) and adjusted to 5x10⁵ spores mL-1 using sterile double deionized water.
Experimental design: PDA amended with leaf extract (2.5 mL in 100mLPDA) was poured into Petri plates having two compartments (I plates). Each assay consisted of 10 plates and was repeated three times for each grape variety. The plates were challenged with fungal inoculum to test antifungal activity. One-half of the I plate was inoculated by spraying a spore suspension of 5x10⁵ conidia per mL to runoff. The non-inoculated half was sprayed with sterile water, as a negative control. Then the plates were placed in the dark (25±2°C). The mycelial growth of B. cinerea was assessed two, three, five, and seven days after inoculation by measuring the growth of fungus vertically and horizontally across the lesion (D1 and D2 as diameters) and the growth area was calculated using the formula, Area = ∏(D1/2*D2/2) (Hendricks et al., 2017). The area of the mycelial growth was expressed as the area of fungal growth (AFG). The plates were evaluated for disease incidence on day 7, using the formula: disease incidence = (the number of spores/the total area of the plate) x 100%. The conidia were dislodged using sterile water, the resulting suspension was filtered through 4 layers cheese cloth and the spores were counted using hemocytometer. The design of experiment followed a complete randomized design. Data analysis was performed using PRISM 9.0 version (Graphpad, CA) by performing two-way analysis of variance (two-way ANOVA). The results showed significant interaction of treatment x time effect on area of fungal growth. Then the simple effects were performed by one-way ANOVA for each day (day 2, 3, 5, and 7 separately) and Tukey’s multiple comparison to identify differences among the treatments and to determine the treated extract having the lower AFG of B. cinerea. One-way ANOVA was performed to analyze the spore count generated from the plate assays (for both leaf extracts and cell suspension cultures). Tukey’s multiple comparison procedure was used to identify differences among the treatments and thus determine the extract with greatest antifungal activity against B. cinerea.
Objective 2: Investigate the in vitro antifungal activity of cell suspension cultures against Botrytis cinerea.
Cell suspension cultures: Solid cultures of undifferentiated cells (calli) were established from the leaves, leaf meristems, and cambium of Canadice and Mars grapevine explants obtained from green-house grown plants. Grapevine shoots were collected from the vineyard in the month of October and subjected to acclimation by keeping them at 4°C for four weeks and then cut into 2 buds each. The shoot cuttings were dipped in the rooting hormone Hormodin (OHP, Inc., Morrisville, NC) and placed in the cone shaped plastic containers with pre-moistened 1:1 perlite: vermiculite (Whittermore Co Inc., Lawrence, MA) mixture to initiate rooting. The shoots were maintained in a misting chamber at 22°C with 65% relative humidity and mist settings-125µmol/hrs accumulation trigger, 2 pulses mist at 0.2 min duration with10 seconds delay between pulses with tap water. Once bud break occurred and two to three leaves and root growth were visible, the plants were removed from the mist and fertilized with 17-4-17 100 mgL-1 N (Jack’s Professional LX, JR Peters Inc. Allentown, PA). When the plants were accustomed to no misting conditions, they were transferred into pots with potting media. The pots were maintained in the greenhouse set to 21°C day/18°C night, 65% relative humidity with 4 minutes of irrigation pulses and a 10-minute pause between 1000 pulses daily. Plants were fertilized with 17-4-17 at 150 mgL-1 N (Jack’s Professional LX, JR Peters Inc. Allentown, PA) at each irrigation. Once the plants developed 10 leaves, the leaves and shoots were pruned and carried to the lab using a lab cooler. The leaves and shoots were sanitized using 10% hypochlorite solution (commercial bleach) and washed well with autoclaved deionized water three to four times. Then leaves were cut into small pieces using a sterilized scalpel. The leaf meristem was excised underneath the petiole. The cut leaf pieces, cambium and leaf meristems were separately cultured in Murashige and Skoog media (Research Products International, IL) with sucrose (30 %; Fisher Scientific, Fair Lawn, NJ), agar (0.8 %; Gold Biotechnology, Inc., MO), plant growth hormones benzylaminopurine (0.2 mg/L; Phyto Tech Lab, Lenexa, KS) and indole acetic acid (1.0 mg/L; Sigma Aldrich, MO), and casein hydrolysate (250 mg/L; Sigma Aldrich, MO). These tissue culture plates took about 4 weeks to produce calli, as shown in Fig. 48 and 49. The cultures were maintained on a solid Murashige and Skoog media and grown at 25±1°C, with 16 h light/8 h dark photoperiod illuminated with fluorescent light bulbs.
Experimental design: PDA amended with cell suspension (5 mL in 100 mL PDA) was poured into Petri plates having two compartments (I plates) (Fig. 51 and 52). Each assay consisted of 10 plates and was repeated three times for each grape variety. The plates were challenged with fungal inoculum to test antifungal activity. One-half of the I plate was inoculated by spraying a spore suspension of 5x10⁵ conidia per mL to runoff. The non-inoculated half was sprayed with sterile water, as a negative control. Then the plates were placed in the dark (25±2°C). The mycelial growth of B. cinerea was assessed two, three, five, and seven days after inoculation by measuring the growth of fungus vertically and horizontally across the lesion (D1 and D2 as diameters) and the growth area was calculated using the formula, Area = ∏(D1/2*D2/2) (Hendricks et al., 2017). The area of the mycelial growth was expressed as the area of fungal growth (AFG). The plates were evaluated for disease incidence on day 7, using the formula: disease incidence = (the number of spores/the total area of the plate) x 100%. The conidia were dislodged using sterile water, the resulting suspension was filtered through 4 layers cheese cloth and the spores were counted using hemocytometer. The design of experiment followed a complete randomized design. Data analysis was performed using PRISM 9.0 version (Graphpad, CA) by performing two-way analysis of variance (two-way ANOVA). The results showed significant interaction of treatment x time effect on area of fungal growth. Then the simple effects were performed by one-way ANOVA for each day (day 2, 3, 5, and 7 separately) and Tukey’s multiple comparison to identify differences among the treatments and to determine the treated extract having the lower AFG of B. cinerea. One-way ANOVA was performed to analyze the spore count generated from the plate assays (for both leaf extracts and cell suspension cultures). Tukey’s multiple comparison procedure was used to identify differences among the treatments and thus determine the extract with greatest antifungal activity against B. cinerea.
Objective 3: Test the effectiveness of field-collected grapevine leaf extracts in controlling Botrytis cinerea infection in grapevine leaves and berries.
Experimental design for leaf infection: Leaf extract prepared according to Objective 1 will be sprayed on the greenhouse-grown grapevine leaves. The Mars and Canadice leaves were sprayed with 500 µL of Mars ethanolic extract, water control, and ethanol control. Ten leaves were sprayed per treatment, and the experiment was repeated twice. The treated leaves were placed in Petri dishes with water agar media. Then leaves were inoculated with a 10 µL of 5 x 10⁵ spores mL-1 suspension of B. cinerea. After inoculation, the Petri dishes were incubated in the dark. Lesions were counted in each leaf, and disease severity was calculated using the number of lesions formed from the number of leaves infected. (Langcake, 1981; El-Khateeb et al., 2013; De Bona et al., 2019).. Two, three, five, and seven days post-inoculation, the plants will be evaluated for disease incidence and disease severity. Disease incidence = (the number of lesions/the total number of leaves) x 100%. Disease severity and disease incidence will be analyzed for statistical significance using a One-Way Analysis of Variance (ANOVA) in GraphPad (Prism software, CA). The model statement will include crude extract concentration as the independent variable, block as the random variable, and disease severity, and disease incidence as dependent variables. Statistical significance will be assessed at p < 0.05, and a Tukey Honest Significant Difference (HSD) Post-hoc test will be used to separate the means.
Experimental design for berry infection: Store brought table grapes (variety unknown) were treated with Mars and Canadice leaf extracts (water, ethanolic and methanolic extracts). Table grape berries were sprayed with 1 mL of leaf extract solutions (500 mg/mL) and 1 mL of cell suspension culture. The appropriate water, ethanol, methanol, or MS media controls was used. After being air-dried at room temperature for 30 minutes, each berry was inoculated with 10 µL of 5x10⁵ conidia per mL of B. cinerea to runoff. All the berries were placed in plastic containers and kept at 22 °C in the dark for 7 days. Disease incidence was calculated by counting the percentage of infected berries on day 4 and day 7, and rot lesion diameter was measured on day 4 and day 7. Rot % = number of rotten berries/10 berries (which is number of total berries per treatment). The rot lesion diameter was calculated from the mycelial growth of B. cinerea, that was assessed by measuring vertically and horizontally across the lesion (D1 and D2 as diameters) and the area of the fungal growth was calculated using the following formula, Area = ∏(D1/2*D2/2) (Hendricks et al., 2017). The area of the mycelial growth was calculated both 4- and 7-days post-inoculation and expressed as the area of the fungal growth (AFG). The design of experiment followed a complete randomized design. The experiment was repeated twice with four replicates, consisting of 10 berries per treatment (Xu et al., 2018b). Data analysis was performed using PRISM 9.0 version (Graphpad, CA) for berry experiments using a two-way analysis of variance (two-way ANOVA). The results showed significant interaction of treatment x time effect on area of fungal growth. Then the simple effects were performed by one-way ANOVA for each day (day 4 and 7 separately) and Tukey’s multiple comparison to identify differences among the treatments and to determine the treated extract having the lower AFG of B. cinerea.
Objective 4: Test the effectiveness of cell suspension cultures in controlling Botrytis cinerea infection in grapevine leaves and berries.
Experimental design for leaf infection: The cell suspension extracts prepared according to Objective 2 will be sprayed on the greenhouse-grown grapevine leaves in different concentrations (500 µL) and control (MS media). The design of the experiment will follow the complete randomized design with 10 leaves per treatment. Then leaves will be challenged by spraying a 5x10³ conidia per mL using the method described in objective 1 (Langcake, 1981; El-Khateeb et al., 2013; De Bona et al., 2019). After inoculation, the leaves will be placed in a pwtri dish containing water agar. Two, three, five-, and seven days post-inoculation, the plants will be evaluated for disease incidence and disease severity. Disease incidence = (the number of lesions/the total number of leaves) x 100%. Disease severity and disease incidence will be analyzed for statistical significance using a One-Way Analysis of Variance (ANOVA) in GraphPad (Prism software, CA). The model statement will include cell suspension culture extracts concentration as the independent variable, block as the random variable, and disease severity and disease incidence as dependent variables. Statistical significance will be assessed at p < 0.05, and a Tukey Honest Significant Difference (HSD) Post-hoc test will be used to separate the means.
Experimental design for berry infection: Store brought table grapes (variety unknown) were treated with cell suspension cultures (control, Mars, and Canadice cell suspension extracts). Table grape berries were sprayed with 1 mL of leaf extract solutions (500 mg/mL) and 1 mL of cell suspension culture. The appropriate water, ethanol, methanol, or MS media controls was used. After being air-dried at room temperature for 30 minutes, each berry was inoculated with 10 µL of 5x10⁵ conidia per mL of B. cinerea to runoff. All the berries were placed in plastic containers and kept at 22 °C in the dark for 7 days. Disease incidence was calculated by counting the percentage of infected berries on day 4 and day 7, and rot lesion diameter was measured on day 4 and day 7. Rot % = number of rotten berries/10 berries (which is number of total berries per treatment). The rot lesion diameter was calculated from the mycelial growth of B. cinerea, that was assessed by measuring vertically and horizontally across the lesion (D1 and D2 as diameters) and the area of the fungal growth was calculated using the following formula, Area = ∏(D1/2*D2/2) (Hendricks et al., 2017). The area of the mycelial growth was calculated both 4- and 7-days post-inoculation and expressed as the area of the fungal growth (AFG). The design of experiment followed a complete randomized design. The experiment was repeated twice with four replicates, consisting of 10 berries per treatment (Xu et al., 2018b). Data analysis was performed using PRISM 9.0 version (Graphpad, CA) for berry experiments using a two-way analysis of variance (two-way ANOVA). The results showed significant interaction of treatment x time effect on area of fungal growth. Then the simple effects were performed by one-way ANOVA for each day (day 4 and 7 separately) and Tukey’s multiple comparison to identify differences among the treatments and to determine the treated extract having the lower AFG of B. cinerea.
In vitro antifungal activity of field-collected leaf extracts against Botrytis cinerea
The in vitro assay using I plates treated with different extracts of senescent leaves were tested against the activity of B. cinerea. Overall, the Mars leaf ethanolic and methanolic extracts treated I-plates had the lower growth when compared to all the other treatments. The main effects and simple effects were analyzed to compare treatments for each day separately.
For senescent leaf water extracts, there was a significant interaction effect of treatment x time (P < 0.0001). Mars and Canadice leaf water extract treated plates had smaller AFG when compared to water control after challenging with B. cinerea. Then the simple effects were analyzed for each day separately to compare treatments (Fig. 1). For day 2, I-plates treated with Mars leaf water extract had significantly lower AFG of B. cinerea compared to water control (P = 0.0049) and Canadice leaf extract (P = 0.0019), which did not differ significantly. For day 3 Mars and Canadice leaf extracts had significantly lower AFG of B. cinerea compared to the water control (P = 0.0077). There was no significant different AFG between Canadice and Mars leaf water extracts. On both day 5 and 7, Mars leaf water extract had significantly lower AFG of B. cinerea compared to water control (P < 0.0001) and to Canadice leaf water extract (P = 0.0007), which did not differ significantly.
For senescent leaf ethanolic extracts, there was a significant interaction effect of treatment x time (P < 0.0001). Mars and Canadice leaf ethanolic extract treated plates had smaller AFG when compared to ethanol control after challenging with B. cinerea. Then simple effects were analyzed separately for each day between treatments (Fig. 2). On day 2, I-plates treated with Mars and Canadice leaf ethanolic extract had significantly lower AFG of B. cinerea compared to the ethanol control (P < 0.0001), but the ethanolic extracts were not different from each other. On days 3 and 5, Mars and Canadice leaf ethanolic extracts had a significantly lower AFG of B. cinerea compared to ethanol control (P < 0.0001). Mars leaf ethanolic extracts had significantly lower AFG of B. cinerea compared to Canadice leaf ethanolic extracts (P = 0.0003; P < 0.0001 respectively). For day 7, Mars and Canadice leaf ethanolic extract had significantly lower AFG of B. cinerea compared to ethanol control (P < 0.0001) but were not significantly different from each other.
For senescent leaf methanolic extracts, there was a significant interaction effect of treatment x time (P < 0.0001). Overall, Mars and Canadice leaf ethanolic extract treated plates had smaller AFG when compared to methanol control after challenging with B. cinerea. The data were then analyzed for each day separately for simple effects (Fig. 3). For day 2, I-plates treated with Mars and Canadice leaf methanolic extract had significantly lower AFG of B. cinerea compared to the methanol control (P < 0.0001), but two extracts did not differ from one another. On day 3, both Mars and Canadice leaf ethanolic extracts had a significantly lower AFG of B. cinerea compared to methanol control (P < 0.0001), and Mars leaf methanolic extracts had a significantly lower AFG of B. cinerea compared to Canadice leaf methanolic extract (P < 0.0001). For day 5, Mars leaf methanolic extracts had a significantly lower AFG of B. cinerea compared to methanol control (P < 0.0001), and Canadice leaf methanolic extract (P < 0.0001). There was no significant effect of Canadice leaf methanolic extracts on AFG of B. cinerea compared to methanol control. For day 7, Mars leaf methanolic extract had a significantly lower AFG of B. cinerea compared to control and Canadice leaf methanolic extract (P < 0.0001). Canadice leaf methanolic extract had a significantly lower AFG of B. cinerea compared to methanol control (P = 0.0340).
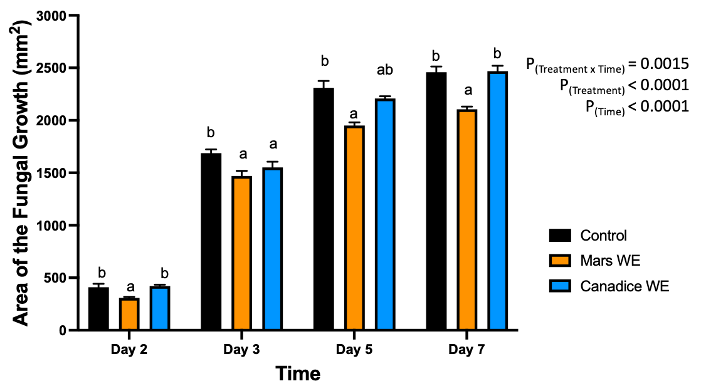
Figure 1. Bar graphs represent the antifungal activity of water extracts of Mars and Canadice leaf on area of the fungal growth (AFG) of B. cinerea on days 2, 3, 5, and 7 in vitro. Bars show mean ± SE; (n=10). Given significant interaction effect of treatment and time (P < 0.0001) simple effects ANOVAs and Tukey multiple comparison, P < 0.05 were performed separately for each day; different letters indicate significant differences. Black bars (water control), orange bars (Mars water extract (Mars WE)) and blue bar (Canadice water extract Canadice (WE)) respectively.
 Figure 2. Bar graphs represent the antifungal activity of ethanolic extracts of Mars and Canadice leaves on area of the fungal growth (AFG) of B. cinerea on days 2, 3, 5, and 7 in vitro. Bars show mean ± SE; (n=10). Given significant interaction effect of treatment and time (P < 0.0001) simple effects ANOVAs and Tukey multiple comparison, P < 0.05 were performed separately for each day; different letters indicate significant differences. Black bars (ethanol control (EtOH), orange bars (Mars ethanolic extract (Mars EE)) and blue bar (Canadice ethanolic extract (Canadice EE)) respectively.
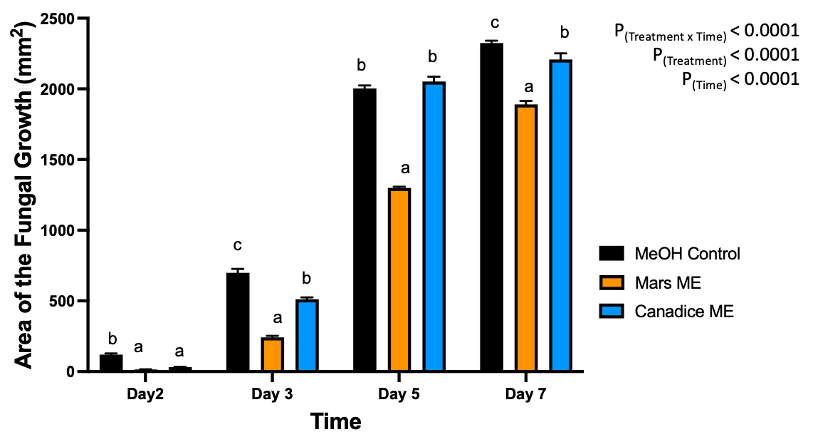 Figure 3. Bar graphs represent the antifungal activity of methanolic extracts of Mars and Canadice leaves on area of the fungal growth (AFG) of B. cinerea on days 2, 3, 5, and 7 in vitro. Bars show mean ± SE; (n=10). Given significant interaction effect of treatment and time (P < 0.0001) simple effects ANOVAs and Tukey multiple comparison, P < 0.05 were performed separately for each day; different letters indicate significant differences. Black bars (methanol control (MeOH)), orange bars (Mars methanolic extract (Mars ME)) and blue bar (Canadice methanolic extract Canadice (ME)) respectively.
 Figure 4. Bar graphs represent the number of spores produced on day 7 of B. cinerea in vitro for the treatment the antifungal activity of (a) Water extracts (b) Ethanolic and (c) Methanolic extracts of Mars and Canadice senescent leaves. Control (black bar), Mars extract (orange bar), and Canadice extract (blue bar). Values shown are mean ±SE (n=10). (one-way ANOVA, Tukey multiple comparison, P < 0.05). Different letters indicate significant differences. (WE represent water extract, EE represent ethanol extract, and ME represent methanol extract).Senescent leaf extracts not only reduced fungal growth, but also reduced spore production for B. cinerea. I-plates treated with both Mars and Canadice leaf water extracts had significantly lower number of spores of B. cinerea compared to the water control (Fig. 4a; P < 0.0001). The I-plates treated with Mars leaf ethanolic and methanolic extracts had significantly lower number of spores of B. cinerea compared to the ethanol and methanol control, respectively (Fig. 4b and c; P < 0.0001). For both ethanolic and methanolic extracts (but not water), Mars leaf extracts had significantly lower number of spores of B. cinerea compared to the Canadice leaf extracts (Fig. 4a-c; P < 0.0001).
In vitro antifungal activity of cell suspension cultures against Botrytis cinerea
For cell suspension cultures, due to significant interaction effect of treatment and time (P < 0.0001) (Fig. 5), the diameter of fungal growth was increasing with time (from day 2 to 7) and was different between the I-plates treated with suspension culture and control. Mars and Canadice cell suspension culture treated plates had smaller AFG when compared to control after challenging with B. cinerea. Then simple effects were analyzed for each day separately between treatments. For day 2, I-plates treated with both Mars and Canadice cell suspension culture had significantly lower AFG of B. cinerea compared to the control (P < 0.0001). The Mars cell suspension had significantly lower AFG of B. cinerea compared to Canadice cell suspension (P = 0.0002). For both day 3 and day 5, Mars and Canadice cell suspension treated I-plates had significantly lower AFG of B. cinerea compared to control (P < 0.0001) and those treated with Mars cell suspension had significantly lower AFG than Canadice cell suspension (P = 0.0035; P < 0.0001 respectively). On day 7, Mars and Canadice cell suspension treated I plates still had a significantly lower AFG of B. cinerea compared to control (P < 0.0001; P = 0.0073, respectively). There was no significant effect of Mars cell suspension on AFG of B. cinerea compared to Canadice cell suspension.
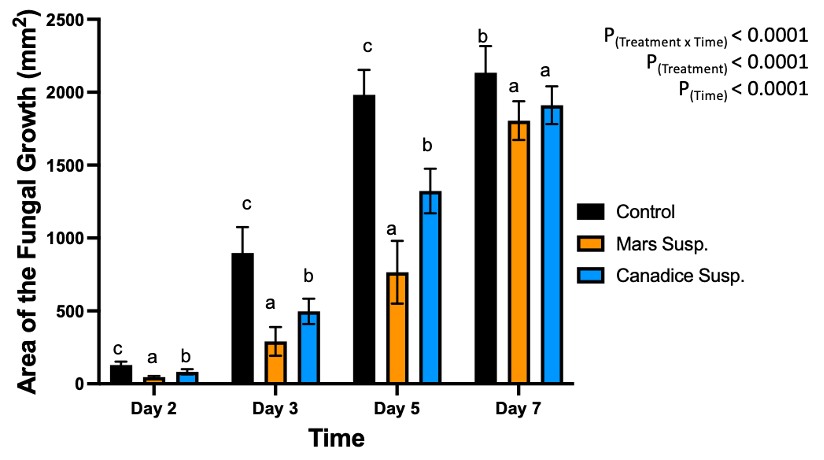
Figure 5. Bar graphs represent the antifungal activity of Mars and Canadice cell suspension cultures on area of the fungal growth (AFG) of B. cinerea on days 2, 3, 5, and 7 in vitro. Bars show mean ± SE; (n=10). Given significant interaction effect of treatment and time (P < 0.0001) simple effects ANOVAs and Tukey multiple comparison, P < 0.05 were performed separately for each day; different letters indicate significant differences. Black bars (control), orange bars (Mars suspension) and blue bar (Canadice suspension) respectively.
Cell suspension culture treated I-plates not only had lower area of fungal growth, but also had lower number of spores when compared to control. I-plates treated with Mars and Canadice cell suspension culture had significantly lower number of spores of B. cinerea compared to the control (Fig. 6; P < 0.0001). Furthermore, those treated with Mars cell suspension had significantly fewer spores of B. cinerea than those treated with Canadice cell suspension culture (Fig. 6; P = 0.0002).
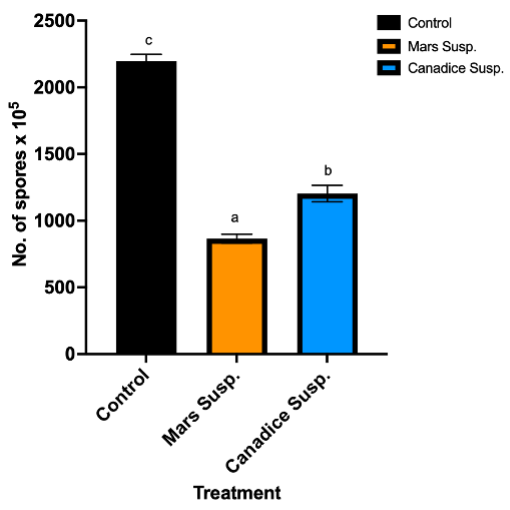 Figure 6. Bar graphs represent the number of spores produced on day 7 of the effect of antifungal activity of cell suspensions on the growth of B. cinerea in vitro. Values shown are mean ±SE (n=10). Control (black bar), Mars (orange bar), and Canadice (blue bar). (one-way ANOVA, Tukey multiple comparison, P < 0.05). Different letters indicate significant differences.
Effectiveness of field-collected grapevine leaf extracts in controlling Botrytis cinerea in leaves and berries
After treated with water control, ethanol control, and Canadice ethanolic extracts greenhouse grown Canadice grapevines were challenged with B. cinerea. The number of lesions formed on the leaves were counted as represented in Fig. 7. The two-way ANOVA results showed a significant effect of treatment (Fig. 9a; P = 0.0006). Then simple effects were analyzed separately for day 7 and 14. For day 7, the three treatments had no significant effect on number of lesions of B. cinerea formed on the treated leaves. On day 14, Canadice ethanolic extract had reduced number of lesions compared to water and ethanol control. The Canadice leaf ethanolic extract had significant effect on number of lesions of B. cinerea compared to the ethanol control (P = 0.0034), but no effect compared to water control. Treatment of water control had a significantly reduced number of lesions B. cinerea compared to the ethanol control (P = 0.0261).
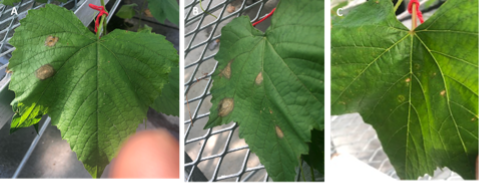
Figure 7. Representative Canadice grapevines treated with senescent leaf extracts (A) Water control (B) Ethanol control and (C) Canadice ethanolic extracts and challenged with B. cinerea in planta assay.
Mars detached leaves treated with water control, ethanol control, and Mars ethanolic extracts were challenged with B. cinerea. Then the number lesions formed were counted on day 7 and subjected to analyses to compare treatments shown in Fig. 8.
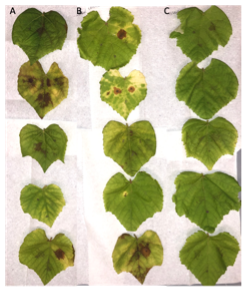
Figure 8. Representative Mars leaves challenged with B. cinerea in a detached leaf assay after having been pre-treated with (A) Water control (B) Ethanol control, and (C) Mars leaf ethanolic extracts and number of lesions counted on day 7.
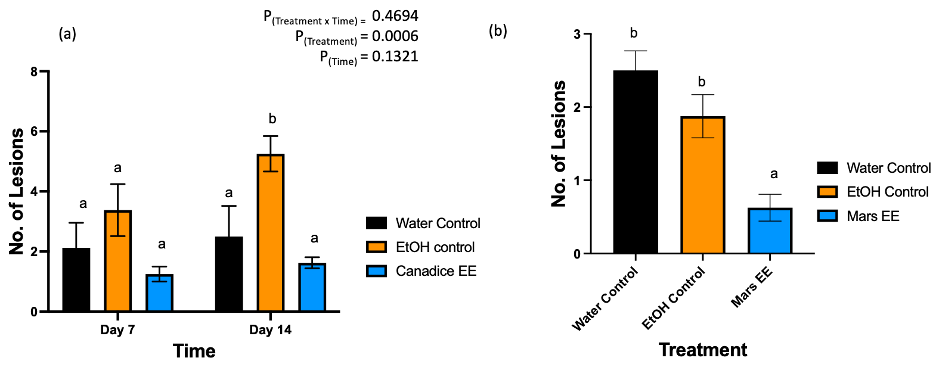
Figure 9. Bar graphs represent the effect of antifungal activity of Mars and Canadice senescent leaf extracts on the (a) number of lesions formed after being challenged with B. cinerea on Canadice leaves in an in planta assay. Water control (black bar), ethanol control (orange bar), and Canadice ethanolic extract (blue bar). Values shown are mean ± SE (n=8). Given significant treatment effect (P = 0.0006), simple effects were analyzed by one way ANOVA for each day (day 4 and 7) separately with Tukey multiple comparison, P < 0.05); different letters indicate significant differences. (b) number of lesions formed after challenged with B. cinerea on Mars leaves in detached leaf assay on day 7. Values shown are mean ± SE (n=8). (one-way ANOVA, Tukey multiple comparison, P < 0.05). Water control (black bar), ethanol control (orange bar), and Mars ethanolic extract (blue bar). Different letters indicate significant differences. EE is ethanolic extract.
Mars detached leaves treated with Mars ethanolic extracts had significantly reduced number of lesions of B. cinerea compared to both the water and the ethanol control (Fig. 9b; P < 0.0001and P = 0.0059, respectively). There was no significant effect of water control on number of lesions B. cinerea compared to ethanol control.
The detached store-bought green berries (variety unknown) were treated with both Mars and Canadice leaf extracts and then challenged with B. cinerea. The area of fungal growth was calculated and analyzed for difference between treatments. The green berries treated with grape leaf water extracts had a significant interaction effect of treatment x time (P < 0.0001) (Fig. 10). Simple effects were analyzed for day 4 and 7 separately. For day 4, Mars and Canadice leaf water extracts had a significantly lower AFG of B. cinerea compared to water control (P < 0.0001). Mars leaf water extract had no significant effect on AFG of B. cinerea compared to the Canadice leaf water extract. On day 7, Mars leaf water extract had a significant effect on AFG of B. cinerea compared to water control and Canadice leaf water extract (P < 0.0001). There was no significant effect of Canadice leaf water extract on AFG of B. cinerea compared to water control.
Berries treated with leaf ethanolic extract had significant interaction effect of treatment x time (P < 0.0001) (Fig. 11). The simple effects were analyzed for each day separately. On day 4, Mars and Canadice leaf ethanolic extract had significantly lower AFG of B. cinerea compared to ethanol control (P < 0.0001; P = 0.0483). There was a significant effect of Mars leaf ethanolic extract on AFG of B. cinerea compared to Canadice leaf ethanolic extract (P = 0.001). On day 7, Mars and Canadice leaf ethanolic extract had a significantly lower AFG of B. cinerea compared to ethanol control (P < 0.0001). Mars leaf ethanolic extract had significantly lower AFG of B. cinerea compared to Canadice leaf ethanolic extract (P < 0.0001).
Berries treated with Mars and Canadice leaf methanolic extracts had significant interaction effect of treatment x time (P < 0.0001) (Fig. 12). Simple effects were analyzed for each day separately to analyze the significance of each day between treatments. On day 4, Mars and Canadice leaf methanolic extract had significantly lower AFG of B. cinerea compared to the methanol control (P = 0.0002; P = 0.0010). There was no significant effect of Mars leaf methanolic extract on AFG of B. cinerea compared to Canadice leaf methanolic extract. On day 7, Mars leaf methanolic extract had significantly lower AFG of B. cinerea compared to Canadice leaf methanolic extract and methanol control (P < 0.0001). Canadice leaf methanolic extract had significantly lower AFG of B. cinerea compared to methanol control (P < 0.0001).
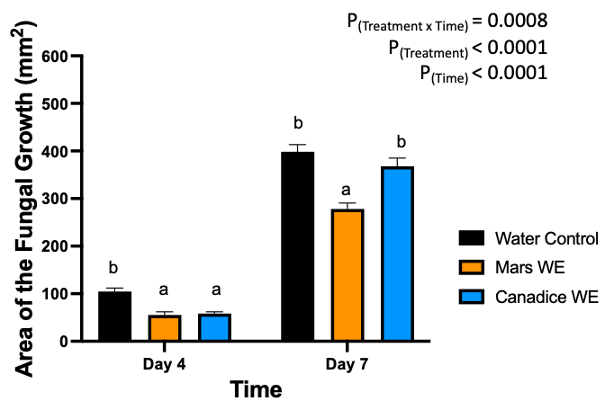
Figure 10. Bar graphs represent the antifungal activity of water extracts of Mars and Canadice leaves on area of the fungal growth (AFG) of B. cinerea on days 4 and 7 in detached berries. Bars show mean ± SE; (n=10). Given the significant interaction effect of treatment and time (P < 0.0001), simple effects ANOVAs were performed using one-way ANOVA, Tukey multiple comparison P < 0.05; different letters indicate significant differences. Black bars (water control), orange bars (Mars water extract (Mars WE)) and blue bar (Canadice water extract Canadice (WE)) respectively.
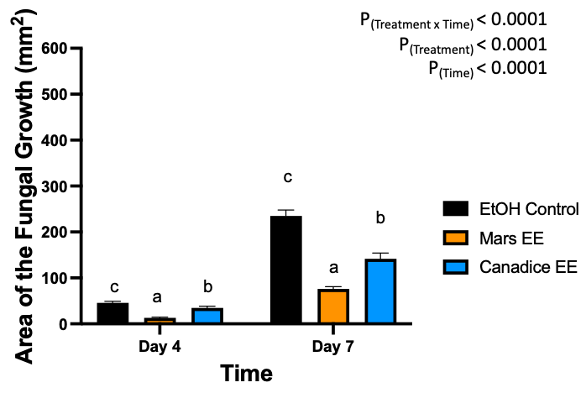
Figure 11. Bar graphs represent the antifungal activity of ethanolic extracts of Mars and Canadice leaves on area of the fungal growth (AFG) of B. cinerea on days 2, 3, 5, and 7 in detached berries. Bars show mean ± SE; (n=10). Given the significant interaction effect of treatment and time (P < 0.0001), simple effects ANOVAs were performed using one-way ANOVA, Tukey multiple comparison P < 0.05; different letters indicate significant differences. Black bars (ethanol control (EtOH)), orange bars (Mars ethanolic extract (Mars EE)) and blue bar (Canadice ethanolic extract (Canadice EE)) respectively.
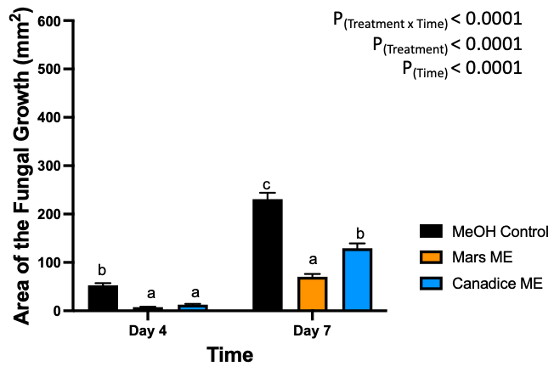
Figure 12. Bar graphs represent the antifungal activity of methanolic extracts of Mars and Canadice leaves on area of the fungal growth (AFG) of B. cinerea on days 4 and 7 in detached berries. Bars show mean ± SE; (n=10). Given the significant interaction effect of treatment and time (P < 0.0001), simple effects ANOVAs were performed using one-way ANOVA, Tukey multiple comparison P < 0.05; different letters indicate significant differences. Black bars (methanol control (MeOH)), orange bars (Mars methanolic extract (Mars ME)) and blue bar (Canadice methanolic extract (Canadice ME)) respectively.

Figure 13. Bar graphs represent the effect of Mars and Canadice senescent leaf extracts on the rot (%) when challenged with B. cinerea on post-harvest green berries. Black bars represent control (water, ethanol, and methanol), orange bar represents Mars extracts, and blue bar represents Canadice extracts. Treatments are (a)Water extracts (b) Ethanolic extracts (C) Methanolic extracts. Values shown are mean ± SE (n=10). (Two-way ANOVA, Tukey multiple comparison, P < 0.05).
The rot percentage was higher for all the controls (water, ethanol, and methanol) when compared to the Mars and Canadice leaf extracts. The figure is representative of all treatments with respective controls, however the total rot percentage berries were calculated and used for statistical analysis. The analysis of two-way ANOVA shows that there was a significant effect of time on rot percentage for water extracts (Fig. 13a; P = 0.0131), ethanolic extracts (Fig. 13b; P = 0.0229), and methanolic extracts (Fig. 13c; P = 0.0039).
Effectiveness of cell suspension cultures in controlling Botrytis cinerea in berries
Mars detached leaves treated with control, Mars and Candice suspension cultures were challenged with B. cinerea. Then the number lesions formed were counted on day 7 and subjected to analyses to compare treatments shown in Fig. 14a. Mars detached leaves treated with Mars and Canadice suspension culture had significantly reduced number of lesions of B. cinerea compared to control (Fig. 14a; P = 0.0022, and P = 0012 respectively). There was no significant effect of Mars suspension on number of lesions B. cinerea compared to Canadice suspension.
Canadice detached leaves treated with control, Mars and Canadice suspension cultures were challenged with B. cinerea. Then the number lesions formed were counted on day 7 and subjected to analyses to compare treatments shown in Fig. 14b. Canadice detached leaves treated with Mars and Canadice suspension culture had significantly reduced number of lesions of B. cinerea compared to control (Fig. 14b; P = 0.0165 and P = 0.0165, respectively). There was no significant effect of Mars suspension on number of lesions B. cinerea compared to Canadice suspension.

Figure 15. Bar graphs represent the effect of antifungal activity of Mars and Canadice cell suspension cultures on the area of the fungal growth (AFG) of B. cinerea in detached berries. Values shown are mean ± SE (n=10). Given significant interaction effect of treatment and time (P < 0.0001) simple effects ANOVAs and Tukey multiple comparison, P < 0.05 were performed separately for each day; different letters indicate significant differences. Black bar (control), orange bar (Mars suspension), and blue bar (Canadice suspension).
The Mars berries were treated with Mars and Canadice cell suspension cultures and the control and then challenged with B. cinerea. The lesion diameter was measured and calculated as area of fungal growth (AFG) and analyzed for main and simple effects using ANOVA.
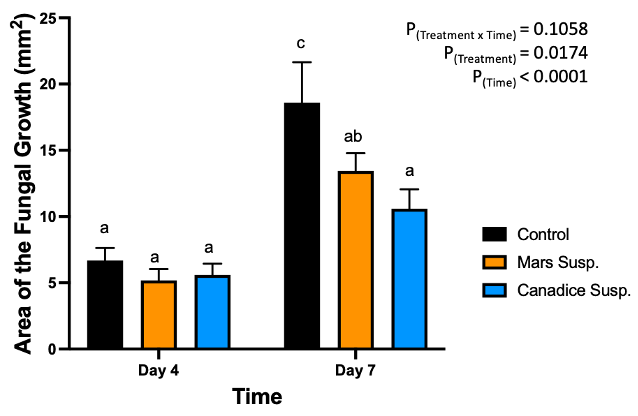
Figure 14. Bar graphs represent the effect of antifungal activity of Mars and Canadice suspension cultures on the (a) number of lesions formed after being challenged with B. cinerea on Mars leaves in detached leaf assay. (b) number of lesions formed after challenged with B. cinerea on Canadice leaves in detached leaf assay on day 7. Values shown are mean ± SE (n=15). (one-way ANOVA, Tukey multiple comparison, P < 0.05). Control (black bar), Mars suspension (orange bar), and Canadice suspension (blue bar). Different letters indicate significant differences.
In Mars berries, there was significant effect of treatment (P = 0.0174) and time (P < 0.0001) (Fig. 15). The area of the fungal growth increased with time, and Mars and Canadice suspension culture treated berries had smaller AFG when compared to control after challenging with B. cinerea. Then simple effects were analyzed separately for day 4 and 7. On day 4, all three treatments (Mars and Canadice cell suspension, and control) had no significant effect on AFG of B. cinerea. On day 7, there was a significant effect of Canadice cell suspension culture on AFG of B. cinerea compared to control (P = 0.0269). The Mars suspension culture had no effect on AFG of B. cinerea compared to control and Canadice suspension culture. No rotten berries were seen on day 4 or 7 when challenged with B. cinerea and thus rot % was not calculated. (data not shown).
Metabolic profiling of Mars and Canadice leaves and Cell Suspensions
The fold difference was calculated for metabolites that were identified using LC-MS analysis as described in methods section 3.2.2. The ten compounds with the greatest fold difference present in leaf versus cell suspension culture and vice versa for both grapevine varieties are listed in Tables 1,2, 3, and 4.
Table 1. LC-MS data of the top 10 identified compounds that are higher in Mars leaves compared to cell suspension culture.
|
Name of the compound |
Mars Leaf |
Mars cell suspension |
Fold difference (Leaf/Cell Susp. |
|
Heptylbenzene |
1.69x10³ |
8.24x10⁷ |
4.87x10⁴ |
|
Dimethomorph |
8.42x10² |
3.98x10⁷ |
4,73x10⁴ |
|
Indole-3-lactic acid |
1.27x10³ |
4.95x10⁷ |
3.89x10⁴ |
|
L- (+)-Tartaric acid |
1.39x10⁴ |
3.76x10⁸ |
2.71x10⁴ |
|
Esculin |
7.58x10² |
1.38x10⁷ |
1.82x10⁴ |
|
(DSF) Diffusible signal factor (cis-11-methly-2-dodecenoic acid) |
1.79x10³ |
2.99x10⁷ |
1.67x10⁴ |
|
2-(2-phenylethoxy)-6-{[(3,4,5-trihydroxyoxan-2-yl)oxy]methyl}oxane-3,4,5-triol |
1.45x10³ |
2.41x10⁷ |
1.65x10⁴
|
|
L- (+)-Tartaric acid |
1.12x10⁵ |
1.69x10⁹ |
1.50x10⁴ |
|
1-[2-(3-Hydroxy-1-propen-2-yl)-2,3-dihydro-1-benzofuran-5-yl]ethanone |
1.5x10³ |
2.16x10⁷ |
1.40x10⁴ |
|
2-(2E)-2-Octen-1-ylcyclopentanone |
2.57x10³ |
2.89x10⁷ |
1.12x10⁴ |
Table 2. LC-MS data of the top 10 identified compounds that are higher in Mars cell suspension culture compared to leaves.
|
Name of the compound |
Mars Leaf |
Mars cell suspension |
Fold difference (Cell Susp. /Leaf |
|
Benzyladenine |
6.98x10⁶ |
7.28x10³ |
8.92x10² |
|
N, N-Dimethylsphingosine |
4.43x10⁶ |
1.32x10³ |
3.33 x10² |
|
Cannabicitran |
8.16x10⁵ |
2.74x10³ |
2.97 x10² |
|
(2R)-1-(Octanoyloxy)-3-(phosphonooxy)-2-propanyl laurate |
2.89x10⁵ |
1.36x10³ |
2.12 x10² |
|
(2E,6E,10E)-13-[(2R)-6-Hydroxy-2,7,8-trimethyl-3,4-dihydro-2H-chromen-2-yl]-2,6,10-trimethyl-2,6,10-tridecatrienoic acid |
3.52x10⁵ |
2.21x10³ |
1.59 x10² |
|
2-[(1S,4S,5S)-5-Isopropyl-4-{[(isopropylcarbamoyl)amino]methyl}-2-methyl-2-cyclohexen-1-yl]-N-methyl-N-(3-pyridinylmethyl)acetamide |
7.77x10⁵ |
5.57x10³ |
1.39 x10² |
|
(22E)-Ergosta-5,7,22,24(28)-tetraen-3-ol |
4.61x10⁵ |
3.55x10³ |
1.29 x10² |
|
Tolcapone |
9.07x10⁵ |
8.10x10³ |
1.12 x10² |
|
Columbianetin |
1.61x10⁶ |
1.51x10³ |
1.07 x10² |
|
1-(1,8-dihydroxy-3,6-dimethyl-2-naphthyl) ethan-1-one |
6.37x10⁵ |
6.16x10³ |
1.03 x10² |
Table 3. LC-MS data of the top 10 identified compounds that are higher in Canadice leaves compared to cell suspension culture.
|
Name of the compound |
Canadice Leaf |
Canadice cell suspension |
Fold difference (Leaf/Cell Susp) |
|
Putaminoxin |
2.93x10³ |
6.27x10⁷ |
2.13x10⁴ |
|
1-Methyl-4-[(1E)-1-propen-1-yl]benzene |
4.40x10³ |
9.19x10⁸ |
2.08 x10⁴ |
|
(1S,2S,3R,6S,1'S,2'S,3'R,6'S)-6,6'-Iminobis[4-(hydroxymethyl)-4-cyclohexene-1,2,3-triol] |
2.59x10³ |
4.5 x10⁸ |
1.76x10⁴ |
|
1,1,6-Trimethyl-1,2-dihydronaphthalene |
3.22x10³ |
5.4 x10⁷ |
1.64x10⁴ |
|
N-(4-Carbamimidamidobutyl)-5-{(1Z)-3-[(4-carbamimidamidobutyl)amino]-3-oxo-1-propen-1-yl}-7-hydroxy-2-(4-hydroxyphenyl)-2,3-dihydro-1-benzofuran-3-carboxamide |
7.42x10² |
8.18 x10⁶ |
1.10x10⁴ |
|
2-(3-phenylpropyl)oxolane |
8.60x10³ |
9.36x10⁷ |
1.08x10⁴ |
|
Piceol |
3.49x10³ |
3.58x10⁷ |
1.02x10⁴
|
|
3-(2-Oxopropyl)-2-pentylcyclopentanone |
5.48x10³ |
5.3x10⁷ |
9.83x10³ |
|
1,5-Anhydro-1-{2,4-dihydroxy-6-[(E)-2-(4-hydroxyphenyl)vinyl]phenyl}hexitol |
8.31x10³ |
6.4x10⁷ |
7.78x10³ |
|
Indole-3-lactic acid |
5.75x10³ |
4.25x10⁷ |
7.38x10³ |
Table 4. LC-MS data of the top 10 identified compounds that are higher in Canadice cell suspension culture compared to leaves.
|
Name of the compound |
Canadice Leaf |
Canadice cell suspension |
Fold difference (Cell Susp /Leaf |
|
3-O-(3-Methylbutanoyl)-beta-D-fructofuranosyl 2-O-acetyl-3-O-dodecanoyl-alpha-D-glucopyranoside |
7.00x10⁵ |
1.11x10³ |
6.26x10² |
|
2,3,14,20-Tetrahydroxy-22,23-epoxyergost-7-en-6-one |
1.22x10⁶ |
2.22x10³ |
5.50x10² |
|
16-Heptadecyne-1,2,4-triol |
2.93x10⁶ |
1.08x10⁴ |
2.71x10² |
|
1,5-Dihydroxy-3,4-dimethoxy-10-methyl-9(10H)-acridinone |
1.56x10⁶ |
7.35x10³ |
2.13x10² |
|
3-O-(3-Methylbutanoyl)-beta-D-fructofuranosyl 3-O-dodecanoyl-alpha-D-glucopyranoside |
2.94x10⁵ |
1.52x10³ |
1.93x10² |
|
Benzyladenine |
1.31x10⁶ |
7.49x10³ |
1.75x10² |
|
9(S)-HpOTrE |
4.18x10⁵ |
2.84x10³ |
1.47x10² |
|
(2R)-1-(Octanoyloxy)-3-(phosphonooxy)-2-propanyl laurate |
6.57x10⁴ |
4.69x10² |
1.40x10² |
|
Ambruticin |
1.89x10⁶ |
1.39x10⁴ |
1.36x10² |
|
Stearamide |
1.16x10⁶ |
9.79x10³ |
1.18x10² |
Discussion:
Results of this study suggest that grapevine derived products (both cell suspension cultures and senescent leaf extracts) could inhibit the growth of B. cinerea on grapevine foliage and post-harvest berries and be used in the viticulture as part of an IPM program to manage Botrytis. Use of grapevine-derived products as part of prevention of B. cinerea growth was demonstrated using greenhouse grown grapevines (Khawand et al., 2021). Additional research is needed to evaluate the efficacy of grapevine-derived products compared with fungicides and to investigate the compatibility with other growing practices that are used in the vineyard. While other grapevine-derived products such as cane extracts, wood extracts, and berry skin extracts have been shown to suppress B. cinerea growth in planta, post-harvest berries, and in vitro studies (Guerrero et al., 2016; Richard et al., 2016; De Bona et al., 2019), our study builds on this knowledge, by characterizing the suppression of Botrytis on greenhouse grown cold-hardy table grapevines. The results also indicate that antifungal activity differed among the grape varieties and different grapevine-derived products. Additionally, the efficacy of grapevine-derived products shown in vitro was not always confirmed by in planta and post-harvest berries.
The efficacy of cell suspensions differed between in vitro, in planta and detached berry assays
Our study utilized cell suspension cultures produced from Mars and Canadice and the results suggest that the cell suspension cultures have some antifungal activity on mycelial growth of B. cinerea when tested in Petri plate assay. A previous study was performed using callus produced from two American varieties (V. riparia and V. rupestris), two hybrids (V. vinifera and American species), and one V. vinifera to test their antifungal activity (Dai et al., 1995a,b,c). According to Dai et al., (1995) when callus from different resistant and susceptible grapevines were inoculated with the downy mildew causing organism, there was the development of short hyphae and necrosis on callus produced from resistant varieties and long hyphae with heavy sporulation on callus produced from susceptible varieties. Furthermore, this study showed that gallocatechin derivatives, induced flavonoids, and suberized cell walls played a major role in resisting the growth of Plasmopara viticola in the grapevine callus produced from resistant cultivars (Dai et al., 1995a).
In our study, detached assays using cell suspension treatments showed a significant effect on number of lesions caused by B. cinerea. However, cell suspension cultures did not show an antifungal effect in the detached berry assay. Lesions were formed in both control and cell suspension culture treated berries, and the area of fungal growth (AFG) calculated for the extracts did not vary significantly. The Mars berries used were grown in the UNH vineyard and they have been suggested to be somewhat resistant varieties to many fungal pathogens (Sideman and Hamilton, 2016, 2019). The resistance capacity of Mars might have played a role in the development of lesion on the berries when challenged by B. cinerea as part of the detached berries assay. The results show that a lesion was formed and the size of the lesion increased from day 4 to day 7 in the inoculated area, but there were no rotten berries. The same assay was also conducted using UNH vineyard-grown Canadice (data not shown), which also had similar results on lesion size area which increased from day 4 to day 7 with no rotten berries.
The results of metabolic profiling of cell suspension cultures of both grape varieties and their fold difference when compared to leaf samples were identified and 10 compounds with the greatest differences are in Table 8 and 10. In previous research few compounds from the list were reported to have antimicrobial activity, e.g., cannabicitran, columbianetin, 9(S)-HpOTrE, and other volatiles. Cannabicitran, a cannabinoid produced in C. sativa is reported to have antimicrobial against many bacteria in humans and popularly used in pharma industries (Bercht et al., 1974; Karas et al., 2020; Hong et al., 2022). Columbianetin, is a furanocoumarin (phytoalexin) associated with celery resistance during storage against plant pathogens such as B. cinerea, A. alternata, and S. sclerotiorum (ED50 value of 25-48 µg/mL). ED50 is the dose of compound that produces effect in 50% of population that are treated with it (Afek et al., 1995; Huang, 2001). 9(S)-HpOTrE, is a plant oxylipin, shown to be part of the lipid profile in Sauvignon Blanc (Podolyan, 1994). When oxidized to 9-Ox0OTrE, exhibits antimicrobial activity against plant pathogens including bacteria and fungi (Prost et al., 2005; Tang et al., 2020).
Cell suspension culture that presented some antifungal activity on the mycelial growth of B. cinerea in Petri plate experiments. However, the suspension culture did not show significant effect on detached berry assays. Both the assays were performed using aqueous extracts using 0.05mL/mL PDA for in vitro assay and 1 mL /berry for detached berry assay. At the same time, the metabolic profiling was performed using organic extracts (acetonitrile:isopropanol:water), and the compounds identified were previously reported to have antimicrobial activity. Moreover, cells recovered from 50 mL of cell suspension culture and 100 mg of cells were used for metabolic profiling. The antifungal activity of cell suspension cultures is yet to be confirmed in planta experiments. I hypothesize that different extraction solvents can influence both the results of antifungal activity in vitro, in planta and detached berry assays and the compounds identified through metabolic profiling. Also, the volume of cells used to perform in vitro and berry experiments were different from the volume used for metabolic profiling. These two factors, extracts and volume might play a role in supporting the results and can only be confirmed by investigating using the organic extracts in vitro, in planta and detached berry assays.
The efficacy of senescent leaf extracts differed between in vitro, in planta and detached berry assays
The antifungal activity of water, ethanolic, and methanolic extracts of Mars and Canadice senescent leaves extracts were tested. There was a significant antifungal effect of all three treatments when tested in vitro for the antifungal activity, compared with the respective controls. The Mars extracts showed reduced area of fungal growth when compared to Canadice extracts. These results are in agreement with the results of a previous study showing that the methanolic and ethanolic extracts of grapevine canes have a better antifungal activity against B. cinerea, P. viticola, and E. necator when compared to aqueous extracts (Schnee et al., 2013). In another report, grapevine ethanolic cane extracts had a direct antifungal activity against B. cinerea on nutrient agar medium, where the mycelial growth was halved when compared to the control (De Bona et al., 2019). In our study, the number of spores formed on day 7 was counted. Though the number of spores were different between aqueous, methanolic and ethanolic extracts of Mars and Canadice, the statistical analysis showed that there was a significant effect of all leaf extract treatments on the in vitro spore formation.
Considering the observed leaf extract antifungal activity in vitro against B. cinerea, a reduced number of lesions was expected on grapevine leaves. In the detached leaf assay, treatment with Mars leaf ethanolic extracts led to lower number of lesions compared to the water and ethanol control treated leaves, when challenged with B. cinerea. Similar results were obtained in detached berry assays. Store-bought green berries (variety unknown) were treated with Canadice and Mars leaf water, ethanolic and methanolic extracts and then challenged with B. cinerea. All extracts were found to be effective against B. cinerea compared to their respective controls. This study builds on knowledge from previous investigation using pure phenolic compounds such as resveratrol, pterostilbene, and piceatannol treated berries challenged with B. cinerea, which showed reduced lesions on day 7 (Xu et al., 2018a,b). From the LC-MS data obtained from this study it has been confirmed that the senescent leaves have distinct types of metabolites that includes different types of phenolic compounds. We hypothesize that these phenolic compounds may play a role in reducing the lesion diameter in the inoculated area. However, the in vitro results were not confirmed by in planta greenhouse experiments. The ethanolic extracts of Canadice did not show a significant effect in planta.
Our study utilizes the approach of testing the extracts of leaves that were senescing and were expected to have antifungal activity. In a previous study, extracts of leaves collected after harvest had more phenolic compounds than those collected early in the season (Katalinic et al., 2009). Leaf extracts also showed a good antimicrobial activity against five different bacteria (Katalinić et al., 2010). A previous study demonstrated that leaf extracts of red varieties V. vinifera L. cv Merlot and cv Vranac showed the presence of higher amounts of flavonols, phenolic acids, and flavan-3-ols (Anđelković et al., 2015). Further, the leaf extracts showed a stronger antimicrobial activity compared to methanol control against various types of bacteria and yeast and the study also suggested that the grapevine leaves can be used as additives in food and pharma industries (Anđelković et al., 2015). In the present study, the results of in vitro experiments were not translated in the in planta experiments, similar to results obtained when Pinot noir cane extracts were compared in vitro with the in planta treatment (De Bona et al., 2019).
The presence of fungicide residue on leaves is a limitation of using senescent leaves to test the antifungal activity in this study. Different types of protectant and systemic fungicides were applied to grapevines during the growing season for protecting them from fungal pathogens that can affect the vines at different stages of growth. Protectant fungicides remain outside the plant surface and kill fungal spores and other fungal products thereby preventing the infection, whereas systemic fungicides may move into the plant and sometimes throughout the plant. There are research reports that had demonstrated the persistence of fungicides such as captan and others being present for 7-14 days and reduced by more than 70% after 21 days (Frank et al., 1985; Schilder, 2010; Gajbhiye et al., 2011; Mohapatra and Ajithakumar, 2014). This study utilized field-collected grapevine leaves one month after harvest and two months after the last fungicide was applied (Table 1) believing that fungicide activity lasts for 21 days. The main reason behind using the field-collected ones instead of greenhouse leaves is that the grapevines growing in the vineyards are being faced by different types of abiotic and biotic stressors throughout the growing season. The natural mechanism is that vineyard grown grapevines, and all other plants produce several types of secondary metabolites such as phenolics, flavonoids, and anthocyanins to protect themselves from distinct types of stressors (Petrova et al., 2006; Batovska et al., 2008; Katalinic et al., 2013). In contrast, the greenhouse ones are grown in set experimental conditions and not being affected by stressors are believed to have limited produced compounds that can have antifungal activity. In future to overcome the limitation of fungicide residue interference with antifungal compounds present in grapevine leaves, metabolic profiling can be performed for both antifungal compounds and fungicides. This investigation will reveal the amount of fungicide residue present and also can help to differentiate between the natural antifungal compound’s activity. Alternatively, leaves not treated with fungicides could be used.
The results of metabolic profiling of senescent leaves of both grape varieties were completely different when compared to their respective cell culture profiles. The list of compounds with greatest differences as listed previously in Table 7 and 9 have a different antimicrobial mechanism when compared to the cell culture compounds. Scientists demonstrated from the previous research that few compounds from the list were reported to have antimicrobial activity, e.g., Indole-3-lactic acid, esculin, DSF (diffusible signal factor), piceol, and other volatiles. Some of the compounds are part of coumarins and phenylpropanoid pathway metabolites having proven to have antifungal and antimicrobial activity as part of different research studies. Indole-3-lacticacid, part of phenylpropanoid pathway involved in synthesis of phenolic compounds that exhibit antifungal property (Fabre et al., 2014). Esculin, natural dihydroxycoumarin present in Fraxinus ornus bark demonstrated antimicrobial activity against different microbes (Kostova et al., 1993). Piceol, phenolic compound identified in resistant white spruce was actively produced when attacked by herbivory budworms (Delvas et al., 2011). DSF, known as diffusible signal factor, is a monounsaturated fatty acid which is part of lipid profiles in different types of grapes (Matijasevic et al., 2013; Lončarić et al., 2022). Studies have reported that increasing DSF production by transformation in ‘Freedom’ grape have reduced Pierce’s disease by reducing pathogen growth and mobility within the plant (Lindow et al., 2014).
Our research has shown that grapevine-derived products such as cell suspension cultures and senescent leaf extracts may play a role in suppressing the effects of gray mold disease. The results also show differences in antifungal activity between in vitro, in planta, and detached berry assays. The cell suspension cultures and senescent leaf extracts have various kinds of phenolic compounds and secondary metabolites that can be involved in the inhibition of mycelial growth of B. cinerea. The cell suspension cultures have an advantage of not sacrificing whole plant and can be produced in enormous quantities using bioreactors. Resveratrol and other phenolics are expensive to purchase and use as an IPM alternative, instead grapevine-derived products, and wastes such as grape pomace, and pruning canes and leaves, which contain rich amounts of resveratrol and other phenolic compounds, may be a low-cost source that can be extracted and applied together with regular fungicides to control Botrytis. We hypothesize that the crude extracts of different parts of grapevine-derived products (V. vinifera based) were tested before and products from interspecific hybrids (V. labrusca and V. vinifera) appears to be effective at reducing the growth and spread of gray mold causing organism. This research suggests that there is still more to investigate and learn about interspecific cold-hardy grapevine-derived products and their role in performing antifungal activity against B. cinerea.
Education & outreach activities and participation summary
Participation summary:
I presented my project during Greenhouse meet in MacFarlane greenhouses to the public, viticulturists, greenhouse growers and educational experts. I also presented the work and outcomes in Woodland Research farm during Under the Vines day to the grapevine growers and discussed in a detailed manner. I also present the results of this research in my thesis as objective 2 and the thesis can be accessed in Proquest UNH 2022.
Project Outcomes
The results show that the aqueous, ethanolic, and methanolic extracts of senescent leaves showed antifungal activity against B. cinerea. These results were confirmed by performing in vitro and berry experiments, though the results were not translated in planta experiments. Later, the leaf ethanolic extracts were used to test the antifungal activity in planta in greenhouses. The aqueous extracts of cell suspension culture did show antifungal activity against B. cinerea in vitro and detached leaf assay, but not on detached berry experiments. These results suggests that the cell suspension culture has some antifungal activity, though it needs confirmation by performing in planta experiments in greenhouses. The metabolic profiling of senescent leaves and cell cultures was performed using organic extracts to identify metabolites responsible for antifungal activity. The results showed a list of compounds reported in different studies exhibiting antifungal activity.
Knowledge gained in this project has served as a baseline for hands-on experience to understand that grapevine-derived products have antifungal properties. Similar to the debris of Vitis vinifera, interspecific cold-hardy grapevines also exhibit antifungal properties, and different compounds identified using LC-MS analysis opened up a new direction to the findings. In future if I get a chance to work with grapevines, I would continue with this work and design experiments to produce cell suspension cultures using different elicitors and identify various secondary metabolites that can have antifungal properties.
The antifungal activity of grapevine-derived products against B. cinerea has been in their initial stages of research; future work should examine the changes of metabolites during the annual cycle of Mars and Canadice leaves. Future studies should also test the antifungal activity of ethanolic and methanolic extracts of grape cell suspension cultures against B. cinerea. Defense responses of Mars and Canadice cell suspensions can be elicited using pathogens, and subsequent metabolomic analysis could help clarify the various metabolites involved in the antifungal nature of the culture. The discrimination of profiles by eliciting and non-eliciting cell suspension cultures can be performed using the fast and easy approach of NMR spectroscopy. Moreover, the immense potential of NMR-based metabolomic studies can be demonstrated to accustom the sustainable approach of using botanical pesticides. This research used senescent leaves collected at harvest and fresh established calli to test antifungal activity. In the future, leaf samples at different phenophases can be used to investigate antifungal activity and simultaneously use the leaf extracts to profile metabolites. Grapevines are treated with various types of fungicides during the growing season and the fungicide residues may interfere with the performance of antifungal activity while using the leaves. To overcome this limitation, the leaves must be tested for quantification of fungicides with metabolic profiling to investigate their interference or use non-treated leaves which is more definitive. According to various research reports, the protectant fungicides such as captan, penncozeb, ziram and others are persistent in the leaves and grapes for 7-14 days depending upon the rate applied, and weather conditions (Frank et al., 1985; Schilder, 2010; Gajbhiye et al., 2011). The calli can be produced using different hormone combinations, elicited using fungal pathogens, UV-irradiation, and chemicals to check the different secondary metabolites produced. Then they can be used to test antifungal activity and metabolic profiling to understand how cold-hardy grapevine metabolites differ from the V. vinifera cultivars. Mars and Canadice are among the interspecific hybrids (V. labrusca x V. vinifera) that can serve as models of other table grapes that were produced using similar parents.