Final report for GNE21-268
Project Information
- Rising sea levels, storms, and perigean spring tides push saltwater into coastal agricultural fields. This phenomenon, known as saltwater intrusion (SWI), alters nutrient cycling and damages crop yields. As sea levels continue to rise, saltwater intrusion will only worsen, with devastating consequences to agroecosystems along the coast of the Chesapeake Bay. Researchers and farmers alike are looking for solutions to adapt to and mitigate the effects of saltwater intrusion. Landowners may respond by altering their management practices. Farmers may 1) adapt by planting a salt-tolerant crop, 2) attempt to remediate soils with trap crops, 3) restore native marsh grasses, or 4) abandon fields altogether. This project aimed to understand the survival of different crops and plant treatments under saltwater-intruded conditions and the potential for these plants to survive and to remove excess nutrients (e.g. sodium and phosphorus) from the soil, with the overall goal to benefit both the farming community and water quality in the Chesapeake Bay.
- We have yet to understand the influence of these management practices on biogeochemical cycling, specifically phosphorus (P) and cation (calcium, magnesium, potassium, sodium) dynamics. Improving soil health and plant productivity hinges on quantifying these concentrations and pools in the soil, plant tissues, and porewater to identify differences in management options under SWI conditions. We established a study to investigate the concentrations and pools of P and cations in the soil and plant leaf tissue of four different management strategies represented by five proxy species: adapt (e.g., Cl-excluding soybeans [Glycine max], sorghum [Sorghum bicolor]), remediate (e.g., switchgrass [Panicum virgatum]), restore (e.g., saltmarsh hay [Spartina patens]), and abandon (e.g., weeds [Panicum dichotomiflorum]) on fields experiencing SWI.
- In this study, we showed that remediation and restoration management practices are efficient in taking up soil and porewater P that may ultimately decrease P runoff into the Chesapeake Bay. Overall, patterns of P pools were influenced by biomass levels, and after three years of growth, switchgrass and saltmarsh hay produced more biomass than weeds, sorghum, or salt-tolerant soybeans, and their production was influenced by the degree of SWI at each site. In sum, planting either switchgrass or saltmarsh hay would have economic and environmental benefits in mitigating the adverse effects of SWI. Additionally, we observed patterns of regulation in nutrient uptake in saltmarsh hay despite the imbalance of normal nutrient uptake due to saltwater magnesium (Mg). Results from this study also showed restoration management practices are efficient at taking up soil sodium (Na), and may keep up with high Na concentrations and pools in the soil over time, which may benefit both soil and plant health on saltwater-intruded fields. Finally, we determined the best management practice to combat SLR and SWI (e.g., planting switchgrass or saltmarsh hay) will depend on the conditions of the land (e.g., high soil P or Na or both) and the goal of the landowner (e.g., economic or environmental benefit or both).
- Results from this study will help inform new management practices to increase soil health and maintain crop yields. By determining the efficacy of best management practices, we aimed to help farmers keep their land profitable and remove excess P from the soil to promote better water quality. Improved economic and environmental sustainability in turn supports social sustainability by maintaining the viability of rural livelihoods and landscapes. Thus, it is important to understand the trajectories of different land management practices if farmers’ goals are to continue crop production while avoiding addition of excess nutrients to the Bay. The findings of this research will help inform farmer management decisions given economic and environmental objectives and tradeoffs. Finally, the goal of this work was to guide local best management practices and potential easement opportunities for landowners facing saltwater intrusion, and ultimately determine optimal strategies for climate resilience.
- To better understand P dynamics in soil and plant tissue (and how SWI effects soil chemistry and plant nutrient uptake), I had four objectives:
Obj.1.1. Quantify soil available P and total P, leaf tissue P, and porewater P concentrations and pools among adaptation, remediation, restoration, and abandonment systems and species
Obj.1.2. Determine if P biomass pools in representative species (e.g., adapt, remediate, restore, abandon) change along a SWI gradient
Obj.1.3. Determine if field management practices (e.g., adapt, remediate, restore, abandon) change soil P concentrations and pools along a SWI gradient
Obj.1.4. Determine if field management practices (e.g., adapt, remediate, restore, abandon) change porewater P concentrations along a SWI gradient
-
To better understand cation dynamics in soil and plant tissue (and how SWI effects soil chemistry and plant nutrient uptake), I had three objectives:
Obj.2.1. Quantify leaf tissue cation and soil available cation (calcium, magnesium, potassium, sodium) concentrations and pools among remediation, restoration, and abandonment systems and species
Obj.2.2. Determine if biomass cation pools in representative species change along a SWI gradient
Obj.2.3. Determine if field management practices change soil cation concentrations and pools along a SWI gradient
The purpose of this project was to identify best management practices for farmers facing saltwater intrusion (SWI). This was done by determining the effects of adaptation, remediation, restoration, and abandonment treatments on soil and plant P and cation (e.g., Na) levels. These results were used to determine the potential of each management practice to remove P and Na from soils to increase land productivity and reduce nutrient pollution of the Chesapeake Bay, contributing to the economic and environmental sustainability of systems in the region.
Climate change is often viewed as an impending threat. However, on the Eastern Seaboard of the U.S., SWI is already damaging agricultural systems, negatively impacting plant productivity and soil health [1]. Unfortunately, SWI will only worsen as sea levels continue to rise [2, 3]. Saltwater intrusion is the movement of sea salts into freshwater aquifers and shallow groundwater tables. Sea level is projected to rise by 0.2-0.5 meters by 2050 [4], concurrently with increased frequency of storm events and drought. Saltwater intrusion encroaches on coastal agricultural land connected to saline water bodies (e.g. tidal channels) through ditch networks [5]. This phenomenon causes an alteration in biogeochemical cycling, leading to eutrophication through the loss of nutrients (e.g. P), decreased land productivity through soil aggregate dispersion (e.g. due to Na), and overall loss of farmland through the flooding of fields and conversion of uplands into tidal marshes [3].
Agriculture is a way of life on the Eastern Shore of Maryland. Centuries of cultivation have drastically altered soil physical and chemical properties in the region. This history of land management is now clashing with the new threat of SWI. Soil P levels are high in the region due to decades of fertilizer applications in the form of poultry manure (known as “legacy P”) [6, 7]. At the same time, SWI is changing soil chemistry through the introduction of elements like Na. Sodium can lead to swelling and soil aggregate dispersion, reducing drainage and infiltration [8]. Saltwater intrusion may also release legacy P due to competition between phosphate (PO4) and sulfate for iron (Fe) on soil mineral surfaces [9]. As soils become anoxic, Fe is reduced and releases PO4 into solution. With SWI, the sulfate in saltwater competes with PO4 for Fe binding sites as the soils dry, leaving P in solution and prone to loss [10, 11].
My team has observed soil salinity levels ranging from 5 to 20 ppt in farm soils across the Lower Eastern Shore of Maryland [12]. However, most agronomic crops in the region do not tolerate salinity levels above 1-3 ppt [13, 14]. Elevated salinity levels have forced farmers to reconsider management practices. Landowners in coastal regions facing SWI have several choices: continue farming with salt-tolerant crops, remediate fields for a few years before returning to agriculture, restore the land to native marshes (which creates wildlife habitat that supports recreational activities like duck hunting), or abandon salt-damaged fields entirely [3].
- Bhattachan, A., Emanuel, R. E., Ardon, M., Bernhardt, E. S., Anderson, S. M., Stillwagon, M. G., ... & Olden, J. D. (2018). Evaluating the effects of land-use change and future climate change on vulnerability of coastal landscapes to saltwater intrusion. Elementa: Science of the Anthropocene, 6.
- Neubauer, S. C., Franklin, R. B., & Berrier, D. J. (2013). Saltwater intrusion into tidal freshwater marshes alters the biogeochemical processing of organic carbon. Biogeosciences, 10(12), 8171-8183.
- Tully, K., Gedan, K., Epanchin-Niell, R., Strong, A., Bernhardt, E. S., BenDor, T., ... & Weston, N. B. (2019). The invisible flood: The chemistry, ecology, and social implications of coastal saltwater intrusion. BioScience, 69(5), 368-378.
- Boesch, D. F., Boicourt, W. C., Cullather, R. I., Ezer, T., Galloway Jr, G. E., Johnson, Z. P., ... & Li, M. (2018). Sea-level rise: projections for Maryland 2018.
- Bhattachan, A., Jurjonas, M. D., Moody, A. C., Morris, P. R., Sanchez, G. M., Smart, L. S., ... & Seekamp, E. L. (2019). Sea level rise impacts on rural coastal social-ecological systems and the implications for decision making. Environmental Science & Policy, 90, 122-134.
- Kleinman, P. J., Church, C., Saporito, L. S., McGrath, J. M., Reiter, M. S., Allen, A. L., ... & Joern, B. C. (2015). Phosphorus leaching from agricultural soils of the Delmarva Peninsula, USA. Journal of environmental quality, 44(2), 524-534.
- Kleinman, P. J. (2017). The persistent environmental relevance of soil phosphorus sorption saturation. Current Pollution Reports, 3(2), 141-150.
- Weil, R. R., & Brady, N. C. 2017. The nature and properties of soils, 15th Edition. Pearson Press, Upper Saddle River NJ, USA.
- Jordan, T. E., Cornwell, J. C., Boynton, W. R., & Anderson, J. T. (2008). Changes in phosphorus biogeochemistry along an estuarine salinity gradient: The iron conveyer belt. Limnology and Oceanography, 53(1), 172-184.
- Upreti, K., Joshi, S. R., McGrath, J., & Jaisi, D. P. (2015). Factors controlling phosphorus mobilization in a coastal plain tributary to the Chesapeake Bay. Soil Science Society of America Journal, 79(3), 826-837.
- Weissman, D., Tully, K. L., Wyner, W. J., Miller, J., & Jordan, T. (2019). Soils in transition: saltwater intrusion alters soil chemistry in agricultural fields. Biogeochemistry, 142(3), 339-356.
- Weissman, D. & Tully, K.L. (2019). Soil salinity on the Lower Eastern Shore of Maryland. Unpublished data.
- Food and Agriculture Organization (FAO). 2021. Conservation Agriculture. Available online at: http://www.fao.org/conservation-agriculture/impact/benefits-of-ca/en/ (accessed March 2021).
- Tanji, K. K., & Kielen, N. C. (2003). Agricultural drainage water management in arid and semi-arid areas, FAO irrigation and drainage paper 61, annex 1: crop salt tolerance data. United Nations Food and Agriculture Organization, Rome.
Cooperators
- (Educator and Researcher)
- (Educator and Researcher)
Research
The following objectives were accomplished via field experiments established in Somerset and Dorchester Counties, Maryland. Soil and plant samples were processed and analyzed at the University of Maryland, College Park (UMCP).
Experimental design
I leveraged three experimental sites and one no-salt control site established by Drs. Tully, Gedan, and Miller on the Lower Eastern Shore of Maryland in 2018. The experiment was designed to examine the survival of different treatments under SWI. My research added a new element - the potential for these treatments to remove Na and P. Thus, my work added a novel element, which is highly relevant to the NE SARE objective of good stewardship, profitability, and quality of life for farmers and the agricultural community by guiding best management practices and reducing nutrient losses to the Bay.
Field sites were located on three saltwater-intruded agricultural fields planted with four replicate blocks of six treatments: (1-3) salt-tolerant crop rotation (salt-tolerant soybean, Glycine max; sorghum, Sorghum bicolor; and barley, Hordeum vulgare), (4) perennial remediation species (switchgrass, Panicum virgatum), (5) perennial restoration species (saltmarsh hay, Spartina patens), and (6) abandoned (natural recruitment control; native switchgrass, Panicum dichotomiflorum). Each plot was 3 m wide and 20 m long to capture a natural salinity gradient from the edge of the field (visible intrusion) to the center of the field (no visible intrusion). There was a 0.5 m buffer between treatments and a 1 m buffer between each block (Figure 1.1). The no-salt control field site had a layout of 16 plots with the same treatments (1-3) and a salt-tolerant crop rotation (salt-tolerant soybean, sorghum, and barley) with each entry point present every year, a remediation species (switchgrass) (treatment 4), and an abandonment species (native grasses) (treatment 6). As the field was not affected by saltwater, we did not install the restoration species (treatment 5; saltmarsh hay). Plots in the no-salt control were also 3 m x 20 m with a 0.5 m buffer between treatments and 1 m buffer between blocks. Soils at all sites were predominantly silt loams (Table 1.1) with little to no slope. The climate in the region is humid subtropical with a mean annual minimum temperature of 9.8 ºC, a mean annual maximum temperature of 20.6 ºC, and annual precipitation of 1270 mm (CLIMOD 2021; NOAA 2021).
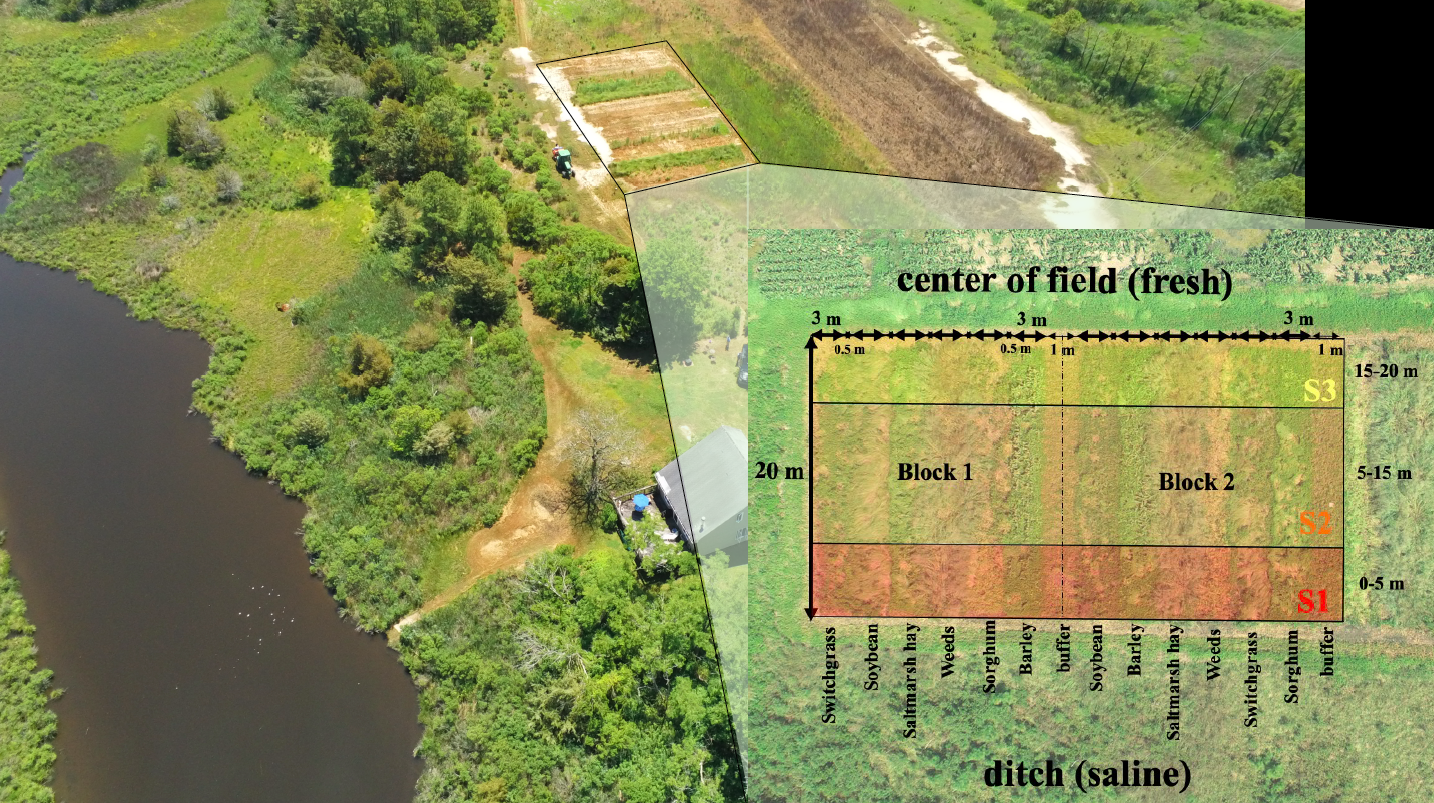
Table 1.1. Soil characteristics of field sites on the Lower Eastern Shore of Maryland collected from 0-10 cm in 2018.
|
Site |
Location |
Texture |
Baseline SOM |
Baseline bioavailable |
Clay (%) |
Silt (%) |
Sand (%) |
Taxonomic Classification |
|
Farm 1 |
Somerset Co., MD
Nearest town: Princess Anne |
Queponco silt loam |
2.1 ± 0.4 |
284 ± 73 |
16.74 |
38.31 |
44.95 |
mesic Typic Hapludults |
|
Farm 3 |
Somerset Co., MD
Nearest town: Crisfield |
Othello- Fallsington complex sandy loam |
2.7 ± 0.5 |
275 ± 16 |
8.50 |
21.83 |
69.83 |
mesic Typic Endoaquults |
|
Farm 6 |
Dorchester Co., MD
Nearest town: Cambridge |
Elkton silt loam |
2.3 ± 0.3 |
130 ± 25 |
23.57 |
71.59 |
4.84 |
mesic Typic Endoaquults |
|
LESREC (Control) |
Wicomico Co., MD
Nearest town: Quantico |
Mattapex silt loams |
2.0 ± 0.2 |
32 ± 8 |
22.93 |
64.75 |
12.32 |
mesic Aquic Hapludults |
Soil collection
In 2018, soil bulk density was collected from each block at Farm 6 and Farm 3 using a 5-cm diameter x 15-cm deep core and an AMS compact slide hammer (Core Sampler Complete, AMS, American Falls, ID, USA). Soil bulk density cores were collected every 0-10, 10-20, 20-30, and 30-60 cm. Soil samples were collected for bulk density in 2019 from each block at Farm 1 by digging pits to 55 cm and a 5-cm aluminum core was pushed horizontally into the side of the pit at 0-10, 10-20, 20-30, and 30-60 cm. In both cases, soils were returned to the University of Maryland - College Park and dried at 105ºC for 7 days. Core volume was used to calculate bulk density (g cm-3). Soil bulk density at LESREC was measured using the same process in September of 2021.
Baseline soils were collected from Farm 6 and Farm 3 in March of 2018 by compositing three cores taken at each depth (0-10 cm, 10-20 cm, 20-30 cm, and 30-60 cm) in each subplot using a 22-mm diameter push probe (AMS, Idaho Falls, ID, USA). Baseline soils were collected from Farm 1 and LESREC in November of 2018 using the same method as above. Baseline soils were analyzed for total C and N using dry combustion (LECO TruMac N, St. Joseph, MI). Soil available P, Ca, K, Mg, Na, and S were determined on an ICP following Mehlich-3 extraction (Mehlich 1984). Texture was determined using the hydrometer method (Gee and Bauder 1979; Table 1.1).
Starting in November 2019, we collected soil samples at the plot-level using the same depths as above (0-10, 10-20, 20-30, 30-60 cm; three replicates for each depth) at 5, 10, and 15 m from the edge of the field (Figure 1.2). Since the LESREC site did not have a salinity gradient, we sampled only at the plot-level. Because we found that soil Ca, K, Mg, Na, and P concentrations approached zero below a depth of 30 cm in 2018 and 2019, we only analyzed soils collected from 0-30 cm depths in 2021 and 2022.
Annual soil analysis
Annual soil samples were air-dried for at least three days before homogenization by grinding through a 2-mm mesh sieve. Ground soils were oven-dried for two days prior to analysis (60 ºC). Each depth was analyzed for texture (hydrometer method; Gee and Bauder 1979), total P (modified Kjeldahl digestion; Bradstreet 1954), and bioavailable P (Mehlich-3 extraction; Mehlich 1984). Soils from our 2021 collection were digested at 160 ºC with sulfuric/salicylic acid solution to break the carbon bonds between organic P compounds, which converts organic elements to a measurable inorganic form (e.g., total P) (Bradstreet 1954). The digestate solution was analyzed for total P on a LACHAT QuikChem (LACHAT Instruments Loveand, CO) using the molybdate-blue method for PO4-P (detection limit 0.01 mg PO4-P/L; Murphy & Riley 1962). Bioavailable P was also analyzed using the molybdate-blue method as above. Upon initial inspection, available P levels in the 30-60 cm depth were low (less than 25 mg kg-1) and similar across site, treatment, and section, so we focused on soil concentrations in the 0-30 cm depths for 2018 and 2021 collections.
Annual soil samples were air-dried for at least three days before homogenization by grinding through a 2-mm mesh sieve. Ground soils were oven-dried two days prior to analysis (60 ºC). Each depth was analyzed for texture (hydrometer method; Gee and Bauder 1979) and exchangeable Ca, K, Mg, and Na (Mehlich-3 extraction; Mehlich 1984). Exchangeable Ca, K, Mg, and Na in the 2021 soil samples were analyzed using air-acetylene flame Atomic Absorption Spectrometry (AAS; PerkinElmer Waltham, MA). Upon initial inspection, available Ca, K, Mg, and Na levels in the 30-60 cm depth were low and similar across site, treatment, and section, so we focused on soil cation concentrations in the 0-30 cm depths for 2018 and 2021 collections. We also found that there was not a significant difference between section across site, treatment, and depth, so we analyzed soil cation concentrations from the 0-5 m and 15-20 m distance from the ditch for the 2021 collection.
To calculate soil nutrient pools, the nutrient concentrations from each individual depth increment (e.g., 0-10, 10-20, 20-30, and 30-60 cm) was multiplied by the depth of the segment (in cm) and the bulk density (g cm-3).
Ground and dried soil samples were analyzed for electrical conductivity (EC) in 2018, 2019, 2020, and 2021 in a 1:5 soil to water slurry. Electrical conductivity was measured using a Thermo Scientific Orion Versa Star Pro (Thermo Fisher Scientific, Hampton, NH).
Fertility Index Values (FIV) were used to determine the relative level of plant available nutrients measured by soil testing, using a protocol from the Maryland Cooperative Extension Soil Testing Laboratory (Coale et al. 2021). These specific numbers were chosen to set the highest concentration within the “optimum” range (< 100-150) to an FIV of 100 to make the values comparable (Eq. 1).
Eq. 1. FIV 100 = (Phosphorus concentration * X) + Y
Baseline (2018) soil nutrient concentrations were determined by Brookside Laboratories, and 2021 soil nutrient concentrations were determined by Penn State Laboratories. To calculate FIV in the topsoil (0-10 cm), Mehlich-3 extractable P (in kg ha-1) in 2018 were multiplied by 1.20 and added by 3 (Brookside Laboratories conversion; Eq. 2) and in 2021 were multiplied by 1.11 and added by 7 (Penn State Laboratories conversion; Eq. 3) found in the Soil Fertility Management Table 2 (University of Maryland Extension 2021).
Eq. 2. FIV = (302 kg ha-1 * 1.20) + 3
Eq. 3. FIV = (229 kg ha-1 * 1.11) + 7
Porewater collection
Porous cup lysimeters (22 mm diameter; Soil Solution Access Tubes, Irrometer Riverside, California, USA) were installed in March 2018 (Farm 3, Farm 6) and October 2018 (Farm 1) to 60 cm depth at 5 m (visible saltwater intrusion) and 15 m from the edge of the plot (no visible saltwater intrusion). Lysimeters were installed by removing soil to 60 cm with a 22 mm diameter soil probe (AMS, Idaho Falls, ID, USA). Lysimeters were sealed at the soil surface with a bentonite/clay mixture (Benseal, Halliburton, TX, USA). Pilot studies confirmed that soil solution collection was only possible following rain events that were greater than or equal to 6 mm, thus soil solution was only collected following rain events of this level. Samples were collected at roughly 2-week intervals from March through November of each year (2018-2021). The day before sampling, lysimeters were purged of any water, and an internal pressure of -60 to -70 kPa was applied. Soil solution samples were collected, filtered (1 μm glass fiber filters), and stored in a freezer at -20°C until further analysis.
Porewater analysis
Electrical conductivity (EC) was measured using a Thermo Scientific Orion Versa Star Pro (Thermo Fisher Scientific, Hampton, New Hampshire, USA). A subsample of the filtered soil solution was acidified using 10% hydrochloride (HCl) solution (150 μL 10% HCl in 15 mL soil solution). This sample was analyzed colorimetrically on a LACHAT QuikChem (LACHAT Instruments, Loveland, CO, USA) using the molybdate-blue method for PO4-P (detection limit 0.01 mg PO4-P/L; Murphy & Riley 1962).
Plant collection
We used agronomic methods of biomass estimation for crops (adapt), and ecological methods for all other treatments (remediate, restore, abandon). Biomass was collected from the weeds, saltmarsh hay, and switchgrass plots from the three saltwater-intruded sites (Farm 1, Farm 3, Farm 6) in August 2018, 2019, 2020, and 2021. Biomass was collected from three replicate 0.25 m2 quadrats in four subplots: 0-5, 5-10, 10-15, and 15-20 m from the brackish water ditch that borders the study sites to capture the effects of salinity (Figure 1.2). Switchgrass was collected from LESREC at the plot level. Total biomass samples were clipped within 2 cm of the soil surface, weighed wet, allowed to air-dry, sorted to species, and then clipped again into sub-samples for processing. Sub-samples were oven-dried for at least 48 h at 60 ºC and weighed for conversion of total plant biomass to dry-weight-equivalent (DWE). Biomass of each species was summed at the quadrat-level and scaled to kg ha-1 to measure treatment effects on plant biomass. Each year, we determined the dominant weed species after processing. In 2018, fall panic grass (Panicum dichotomiflorum), a native variety of switchgrass, was a species common to nearly all weed plots across all sites therefore, was retained for tissue analysis. In the following years (2019-2022), the most common species was Digitaria sanguinalis, so this species was retained for tissue analysis.
Mature sorghum seed heads were collected from the sorghum plots in late September to early October and soybean plots in late October 2018, 2019, and 2020 along the saltwater intrusion gradient as described above (0-5, 5-10, 10-15, 15-20 m from the ditch). Soybean and sorghum yields were collected using a 0.25 m2 quadrat as a guide and collected by row in each plot. Five rows were collected of soybeans and three rows were collected of sorghum. Both sorghum and soybean seeds were passed through a plot combine (Massey-Ferguson 8XP Clarington, Ontario), bagged, and weighed on a scale to estimate the total yield per subplot (in bu acre-1). In the no-salt control field (LESREC), we collected biomass at the plot-level (as there was no salinity gradient) and processed as described above. Sorghum and soybean were collected in 2021 differently. Random individual sorghum and soybean plants were clipped within 2 cm of the soil surface from each subplot (three replicates) of their respective plots in October. The whole plant (including mature seed head or soybean seeds) was weighed wet, oven-dried for at least 48 h at 60 ºC, and weighed dry for conversion of total plant biomass to dry-weight-equivalent. The remaining crops were dried then passed through the plot combine, bagged, and weighed. Yields were adjusted to the correct moisture. Harvestable yields and biomass were converted to an area-basis (kg ha-1).
Plant analysis
Oven-dry (60 ºC) plant sub-samples from each treatment and year were homogenized by grinding through a 2-mm mesh screen (Wiley Mill, Swedesboro, New Jersey) and analyzed for total P. Plant tissue samples were digested as above (modified Kjeldahl; Bradstreet 1954). The digestate solution was analyzed for total P using colorimetry on a LACHAT QuikChem (LACHAT Instruments Loveand, CO) using the molybdate-blue method for PO4-P (detection limit 0.01 mg PO4-P/L; Murphy & Riley 1962). Biomass P pools, also known as P removal or P stocks, were calculated by multiplying nutrient concentrations by the aboveground biomass (DWE) and yields (DWE; kg ha-1) collected from the plots.
Oven-dry (60 ºC) plant sub-samples from each treatment and year were homogenized by grinding through a 2-mm mesh screen (Wiley Mill, Swedesboro, New Jersey). Only plant samples from the section closest to the ditch (0-5 m) and the section furthest from the ditch (15-20 m) were analyzed. Plant tissue and grains were pre-digested in concentrated nitric acid then digested in a heat block for 90 min after 30% hydrogen peroxide was added (Luh & Schulte 1985). National Institute of Standards and Technology (NIST) Standard Reference Material (SRM 1547 peach leaves) were included in every digestion to assure the effectiveness (95% confidence interval) of the nitric acid digestion. Digestion solutions were analyzed for total Ca, K, Mg, and Na on an ICP Emission Spectroscopy (Agilent Technologies Santa Clara, CA). Biomass Ca, K, Mg, and Na pools were calculated by multiplying nutrient concentrations by aboveground biomass (DWE) and yields (DWE; kg/ha) collected from the plots.
Statistical approach
A linear mixed-effects (LME) model (lme4 package for R; Bates et al. 2013) was used to examine the effect of management strategy (e.g., adapt, remediate, restore, abandon) on soil P concentrations and pools averaged at the plot-level. We examined each year and site individually with management strategy (treatment), section (distance from the ditch), and depth (0-10, 10-20, and 20-30 cm) as the main effects and block as the random effect. Once we determined there was a depth effect (and the interaction between the main effects were not significant), we examined each year, site, section, and depth individually (e.g. soil bioavailable P in 2021 from Farm 3 in S1 at 0-10 cm depth). Soil P concentrations were measured in 2018 (to understand baseline P levels) and 2021 (after a full crop rotation). Tukey post-hoc comparisons were used to determine significant differences among management strategies. Finally, univariate regression was used to determine if there is a relationship between topsoil EC (0-10 cm) and topsoil P concentrations.
A linear mixed-effects (LME) model (lme4 package for R; Bates et al. 2013) was used to examine the effect of management strategy (e.g., adapt, remediate, restore, abandon) on porewater P concentrations averaged at the plot-level. We examined each year and site individually with management strategy (treatment) and section (saltwater intrusion) as the main effects and block as the random effect. If we found that there was no significant interaction between treatment and distance from the ditch, we determined the significance of treatment and section on porewater P concentrations individually. Tukey post-hoc comparisons were used to evaluate significant differences among management strategies. Finally, univariate regression was used to determine if there is a relationship between topsoil EC (0-10 cm) and porewater P concentrations, soil and porewater P concentrations, and plant and porewater P concentrations. All statistics were run in the R environment for Mac (R Core Team 2021).
A linear mixed-effects (LME) model (lme4 package for R; Bates et al. 2013) was used to examine the effect of management strategy (e.g., adapt, remediate, restore, abandon) on leaf tissue P concentrations and pools averaged at the plot-level. We examined each year and site individually with management strategy (treatment) and section (SWI) as the main effects and block as the random effect. If we found that there was no significant interaction between treatment and distance from the ditch, we analyzed the significance of treatment and section on leaf tissue P concentrations individually. Tukey post-hoc comparisons were used to evaluate significant differences among management strategies. Finally, univariate regression was used to determine if there is a relationship between soil and plant leaf tissue P concentrations.
Correlation tests (PerformanceAnalytics package for R; Peterson et al. 2020) were performed to determine the relationship between different variables. We grouped all saltwater-intruded sites together and ran the test considering section as a variable for the plant leaf tissue and depth in addition to section as variables for the soil from year 1 to year 4. The first test was between plant leaf tissue cation concentrations (e.g., is saltmarsh hay Na levels influencing how much Ca is in their leaf tissue). The second test was between soil available cation concentrations (e.g., does the concentration of Na in the soil change the concentration of K in the soil). The final test was between plant leaf tissue cations and soil available cations (e.g., will increasing concentrations of Na in the soil effect the concentration of Ca in the leaf tissue).
A linear mixed-effects (LME) model (lme4 package for R; Bates et al. 2013) was used to examine the effect of species (e.g., switchgrass, saltmarsh hay, weeds) on soil exchangeable Ca, K, Mg, and Na concentrations and pools averaged at the plot-level. We examined each year and site individually with species (treatment), section, and depth (0-10, 10-20, and 20-30 cm) as the main effects and block as the random effect. Once we determined there was a depth effect (and the interaction between the main effects were not significant), we examined each year, site, section, and depth individually (e.g. soil bioavailable Na in 2021 from Farm 3 in S1 at 0-10 cm). Soil Ca, K, Mg, and Na concentrations were measured in 2018 (to understand baseline cation levels) and 2021 (after a full crop rotation). Tukey post-hoc comparisons were used to determine significant differences among treatments. Finally, univariate regression was used to determine if there is a relationship between topsoil EC (0-10 cm) and topsoil cation concentrations.
A linear mixed-effects (LME) model (lme4 package for R; Bates et al. 2013) was used to examine the effect of species (e.g., switchgrass, saltmarsh hay, weeds) on leaf tissue Ca, K, Mg, and Na concentrations and pools averaged at the plot-level. We examined each year and site individually with species (treatment) and section as the main effects and block as the random effect. Tukey post-hoc comparisons were used to determine significant differences among species. Finally, univariate regression was used to determine if there is a relationship between topsoil EC (0-10 cm) and plant leaf tissue cation concentrations. All statistics were run in the R environment for Mac (R Core Team 2021).
Chapter 1 Results
Soil extractable P concentrations
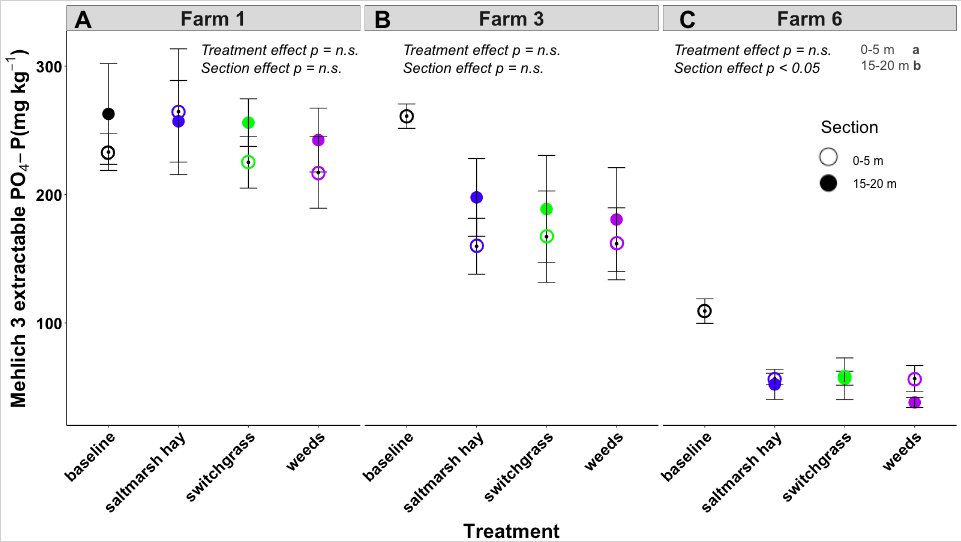
In the soil, concentrations of Mehlich-3 extractable P ([M3P]) decreased by 30-50% in the topsoil (0-10 cm) at two sites after three years of planting (33.9% at Farm 3 and 52.8% at Farm 6; Figure 1.3). At Farm 6, [M3P] decreased from 109.3 mg kg-1 in 2018 to 51.6 mg kg-1 in 2021 in the top 10 cm of the soil. There was a significant effect of distance from the ditch at Farm 6 (p<0.05; Figure 1.3), where the section closest to the ditch (0-5 m) had higher [M3P] than the section furthest from the ditch (15-20 m). There was a significant effect of depth at all sites ([M3P] decreases with depth; p<0.01), but there was no effect of treatment.
Soil total P concentrations
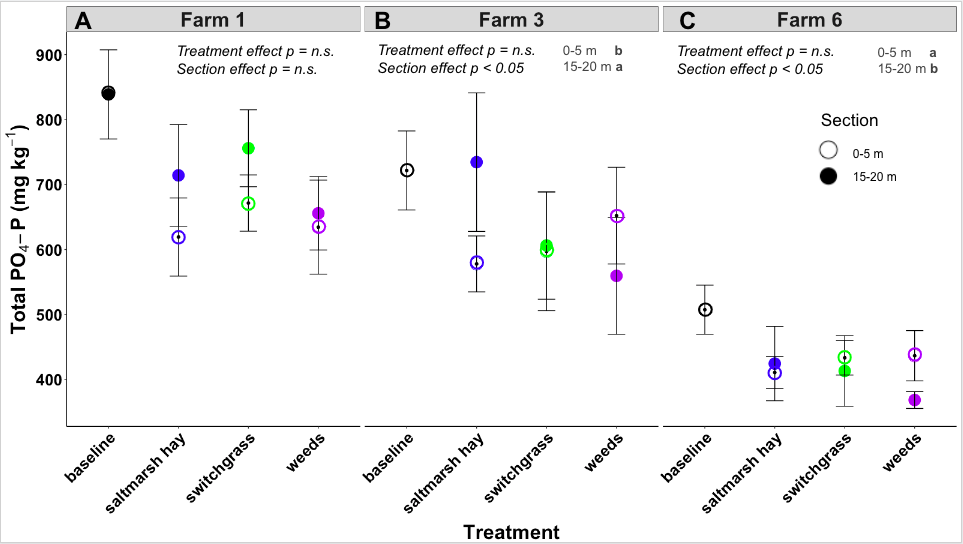
Overall, soil total [P] decreased at all SWI sites after three years of planting, and concentrations decreased by 20% in the topsoil at Farm 1 and Farm 6 (19.6% and 18.3%, respectively; Figure 1.4). The total [P] in 2018 at Farm 6 was 507.4 mg kg-1 and decreased to 414.5 mg kg-1. There was a significant effect of distance from the ditch at Farm 3 and Farm 6 (p<0.05; Figure 1.4), where the section closest to the ditch (0-5 m) had higher [M3P] than the section furthest from the ditch (15-20 m) at Farm 6 and the opposite was seen at Farm 3. Similar to the soil extractable [P], there was no significant effect of treatment, and there was a significant effect of depth (total [P] decreases with depth; p<0.01).
Soil available P pools
Soil Mehlich-3 extractable P (M3P) pools decreased by 30-50% in the topsoil at two sites after three years of growth (33.9% at Farm 3, 52.9% at Farm 6; Figure 1.5). There was a significant effect of distance from the ditch at Farm 3 and Farm 6, where the section closest to the ditch (0-5 m) had higher M3P levels than the section furthest from the ditch (15-20 m) at Farm 6 (p<0.05). In Farm 3, we observed the opposite, with higher M3P levels in the section closest to the ditch (0-5 m; p<0.01; Figure 1.5).
There was a significant effect of soil depth on soil M3P pools at all farms (p<0.01). In 2018, soil M3P pools in the 0-10 cm depth had the highest M3P pools, the next 10 cm (10-20 cm) had intermediate levels of M3P pools, and finally the deeper depth (20-30 cm) had the lowest M3P pools (p<0.01 in all cases). In 2021, soil M3P pools in the topsoil (0-10 cm) were greater than the 10-20 cm depth and the 20-30 cm depth (p<0.01 in all cases). We observed a decrease in soil M3P after three years of growth in all soil depths with a few exceptions in the 20-30 cm depth under all treatments at Farm 1 and 3 (p<0.05).
Farm 3 had the highest M3P levels across the saltwater-intruded farms (p<0.01; medium risk group; FIV = 425), and Farm 6 had the lowest M3P levels of all farms (p<0.01; low risk group; FIV = 214). Farm 1 had similar M3P levels to Farm 3 in the topsoil in year 1 (p<0.01; medium risk group; FIV = 365). The FIV decreased at Farm 1 by 33%, at Farm 3 by 37%, and at Farm 6 by 54% under all treatments (Figure 1.6). Under remediation, restoration, and abandonment treatments at Farm 6, FIV levels in the soil were reduced to reach optimum levels (< 100-150).
Figure 1.6. Conceptual diagram of saltmarsh hay (A-C), switchgrass (D-F), and weeds (G-I) aboveground biomass P and respective belowground total and available P pools from three depths (0-10, 10-20, and 20-30 cm) in year 1 (baseline) compared to year 4 at three saltwater-intruded field sites on the Lower Eastern Shore of Maryland.
Soil total P pools
Soil P pools decreased by approximately 20% in the topsoil at two sites over the three study years (Figure 1.7). There was a significant effect of distance from the ditch at all SWI sites, where the section furthest from the ditch (15-20 m) had higher P pools than the section closest to the ditch (0-5 m) at Farm 1 and Farm 3 (p<0.05; Figure 1.7); the opposite was seen at Farm 6 (p<0.05; Figure 1.7). There was a significant effect of soil depth on total P pools in baseline soils, where total soil P pools were highest in the 0-10 cm depth intermediate at 10-20 cm, and smallest at 20-30 cm depth (p<0.01 in all cases). After three years of growth, there was still a significant effect of depth on total soil P pools, although the size of the pools was smaller across the soil profile.
We found similar patterns in soil available and total P concentrations among the three saltwater-intruded sites across all study years where the both the soil closest to the ditch and the soil furthest from the ditch were strongly positively correlated with topsoil EC (0-10 cm; r2 > 0.5 in year 1 and r2 > 0.2 in year 4; p<0.001 and p<0.01, respectively; Table 1.2).
Table 1.2. Topsoil EC (0-10 cm) and topsoil total and available P concentration correlations in year 1 and year 4 for the section closest to the ditch (0-5 m) and the section furthest from the ditch (15-20 m) with each saltwater-intruded site on the Lower Eastern Shore of Maryland averaged. Values are r2 and symbols are p-values (^ = p<0.05, * = p<0.01, ** = p<0.005, *** = p<0.001).
|
Baseline |
Year 4 |
|||
|
0-5 m |
15-20 m |
0-5 m |
15-20 m |
|
|
EC~soil P |
0.51*** |
0.57*** |
0.51*** |
0.51*** |
|
EC~soil M3P |
0.68*** |
0.54*** |
0.31** |
0.27* |
Porewater P concentrations
After two years of growth, there was an overall decrease in porewater soluble reactive P (SRP) concentrations under all treatments. There was no effect distance from the agricultural ditch on SRP concentrations at any farm in any year of the study; there was no significant difference in SRP concentrations among the saltwater-intruded sites. Overall, there was not a strong treatment effect on porewater SRP concentrations. However, in 2019, we observed higher concentrations of SRP in the saltmarsh hay treatment compared to the weeds and switchgrass treatments (p<0.05; Figure 1.8). Porewater SRP concentrations differed significantly through time (p<0.01). Overall, porewater SRP concentrations ranged from 0.01-0.10 mg L-1 and decreased significantly from 2018 to 2020 (< 0.01 mg L-1; p<0.01; Figure 1.8). There was a slight increase in SRP concentrations under all treatments from the end of 2018 (November) to the start of 2019 (June, July, August), which decreased in October/November of 2019 and increased again in December of 2019. In May 2020, SRP decreased to below 0.01 mg L-1.
Trends in plant P concentrations and pools
We found similar patterns in plant leaf tissue P concentrations among the three saltwater-intruded sites across all study years where the highest P concentrations were always found in weed tissue and the lowest P concentrations were found in saltmarsh hay tissue with intermediate concentrations in switchgrass tissues (p<0.03 in all cases; Figure 1.9). There was no clear relationship between plant leaf tissue P concentrations and distance from the salinity source although in some cases, we observed a significant effect of distance from the ditch (p<0.01; Figure 1.9).
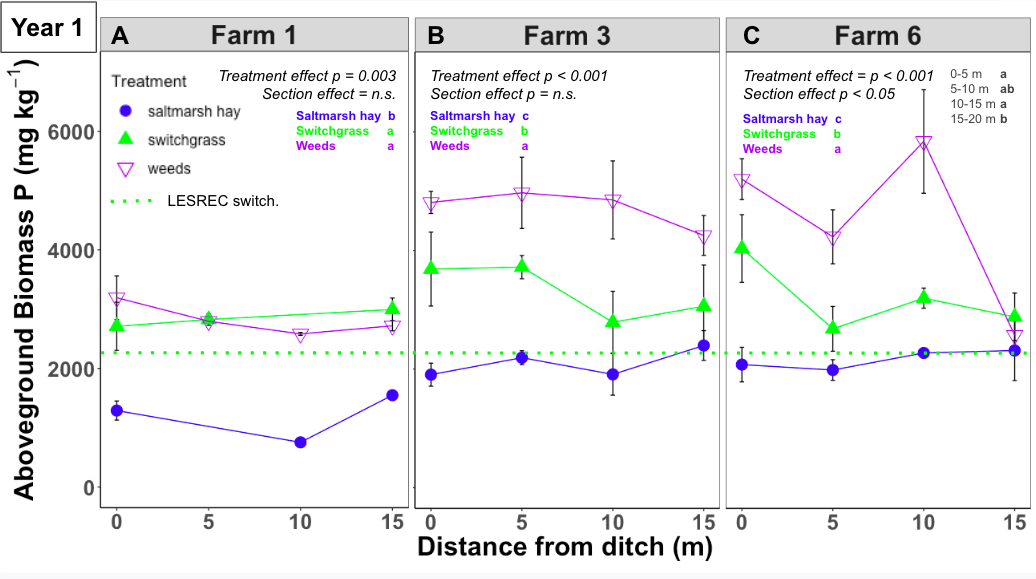
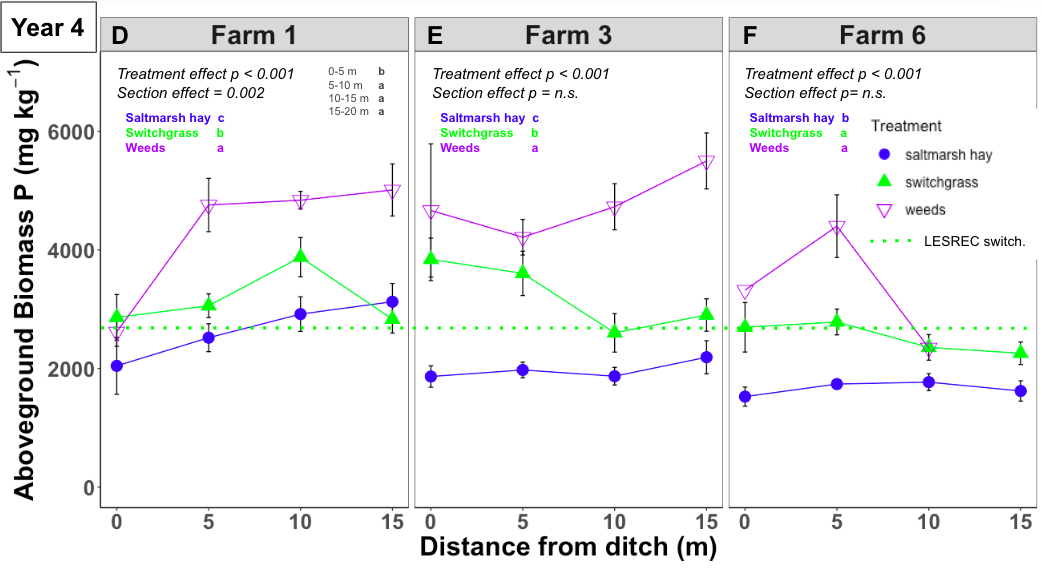
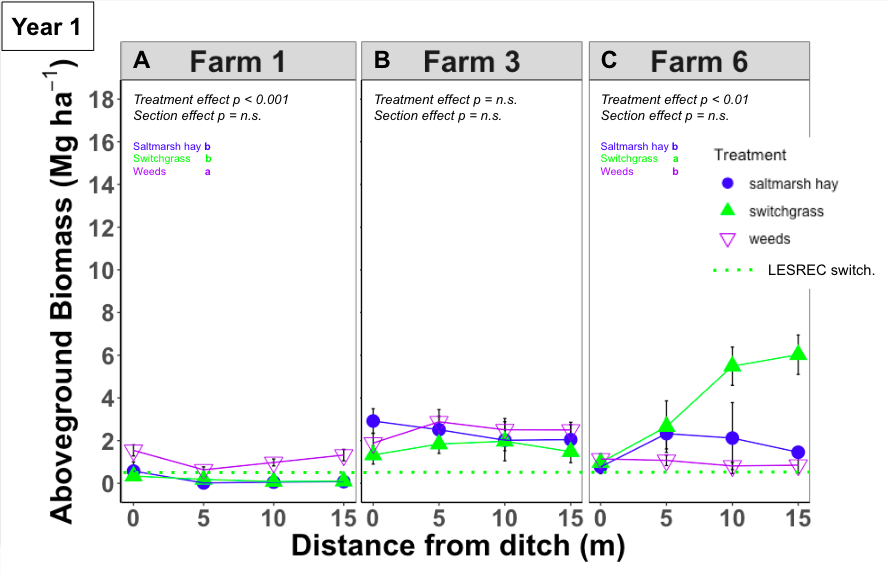
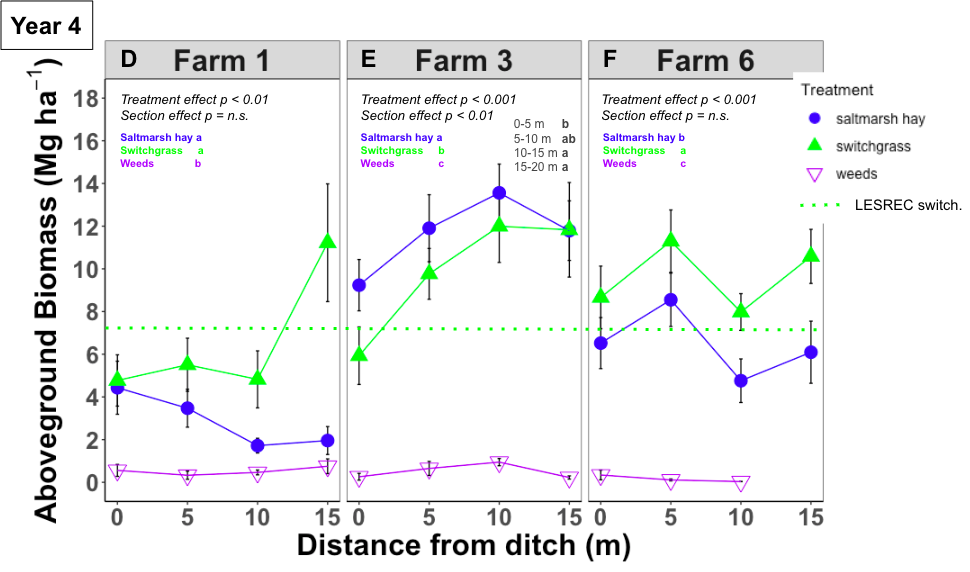
Plant biomass drove patterns in plant pools of P across sites, the SWI gradient, and study years. In the first study year, at Farm 1 and Farm 3, where weeds accumulated the largest biomass, weed P pools were the highest compared to switchgrass and saltmarsh hay (p<0.003; Figure 1.10). This trend continued into year 2 at Farm 1, however at Farm 3 and Farm 6, switchgrass biomass levels were highest, therefore switchgrass P pools were highest compared to saltmarsh hay and weeds (p<0.01; Figure 1.10; Figure 1.11). In the third and fourth years of growth, switchgrass P pools were the highest at all saltwater-intruded field sites (p<0.001; Figure 1.10). At Farm 1 and Farm 6, switchgrass biomass levels were highest compared to saltmarsh hay and weeds in year 3 and 4 (p<0.01; Figure 1.11), however at Farm 3, saltmarsh hay biomass was highest in year 3 and 4. Despite saltmarsh hay having higher biomass levels than switchgrass at our saltiest field site, switchgrass P pools still had higher P pools than saltmarsh hay (although they were both higher than weeds; p<0.01; Figure 1.10; Figure 1.11).
The SWI gradient had an effect in year 1 and 2 at Farm 6, where biomass increased with distance from the ditch (p<0.01 in both cases; Figure 1.11), however, at Farm 1 and Farm 3, there was no significant effect of distance from the ditch on aboveground plant biomass for any of the study years.
At the no-salt control site, we only planted switchgrass, which showed P concentrations and biomass levels lower than the saltwater-intruded sites (Figures 1.9, 1.10, 1.11). Aboveground biomass P pools in the no-salt control showed a similar pattern to Farm 1, where switchgrass P pools were low in years 1 and 2 but increased in year 3 (Figure 1.10).
We found similar patterns in soil available and total P concentrations among the three saltwater-intruded sites across all study years where both the soil closest to the ditch and the soil furthest from the ditch were strongly positively correlated with each other (0-10 cm; r2 > 0.8; p<0.001 in all cases; Table 1.3). There were no clear relationships between plant leaf tissue P and topsoil available and total P, however, there was a strong positive correlation in the saltmarsh hay treatment only in the section furthest from the ditch (r2 > 0.3; p<0.005 in both cases; Table 1.3).
Table 1.3. Plant leaf tissue P and topsoil total and available P concentration correlations in year 4 for saltmarsh hay, switchgrass, and weeds in both the section closest to the ditch (0-5 m) and the section furthest from the ditch (15-20 m) with each saltwater-intruded site on the Lower Eastern Shore of Maryland averaged. Values are r2 and symbols are p-values (^ = p<0.05, * = p<0.01, ** = p<0.005, *** = p<0.001).
|
Saltmarsh hay |
Switchgrass |
Weeds |
||||
|
0-5 m |
15-20 m |
0-5 m |
15-20 m |
0-5 m |
15-20 m |
|
|
plant P~soil P |
0.10 |
0.35** |
0.045 |
0.14 |
-0.082 |
-0.26 |
|
plant P~soil M3P |
0.09 |
0.43*** |
0.11 |
0.17 |
-0.20 |
-0.21 |
|
soil P~soil M3P |
0.87*** |
0.92*** |
0.96*** |
0.91*** |
0.91*** |
0.95*** |
Grain P concentrations
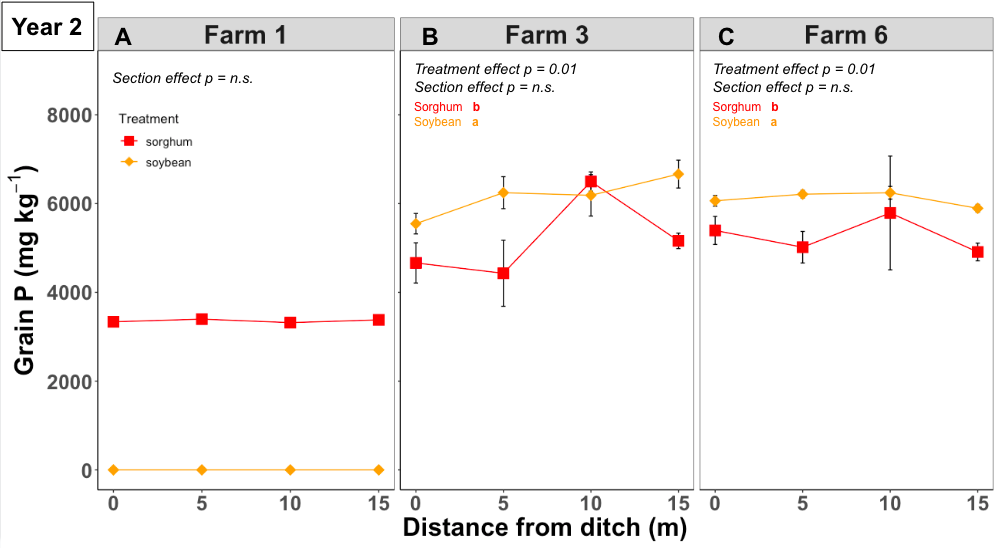
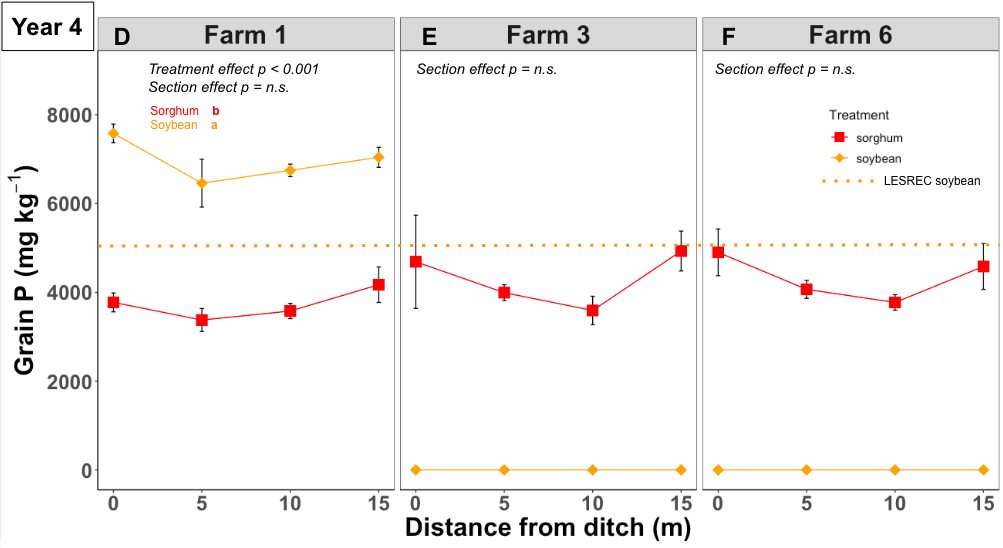
We found similar patterns in grain [P] among all saltwater-intruded sites across all study years with significantly higher [P] in soybean grain (4.5-9.0 g kg-1) than sorghum grains (5.1-7.0 g kg-1; p=0.01 in all cases; Figure 1.12). Soybean grain P concentrations were highest at Farm 1 in 2021 (6.1-8.0 g kg-1; p<0.001). There was no significant effect of distance from the salinity source at any of the sites each year (2019-2021). Finally, soybean P concentrations were lower (4.5-6.1 g kg-1) at the no-salt control site (LESREC) than the SWI-impacted sites in 2021.
Grain yield
The grain yield at Farm 1 in 2019 showed sorghum having higher yield (79.5-123.9 bu acre-1) than the county and no-salt control site averages (76 and 66 bu acre-1, respectively; Table 1.4), but in the following two years, sorghum yield decreased to below average (0.78-23.5 bu acre-1). Soybean yield did not meet county and LESREC averages (55 and 58 bu acre-1, respectively) in any years at the saltwater-intruded sites (1.6-34.5 bu acre-1). Soybean grain was not collected at Farm 1 and Farm 3 in 2020 likely because of birds or deer eating the crops, so the values were zero. In 2021, the weeds at Farm 3 took over the field, and soybeans were unable to grow, and deer likely ate the grain at Farm 6.
Table 1.4. Sorghum and soybean grain yields in bushels per acre from each research site on the Lower Eastern Shore of Maryland
from 2019 to 2021 compared to Dorchester and Somerset County (MD) averages calculated in 2021.
|
Year |
Farm |
Sorghum yield (bu acre-1) |
Soybean yield (bu acre-1) |
|
2019 |
1 |
79.5-123.9 |
0 |
|
2019 |
3 |
19.0-46.1 |
12.2-28.5 |
|
2019 |
6 |
31.1-43.5 |
17.2-27.5 |
|
2019 |
LESREC |
57.5 |
58.4 |
|
2020 |
1 |
0.8-4.8 |
0 |
|
2020 |
3 |
0.8-3.4 |
0 |
|
2020 |
6 |
1.3-10.6 |
2.1-7.8 |
|
2020 |
LESREC |
69.1 |
47.2 |
|
2021 |
1 |
12.0-23.5 |
1.6-34.5 |
|
2021 |
3 |
0.2-2.1 |
0 |
|
2021 |
6 |
2.2-8.8 |
0 |
|
2021 |
LESREC |
72.2 |
69.0 |
|
MD average |
|
76.0 |
55.0 |
Grain P pools
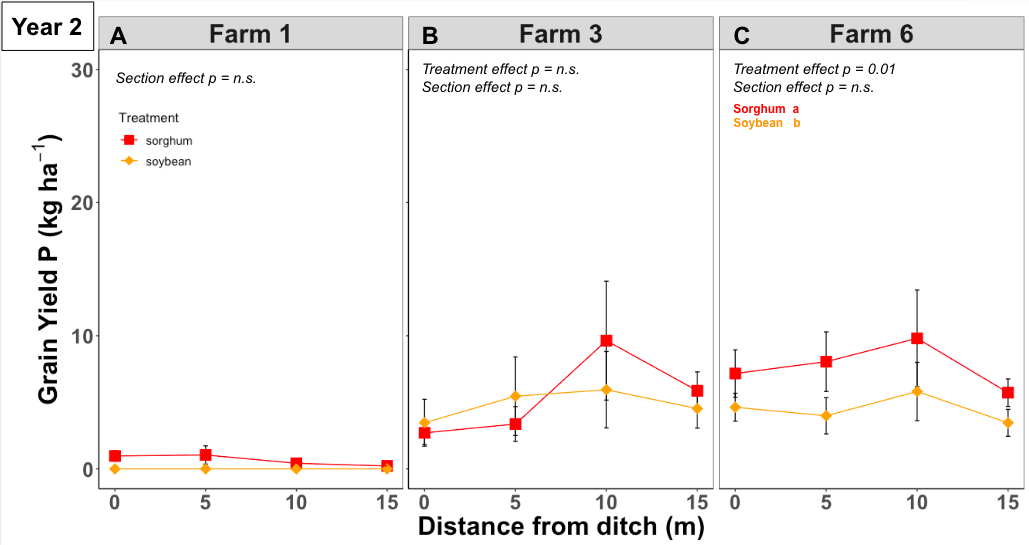
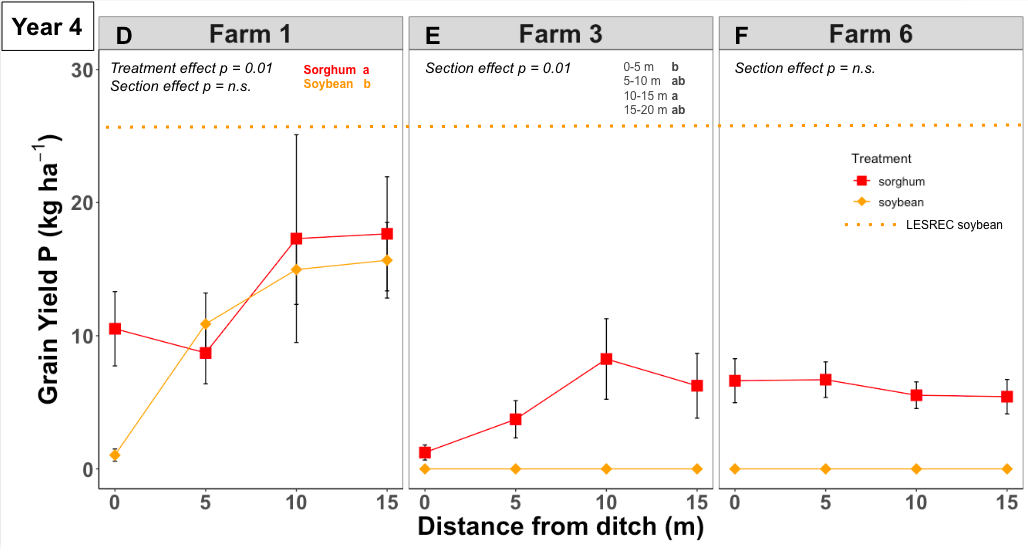
Sorghum and soybean grain P pools showed different patterns than grain yield and grain [P] at all SWI sites for all years. In year 2, sorghum grain P was slightly higher (2.71-9.81 kg ha-1) than soybean grain (3.46-5.95 kg ha-1; p=0.01; Figure 1.13), but there was no significant effect of distance from the ditch. There was no significant effect of treatment or distance from the ditch at Farm 3. Since there was only one species collected at Farm 1 and Farm 3 in year 3, there was no significant difference between species, but there was no significant effect of distance from the ditch either. Similarly, at Farm 6, there was no significance of distance from the ditch or treatment on grain P pools. The following year, there was only a significant difference between species at Farm 1 (p=0.01). There was a significant effect of distance from the ditch at Farm 3 (p=0.01) on grain P pools, but not at Farm 1 and Farm 6. Finally, the no-salt control (LESREC) soybean grain P pools were higher than pools at the SWI sites (22.5 kg grain-P ha-1).
Chapter 1 Discussion
Our results have implications for how planting remediation and restoration species can draw down legacy soil P in coastal agricultural soils experiencing SWI. After analyzing the aboveground biomass and soil beneath five proxy species for management practices (adapt, remediate, restore, abandon) on three farms experiencing SWI, we were able to determine if soil and biomass P pools changed along a SWI gradient. We show that remediation and restoration management practices are efficient in taking up soil and porewater P that may ultimately decrease P runoff into the Chesapeake Bay. Overall, we saw significant differences in plant and soil P pools among each of the SWI sites, with relatively consistent trends across years (Figs. 1.5, 1.7, 1.8, 1.10), which indicates that even with differences among our saltwater-intruded farm fields (degree of SWI, precipitation, soil type, etc.), patterns of P pools were influenced by biomass levels, and the uptake of P in biomass was consistent with the decrease in soil P and M3P concentrations and pools after three years of planting. Legacy P in our region due to historic application of poultry litter has led to high levels of both total and available P in the soil that could be mobilized and released when fields are exposed to saltwater (Weissman et al. 2019). Previous work showed that agricultural soils have a greater release of nutrients (e.g., SRP) than wetlands when fields are allowed to flood with saltwater (Weissman et al. 2021), therefore it is important to determine best management practices that will draw down soil P. In this study, after three years of planting both remediation and restoration species (switchgrass and saltmarsh hay), there was an increase in aboveground biomass P pools as biomass accumulated over time, and this was associated with a decline in soil total and available P pools.
Switchgrass is efficient at taking up soil and porewater P
We found switchgrass biomass had higher P pools than both saltmarsh hay and weeds from saltwater-intruded fields, suggesting that switchgrass could be used as a P removal tool. Previous research has shown switchgrass can accumulate large quantities of biomass after the establishment year and can last over 5-10 years (McLaughlin & Kszos 2005; Wullschleger et al. 2010; Richner et al. 2014). We found that high levels of switchgrass biomass were associated with large aboveground P pools, and soil total and available P pools decreased after three years of planting (Figs. 1.5, 1.7, 1.8, 1.10), which indicates that species with high levels of biomass and deep root systems can uptake high levels of soil P (Schmer et al. 2011; Basyal & Emery 2020). Porewater P was also lowest under the switchgrass plots after the second year and continued to decrease in the third year, and this was likely because of the decrease in soil P pools, so there is less P to be released as SRP (Meyerson et al. 1999). The difference between treatments on soil and porewater P were likely not significant because of switchgrass roots extending into nearby plots. Therefore, planting switchgrass on coastal agricultural fields could be a mitigation strategy to remove soil P, if harvested, and may ultimately decrease the amount of P available to runoff into the Chesapeake Bay (Schmer et al. 2011; Ashworth et al. 2017; Rivera-Chacon et al. 2022).
Switchgrass is a practical option for planting in the mid-Atlantic. First, switchgrass is more tolerant of saline and dry conditions due to its deep root system and strong associations with mycorrhizal fungi, so it is able to take up more water and nutrients than most agronomic crops (Di Virgilio et al. 2007; Schmer et al. 2011; Meyer et al. 2014; USDA NRCS 2020). Additionally, the deep, extensive root system can be as deep as three meters and as wide as six meters, allowing switchgrass to act as a buffer to take up soil N and P and prevent nutrient loss to nearby waterbodies (Blanco-Canqui et al. 2004; Lemus et al. 2008; Kibet et al. 2016; Kumar et al. 2019). As a perennial that does not need to be replanted each year with relatively low seed cost and no need for fertilizer amendments (UMD Extension 2010; AGMRC 2018), switchgrass incurs lower annual input costs than other crops. Finally, switchgrass can be used as a cellulose biofuel or poultry bedding, so landowners could continue to make a profit from planting, albeit at a reduced price per acre than typical corn and soybean crops ($265 per acre compared to $749 and $402 per acre, for corn and soybean respectively; Moyle et al. 2016; Purswell et al. 2020; UMD Extension 2022). In sum, this study showed switchgrass would provide a great tool to buffer against P loss, maintain low input costs, and be used as a biofuel or poultry bedding.
Saltmarsh hay is efficient at taking up P in soil with high salinity
We found saltmarsh hay biomass had intermediate biomass P pools compared to other treatments from saltwater-intruded fields, suggesting the potential to be used as a P removal tool. Previous research indicated that fields experiencing SWI will naturally transition to host more native marsh species such as saltmarsh hay (Gedan et al. 2019). Our work shows that the increase in saltmarsh hay biomass and aboveground P pools provide an opportunity to harvest this biomass to remove both sodium and P in the soil. At Farm 3 where salinity was the highest, saltmarsh hay had the highest biomass levels because of the higher tolerance to salt concentrations and was able to uptake similar levels of P as switchgrass (Figure 1.10). This uptake was associated with decreased levels of soil P pools and porewater [SRP] (Figs. 1.5, 1.7; Figure 1.8). Similar to switchgrass, our work indicates that allowing the natural conversion of fields to saltmarsh hay, or deliberately planting this species can serve as a tool for reducing P losses to nearby waterbodies by utilizing their high root porosity to maintain nutrient uptake (Burdick & Mendelssohn 1990; DeLaune et al. 2005).
Saltmarsh hay is a practical option for planting in high salinity soils on the Eastern Shore. First, saltmarsh hay is a halophytic C4 grass that can create a new wildlife habitat for waterfowl hunting and aid in restoring the land to native marsh. In addition to maintaining a profit by allowing hunting activity, landowners can receive financial assistance and guidance from state- and federal-level conservation programs that can support restoration practices (e.g., Conservation Reserve Enhancement Program; CREP 2022, Environmental Quality Incentives Program; EQIP 2022, Wetland Reserve Easements; WRE 2022). Finally, planting saltmarsh hay (Spartina patens) may facilitate the transition to tidal marshes that can protect coastlines from flooding by reducing strong winds and storm surges with their strong-stems and other physical properties (Hu et al. 2015; Leonardi et al. 2018). The restoration approach has been shown to save landowners in the Delaware, Maryland, Virginia (DMV) area between $4.5-23.8 million annually. For example, in Maryland, coastal wetlands reduced property damages from $20 million to $15.5 million from severe weather and flooding (Smith & Katz 2013; Narayan et al. 2017; USGCRP 2017; Li et al. 2020). Salt marsh presence reduces average annual flood losses by 18-70% (Narayan et al. 2017). In sum, restoring farm fields has benefits for nearby waterbodies by taking up soil P, landowners by maintaining revenue, and communities by protecting coastlines.
Grain crops will not maintain high yield with increasing SWI
The alternative grain crops tested in our field trials demonstrated efficient grain yield P uptake rates when the crops were able to survive. Sorghum is a salt-tolerant crop (relative to corn and soybeans) that maintains a good yield under increasing saline conditions (Grieve et al. 2012). Our data suggest that sorghum is efficient at taking up soil P pools, and we predict that soil P levels may decrease if the total aboveground biomass of the grain crop was removed at harvest. Utilizing this mitigation strategy would allow continued farming operations on the land because there is a market for sorghum as feed on the Lower Eastern Shore of MD (J. Miller, personal communication). Unfortunately, the value for the rest of the plant beyond the grain and the cost for specialized equipment to harvest the whole plant does not outweigh the option to grow alternative species (e.g., switchgrass, saltmarsh hay). Additionally, we planted Cl-excluding soybeans, which had lower yield than expected even under increasing saline conditions. Both sorghum and soybean total aboveground biomass is usually returned to the field as chaff during the harvesting process, so significant removal of P from the system is not likely with the adaptation management strategy. Finally, our research shows that these alternative grains, although efficient in taking up P, will not maintain high yield with increasing SWI.
Chapter 2 Results
Soil available cation concentrations
In the soil, concentrations of Mehlich-3 extractable Ca ([M3Ca]) decreased by 50-60% in the 0-10 cm depth at two of the sites after three years of planting (51.6% at Farm 1 and 63.1% at Farm 3; Figure 2.1). There was no change in Mehlich-3 extractable Mg ([M3Mg]) over time at any of the saltwater-intruded sites, however, Farm 6 there was an increase in soil [M3Mg] in the 0-10 depth after three years of planting (149 to 275 mg Mg kg-1; p<0.01; Figure 2.1). There was no clear relationship between [M3Ca] and [M3Mg] and treatment across all saltwater-intruded sites. At Farm 1, distance from the ditch affected how much [M3Ca] and [M3Mg] was in the soil, where the section closest to the ditch had higher concentrations of M3Ca and M3Mg than the section further from the ditch (p<0.005 in both cases). At Farm 3, distance from the ditch and depth were significant (p<0.05 in both cases) where the soil closer to the ditch had higher [M3Ca] than the section further from the ditch and the 0-10 cm depth had higher [M3Ca] than the deeper depths (10-30 cm). There was also a depth effect at Farm 3, where [M3Mg] decreases with depth (p=0.01). At Farm 6, there was no change in [M3Ca] over time, however, there was a significant effect of depth where [M3Ca] increased with depth (p<0.01; Figure 2.1), but there was no effect of SWI gradient. Finally, Farm 6 was the only site that had more [M3Mg] than the no-salt control.
Concentrations of Mehlich-3 extractable K ([M3K]) decreased by 25-30% at all saltwater-intruded sites after three years of planting (34.3% at Farm 1, 27.8% at Farm 3, 31.6% at Farm 6; Figure 2.3). Treatment was only significant at Farm 1 where saltmarsh hay and switchgrass had similar [M3K] in all soil depths (71.8-126.3 mg K kg-1 and 85.5-133.8 mg K kg-1, respectively) compared to the weeds (63.7-119.1 mg K kg-1; p<0.05; Figure 2.1).
Across all years among the SWI sites, soil depth was significant, where the 0-10 cm had the highest [M3K] (72.4-137.9 mg K kg-1) compared to the deeper soil depths (10-20 and 20-30 cm; 37.9-102.3 mg K kg-1 and 35.0-88.9 mg K kg-1; p<0.005 in all cases). In 2021, distance from the ditch was significant at all saltwater-intruded sites, where Farm 1 and Farm 6 showed high [M3K] in the section closest to the ditch, but the opposite was seen at Farm 3, where [M3K] was actually higher further from the ditch.
Contrastingly, concentrations of Mehlich-3 extractable Na ([M3Na]) increased by 35-60% in the section closest to the ditch (43.8% at Farm 1, 59.3% at Farm 3, 36.8% at Farm 6) and by 60-90% furthest away from the ditch (88.3% at Farm 1, 90.1% at Farm 3, 59.7% at Farm 6; Figure 2.1) at all saltwater-intruded sites from year 1 to year 4. Distance from the ditch was significant at all SWI sites in 2021, where the section closest to the ditch had the highest [M3Na] in the soil (589.9-936.5 mg Na kg-1; p<0.05 in all cases). Treatment was only significant at Farm 6 where saltmarsh hay and weeds had similar [M3Na] in all soil depths (468.4-689.7 mg Na kg-1 and 424-764.7 mg Na kg-1, respectively) compared to switchgrass (385.3-589.9 mg Na kg-1; p<0.05; Figure 2.1). Across all years, depth was significant at all SWI sites where the deepest depth (20-30 cm) had the highest [M3Na] in 2018, and the shallow depth (0-10 cm) had the highest [M3Na] in 2021 (p<0.05 in all cases). Finally, the saltwater-intruded sites had significantly more [Na] in the soil than the no-salt control (450 mg Na kg-1 and 31 mg Na kg-1, respectively; p<0.001).
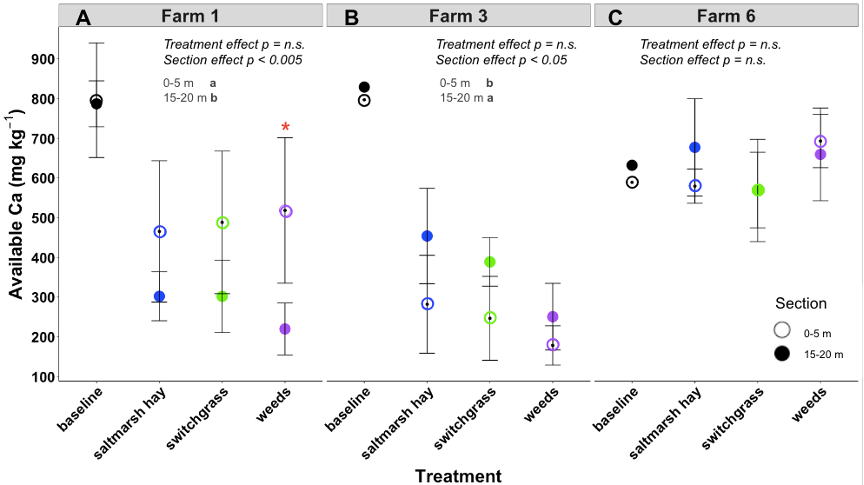
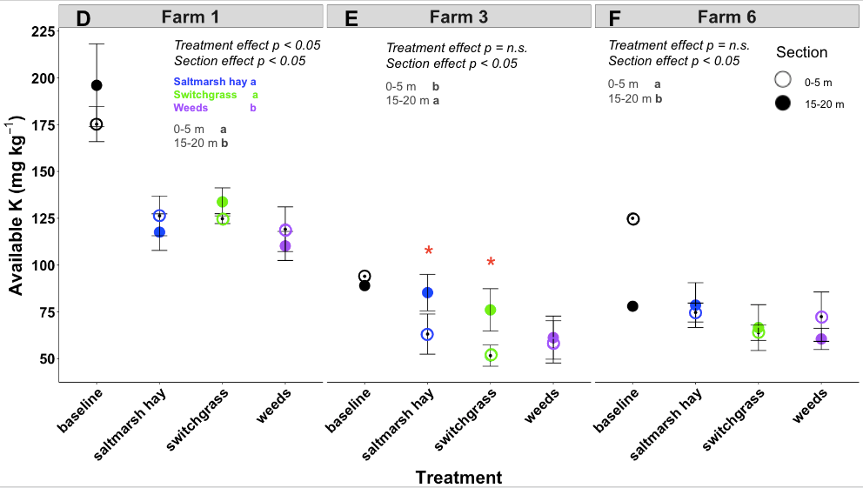
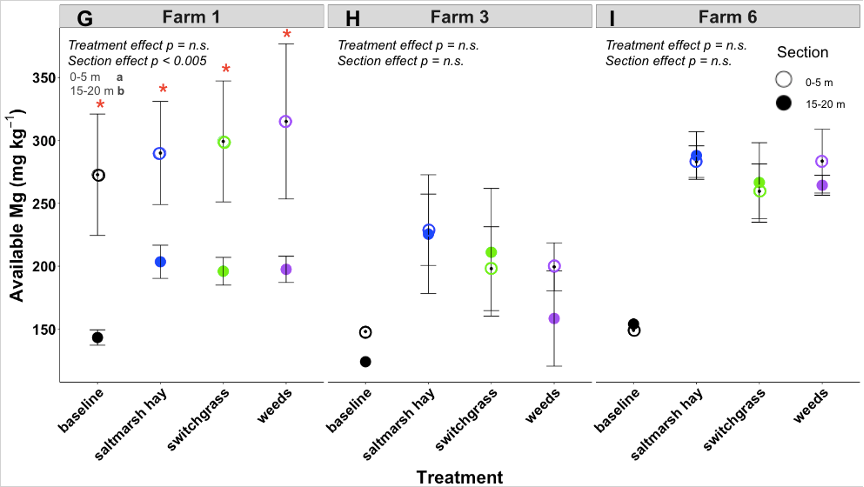
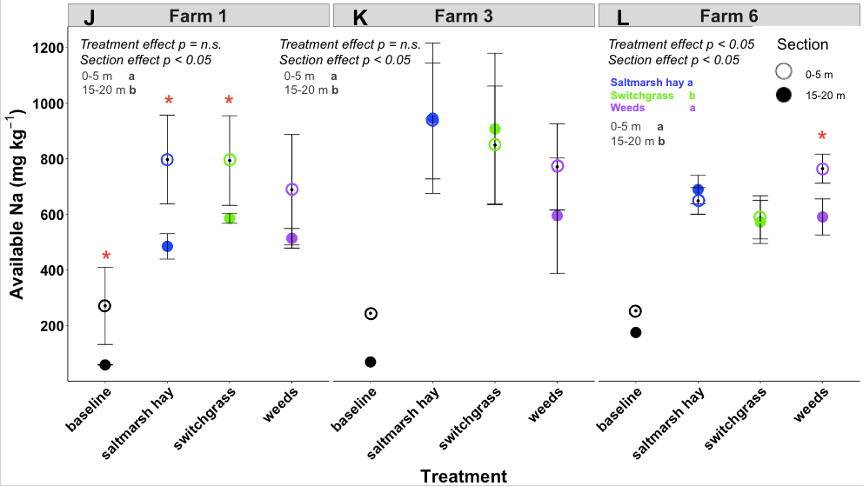
Figure 2.1. Topsoil (0-10 cm) available cation concentrations at three saltwater-intruded field sites on the Lower Eastern Shore of Maryland from year 1 (baseline) to year 4. The x-axis is treatment and the y-axis is Mehlich-3-extractable Ca (A-C); K (D-F); Mg (G-I); and Na (J-L) in milligrams per kilogram. Treatments are represented by colors, where the saltmarsh hay treatment is blue, the switchgrass treatment is green, and the weeds treatment is purple and section is represented by open or closed circles, where open circles are 0-5 m away from the ditch and closed circles are 15-20 m away from the ditch.
Soil available cation pools
In the soil, Mehlich-3 extractable Ca pools decreased by 50-60% in the 0-10 cm depth at two of the sites after three years of planting (49.8% at Farm 1 and 63.6% at Farm 3; Figure 2.2). There was an increase in Mehlich-3 extractable Mg pools over time at all of the saltwater-intruded sites, especially at Farm 6 where there was an increase in soil M3Mg pools in the 0-10 depth after three years of planting (225 to 444 kg Mg ha-1; p<0.01; Figure 2.2). There was no clear relationship between M3Ca and M3Mg pools and treatment across all saltwater-intruded sites. At Farm 1, distance from the ditch affected M3Ca and M3Mg pools, where the section closest to the ditch had higher pools of M3Ca and M3Mg than the section further from the ditch (p<0.005 in both cases). At Farm 3, distance from the ditch and depth were significant (p<0.05 in both cases) where the soil further from the ditch had larger M3Ca pools than the section closer to the ditch and the 0-10 cm depth had larger M3Ca pools than the deeper depths (10-30 cm). There was also a depth effect at Farm 3, where M3Mg pools decrease with depth (p=0.01). At Farm 6, there was no change in M3Ca pools over time, however, there was a significant effect of depth where M3Ca pools increased with depth (p<0.01; Figure 2.2), but there was no effect of distance from the ditch. Finally, Farm 6 was the only site that had greater M3Mg pools than the no-salt control.
Pools of Mehlich-3 extractable K decreased by 25-30% at all saltwater-intruded sites after three years of planting (34.3% at Farm 1, 27.8% at Farm 3, 31.6% at Farm 6; Figure 2.2). Treatment was only significant at Farm 1 where saltmarsh hay and switchgrass had similar M3K pools in the soil below (85.8-155.8 kg K ha-1 and 110.3-161.8 kg K ha-1, respectively) compared to the weeds (81.8-147.9 kg K ha-1; p<0.05; Figure 2.2). Across all years among the SWI sites, depth was significant, where the 0-10 cm had the highest M3K pools (95.2-168.2 kg K ha-1) compared to the deeper soil depths (10-20 and 20-30 cm; 54.4-129.8 kg K ha-1 and 50.6-114.9 kg K ha-1; p<0.005 in all cases). In 2021, distance from the ditch was significant only at Farm 3, where high M3K pools were found in the section furthest from the ditch.
Contrastingly, Mehlich-3 extractable Na pools increased by >100% in the section closest and furthest away from the ditch (Figure 2.2) at all saltwater-intruded sites from year 1 to year 4. Distance from the ditch was significant at all SWI sites in 2021, where the section closest to the ditch had the largest M3Na pools in the soil (436.0-999.7 kg Na ha-1 at Farm 1, 401.9-1264.3 kg Na ha-1 at Farm 3, and 701.9-1235.3 kg Na ha-1 at Farm 6; p<0.05 in all cases). Treatment was only significant at Farm 6 where saltmarsh hay and weeds had similar M3Na pools in the soil below (714.4-1112.2 kg Na ha-1 and 649.1-1235.3 kg Na ha-1, respectively) compared to switchgrass (588.5-955.5 kg Na ha-1; p<0.05; Figure 2.2). Across all years, depth was significant at all SWI sites where the deepest depth (20-30 cm) had high M3Na pools in 2018, and the shallow depth (0-10 cm) had the largest M3Na pools in 2021 (p<0.05 in all cases). Finally, the saltwater-intruded sites had significantly higher Na pools in the soil than the no-salt control (646 kg Na ha-1 and 47.7 kg Na ha-1, respectively; p<0.001).
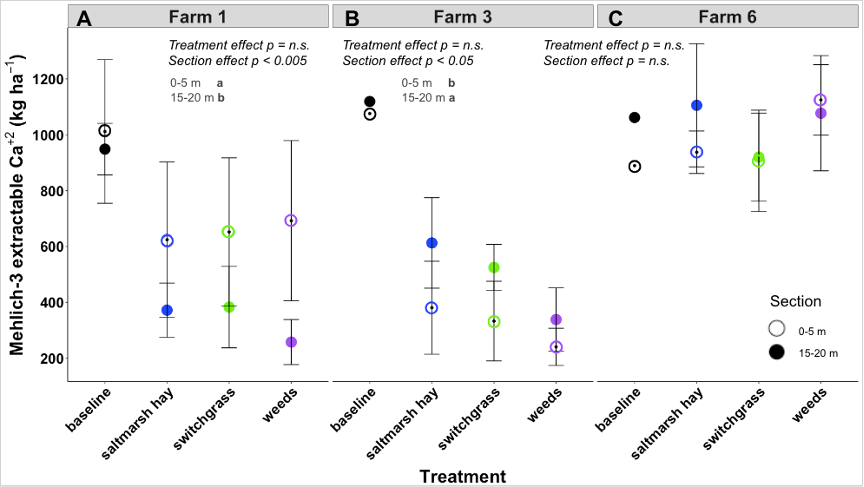
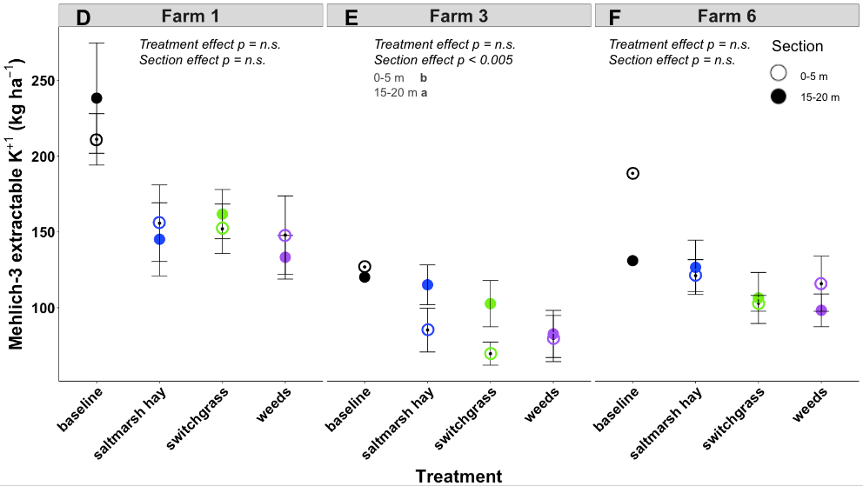
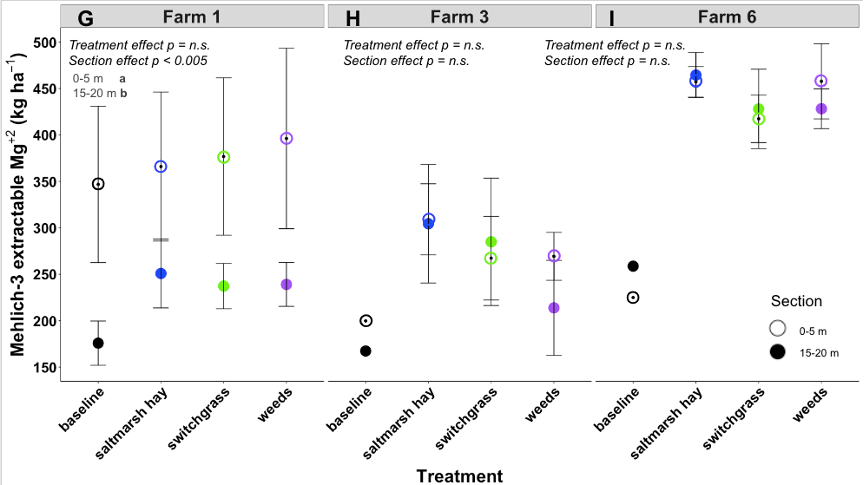
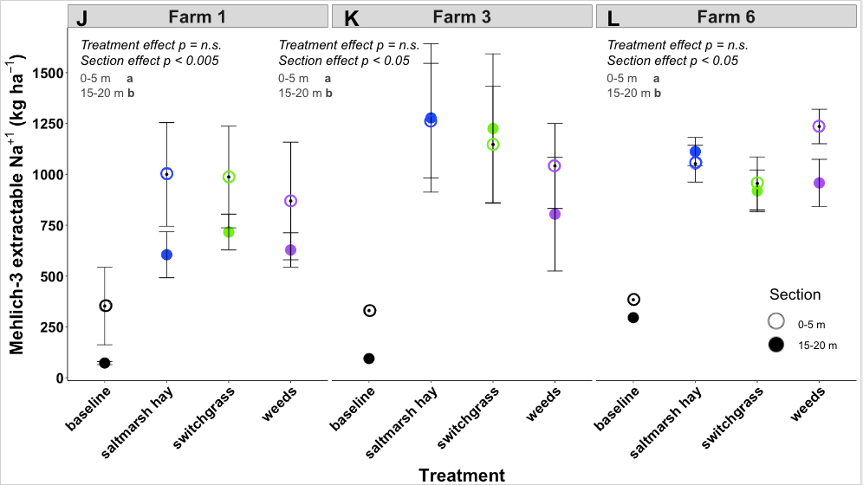
Figure 2.2. Soil extractable cation pools in topsoil (0-10 cm) at three saltwater-intruded field sites on the Lower Eastern Shore of Maryland in 2018 (baseline) and 2021. The x-axis is treatment and the y-axis is Mehlich-3 extractable Ca (A-C); K (D-F); Mg (G-I); and Na (J-L) pools in kilograms per hectare. Treatments are represented by colors, where the saltmarsh hay treatment is blue, the switchgrass treatment is green, and the weeds treatment is purple and section is represented by open or closed circles, where open circles are 0-5 m away from the ditch and closed circles are 15-20 m away from the ditch.
Topsoil electrical conductivity
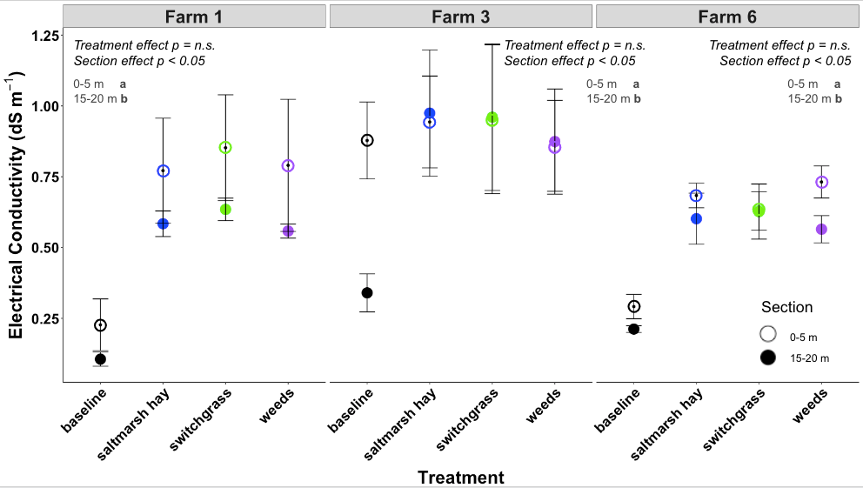
In 2018 (baseline), topsoil (0-10 cm) electrical conductivity (EC) was low at all saltwater-intruded sites, where distance from the ditch was significant (0-5 m from ditch > 15-20 m from ditch; p<0.01; Figure 2.3). After three years, EC increased under all plant treatments, but there was no significant difference between them. At Farm 3, baseline soil EC farthest from the ditch was closer to the 2021 soil EC under all treatments. At Farm 6, in the soil under the weeds, there was a significant difference between the distance closest to and farthest from the ditch, where section closer to the ditch had higher EC than section further from the ditch (p<0.01; Figure 2.3). Soil EC was higher at all SWI sites compared to the no-salt control where EC in 2018 was approximately 0.076 dS m-1 and increased to 0.094 dS m-1 in 2021.
Plant leaf tissue cation concentrations
Across all saltwater-intruded sites across all years, there was no clear relationship between plant leaf tissue cation (Ca2+, K+, Mg2+, and Na+) concentrations and distance from the salinity source. At the no-salt control site, we only planted switchgrass, which showed [Ca2+], [K+], and [Mg2+] that were similar to the saltwater-intruded sites (2.1-4.0 g Ca kg-1; 2.1-2.8 g Mg kg-1; 10.3-11.5 g K kg-1) in both 2019 and 2021. Across all study years and all sites, plant leaf tissue Na concentrations ([Na+]) were highest in saltmarsh hay (2.1-3.8 g Na kg-1) compared to weeds (0.2-2.0 g Na kg-1) and switchgrass (0.07-0.3 g Na kg-1; p<0.001).
In 2019 at Farm 1, saltmarsh hay had the highest [Ca2+] (2.5 g Ca kg-1; p<0.01; Figure 2.4). However, two years later, Ca concentrations in leaf tissue increased in the switchgrass and weed treatments, such that there were no longer differences among the treatments. At Farm 3 and Farm 6, switchgrass had the highest concentrations (2.3-2.6 g Ca kg-1), saltmarsh hay had intermediate concentrations (2.15-2.18 g Ca kg-1), and weeds had the lowest concentrations (2.0-2.1 g Ca kg-1). In 2021, switchgrass tissues had the highest [Ca2+] (4.2-5.0 g Ca kg-1; p<0.01; Figure 2.4) in Farms 3 and 6.
We found similar patterns among all saltwater-intruded sites across all study years where the highest concentrations of Mg were always found in the weed tissue (2.1-2.9 g Mg kg-1) and the lowest [Mg2+] were found in saltmarsh hay tissue (1.2-1.7 g Mg kg-1) with intermediate levels in switchgrass tissues (1.7-3.1 g Mg kg-1; p<0.01 in all cases; Figure 2.4).
We found similar patterns among all saltwater-intruded sites across all study years where the highest concentrations of K were always found in the weed tissue (10.0-21.2 g K kg-1) and the lowest [K+] were found in saltmarsh hay tissue (5.0-9.0 g K kg-1) with intermediate levels in switchgrass tissues (8.1-12.0 g K kg-1; p<0.01 in all cases; Figure 2.4).
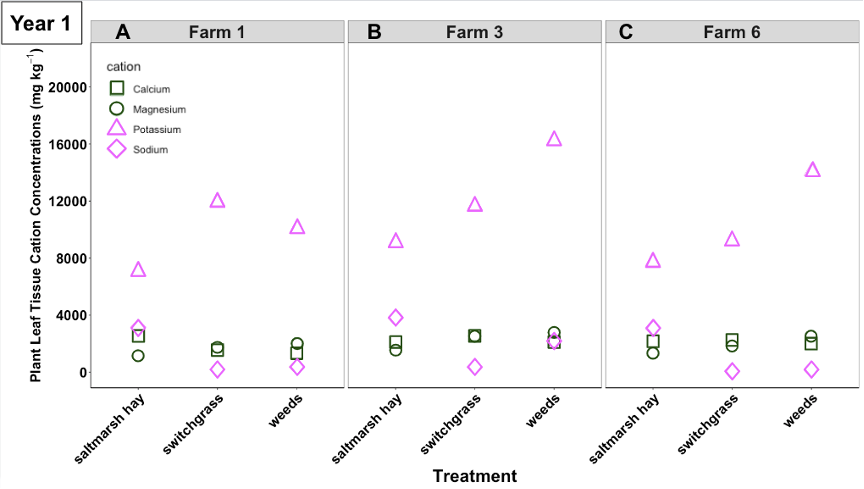
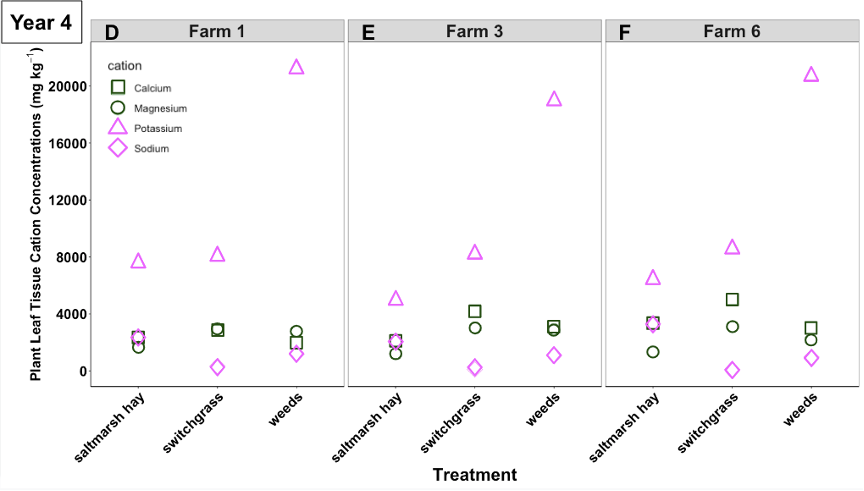
Figure 2.4. Plant leaf tissue cation concentrations along the salinity gradient at three saltwater-intruded farms on the Lower Eastern Shore of Maryland in year 1 (A-C) and year 4 (D-F). The x-axis is treatment at each of the three farm sites, and the y-axis is cation concentrations in plant leaf tissue in milligrams per kilogram. Alkaline earth metals (Mg [circles] and Ca [squares]) are represented by the color green and alkali metals (Na [diamonds] and K [triangles]) are represented by the color pink.
Plant biomass cation pools
Across all saltwater-intruded sites across all years, there was no clear relationship between plant biomass cation (Ca, K, Mg, and Na) pools and distance from the salinity source. At the no-salt control site, we only planted switchgrass, which showed Ca, K, and Mg pools that were similar to the saltwater-intruded sites in both 2019 and 2021. Across all study years and all sites, plant biomass Na pools were highest in saltmarsh hay (1.3-26.8 kg Na ha-1) compared to weeds (0.09-3.6 kg Na ha-1) and switchgrass pools (0.009-2.5 kg Na ha-1; p<0.001; Figure 2.5).
In 2019 at Farm 1, weeds had the highest Ca, K, and Mg pools (1.6-2.5 kg Ca ha-1; 10.3-19.7 kg K ha-1; 2.1-4.7 kg Mg ha-1; p<0.01; Figure 2.5). However, two years later, Ca, K, and Mg in plant biomass increased in the switchgrass, so the pools were highest (8.3-34.2 kg Ca ha-1; 27.9-98.2 kg K ha-1; 9.2-36.4 kg Mg ha-1), weeds had the lowest pools (1.3-5.0 kg Ca ha-1; 16.6-64.6 kg K ha-1; 1.9-7.3 kg Mg ha-1), and saltmarsh hay had intermediate pools (5.8-8.7 kg Ca ha-1; 18.4-26.1 kg K ha-1; 3.8-4.2 kg Mg ha-1; p<0.001; Figure 2.5).
Across all years at Farm 3 and Farm 6, switchgrass had the highest Ca, K, and Mg pools (14.2-64.5 kg Ca ha-1; 53.9-165.9 kg K ha-1; 13.8-49.8 kg Mg ha-1), saltmarsh hay had intermediate pools (6.4-22.1 kg Ca ha-1; 25.2-57.9 kg K ha-1; 4.2-14.2 kg Mg ha-1), and weeds had the lowest pools (0.6-7.6 kg Ca ha-1; 14.0-48.4 kg K ha-1; 0.4-9.9 kg Mg ha-1; p<0.001; Figure 2.5).
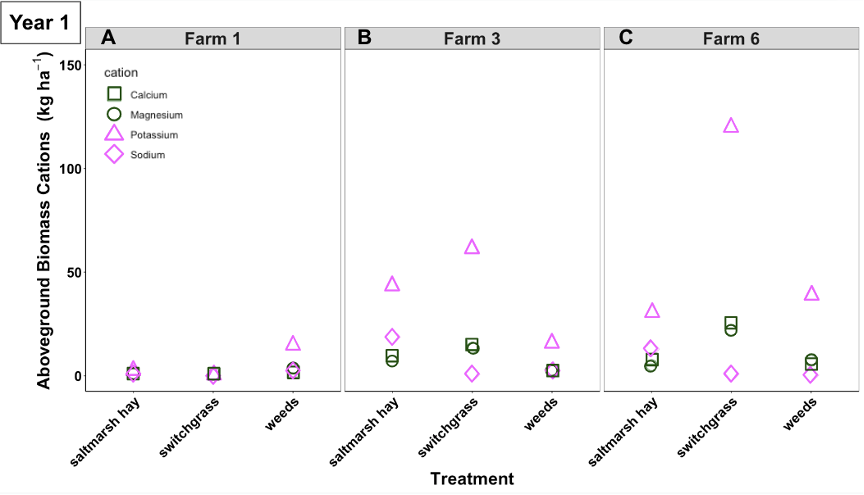
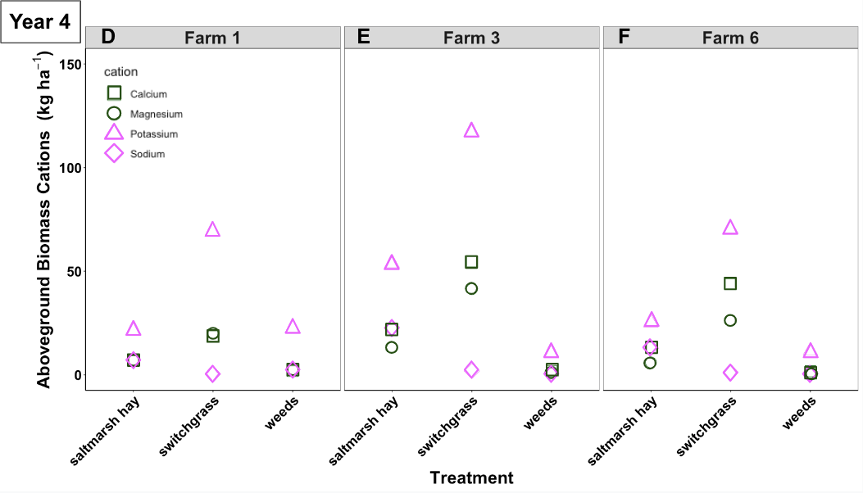
Figure 2.5. Plant aboveground biomass cation pools at three saltwater-intruded field sites on the Lower Eastern Shore of Maryland in year 1 (A-C) and year 4 (D-F). The x-axis is treatment at each of the three farm sites, and the y-axis is cation pools in aboveground biomass in kilograms per hectare. Alkaline earth metals (Mg [circles] and Ca [squares]) are represented by the color green and alkali metals (Na [diamonds] and K [triangles]) are represented by the color pink.
Correlations among cations in soils
In 2018, across all sites, Ca and K were highest in the topsoil (0-20 cm; r2 = -0.41 and r2 = -0.56; p<0.05 and p<0.01, respectively; Table 2.1) where Mg and Na concentrations were highest in the deepest depth of the soil (20-30 cm; r2 = 0.2; p=0.1 in both cases). Ca and Mg and Ca and K concentrations in the soil were positively correlated (r2 = 0.4; p<0.01 in both cases). Mg and Na were also positively correlated (r2 = 0.5; p<0.001). In 2021, across all sites, K, Mg, and Na were highest in the topsoil (0-20 cm; r2 < -0.2; p<0.05 in all cases; Table 2.1) and Mg and Na were highest closer to the ditch (r2 = -0.3; p<0.001 in both cases). Ca and Mg and Ca and Na concentrations in the soil were positively correlated (r2 = 0.6 and r2 = 0.3, respectively; p<0.001 in both cases). Mg and Na (r2 = 0.7; p<0.001) and Mg and K (r2 = 0.5; p<0.001) were also positively correlated.
Table 2. 1. Soil cation concentration correlations in year 1 (baseline) and saltmarsh hay, switchgrass, and weeds in year 4 in both the section closest to the ditch (0-5 m) and the section furthest from the ditch (15-20 m) on three-saltwater-intruded fields on the Lower Eastern Shore of Maryland. Values are r2 and symbols are p-values (^ = p<0.05, * = p<0.01, ** = p<0.005, *** = p<0.001).
|
Baseline |
Saltmarsh hay |
Switchgrass |
Weeds |
|||||
|
0-5 m |
15-20 m |
0-5 m |
15-20 m |
0-5 m |
15-20 m |
0-5 m |
15-20 m |
|
|
[M3Ca]~[M3K] |
0.43^ |
0.21 |
0.32^ |
-0.22 |
0.31^ |
-0.15 |
0.36* |
-0.22 |
|
[M3Ca]~[M3Mg] |
0.63** |
0.35 |
0.66*** |
0.59*** |
0.52** |
0.65*** |
0.62*** |
0.62*** |
|
[M3Ca]~[M3Na] |
0.0041 |
-0.30 |
0.05 |
0.40* |
-0.018 |
0.29^ |
0.32^ |
0.30^ |
|
[M3K]~[M3Mg] |
0.54* |
-0.28 |
0.69*** |
0.30^ |
0.75*** |
0.29^ |
0.74*** |
0.26 |
|
[M3K]~[M3Na] |
0.20 |
-0.57* |
0.40* |
0.27 |
0.37* |
0.31^ |
0.37* |
0.28^ |
|
[M3Mg]~[M3Na] |
0.48* |
0.46^ |
0.52** |
0.84*** |
0.66*** |
0.74*** |
0.63*** |
0.74*** |
Topsoil EC vs. soil cation concentrations
In 2018, EC was negatively correlated with [M3Ca] and [M3K] (r2 = -0.27, p<0.05; r2 = -0.32, p<0.01; Table 2.2). Contrastingly, EC was strongly positively correlated with [M3Mg] and [M3Na] (r2 = 0.54, p<0.001; r2 = 0.75, p<0.001; Table 2.2). In 2021, EC was positively correlated with [M3K], [M3Mg], and [M3Na] (r2 = 0.30, p<0.05; r2 = 0.58, p<0.001; r2 = 0.94, p<0.001; Table 2.2).
Table 2. 2. Soil EC and soil cation concentration correlations in year 1 (baseline) and year 4 in both the section closest to the ditch (0-5 m) and the section furthest from the ditch (15-20 m) on three-saltwater-intruded fields on the Lower Eastern Shore of Maryland. Values are r2 and symbols are p-values (^ = p<0.05, * = p<0.01, ** = p<0.005, *** = p<0.001).
|
2018 |
2021 |
|||
|
0-5 m |
15-20 m |
0-5 m |
15-20 m |
|
|
EC~[M3Ca] |
-0.27^ |
-0.20 |
0.016 |
-0.0058 |
|
EC~[M3K] |
-0.32* |
-0.27^ |
0.30^ |
0.14 |
|
EC~[M3Mg] |
-0.023 |
0.52*** |
0.58*** |
0.52** |
|
EC~[M3Na] |
0.54*** |
0.75*** |
0.94*** |
0.94*** |
Correlations among cations in plant leaf tissue
In 2019, across all saltwater-intruded sites, K and Mg concentrations in plant leaf tissue were the highest in weeds, Na was the highest in saltmarsh hay, and Ca was higher in the saltmarsh hay and switchgrass than weeds. In saltmarsh hay tissue, all cations were positively correlated, where K, Ca, Mg, and Na were strongly positively correlated with each other (r2 > 0.5; p<0.05 in all cases). In switchgrass plant leaf tissue, all cations were positively correlated (r2 = 0.68; p=0.001, r2 = 0.65; p=0.002), except K~Ca which was weakly negatively correlated (r2 = -0.1; p=n.s.). In the weed tissue, all cations were positively correlated with each other (r2 > 0.4; p<0.05 in all cases; Table 2.3).
In 2021, salt concentrations in plant tissues largely followed the same patterns within species: across all saltwater-intruded sites, again K and Mg concentrations in leaf tissue were highest in the weeds, again Na was highest in the saltmarsh hay, but in 2021, Ca was highest in the switchgrass rather than switchgrass and saltmarsh hay. In saltmarsh hay tissue, all cations were positively correlated with each other (r2 > 0.5; p<0.05 in all cases). In switchgrass plant leaf tissue, K was negatively correlated with Ca and Mg, and Na was negatively correlated with Ca and Mg. In the weeds, all cations were positively correlated with each other (r2 = 0.75; p<0.001; Table 2.3).
Table 2. 3. Plant leaf tissue cation concentration correlations for saltmarsh hay, switchgrass, and weeds from three-saltwater-intruded fields on the Lower Eastern Shore of Maryland in year 2 and year 4. Values are r2 and symbols are p-values (^ = p<0.05, * = p<0.01, ** = p<0.005, *** = p<0.001).
|
Saltmarsh hay |
Switchgrass |
Weeds |
||||
|
Year 2 |
Year 4 |
Year 2 |
Year 4 |
Year 2 |
Year 4 |
|
|
[Ca]~[K] |
0.12 |
0.60** |
-0.10 |
-0.29 |
0.56** |
-0.019 |
|
[Ca]~[Mg] |
0.59** |
0.62** |
0.65** |
0.29 |
0.27 |
0.082 |
|
[Ca]~[Na] |
0.54* |
0.58** |
0.046 |
-0.26 |
0.45* |
0.28 |
|
[K]~[Mg] |
0.56* |
0.50* |
0.17 |
-0.42^ |
0.34^ |
0.75*** |
|
[K]~[Na] |
0.55* |
0.35 |
0.68** |
0.32 |
0.29 |
0.028 |
|
[Mg]~[Na] |
0.67** |
0.063 |
0.16 |
-0.40^ |
0.54** |
0.10 |
Topsoil EC vs. plant cation concentrations
Correlations between soil EC and plant leaf tissue cation concentrations were mostly insignificant except for in the section closest to the ditch in switchgrass and weeds where EC was positively correlated with [Na] (r2 = 0.60, p<0.005; r2 = 0.89, p<0.005; Table 2.4). There was also a weak positive correlation between soil EC and [Mg] (r2 = 0.43, p<0.05).
Table 2. 4. Soil EC and plant leaf tissue cation concentration correlations in year 4 for saltmarsh hay, switchgrass, and weeds in both the section closest to the ditch (0-5 m) and the section furthest from the ditch (15-20 m) from three-saltwater-intruded fields on the Lower Eastern Shore of Maryland. Values are r2 and symbols are p-values (^ = p<0.05, * = p<0.01, ** = p<0.005, *** = p<0.001).
|
Saltmarsh hay |
Switchgrass |
Weeds |
||||
|
0-5 m |
15-20 m |
0-5 m |
15-20 m |
0-5 m |
15-20 m |
|
|
EC~[Ca] |
-0.16 |
-0.30 |
-0.059 |
0.0025 |
0.44 |
0.27 |
|
EC~[K] |
-0.058 |
-0.095 |
0.33 |
0.32 |
-0.062 |
-0.055 |
|
EC~[Mg] |
-0.07 |
-0.077 |
0.27 |
0.43^ |
0.28 |
-0.0066 |
|
EC~[Na] |
0.16 |
-0.062 |
0.60** |
0.16 |
0.89** |
0.67 |
Soil and plant cation concentration relationships (topsoil 0-10 in 2021)
In 2021, topsoil [M3Na] and plant leaf tissue [Na] were strongly positively correlated among switchgrass and weeds in both the area closest to the ditch and furthest from the ditch (r2 > 0.5, p<0.05 in all cases; Table 2.5). There was no correlation between any of the cations in the topsoil and saltmarsh hay plant leaf tissue in either section of the field. Switchgrass [Ca] in tissue closest to the ditch was negatively correlated with [M3K] in topsoils, while [Na] in tissues were positively correlated with [M3Mg] in topsoils (r2 = -0.44, p<0.01; r2 = 0.37, p<0.05). Switchgrass [K] and [Mg] in tissue furthest from the ditch was positively correlated with [M3Na] in topsoils (r2 =0.46, p<0.01; r2 = 0.39, p<0.05). The concentrations of Na in weed tissues in the 0-5 m section was strongly positively correlated with [M3K], [M3Mg], [M3Na] in soils (r2 = 0.75, p<0.005; r2 = 0.77, p<0.005). Weed tissue [K], [Mg], and [Na] concentrations furthest from the ditch was positively correlated with [M3Ca] (r2 = 0.84, p<0.005; r2 = 0.80, p<0.01; r2 = 0.64, p<0.05).
Table 2. 5. Plant leaf tissue and topsoil cation concentration correlations in year 4 for saltmarsh hay, switchgrass, and weeds in both the section closest to the ditch (0-5 m) and the section furthest from the ditch (15-20 m) from three-saltwater-intruded fields on the Lower Eastern Shore of Maryland. Values are r2 and symbols are p-values (^ = p<0.05, * = p<0.01, ** = p<0.005, *** = p<0.001).
|
Saltmarsh hay |
Switchgrass |
Weeds |
||||
|
0-5 m |
15-20 m |
0-5 m |
15-20 m |
0-5 m |
15-20 m |
|
|
[M3Ca]~[Ca] |
0.14 |
0.077 |
0.055 |
0.22 |
0.19 |
0.58 |
|
[M3Ca]~[K] |
0.0072 |
-0.064 |
-0.33 |
0.068 |
0.41 |
0.84** |
|
[M3Ca]~[Mg] |
-0.01 |
0.014 |
-0.037 |
-0.10 |
-0.17 |
0.80* |
|
[M3Ca]~[Na] |
-0.0025 |
0.065 |
-0.18 |
0.24 |
0.25 |
0.64^ |
|
[M3K]~[Ca] |
-0.27 |
-0.001 |
-0.44* |
-0.14 |
-0.33 |
-0.39 |
|
[M3K]~[K] |
-0.23 |
0.19 |
0.11 |
0.13 |
-0.012 |
0.43 |
|
[M3K]~[Mg] |
-0.14 |
0.067 |
-0.34 |
0.35 |
-0.11 |
0.22 |
|
[M3K]~[Na] |
-0.19 |
-0.007 |
0.16 |
0.0011 |
0.75* |
0.17 |
|
[M3Mg]~[Ca] |
-0.034 |
-0.078 |
-0.16 |
0.21 |
0.0034 |
-0.17 |
|
[M3Mg]~[K] |
-0.053 |
-0.15 |
0.053 |
0.20 |
0.23 |
0.068 |
|
[M3Mg]~[Mg] |
-0.21 |
-0.024 |
-0.031 |
0.22 |
0.061 |
-0.12 |
|
[M3Mg]~[Na] |
0.0033 |
0.066 |
0.37^ |
0.23 |
0.77* |
0.40 |
|
[M3Na]~[Ca] |
-0.35 |
-0.30 |
-0.13 |
-0.0024 |
0.49 |
-0.0011 |
|
[M3Na]~[K] |
-0.0036 |
-0.13 |
0.34 |
0.46* |
0.026 |
-0.0014 |
|
[M3Na]~[Mg] |
-0.24 |
-0.067 |
0.23 |
0.39^ |
0.14 |
-0.062 |
|
[M3Na]~[Na] |
0.14 |
-0.016 |
0.61** |
0.25 |
0.82** |
0.52 |
Chapter 2 Discussion
Our results from this study have implications for improved understanding of cation dynamics in plant leaf tissues and soils in saltwater intruded fields. After analyzing the aboveground biomass and soil under four management practices (adapt, remediate, restore, abandon) on three farms experiencing SWI, we determined that saltmarsh hay is efficient at taking up soil Na. We showed the relationships between plant leaf tissue and soil available cations are complex and differ by our variables (e.g., distance from the ditch, year) under saltwater-intruded conditions. Not surprisingly, concentrations of available K, Mg and Na in soils were higher close to the ditch than near the center of the agricultural field as the result of SWI and SLR (Arslan & Demir 2013; Figure 2.4). After three years of planting, available Ca and K decreased in topsoils and available Mg and Na increased in topsoils at all saltwater intruded sites (Figure 2.4). The significant decrease in soil available Ca in the topsoil (0-10 cm) over 2 years suggests that Ca was leached below 10 cm or that it was assimilated into plant tissues. While Ca is normally bound to soil colloids, with an excess of Na from saltwater, there is more opportunity for Na to exchange with Ca, causing Ca to release (Chidambaram et al. 2015). Soil available K decreased in the topsoil after 2 years likely due to plant uptake as K does not readily leach from soils (Mayland & Wilkinson 1989; Lehmann & Schroth 2002). On the other hand, soil available Mg and Na increased over 2 years which was expected as these cations are the main constituents that make up seawater and can be increased by SWI (Kester et al. 1967; Figure 2.4; Table 2.2). Overall, restoration (e.g. saltmarsh hay) management practices showed no increase in aboveground biomass Na concentrations as soil available Na accumulated over time, and this was indicative of the species’ ability to co-regulate cations in their leaf tissue.
Plant tissue cation concentrations varied among the different species
We expected that as Na concentrations in the soil increased, it would prevent the uptake of Ca into plant tissues (Lazoff & Bernstein 1999). While there were no strong correlations between soil Na and leaf tissue Ca in our data (Table 2.5), we observed an increase in Ca concentrations in switchgrass and weeds after two years (p<0.01; Figure 2.4A-C). Increased soil Na has also been known to prevent the uptake of K into plant tissues (Munns & Tester 2008), which could have caused leaching from surface flooding, but this would cause an increase or no change in soil available K concentrations, which is not what we saw (observed decrease in soil available K; Figure 2.4D-F). However, we found similar patterns among all saltwater-intruded sites across all study years where the highest concentrations of K were always found in the weed tissue and intermediate levels in switchgrass tissues, and there was an increase in K concentrations for both species in 2021 (Figure 2.4D-F). Similarly, we found the highest concentrations of Mg were in the weed tissue, the lowest [Mg2+] were found in saltmarsh hay tissue, and intermediate levels were found in switchgrass (Figure 2.4G-I). Previous literature has shown excess uptake of K in grasses lowers Mg content (Robinson et al. 1989). The differing results from our expectations could be due to how different species are able to regulate salt uptake and tolerate different levels of salinity (Grieve et al. 2012). Switchgrass is known to have a higher tolerance to limiting water and nutrient conditions and may be able to uptake more soil nutrients due to their deep root system and relationship with mycorrhizal fungi (Di Virgilio et al. 2007; Xu et al. 2017). The weed species in 2019 was a native switchgrass species (Panicum dichotomiflorum) with extensive roots similar to our planted switchgrass. In 2021, the dominant weed was a marsh species, crabgrass (Digitaria sanguinalis), that is similar to saltmarsh hay that is able to regulate nutrient uptake under saline conditions and maintain biomass regardless of Ca and Mg additions (Grieve et al. 2012; Pierce et al. 2017).
Saltmarsh hay is able to regulate uptake of Na
We predicted that plant biomass would be suppressed by excess Na from SWI due to the osmotic and toxic effects on plant growth and cell function (Flowers et al. 1991). Topsoil [M3Na] and plant leaf tissue [Na] were strongly positively correlated in the switchgrass and weed treatments in both the area closest to the ditch and furthest from the ditch (Table 2.5) meaning both took up more Na when there was more Na in the soil (Kim et al. 2012; Rashidi et al. 2020). Because switchgrass and weeds were taking up more Na in their leaf tissue, this may have caused the inhibition of uptake of important nutrients that contribute to their biomass (Greenway & Munns 1980; Hasegawa et al. 2000; Netondo et al. 2004). There were no relationships between saltmarsh hay tissue and soil cations due to the salt-tolerant species’ ability to regulate salt intake (Grieve et al. 2012), specifically taking in high concentrations of Na. A change in soil cation concentrations did not affect leaf tissue cation concentrations (Table 2.5), but interestingly, saltmarsh hay plant leaf tissue cation concentrations were very strongly positively correlated with each other (Table 2.3).
Across all study years and all sites, plant leaf tissue Na concentrations [Na+] and biomass Na pools were highest in saltmarsh hay (p<0.001). Saltmarsh hay is efficient at taking up soil Na and, if planted along the saltier edges of the field, could be a mitigation strategy to decrease soil Na that is toxic to most plants in the area. Planting saltmarsh hay could facilitate the transition to native marsh which might be a better option if the field experiences more flooding (Gedan et al. 2011; Hu et al. 2015; Leonardi et al. 2018). Previous research indicated that fields experiencing SWI will naturally transition to host more native marsh species such as saltmarsh hay (Gedan et al. 2019). Federal reserve programs could provide landowners with financial assistance, or there are opportunities to use the land for other activities such as waterfowl hunting that could be an alternative source of revenue (e.g., Conservation Reserve Enhancement Program; CREP 2022, Environmental Quality Incentives Program; EQIP 2022, Wetland Reserve Easements; WRE 2022). Overall, restoring farm fields has benefits for the soil by taking up Na, landowners by maintaining revenue, and communities by protecting coastlines.
Chapter 1 Conclusions
With rising sea levels increasing saltwater intrusion along the Eastern Shore of the Chesapeake Bay, landowners and farmers are in need of new strategies to mitigate the effects of climate change. This work on agricultural fields experiencing SWI aims to examine the survival of different plant species and better understand nutrient dynamics in plant biomass, soils, and porewater (Tully et al. 2019; Weissman & Tully 2020). We show that remediation and restoration management practices are efficient in taking up soil and porewater P that may ultimately decrease P runoff into the Chesapeake Bay. Overall, patterns of P pools were influenced by biomass levels, and after three years of planting, switchgrass and saltmarsh hay produced more biomass than weeds, sorghum, or salt-tolerant soybeans, and their production was influenced by the degree of SWI at each site. In switchgrass and saltmarsh hay, the uptake of P was consistent with the decrease in soil P and M3P concentrations and pools, reducing the levels of P to be released as SRP by about 20%. In sum, planting either switchgrass or saltmarsh hay would have economic and environmental benefits in mitigating the adverse effects of SWI. By determining the efficacy of best management practices, we aim to help farmers keep their land profitable and remove excess P from the soil to promote better water quality. Improved economic and environmental sustainability in turn supports social sustainability by maintaining the viability of rural livelihoods and landscapes. Thus, it is important to understand the trajectories of different land management practices if farmers’ goals are to continue crop production while avoiding addition of excess nutrients to the Bay. The findings of this research will help inform farmer management decisions given economic and environmental objectives and tradeoffs.
Chapter 2 Conclusions
Rising seas and elevated soil salinity levels have forced farmers to reconsider their management practices, and these decisions will impact downstream ecosystems. Different frameworks are used to categorize human responses to climate change and natural hazards such as floods (Canyon et al. 2015; van Wesenbeeck et al. 2017; Doberstein et al. 2019). For example, retreat approaches are those where landowners repurpose their fields by enrolling them in easement programs (e.g. Conservation Reserve Program; CRP 2022) (van Wesenbeeck et al. 2017). Similar to these other frameworks, management practices for the specific region also attempt to accommodate SLR (and SWI) by planting native marsh species or retreating and allowing the transition of fields into marshland (Tully et al. 2019). We observed patterns of regulation in nutrient uptake in all species (saltmarsh hay, switchgrass, and weeds) despite the imbalance of normal nutrient uptake due to saltwater Mg. In sum, results from this study show restoration management practices are efficient at taking up soil Na, and may keep up with high Na concentrations and pools in the soil over time, which may benefit both soil and plant health on saltwater-intruded fields. Finally, this work will help inform state-level coastal management policies and determine optimal strategies for climate resilience.
Education & outreach activities and participation summary
Participation summary:
I targeted farmers who were experiencing saltwater intrusion at local farmer field days and workshops (e.g. The Maryland Sea Grant Coastal Farming Challenges Workshop), so they were able to make informed decisions on how to manage their land. I reached landowners through Soil Conservation District events in Somerset, Dorchester, and Wicomico counties and worked with farmers to generate applied research questions and effective land management practices. The annual research team Stakeholder Meetings were another outreach venue; which happened in February 2022 in Princess Anne, MD. The annual stakeholder meetings help inform farmers, extension agents, and other agricultural professionals of our findings and seek input on new research directions. We also discussed the advantages and disadvantages of enrolling in easement programs or using alternative best management practices. I also targeted extension personnel and other farm advisors through the previously mentioned methods and by sharing findings at the Mid-Atlantic Crop Management School. I participated in the Mid-Atlantic SWI Conference (2023) that included other regional (VA, NC, GA) research results from stakeholders. I produced one Fact Sheet and and one Extension short communications providing updates on the project.
I reached the scientific community through presentations at The American Society of Agronomy, the Crop Science Society of America, and the Soil Science Society of America (ASA-CSSA-SSSA) annual meeting in Baltimore, MD in 2022. I shared the results of my research with a large scientific audience through presentations at conferences and research symposiums and by submitting two articles in peer-reviewed journals such as Agriculture, Ecosystems, & Environment and Plant & Soil. This work builds on a larger project [funded by the National Institute of Food and Agriculture (NIFA)] that has an extensive outreach component. I leveraged a new National Science Foundation Coastal Critical Zone Network (CZN) plan to disseminate my findings.
Finally, I targeted policy-makers by sharing my findings with the Maryland Department of Agriculture, Maryland Department of Planning, and Maryland Department of Natural Resources, which are collaborating with Drs. Tully and Gedan to develop best management practices and potential easement strategies for salt-intruded lands. This proposal addresses pressing needs to better understand how agricultural landscapes will change in the coastal zone and how this research can inform current and future decision-makers and researchers. The knowledge we gained on Na and P uptake will inform best practices for adaptive farming, remediation, restoration, or abandonment of agricultural land impacted by SWI. For example, the Maryland Department of Natural Resources (DNR) is working to develop Coastal Resiliency pilot projects on salt-intruded farm fields to improve coastal communities’ resilience to the effects of climate change (MD DNR 2018). Our team has active collaborations with Maryland DNR, and I will present my results to the Director of the Office of Science and Stewardship and her team in an effort to inform policies that can support both farmers and the Chesapeake Bay.
Updates:
- Schulenburg, A. (Presenter), Tully, K., Miller, J., Gedan, K., Mid-Atlantic Crop Management School Soil and Water Management Session, "Management options for farmers facing saltwater intrusion on the Eastern Shore of the Chesapeake Bay," University of Delaware Crop Management School. Virtual. (November 15, 2021). Recorded a 45-minute presentation on saltwater intrusion, how the soil and plants respond to saltwater intrusion (soil dispersion, sodium toxicity in plants), and new strategies to adapt to or mitigate the effects of saltwater intrusion (through the planting of salt-tolerant crops or transitioning fields to marshes) to farmers and extension agents. Approximately 45 attendees.
- Schulenburg, A. (Presenter), Tully, K., Miller, J., Gedan, K., University of Maryland Extension. Research Recap Nutrient Management Session, "Management options for farmers facing saltwater intrusion on the Eastern Shore of the Chesapeake Bay," Virtual. (February 2, 2022). Presentation (45 min) on saltwater intrusion, how the soil and plants respond to saltwater intrusion, possible new strategies to adapt to or mitigate the effects of saltwater intrusion, and phosphorus concentration data. I spoke with farmers, agricultural educators, and agricultural professionals about the details and implications of this research project. Approximately 25 attendees.
- Schulenburg, A. (Presenter), Tully, K., Miller, J., Gedan, K., United States Department of Agriculture Natural Resources Conservation Service. Delmarva Soil Summit, "Management Options for Farmers Facing Saltwater Intrusion on the Eastern Shore of the Chesapeake Bay," Salisbury, MD, United States. (February 7, 2022). Placed 2nd (out of 6 participants). Poster presentation with details of plant leaf tissue, grain, soil, and porewater phosphorus concentrations and pools. Target audience was farmers, extension agents, and other researchers. Approximately 75 attendees.
- Schulenburg, A. (Presenter), Tully, K., Miller, J., Gedan, K., United States Department of Agriculture National Institute of Food and Agriculture. Saltwater Intrusion Stakeholder Meeting. "Management Options for Farmers Facing Saltwater Intrusion on the Eastern Shore of the Chesapeake Bay," Princess Anne, MD, United States. (February 16, 2022). Presentation (15 min) on saltwater intrusion and how growing remediation and restoration species can alter concentrations of phosphorus in the soil and porewater. I spoke with farmers, agricultural educators, and agricultural professionals about the details and implications of this research project. Approximately 30 attendees.
- Schulenburg, A. (Presenter), Tully, K., Miller, J., Gedan, K., American Society of Agronomy Crop Science Society of America-Soil Science Society of America Annual Meeting, Soil Fertility and Plant Nutrition Session, "Improving Soil Health and Plant Productivity on Coastal Agricultural Fields Facing Saltwater Intrusion on the Eastern Shore of the Chesapeake Bay," American Society of Agronomy-Crop Science Society of America- Soil Science Society of America, Baltimore, MD, United States. (November 7, 2022). Placed 5th (out of 46 participants). Presentation (15 min) on my research project main findings, specifically the phosphorus and cation concentrations in plant leaf tissue and crops and the soil. I spoke to and answered questions for other researchers and farmers about my research. Approximately 20 attendees.
- Schulenburg, A. (Presenter), Tully, K., Miller, J., Gedan, K., American Society of Agronomy Crop Science Society of America-Soil Science Society of America Annual Meeting, Reducing Nutrient Losses at Field, Farm, and Watershed Scales Session, "Management Options for Farmers Facing Saltwater Intrusion on the Eastern Shore of the Chesapeake Bay," American Society of Agronomy-Crop Science Society of America-Soil Science Society of America, Baltimore, MD, United States. (November 8, 2022). Poster Presentation (5 min) on the highlights of my research, specifically the phosphorus concentrations and pools in different species plant leaf tissue and the soil. I spoke to and answered questions for other researchers and farmers about my research. Approximately 25 attendees.
- Schulenburg, A. (Presenter). Management options for farmers facing saltwater intrusion on the Eastern Shore of the Chesapeake Bay. Master’s Thesis Defense. University of Maryland, College Park, MD, United States. (January 19, 2023). Presentation (45 min) on my research project main findings (phosphorus pools in topsoil and porewater decreased significantly after three years of growth; switchgrass is efficient at taking up soil and porewater P; saltmarsh hay is efficient at taking up P in high salinity soils; saltmarsh hay is efficient at taking up soil sodium and may decrease sodium concentrations and pools in the soil over time).
- Submitted chapter 1 to Agriculture, Ecosystems, & Environment Journal on 20 July 2023.
Project Outcomes
Results from this study will help inform new management practices to increase soil health and maintain crop yields. By determining the efficacy of best management practices, we aimed to help farmers keep their land profitable and remove excess P from the soil to promote better water quality. Improved economic and environmental sustainability in turn supports social sustainability by maintaining the viability of rural livelihoods and landscapes. Thus, it is important to understand the trajectories of different land management practices if farmers’ goals are to continue crop production while avoiding addition of excess nutrients to the Bay. The findings of this research will help inform farmer management decisions given economic and environmental objectives and tradeoffs. Finally, the goal of this work was to guide local best management practices and potential easement opportunities for landowners facing saltwater intrusion, and ultimately determine optimal strategies for climate resilience.
My advisor, Kate Tully, and I increased our knowledge about sustainable agriculture throughout the course of this project by quantifying plant species and soil cation and phosphorus concentrations and pools on fields experiencing saltwater intrusion and investigating their relationships. I began the project optimistic, but after speaking to landowners, we learned that although there are agricultural solutions to sea-level rise and saltwater intrusion, salt-tolerant crops will only get us so far, and we have to start thinking more outside of the box. The future direction of my career includes earning a PhD in a related field and ultimately teaching at an R1 university. Future research should explore other remediation and restoration species (e.g., Miscanthus, Spartina alterniflora, Spartina pectinata) effects on transitioning landscapes experiencing sea-level rise and saltwater intrusion. Maryland Sea Grant produced a publication detailing the results of the Coastal Farming Challenges Workshop, where they found most producers plan to resist (e.g., tide gates) or accept changes over the next five years (due to lack of effective and affordable management options), and in the long-term they will transition land to a use that is compatible with increased saltwater intrusion and flooding (e.g., enroll in easements). With the research done with this grant, we are able to offer two management options with economic benefits (remediate with switchgrass that can be used for biofuel or poultry bedding or restore the land to marsh with saltmarsh hay), and we are eager to share our findings at the next Coastal Farming Challenges Workshop to see if this changes more landowners’ plan of action.
This project was successful in part by the good collaborators, the access to equipment and instrumentation, and the fact that the project was addressing an important issue for local farmers. Future research includes (i) finding alternative uses for saltmarsh hay and switchgrass that have a market in the region; (ii) examining the carbon storage potential of different management strategies; (iii) continuing with long-term research on alternative management practices; and (iv) expanding research to other regions along the Eastern Seaboard.