Final report for GNE21-272
Project Information
Hand-held near infrared reflectance (NIR) spectrometers can be used to improve forage management objectives. Prediction models were developed using a dataset of NIR spectra collected from a hand-held NeoSpectra spectrometer from fresh cut grass and alfalfa samples using stationary and sliding scanning techniques. Forage samples were collected at a range of maturities and varieties during the 2021 and 2022 growing seasons from multiple locations in New York, USA. Fresh forage samples were chopped, and pure species were combined into known proportions on a dry matter basis, resulting in 534 samples. Development of the calibration model was completed using partial least squares regression with cross validation. Best performing calibrations were achieved using the sliding scanning technique with spectral preprocessing consisting of mean-centering and 15 latent variables (root mean square error of prediction (RMSEP) = 13.6 %, internal validation R2 = 83%, and ratio of prediction to deviation (RPD) = 2.6). Results highlight fair predictive values can be derived from models, giving hand-held NIR spectrometers the potential to predict composition of fresh grass and alfalfa forage mixes. This technology provides the agricultural industry with rapid, non-destructive, affordable information to allow farmers and consultants to accurately predict the grass proportion within alfalfa-grass fresh forage mixtures in real-time.
# 1. Create a database of NIR spectra with the Neo Spectra Scanner, using alfalfa-grass samples with the full range of grass% from 0 to 100%.
# 2. Develop calibrations for the Neo Spectra Scanner for estimating grass percentage in alfalfa-grass fresh mixtures.
Near infrared reflectance spectroscopy (NIRS) has been used successfully to evaluate forage crops since 1976 (Marten, 1989; Norris et al., 1976). Advances in spectrometers that minimize background noise and enhance stability of measurements may allow possible use of NIRS at the farm level (Digman et al., 2022a; Gorla et al., 2022; Marchesini et al., 2017). Hand-held NIR spectrometers have become more readily available over the past decade. This trend is expected to continue as the technology develops, providing real-time, cost-effective, on-farm accurate field analysis (Beć et al., 2021). A disadvantage associated with all NIR spectrometers, however, is that they require robust calibrations for each new material of interest, which involves extensive sample collection to capture the wide range of forage properties that exist (Digman et al., 2021; Evangelista et al., 2021). Therefore, robust calibration model development is needed for hand-held NIR spectrometers in the agriculture sector (Beć et al., 2020; Digman et al., 2022a). Almost all available hand-held NIR spectrometers and their calibrations have been developed in countries outside of North America, with few analyzing fresh forage samples and none focused on species mixtures.
The NeoSpectra spectrometer is a hand-held NIR spectrometer that allows users to access spectra and develop calibrations, with technology based on a micro-electromechanical system (MEMS) interferometer covering a wide NIRS spectral range of 1,350 to 2,500 nm (Giussani et al., 2022; Priori et al., 2022). This spectrometer can accurately predict forage nutritional value in dried, ground alfalfa, and grass samples (Digman et al., 2022a; Gorla et al., 2022), while other NIR spectrometers have been used to analyze different nutritive parameters of fresh forages (Bell et al., 2018; Carreira et al., 2021; Murphy et al., 2022). However, calibrations estimating grass percentage in grass-alfalfa mixes using hand-held NIR spectrometers have not appeared in the literature.
With approximately 85% of alfalfa sown in New York State in combination with a perennial grass, providing farmers with the tools to estimate grass content of mixtures using a hand-held unit could be a cost-effective solution to the problem of evaluating and managing variability in alfalfa-grass composition (Cherney et al., 2021a; Karayilanli et al., 2016). The objective of this study was to develop calibration equations for the NeoSpectra spectrometer for estimating grass percentage in alfalfa-grass fresh mixtures, and to evaluate different scanning techniques.
Research
Portable NIR instruments have the potential to improve both the economic and environmental wellbeing of forage and dairy farmers, but only if they provide relatively accurate and precise information on forage composition. On-farm NIR analysis will be particularly important for alfalfa-grass producers, to improve field management and reduce variability in dairy rations. We have purchased three Neo Spectra Scanner ‘Alpha’ version instruments. Our hypothesis is that the Neo Spectra Scanner, with its wide NIR range, will provide accurate and precise alfalfa-grass composition information on farm.
Materials and Methods
a. Sample Collection
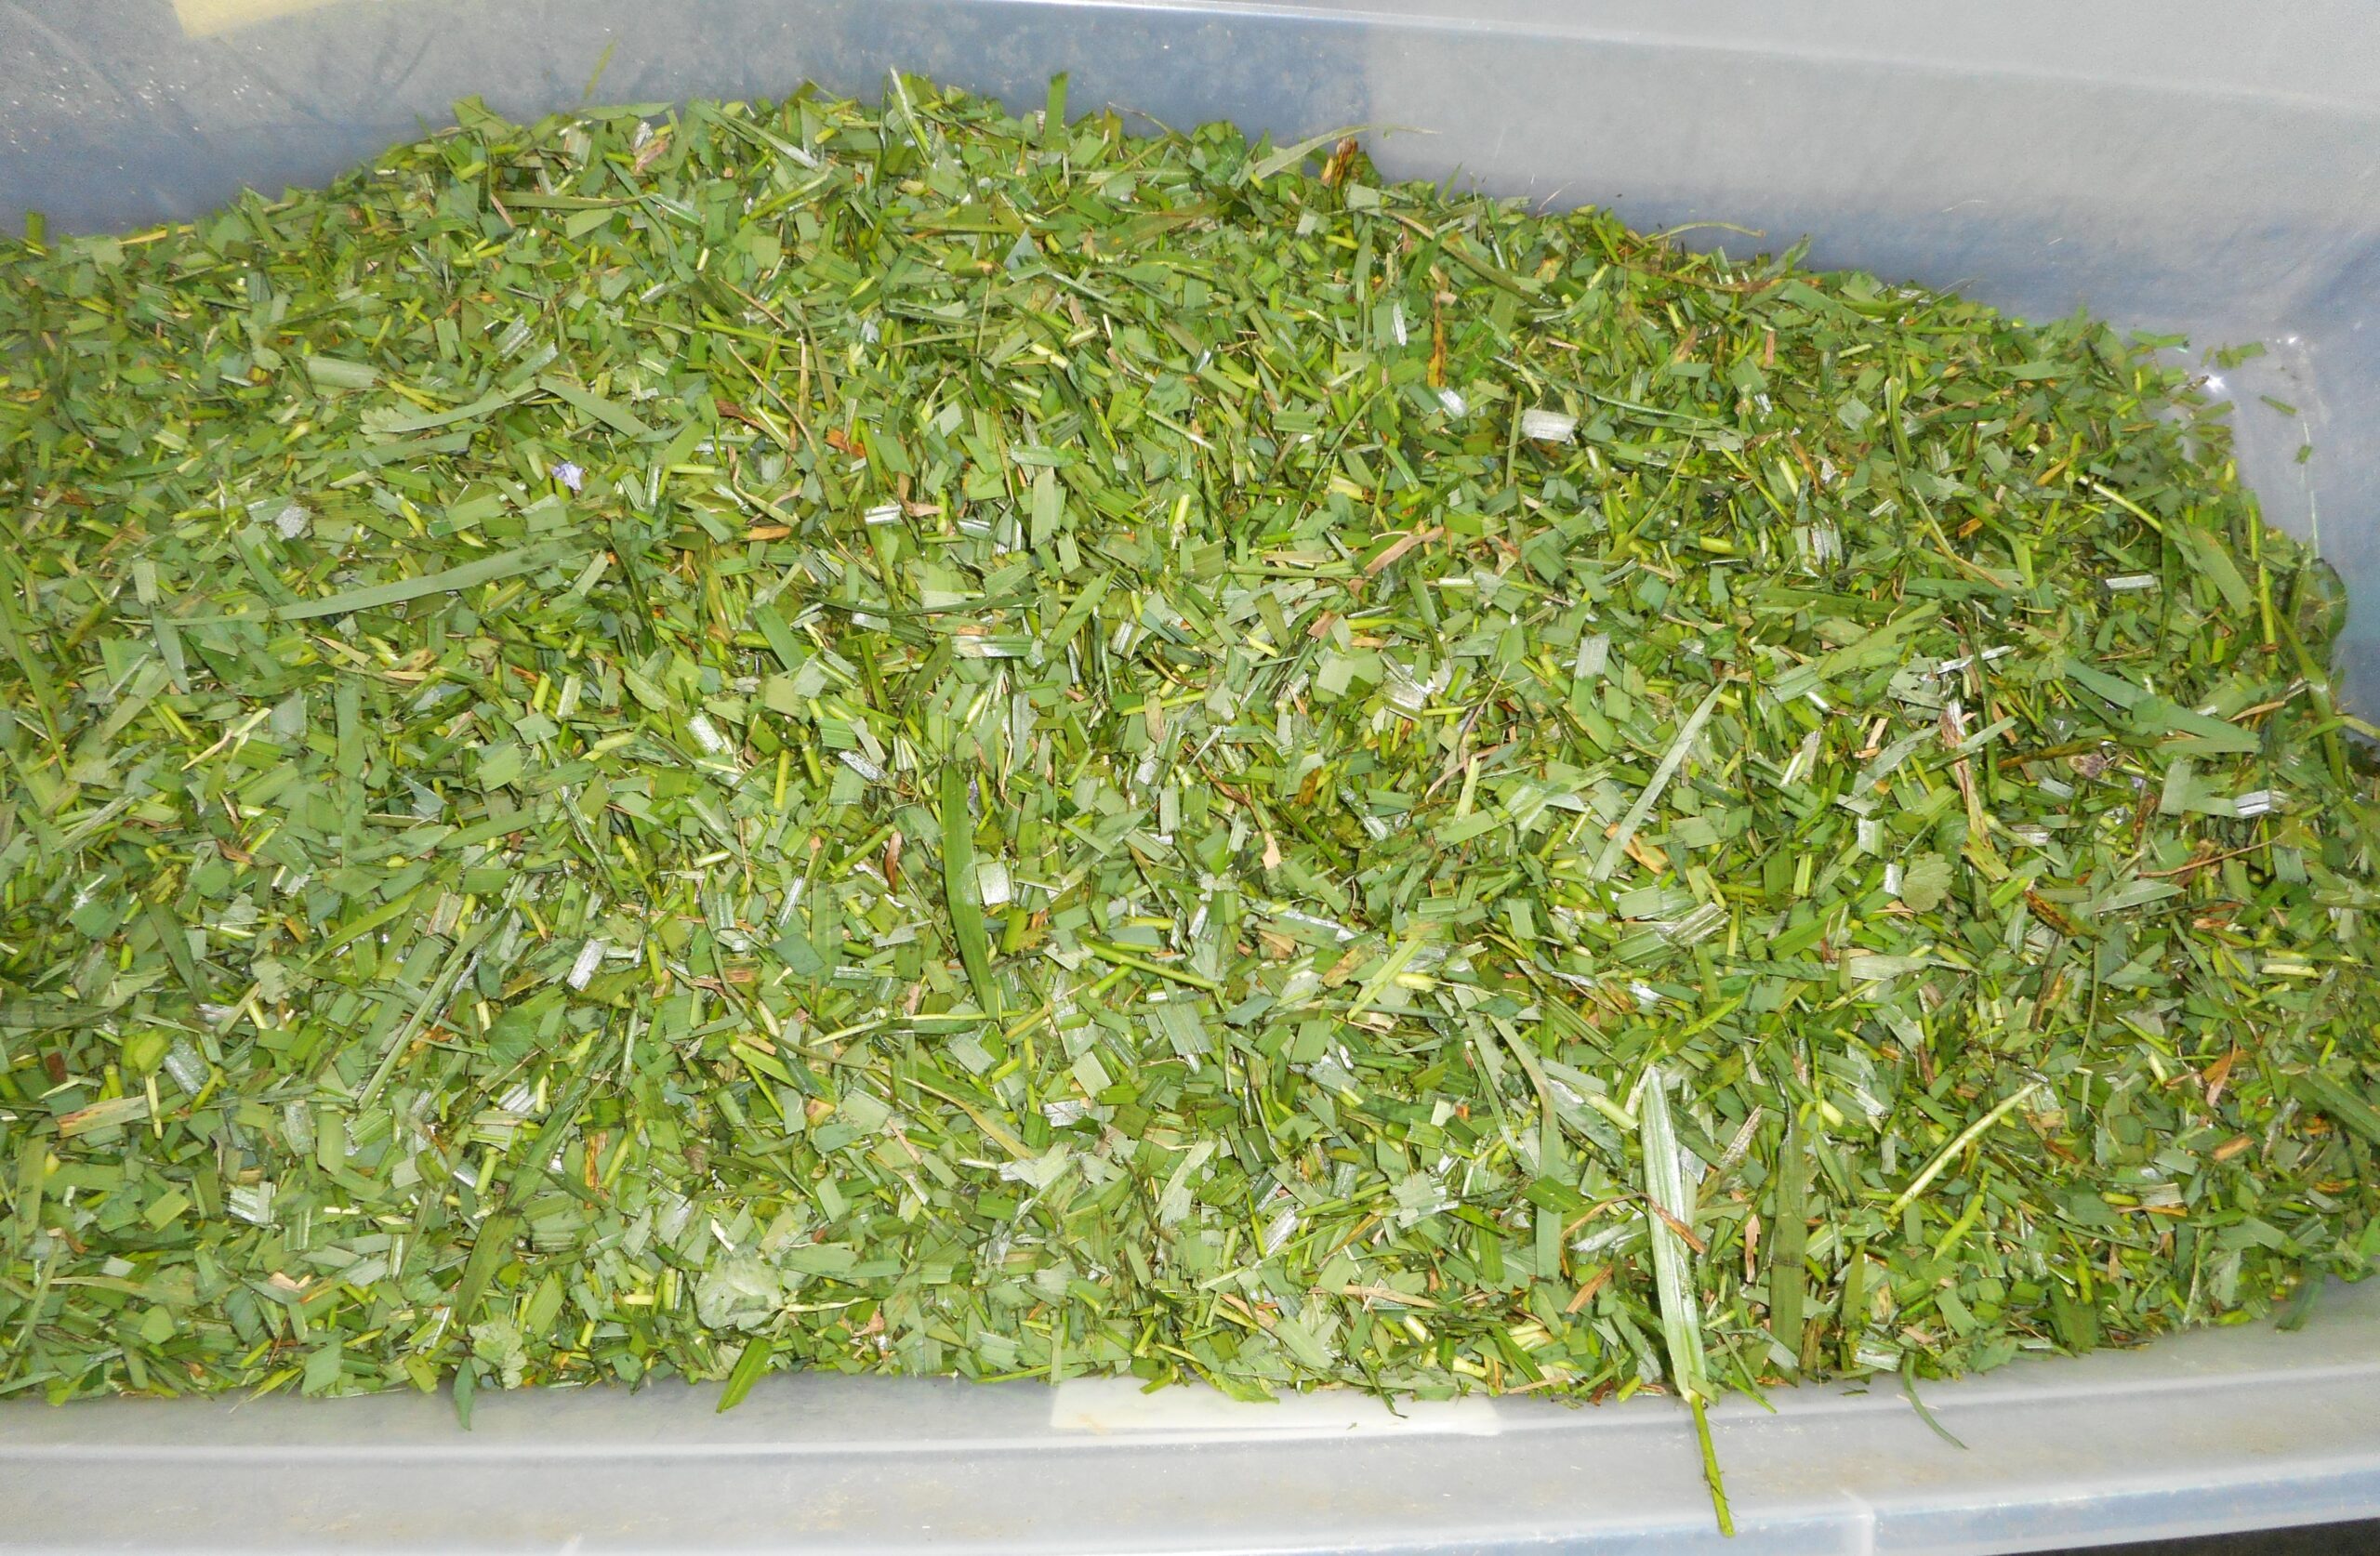
Eighty-nine grass samples and 89 alfalfa samples were collected from dairy farms located within a 40-mile radius around Ithaca, NY, between May and October of 2021 and 2022. Forage maturities ranging from vegetative to reproductive stages were harvested to reflect the range in forage maturities possible on dairy farms in the northeast of the US. A variety of alfalfa cultivars along with different grass species including tall fescue (Schedonorus arundinaceus (Schreb.) Dumort. (Poaceae)), meadow fescue (Schedonorus pratensis (Huds.) P. Beauv. (Poaceae)), orchardgrass (Dactylis glomerata L.), reed canarygrass (Phalaris arundinacea L. (Poaceae).), smooth brome grass (Bromus inermis Leyss (Poaceae)), quackgrass (Elymus repens L., Gould (Poaceae)), and timothy (Phleum pratense L.) were hand harvested at a 10 cm stubble height from an area about 2 m2 that varied depending on growth stage. Approximately 3 kg of grass and alfalfa forage was collected per sample. Samples were coarsely chopped using a HEGE 44 Laboratory chopper (Wintersteiger, Salt Lake City, UT). Chop length was controlled by changing the stepless adjustment of the feeding speed, where more mature, coarse forage material required a slower feeding speed. Approximate particle size ranged between one to three inches long.
For each sample, one pure grass, one pure alfalfa, and four mixed subsamples were prepared. Mixed subsamples were made up of chopped grass and alfalfa with an increasing proportional mix of fresh grass to alfalfa, approximately; 140g:560g, 280g:420g, 420g:280g, and 560g:140g. The grass percentages in the mixed subsamples ranged from approximately 20% to 80% and these combined subsamples were mixed well before being scanned. In total, 534 samples were prepared for scanning.
b. Determination of grass percentage
A multi-step procedure was performed to determine actual grass percentage in each mixed subsample. For each pure sample of grass and alfalfa, approximately 250g was weighed out and oven dried at 60o C for 48 hours. Dry matter content of each pure fresh forage type was determined and was used to calculate the dry matter of each mixed subsample. To estimate the grass percentage of a mixed sample, the dry matter weight of the grass was divided by the sum of the dry matter weights for grass and alfalfa, and then multiplying by 100.
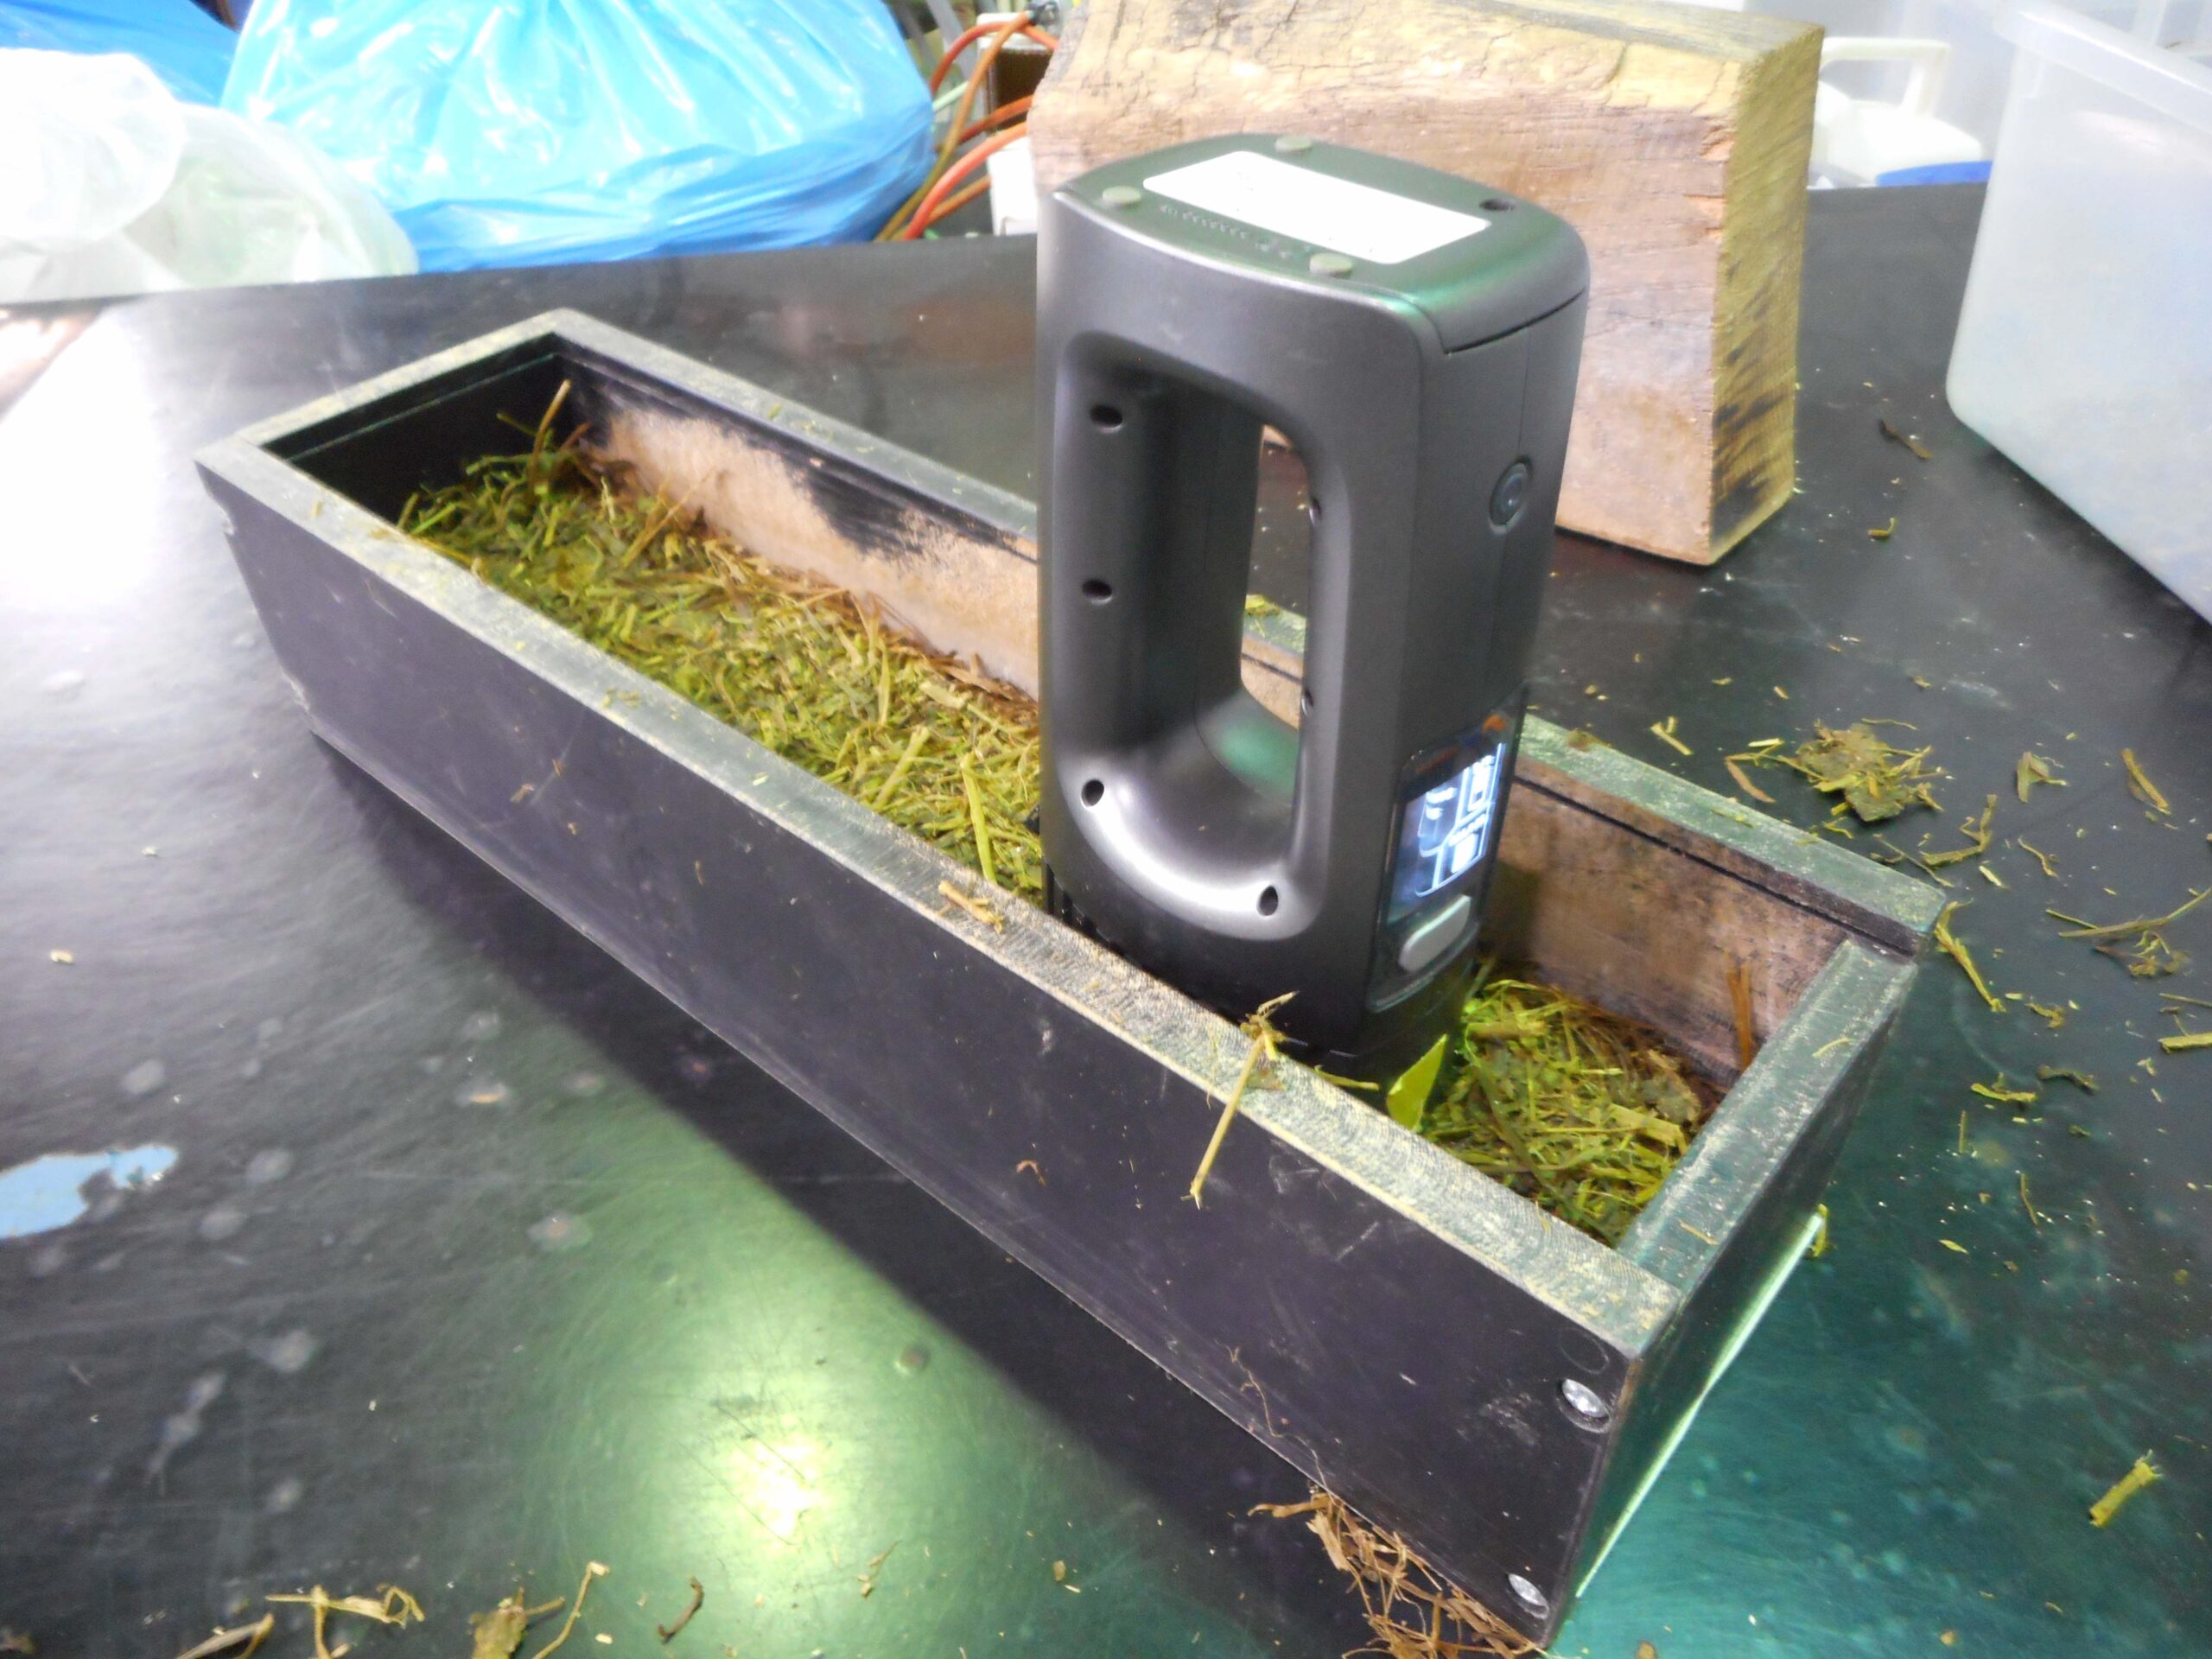
c. Instrument and scanning procedure
A NeoSpectra spectrometer (Si-Ware-Systems, Cairo, Egypt) was used to analyze fresh forage samples and spectra were collected in the range of 1350-2550 nm in increments of 16nm resolution (257 wavelengths). Samples were distributed uniformly in a 10 x 40 x 13 cm deep rectangular container, maintaining a thickness of at least 10 cm. The stationary scanning procedure involved placing the spectrometer firmly on the lightly packed forage sample for four seconds per scan and taking four scans at distinct locations in the container, resulting in 2,136 stationary scans. The sliding scan involved direct contact of the spectrometer with forage material for four seconds as the spectrometer was moved over the forage sample, resulting in 2,136 scans using the sliding scanning technique. Approximately 1 cm was removed from the top layer between scans to ensure scanning of a different part of the sample.

d. Model development
MATLAB version 9.12 R2022a (MathWorks, Inc., Natick, MA, USA) was used for developing calibration models and plotting. Spectra included two datasets, stationary and sliding where the four spectra per sample were averaged to obtain to a single spectra per sample. Each spectrum is made up of 257 wavelengths and reflectance values produced by the spectrometer were transformed to relative absorbance values using log10 R-1. For each of the two datasets, a randomly selected 25% of the dataset was removed prior to calibration, referred to as the test-set. and was used for testing the calibration model. For each set of four repeated scans, standard deviation at each wavelength was calculated. The 257 standard deviations were averaged to obtain a measure of the variability of the four repeated scans of a single sample. Spectra of the scans of the samples with standard deviations above 7 were inspected visually and removed with no more than 0.5% of the scans removed.
Calibration models were developed in PLS Toolbox version R9.1 (2022 Eigenvector Research, Inc., Manson, WA, USA) using partial least squares (PLS) regression. Percentage of grass was the dependent variable and the average absorbance spectrum was the independent variable. Preprocessing methods applied were mean-centering (MC), mean-centering and Savitzky-Golay smoothing (SG), and mean-centering with Savitzky-Golay smoothing by first derivative (D1), all of which have been previously applied in NIRS forage research (Berzaghi et al., 2021; Digman & Runge, 2022b; Gorla et al., 2022; Rego et al., 2020). Pretreatments, SG and D1 were smoothed over 15 points using a polynomial order of 2 and filter width of 5. Number of latent variables (LV’s) were determined using 5-fold cross validation (PLS ToolBox Venetian Blinds using 5 data splits with 1 sample per blind). The largest number of LV’s that did not result in more than a 20% deviation between root mean square error of calibration (RMSEC) and that of cross validation (RMSECV) were selected. The performance of each calibration model was evaluated by using the test-set. The model obtained using the calibration data was utilized to predict the validation spectra and compared to the test-set to determine the root mean square error of prediction (RMSEP). An additional measure of accuracy is defined by the ratio of standard error of prediction to standard deviation (RPD), calculated as . For forages, the RPD classification values range from 0 to 4.1+ where 0.0-1.9 is very poor, 2.0-2.4 is poor, 2.5-2.9 is fair, 3.0-3.4 is good, 3.5-4.0 is very good, and 4.1+ is considered excellent (Williams et al., 2019).
There were 534 samples, each sample was scanned in two different ways (i.e., stationary and sliding), and there were 4 scans per sample, for a total of 4,272 scans. Figure 1 illustrates the initial sample population showing the different pools of grass proportion datasets.
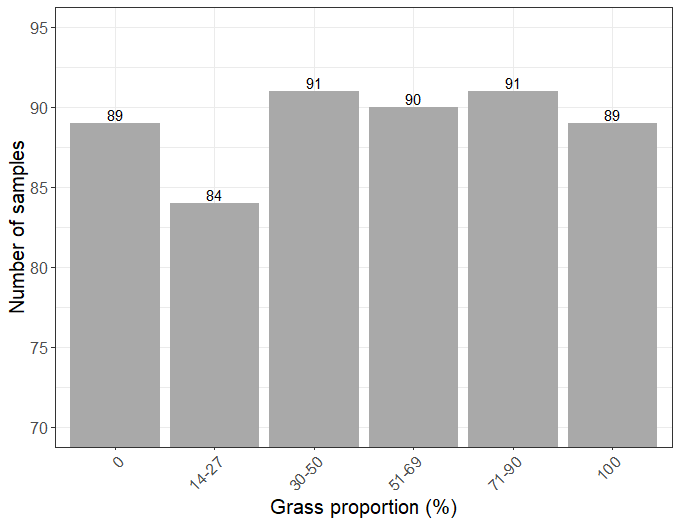
Figure 1: Sample pools by grass proportion based on dry matter content of grass within grass-alfalfa sample mixtures.
a) Spectral Description
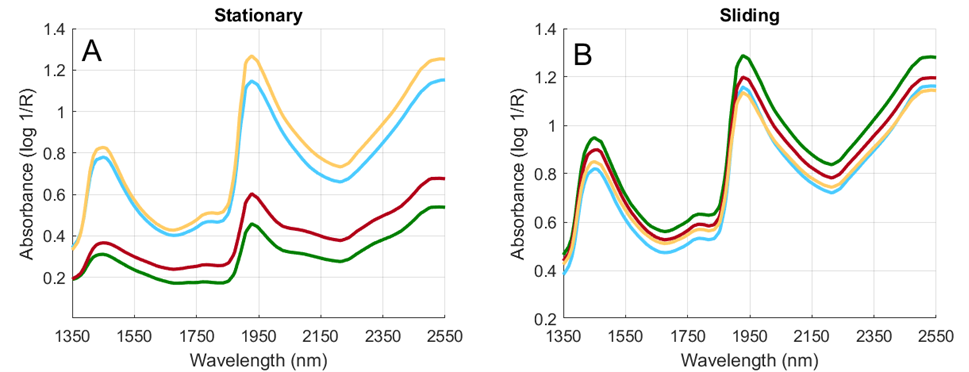
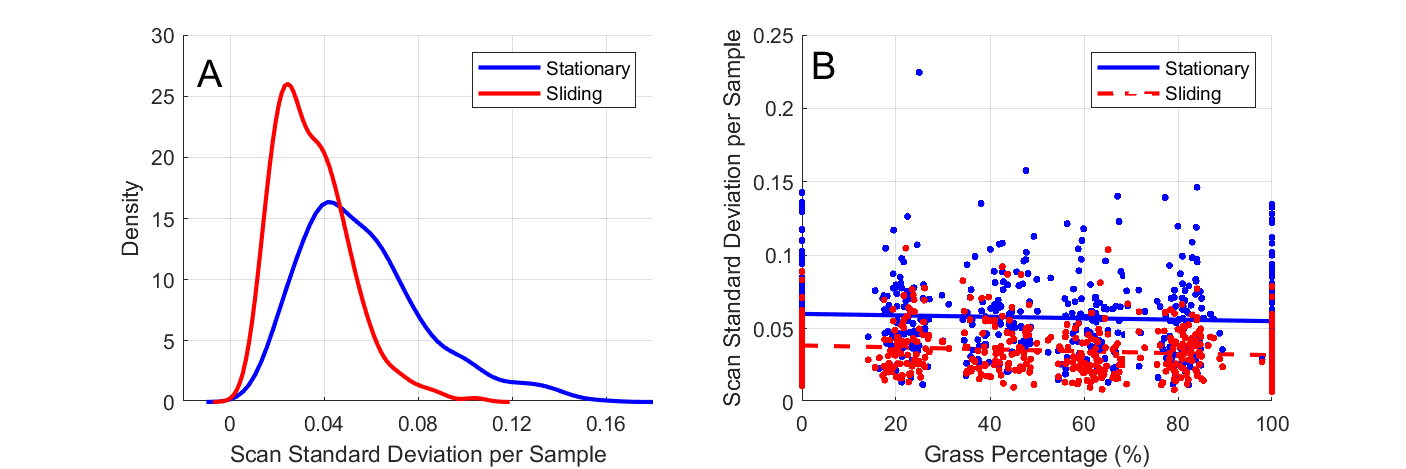
Variability in spectral data of stationary scans was greater than that of sliding scans (Figure 2). After visual inspection of the four repeated scans per sample, scans that had greater than 7 standard deviations were identified and removed (Figure 3). Variability was greater for the stationary scanning technique compared to the sliding method (Figure 3a versus Figure 3b). It is possible that the variability may increase as the proportion of grass increases, due to a wide range in grass species utilized. Figure 3b indicated that this was not the case, and that the sliding scanning technique produced a more robust spectrum of the fresh forage sample.
Visual inspection of the four spectra of samples with the largest standard deviation revealed that three of the four scans were similar with one of the scans out of character. To improve the quality of the data analysis, one scan of the four for the 12 samples with the highest standard deviation was removed. This resulted in a standard deviation of less than seven for all samples. Of the 12 scans removed, 11 were from the stationary scans. The remaining three to four scans per sample were averaged to obtain one spectrum per sample per scanning technique (n=1,068). The two datasets, stationary and sliding, were then both split into calibration (n=400) and validation (n=134) datasets.
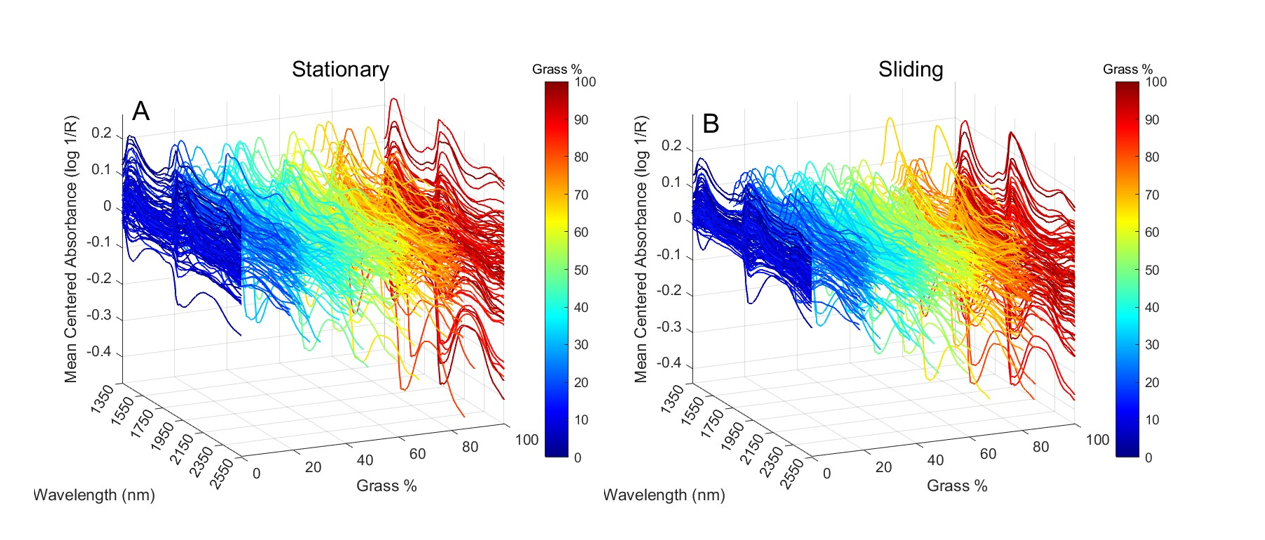
For PLS regression, data are typically mean centered. There was a range of variabilities in sample spectra (Figure 4). Visual inspection of the spectra suggests that the pure alfalfa spectra were usually above a mean centered mass of zero, while the 100% grass spectra were largely below zero, illustrating the capacity of the NIR spectrometer to predict grass % in a grass:alfalfa fresh mix.
b) Partial least squares regression
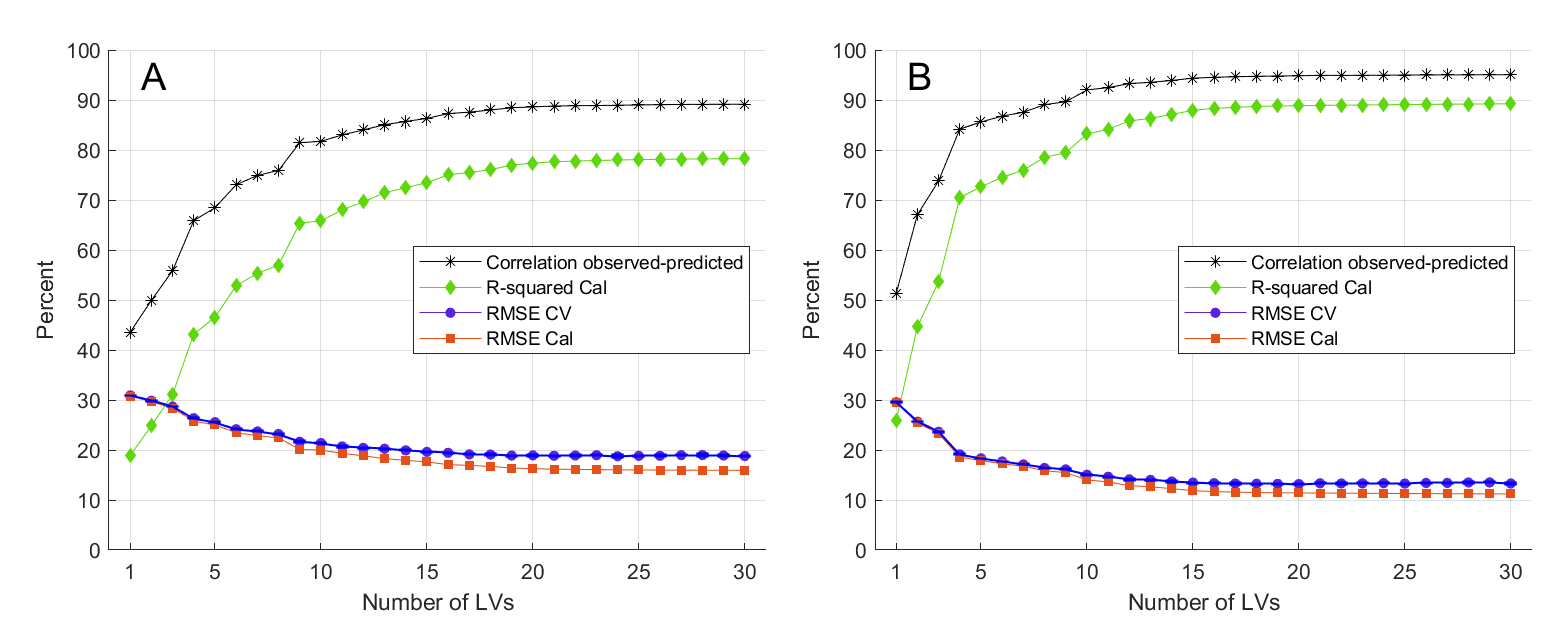
The first step in performing a PLS regression model is to determine the number of LV’s. Cross validation is used to achieve this. Figure 5 shows fit statistics by the number of LV’s for PLS with grass percentage as the dependent variable and mean-centered reflectance as the independent variables. The RMSECV did not increase as the number of LV’s increased through 16, indicating variability in the calibration data was sufficient to permit good performance of the calibration model on the test data (Figure 5). For the sliding scanning technique, the R2 did not indicate a need for more than 15 LV’s to be utilized in the calibration model. Beyond 17 LV’s the difference between the RMSECV and the RMSEC became greater than 20%, which suggested overfitting of the model as described by Eigenvector Research Inc.
c) Calibration and validation performance
Pre-processing methods that resulted in the highest R2 and lowest RMSE was mean centered alone for both calibration and validation datasets (Table 1). Calibration model performance was considered good with an R2 of 88% for both mean-centered and Savitzky-Golay smoothing preprocessing when the sliding scanning technique was used. Model performance was further evaluated on the validation data set (n=134 spectra) and an R2 with MC (R2=0.83) and SG (R2=0.83) was observed when the model was run on the test-set using the sliding scanning technique.
Table 1. Model results for absorbance using the stationary and sliding technique.
|
|
|
Calibration |
|
|
Cross Validation |
|
Prediction |
||||
|
|
|
R2 |
RMSE |
LV |
|
R2 |
RMSE |
|
R2 |
RMSE |
RPD |
|
Stationary |
|
|
|
|
|
|
|
|
|
|
|
|
|
MC |
0.74 |
17.7 |
15 |
|
0.65 |
20.5 |
|
0.69 |
18.6 |
1.8 |
|
|
SG |
0.74 |
17.7 |
15 |
|
0.65 |
20.5 |
|
0.69 |
18.7 |
1.8 |
|
|
D1 |
0.78 |
16.3 |
15 |
|
0.66 |
20.3 |
|
0.71 |
17.8 |
1.9 |
|
Sliding |
|
|
|
|
|
|
|
|
|
|
|
|
|
MC |
0.88 |
11.8 |
15 |
|
0.84 |
13.8 |
|
0.83 |
13.6 |
2.6 |
|
|
SG |
0.88 |
11.8 |
15 |
|
0.84 |
13.8 |
|
0.83 |
13.6 |
2.5 |
|
|
D1 |
0.87 |
12.3 |
15 |
|
0.80 |
15.4 |
|
0.83 |
13.6 |
2.4 |
Note. MC = mean-centering, SG= Mean-centering and Savitzky-Golay smoothing, D1 = Mean-centering with Savitzky-Golay smoothing by first derivative, LV = Latent Variable, RMSE = Root mean squared error, RPD = ratio of performance to deviation, R2 = coefficient of determination between true and predicted values.
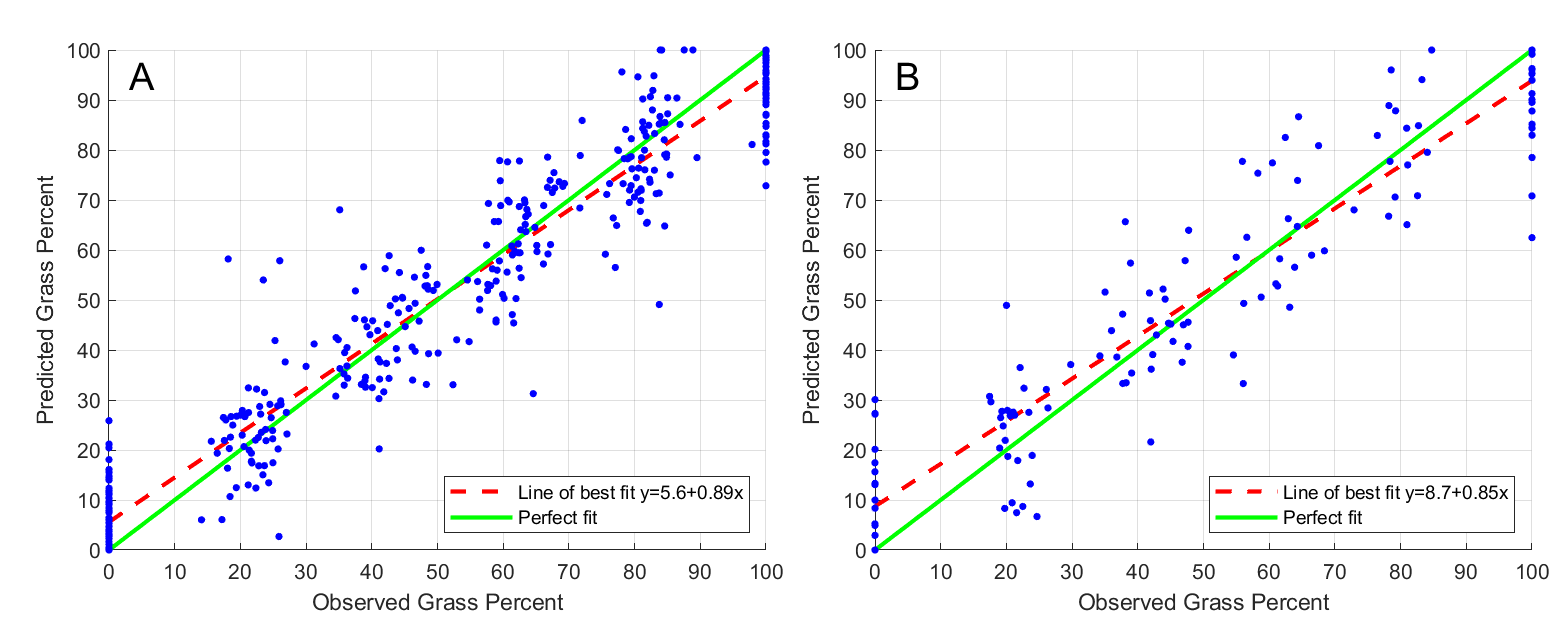
For the sliding calibration dataset, the R2 was 0.88 and 0.83 for the test-set (Table 1). Predicted grass percentages were truncated to sit between 0% and 100% grass percent. The line of best fit was below the perfect fit line for the higher percentages of grass, suggesting that the calibration equation underestimated the grass percentages in mixtures that contained proportionally more grass compared to alfalfa (Figure 6). Similarly, when there was a low percentage of grass in the forage mix, the model overestimated the amount of grass (Figure 6).
Discussion
Calibration development of pure fresh grass and alfalfa samples along with mixed grass:alfalfa material was conducted in this study. Less variability in spectra was observed with the sliding scanning technique, generating average spectra that could more accurately predict grass percentage within a mix of grass:alfalfa forage (Table 1). The model was tested against a test-set separate from the calibration dataset to measure the prediction accuracy of the model to estimate grass inclusion within a grass:alfalfa mix.
Using either scanning technique, transforming the spectra to absorbance produced more accurate grass inclusion predictions than reflectance values (data not shown). The highest accuracy for grass prediction was achieved from spectra collected when the sliding technique was used and when only mean-centering was performed as the preprocessing method (R2 = 0.83, RMSEP = 13.6, RPD = 2.6). For the stationary scanning technique, grass was most accurately predicted when the spectra were preprocessed using mean-centering with SG smoothing by first derivative (R2 = 0.71, RPD = 1.9). The highest RPD score was achieved for the sliding scanning technique when mean-centering was performed and according to Williams et al. (2019), interpretation of the RPD can be classified as ‘fair’ where the degree of model application was categorized as ‘screening’. For the stationary scanning technique, the highest RPD score using mean-centering with SG smoothing by first derivative was considered ‘very poor’ where model application is not recommended.
No previous research has been published on the estimation of the percentage of grass within a fresh mixed grass:alfalfa sample using hand-held NIRS technology. However, this technology has been applied to predicting the nutritive value of fresh dryland pastures in Portugal under low grazing intensity, specifically neutral detergent fiber and crude protein (Carreira et al., 2021). Additionally, Murphy et al. (2022) evaluated fresh forages in Ireland where they developed NIRS calibrations of the dry matter and crude protein content of fresh perennial ryegrass in which they achieved an R2 of 0.86 for dry matter prediction and 0.84 for crude protein prediction. Fresh grass samples for that study were from a single variety of perennial ryegrass grown on a research facility and a benchtop spectrometer was used, likely explaining the high predictive power achieved. Hand held NIR spectrometers are subject to several sources of variability that are not associated with benchtop spectrometers (Gorla et al., 2022).
Thomson et al. (2022) evaluated the efficacy of four different hand-held NIR spectrometers on fresh ryegrass pasture samples for the purposes of estimating dry matter content and other nutritive components. The NeoSpectra spectrometer was one of four hand-held NIR spectrometers that scanned 145 pasture samples. Evaluation of their independent validation model for the NeoSpectra resulted in an R2 of 0.63 for dry matter prediction. The best performing hand-held NIR spectrometer was Specim IQ (Specim; Oulu, Finland), that produced slightly higher predictive values (Thomson et al., 2022). A predictive precision over 83% when using the sliding scanning technique, suggested that the calibration equation compared favorably when estimating grass percentage in grass:alfalfa mixtures in the present study.
Previously published studies investigating the use of hand-held NIR spectrometers in the agricultural industry have used stationary or sliding scanning techniques of forage or vegetable material (Berzaghi et al., 2021; Borba et al., 2021; Cherney et al., 2021b; Digman et al., 2021; Digman et al., 2022a; Digman & Runge, 2022b; Feng et al., 2023; Rukundo et al., 2020), but none directly compared the two methods on fresh grass-alfalfa forage mixtures. One comparative study of scanning technique concentrated on the amount of time spent scanning and concluded that five seconds was adequate (Gorla et al., 2022). Recently, a study conducted on fresh silage samples compared the accuracy of using either the stationary or sliding scanning technique and concluded that the sliding method more accurately predicted various forage constituents with higher R2 values (Feng et al., 2023).
Practical implications range from optimizing field management to reducing variability in dairy rations (Cherney et al., 2021a). Visual inspection has been the standard to estimate forage composition and this research demonstrated the functionality and feasibility of hand-held NIR spectrometers, offering real-time evaluation of forage composition that is rapid and cost-effective. This study was comparatively large (n=534) and included many grass species: tall fescue, meadow fescue, orchardgrass, reed canarygrass, smooth brome grass, quackgrass, and timothy, sampled over two growing seasons. This research has demonstrated that hand-held NIR technology can assist producers to estimate grass percentage in grass:alfalfa fresh forage mixtures.
- Hand-held NIR spectrometers show promise for estimating grass proportion in fresh alfalfa:grass forage mixtures.
- A sliding scan technique results in improved grass proportion predictions in alfalfa:grass mixtures.
- On-farm NIRS analysis of forage crops has the potential to optimize nutrient management on dairy farms
Our study is the first to estimate the percentage of grass in a fresh grass:alfalfa mixture using hand-held NIR devices. Compared to similar studies also using handheld NIR devices to analyze forages, our sample size was large (n=534) and may have contributed to the relatively high correlation between the observed and predicted grass percentage using the sliding scanning technique.
Practical implications from this research include providing producers and nutritionists with tools to accurately record forage stand composition. This serves to improve the ability for alfalfa-grass producers to optimize field management and reduce variability in dairy rations, resulting in more environmentally and economically sustainable farming systems. Previously producers have had to rely on visual inspection to estimate forage composition and this research demonstrates the functionality and feasibility of on-farm hand-held NIRS devices offers the opportunity for real-time evaluation of forage composition that are rapid and cost-effective.
Education & outreach activities and participation summary
Participation summary:
- A reserach manuscript was submitted to the Crop Science Journal
- Outreach presentations:
- ASA-CSSA-SSSA: International Annual Meeting - American Society of Agronomy, Crop Science Society Of America, Soil Science Society Of America (Nov 6 - 9, 2022)
- Cornell Nutrition Conference (October 2022)
- Northeast Agribusiness and CCA advanced training, 2021 & 2022
- Northeast Organic Farmers Association Conference, 2022
- Outreach publications:
- Interpretative publications based on the research results will be developed and published as two traditional “fact sheets”.
- We will also develop popular press articles for national distribution in magazines (Progressive Forage, Hay & Forage Grower, Hoard’s Dairyman, Cornell's The Manager).
- Post results on a well-established forage crop website, www.forages.org.
Project Outcomes
Agriculture sustainability has been the motivation behind this research whereby improving the ability for alfalfa-grass producers to optimize field management and reduce variability in dairy rations, resulting in more environmentally and economically sustainable farming systems. Harvest management and rotation of alfalfa-grass stands is often a function of the grass percentage of the mixture, and an on-farm NIR instrument can provide a record of stand composition, required for correct nutrient management decisions. This work provides the research needed urgently in the agricultural industry for farmers and farm consultants; independent research data on the functionality and feasibility of on-farm hand-held NIRS instruments.
With low milk prices in recent years, it is becoming increasingly challenging to meet cash flow demands within dairy systems. Therefore, cost-effective practices are essential for economic success and utilizing home-grown forages plays a significant role as a key strategy to help reduce feed costs, improve profitability, maintain herd health, and support overall environmental farm sustainability. On-farm assessment of estimating grass content in mixtures can result in both the production of higher quality forage and in improved day-to-day management of dairy rations. Forage use in ruminant diets has always been important but increasing concerns over environmental issues and economic sustainability have made prediction of forage quality an increasingly important part of dairy management. Hand-held NIR instruments have the potential to provide rapid and accurate compositional real-time feedback to the user and this research is the first to develop calibration models to predict alfalfa-grass proportions in fresh forage mixtures.
Agricultural sustainability has always been the motivation behind this research and continues to be an essential element behind our research endeavors. Agricultural sustainability is a critical aspect of ensuring the long-term viability of our food production systems while minimizing negative impacts on the environment and communities. We will continue advancing the knowledge and practices that can have a positive impact on both current and future generations.
Personally, my journey as a Cornell graduate student has come to an end and I look forward to combining my passion for research and teaching in the field of sustainable agriculture. My goal is to work towards supporting sustainable farming systems whilst simultaneously developing my teaching skillset and sharing my expertise to inspire the next generation of researchers and innovators. I hope to find an extension position within the academic community where I’ll have the opportunity to work with producers and communicate the science being produced in the lab and bring it to the field where the insights learned can be applied and implemented on farms. Ultimately, my ambition is to work towards improving the welfare and economic performance of farmed animals, while at the same time minimizing the effects on the environment. This is critical for future farmers and for society, and it’s a real challenge to get these three aspects working together.
NA