Final report for GNE21-274
Project Information
Thinning is an important routine for apple growers to manage crop load and improve fruit quality, which can be accomplished through manual, chemical, or mechanical manipulation of flowers and fruitlets. Traditionally, blossom thinning relies on human experts’ visual evaluation of flower load, a leading indicator of crop load, which can be imprecise and prone to errors. This study aimed to develop an apple blossom density mapping algorithm utilizing point clouds reconstructed through unmanned aerial vehicle (UAV)-based red-green-blue (RGB) imagery and photogrammetry. The algorithm was based on grid average downsampling and white color thresholding, and was able to generate top-view blossom density maps of user-defined tree height regions. A preliminary field experiment was carried out to evaluate the algorithm accuracy using manual blossom counts of apple tree row sections as ground truths, and a coefficient of determination (R2) of 0.85, a root mean square error (RMSE) of 1307, and a normalized RMSE (NRMSE) of 9.02% were achieved. The algorithm was utilized to monitor the blooming of the apple tree rows and was demonstrated to effectively show blossom density variations between different tree rows and dates. The study results suggested the potential of UAVs as a convenient tool in assisting precise blossom thinning in apple orchards, while future research should further investigate the reliability of photogrammetry techniques under different image qualities and flight settings as well as the influence of blossom distribution on algorithm accuracy.
The overall goal of the project is to develop a point cloud processing and mapping algorithm that can assist farmers in the decision-making of precise blossom thinning by allowing convenient blossom density estimation and direct orchard blossom density visualization with drone technology. Specifically, the project objectives include:
1. Develop a top-view apple blossom density mapping algorithm with definable tree height regions, utilizing orchard point clouds reconstructed with UAV-based RGB images and photogrammetry software.
2. Evaluate the developed mapping algorithm accuracy in terms of blossom counts.
3. Apply the developed mapping algorithm to monitor the blossom density of an apple orchard.
Apple (Malus domestica) is one of the most valuable and culturally significant fruits worldwide (Spengler 2019). For the crop year 2021/2022, global apple production was forecasted to be 81.6 million tons (USDA Foreign Agricultural Service 2022). In the United States, more than 5,000 farms with almost 85,000 acres of apples are located in the northeastern region, and more than 200,000 tons of apples can be produced in Pennsylvania per year (Crassweller et al. 2016). Although apple has been a domesticated crop for thousands of years (Spengler 2019), challenges still exist in fruit production management. For example, apple trees tend to overproduce flowers, which can grow into fruits with inadequate sizes and less marketable values due to insufficient resource allocation. Following the years with large yields of small sized fruits, certain apple varieties usually have low or even no yields in the following years, which is known as the alternate bearing or biennial bearing phenomenon (Guitton et al. 2012). In order to achieve stable production of apples with high quality year after year, human interventions are needed for trees to have a balanced ratio between canopy photosynthesis and fruit load (Pflanz et al. 2016).
Thinning is a crucial crop load management practice for growers to increase fruit size and quality (Link 2000), suppress alternate bearing for consistent yields over the years, and reduce tree limb breakage (Pflanz et al. 2016). Current fruit tree thinning methods include manual, chemical, and mechanical thinning. Manual or hand thinning is a labor-intensive and time-consuming process, during which fruitlets are manually removed typically after the physiological fruit drop based on their size and proximity to one another (Farjon et al. 2020). High demand for manpower and reduced thinning benefit due to late execution time are the two major drawbacks of manual thinning (Farjon et al. 2020). During chemical thinning, chemical substances are sprayed onto trees at one or more dates to prevent flower pollination or fertilization, or stimulate fruitlet drop (Kolarič 2010). The efficacy of chemical thinning can be influenced by many factors such as cultivar, rootstock, pollen density, weather, thinner chemistry, and application method, rate, and timing (“Apple Chemical Thinning” n.d.), while predictive models such as the pollen tube growth model (K. S. Yoder et al. 2013), carbohydrate model (Lakso et al. 2002), and fruitlet growth model (Greene et al. 2013) have been proposed and utilized to achieve more precise thinner applications. Despite early blossom thinning having the greatest potential in improving fruit size, quality, and color at harvest and promoting return blooming (K. Yoder et al. 2009), the unpredictability of chemical thinning has been an issue for apple growers for more than 50 years (Robinson and Lakso 2011). Mechanical thinning works by physically removing a portion of flowers or fruitlets using mechanical devices such as spinning rotors attached with wires. It has the advantage of having no chemical impact to environments and lower thinning time and cost, and being less restricted by weather compared to manual and chemical thinning. Various mechanical thinning devices have been developed and evaluated in apple orchards in previous studies (Basak et al. 2016; Kon and Schupp 2018; Schupp et al. 2008), although, currently they are non-selective and may impart damage to flowers, branches, and leaves.
Tree blooming intensity or the percentage of open blooms often needs to be estimated for blossom thinning planning, such as the timing of chemical thinning or the strength of mechanical thinning (Kon and Schupp 2018). Human experts usually estimate this visually, which can be inaccurate and imprecise as typically only a limited number of trees are inspected (Farjon et al. 2020). Among the many instruments employed in precision agriculture (Delavarpour et al. 2021; Nowak 2021), unmanned aerial vehicles (UAVs) are considered as an essential future technology (Tsouros, Triantafyllou, et al. 2019) and show great potential in rapid, flexible plant data collection with high spatiotemporal resolution. Applications of UAVs in agricultural studies include vegetation growth and health monitoring, yield estimation, pest management, irrigation management, and crop spraying (Delavarpour et al. 2021). Along with machine learning and vegetation index calculation, photogrammetry is a technique that is commonly employed for processing UAV imagery (Tsouros, Bibi, et al. 2019). Unlike expensive active sensors such as LiDARs (Koenig et al. 2015), ToF cameras (Park et al. 2011) and ultrasound systems (Gee et al. 2003), passive photogrammetry algorithms such as structure from motion (SfM) (Armstrong et al. 1994; Pollefeys et al. 1998) and multi-view stereo (MVS) (Seitz et al. 2006) can recover 3D structures and create refined 3D models of stationary scenes from overlapping images taken by inexpensive visual sensors such as red-green-blue (RGB) cameras. With the growing research interests in UAV applications in agriculture, advanced commercial photogrammetry software has become a standard drone mapping tool to assist researchers in areas such as crop structural parameter estimation (Johansen et al. 2018), multispectral crop surveying (Mesas-Carrascosa et al. 2015), and crop health monitoring (Dehkordi et al. 2020). In terms of apple blossom density estimation, the combination of UAV, photogrammetry and proper data processing algorithm can potentially not only allow farmers to monitor large-scale orchards conveniently with precision, but also eliminate the need for trained human laborers to evaluate blooming intensity of trees when foreign labor supply to farms in US is declining (Taylor et al. 2012).
Regarding apple blossom detection and counting using modern technology for accurate thinning or yield prediction, several studies can be found in current literature. Aside from commonly deployed RGB cameras (Braun et al. 2018; Dias et al. 2018a, 2018b; Farjon et al. 2020; Hočevar et al. 2014; Tian et al. 2020; Tubau Comas et al. 2019; X. (Annie) Wang et al. 2020; X. A. Wang et al. 2021; Wu et al. 2020), multispectral cameras have also been utilized for identifying apple flowers (C. Xiao et al. 2014). Variations of data collection methods among the studies exist. Manually capturing apple blossom images with handheld cameras (Dias et al. 2018b, 2018a; Tian et al. 2020; Wu et al. 2020) ensures high image quality, however it is also the most laborious and least efficient method. Ground mobile units such as utility vehicles and tractors were used in many studies (Braun et al. 2018; Dias et al. 2018b; Hočevar et al. 2014; X. (Annie) Wang et al. 2020; X. A. Wang et al. 2021) as the platform for mounting cameras, artificial lights, and GPS receivers, and side-view images were taken automatically while the mobile units moved along apple tree rows. Compared to manual image capturing, ground vehicles offer a higher level of autonomy and efficiency. Yet, the work involved in developing the specialized carts, mounting structures and sensor controlling programs, and keeping the platforms moving in a slow, steady manner through driving or remote controlling may prevent growers from adopting this method for managing their large orchards. As the most efficient and user-friendly method, UAVs have been applied in research to capture top-view apple blossom images (Tubau Comas et al. 2019; C. Xiao et al. 2014; Yuan and Choi 2021). However, some of the unique challenges during UAV data collection include weather limitations (e.g., wind, rain), inconsistent image quality due to tree movement, and fewer image details due to high flight altitudes. Nonetheless, when weather allows, commercial miniature UAVs that are robust and economical demonstrate much potential in being employed by growers for orchard management (Apolo-Apolo et al. 2020; Dong et al. 2021; Liu et al. 2021; Valente et al. 2019; C. Wang et al. 2022; D. Xiao et al. 2022; Yuan and Choi 2021).
Among the reviewed studies, computer vision-based image analysis techniques were commonly utilized for apple blossom identification, from simple but effective color segmentation (Braun et al. 2018; Hočevar et al. 2014; Tubau Comas et al. 2019) to popular convolutional neural network (CNN)-based object detection (Dias et al. 2018a, 2018b; Farjon et al. 2020; Tian et al. 2020; X. (Annie) Wang et al. 2020; X. A. Wang et al. 2021; Wu et al. 2020; Yuan and Choi 2021). Yet, an attempt to explore point cloud-based apple blossom density estimation is missing in current literature. Three-dimensional point clouds by nature store more comprehensive information, such as volume, than images and they suffer less from issues such as object occlusion since images used for point cloud reconstruction are captured from different camera positions. From the perspective of growers, deep learning methods require much manual work for image annotation and high-level understanding in model training and tuning, which makes research-level CNN algorithms potentially less practical and desirable than color thresholding techniques that are simple to understand and modify.
Research
The Proposed Mapping Algorithm
The mapping algorithm was coded in MATLAB R2021a (MathWorks, Natick, MA).
Sample Data Collection and Point Cloud Generation
For illustration purposes, a set of sample RGB images of a blooming apple orchard were captured using a DJI Matrice 200 V2 (Shenzhen, China) equipped with a DJI Zenmuse XT2 on May 1, 2021. The apple orchard was located at Russell E. Larson Agricultural Research Center, Pennsylvania Furnace, Pennsylvania, USA (40.707918° N, 77.954370° W), which consisted of four tree rows and two apple cultivars including Jonagold and Daybreak Fuji. The orchard dimension was roughly 25 m × 15 m. An autonomous UAV flight was conducted using DJI GS Pro with a preplanned flight path (Fig. 1a). The flight altitude was set at 15 m and the UAV speed was set at 1 m/s. Images of the apple orchard were captured every second with a 40° camera pitch, resulting in roughly a 90% overlap between consecutively collected images. The image dataset contained in total 274 images with a 4000 × 3000 resolution. PIX4Dmapper (Prilly, Switzerland), a commercial photogrammetry software, was used to reconstruct orchard point cloud model with the image dataset (Fig. 1b). Each point within the point cloud contains location (easting, northing, elevation) and color (red, green, blue) information.

Fig. 1. The apple orchard where sample RGB image data were collected: (a) the flight path of the UAV flight mission; (b) the reconstructed apple orchard point cloud using the sample dataset.
Terrain Map Generation
As apple orchards might be located in mountainous regions, terrain unevenness or elevation difference within orchards should be accounted for when the mapping algorithm needs to allow users to define desired tree height regions. A terrain map that contains the elevation information within an orchard can help adjust an orchard point cloud model into one with perfectly flat ground.
Point Cloud Downsampling
A raw point cloud reconstructed by photogrammetry techniques typically contains a large number of points and can be extremely slow to process using average computers. For example, the sample apple orchard point cloud model (Fig. 1b) consisted of more than 200 million points. Meanwhile, converting point clouds into maps is a process of losing information, or getting rid of unnecessary information as image pixel numbers are limited. Therefore, a downsampling procedure is necessary to improve the efficiency of the mapping algorithm. A grid-averaging approach is employed in the mapping algorithm, which is essentially the same as point cloud voxelization where points within a moving grid filter with a predefined size are merged into one. Fig. 2 shows an example of the sample point cloud being downsampled by a 1 m × 1 m × 1 m terrain grid filter. The terrain grid filter size is an important parameter that determines the spatial resolutions of final terrain maps as well as final blossom density maps. For instance, a 1 m terrain grid filer size will lead to a 1 m per pixel spatial resolution in the maps. Generally, a large grid filter size is recommended for generating a smooth terrain map.

Fig. 2. A top view example of the downsampling process for the raw orchard point cloud by a 1 m × 1 m × 1 m terrain grid filter: (a) before downsampling; (b) after downsampling.
Height Map Generation
To generate a terrain map, ground surface objects with substantial heights such as apple trees and wood posts need to be identified and removed. The principle of identifying apple trees in the mapping algorithm is by locating downsampled “unit regions” with in-unit maximum point elevation differences exceeding a predefined threshold. For example, in Fig. 2b, each point represents a 1 m × 1 m downsampled unit region, which typically contains multiple points with identical eastings and northings but different elevations. Unit regions where apple trees are located generally have larger in-unit point elevation variations than those only containing ground points, since an apple tree can be as tall as a few meters while the height of grasses on the ground is in the magnitude of tens of centimeters.
Given a downsampled orchard point cloud, a maximum height map, a minimum height map, and a height difference map are generated. The maximum and minimum height maps are created by a two-step process. First, “empty” height images or 2D arrays, whose dimensions are determined by the numbers of unique eastings and northings in the downsampled point cloud, are initialized. In the height images, the center of each row of pixels represents a constant northing, and the center of each column of pixels represents a constant easting. Second, mapping the heights of the highest and lowest points within each unit region into the empty height images based on the eastings and northings accordingly (Fig. 3a, 3b). The height difference map is calculated by subtracting the minimum height map from the maximum height map, which contains in-unit maximum point elevation difference information (Fig. 3c). A tree mask is generated by thresholding the height difference map to remove the apple trees, and a 0.3 m threshold was adopted in the mapping algorithm (Fig. 3d). Note the example minimum height map (Fig. 3b) is very close to a terrain map, because the apple tree canopies were not dense and low enough such that the ground below the tree canopies cannot be observed by the camera during data collection, hence the ground points below the apple trees could still be reconstructed. The height difference map is necessary for removing ground surface objects that fully occlude ground, such as a crate that would appear as abnormally bright pixels in the minimum height map.

Fig. 3. Example height maps and tree mask derived from the downsampled orchard point cloud by a 0.1 m × 0.1 m × 0.1 m terrain grid filter: (a) maximum height map; (b) minimum height map; (c) height difference map; (d) tree mask.
Terrain Map Interpolation and Smoothing
The base of a terrain map is the minimum height map (Fig. 3b) masked by the tree mask (Fig. 3d). To fill in the empty pixels, whose values are either removed by the tree mask or never assigned, a customized linear interpolation-based approach is used in the mapping algorithm. Denoting an empty pixel value as 0, a base terrain map in the interpolation process is interpolated horizontally and vertically, in total twice (Fig. 4). Regardless of the interpolation direction, given a row or column of pixel values, an empty pixel or a series of connected empty pixels having non-zero neighbors on both sides are linearly interpolated (Fig. 4). Since certain empty pixels can only be interpolated in one of the interpolation directions, the final interpolated terrain map is generated by “selectively averaging” the horizontally and vertically interpolated terrain maps. For the interpolated pixels that only exist in the horizontally or vertically interpolated terrain map, their values are preserved in the final interpolated terrain map. For the interpolated pixels that exist in both horizontally and vertically interpolated terrain maps, their values from the two maps are averaged and then used in the final interpolated terrain map (Fig. 4). The overall interpolation process is repeated twice to create a terrain map without disconnected components and concave regions.

Fig. 4. Illustration of the terrain map interpolation process using a randomly generated image. Yellow regions highlight the empty pixels that can potentially be interpolated.
An optional final step of terrain map generation is smoothing, which can help reduce high frequency image noise if present. A standard image averaging filter is used in the mapping algorithm, while a Gaussian smoothing filter would work equally fine. The averaging filter has an odd size, which is user-definable. When empty pixels are present within the filter, the filter ignores them and computes the average value of non-empty pixels. Considering the terrain map is created based on a downsampled point cloud having only a limited number of unique point elevation values, a smoothing operation is not essential for the mapping algorithm. Fig. 5 shows a few examples of the final terrain maps created using the sample orchard point cloud downsampled by terrain grid filters with different sizes. Note a smaller grid filter size leads to more refined terrain maps.

Fig. 5. Example smoothed terrain maps of the sample orchard point cloud generated using different terrain grid filters. The maps were smoothed by a 3.3 m × 3.3 m averaging filter.
Blossom Point Cloud Extraction and Downsampling
To generate a blossom density map, the identification of blossom points from a reconstructed orchard point cloud is essential. Utilizing the white color feature of apple blossoms, a color thresholding approach is used in the mapping algorithm to extract blossom point clouds. RGB values of the raw orchard point cloud (Fig. 1b) are first converted into hue-saturation-intensity (HSI) values, which range from 0 to 1. Since white colors can be represented by either low saturation values or high intensity values, white blossom points are extracted by applying a threshold as the upper limit for S channel and 1 minus the threshold as the lower limit for I channel (Fig. 6a). The optimal threshold level was explored in the field experiment. As fallen petals on the ground and highly reflective surfaces also have white colors and will be extracted as part of the blossom point cloud, a simple height thresholding is utilized to eliminate the noisy points. Before that, the elevation values of the blossom point cloud need to be first adjusted by the terrain map, as apple trees can grow on hills with substantial slopes and an elevation threshold will simply not work for such scenarios. Based on the easting and northing information, the terrain map pixel that contains a given blossom point can be located, and the elevation value of the pixel is then subtracted from the blossom point elevation value to calculate the point’s above-ground height. After all blossom point elevations are adjusted, a 0.3 m height threshold is applied to remove the noisy white points (Fig. 6b).

Fig. 6. Blossom point cloud extraction from the sample orchard point cloud: (a) raw blossom point cloud extracted using white color thresholding; (b) height-adjusted, noise-removed, downsampled blossom point cloud.
The estimation of apple blossom count or density in the mapping algorithm is based on the presumption that downsampled blossom point numbers and actual blossom numbers in orchards are positively correlated. However, depending on object location, point clouds reconstructed by photogrammetry techniques can have vastly different local point cloud densities. For example, an apple blossom that is at the top of a tree canopy and well observed by many images may have a very dense reconstructed point cloud, while an apple blossom that is hidden inside a tree canopy and can be barely seen in images may only have a few points being reconstructed. The purpose of blossom point cloud downsampling is to unify point cloud density so that regardless of the reconstructed point cloud quality, a downsampled white point always represents a certain volume of space, hence a certain number of blossoms (Fig. 7). The donwsampling procedure for the blossom point cloud is identical to that for the raw reconstructed orchard point cloud (Fig. 2) except for the grid filter size, and the optimal blossom grid filter size was investigated in the field experiment.
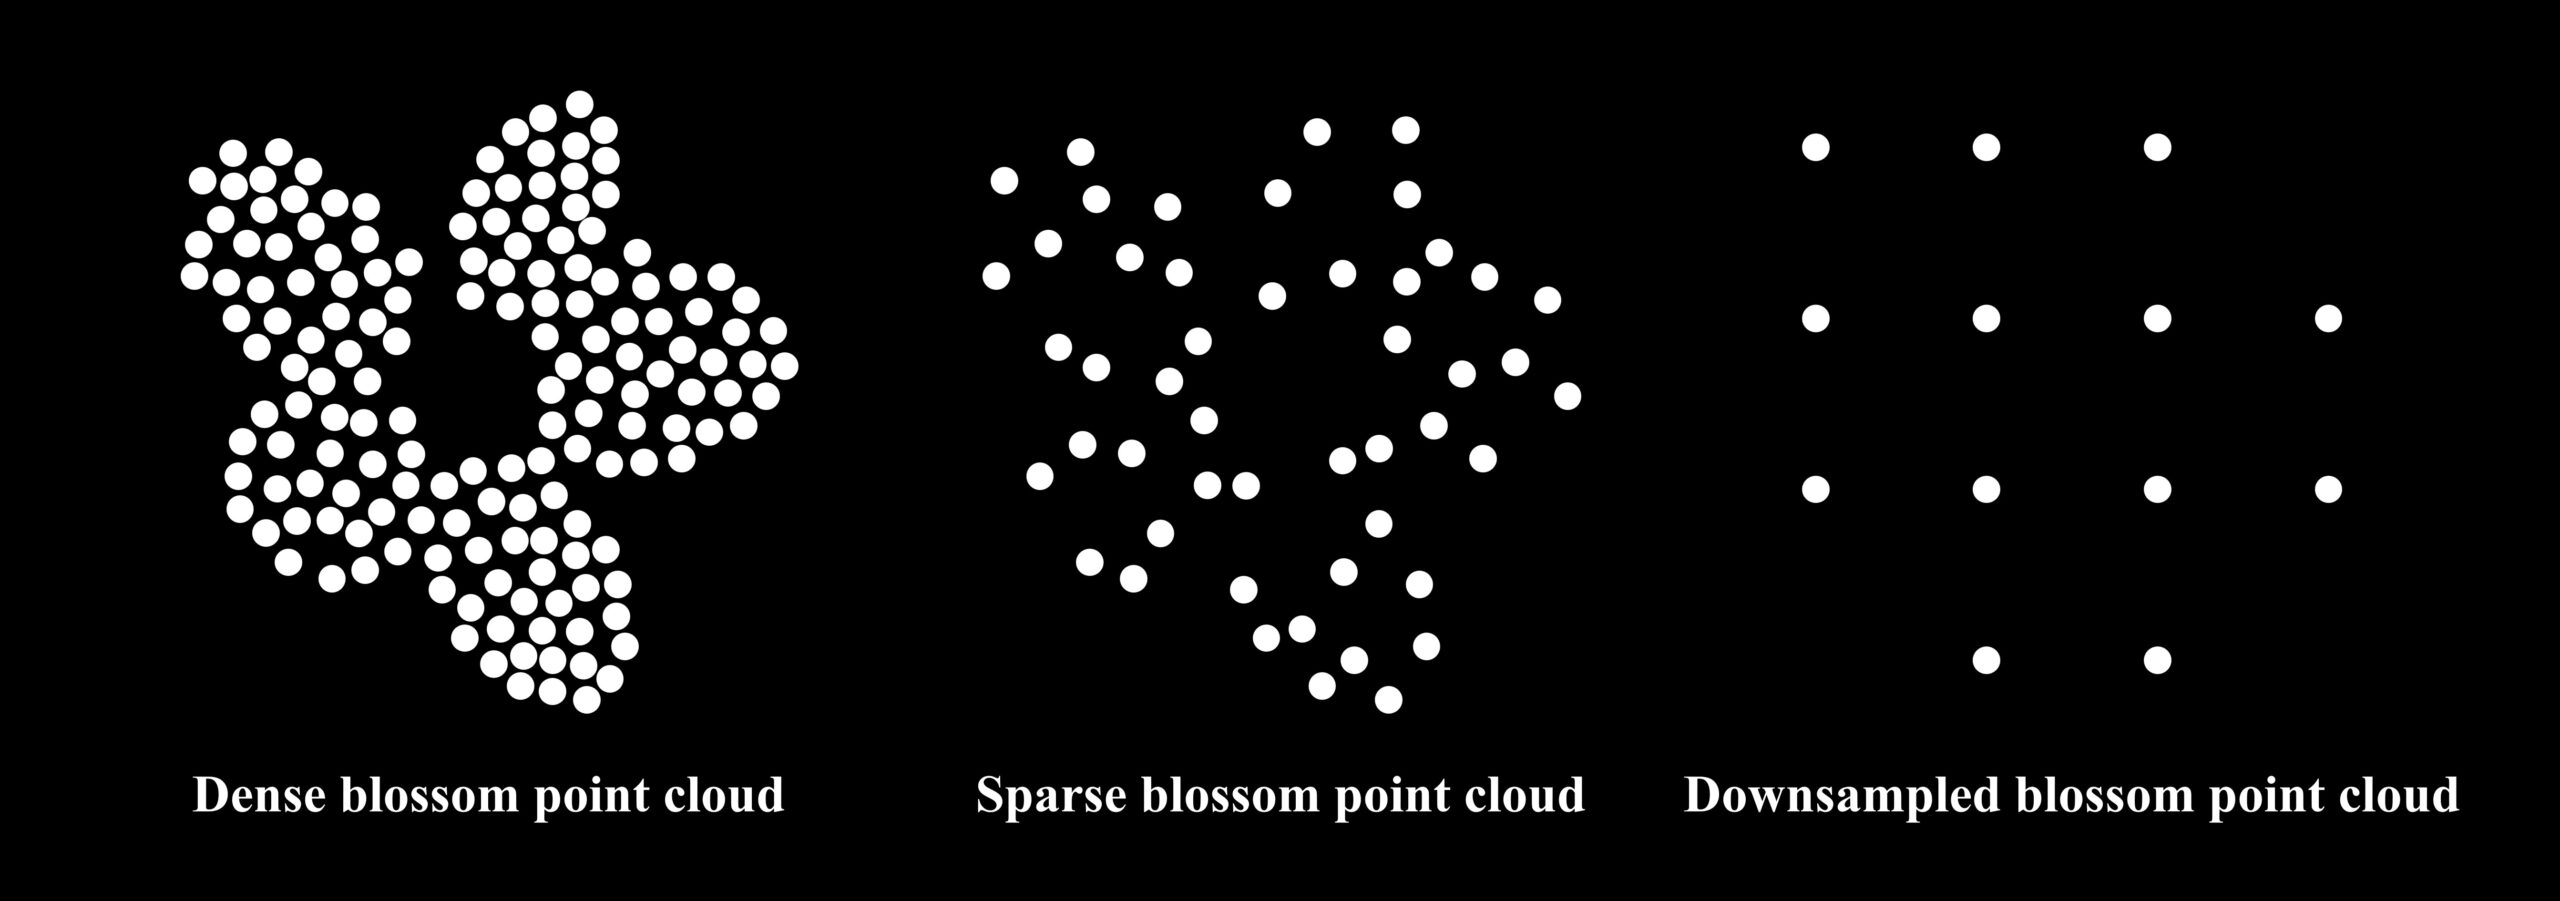
Fig. 7. Graphic illustration showing densely and sparsely reconstructed point clouds of the same apple blossom being downsampled to the same number of points.
User-Defined Tree Height Region
One of the mapping algorithm’s features is being able to generate blossom density maps of a user-defined tree height region, which gives growers the freedom to precisely manage blossom thinning not only at different locations, but also at different tree heights. This can be helpful when blossom densities at different apple tree heights vary substantially. After users input the maximum and minimum heights of the desired tree height regions, two height thresholds are applied to the height-adjusted downsampled blossom point cloud to remove blossom points outside the desired tree height regions.
Blossom Density Map Generation
Blossom Containing Volume Map Generation
Blossom density can be calculated as the ratio between the number of blossoms and the volume of space containing the blossoms. The number of blossoms in a unit region can be represented by the number of downsampled blossom points in the unit region as mentioned above. The relationship between downsampled blossom point numbers and actual blossom counts were studied in the field experiment. Considering trees in modern apple orchards are often planted in rows, which can be wall-shaped due to the adopted training systems (“Apple Training Systems - Cookbook Guidelines” 2017), for simplicity, all unit regions belonging to the same apple tree row are assumed to have the same blossom containing height in the downsampled orchard point cloud. The blossom containing height range of a tree row is calculated as the difference between its maximum and minimum blossom point heights (Fig. 8), and the blossom containing volume of a unit region is calculated as squared terrain grid filter size times the blossom containing height range (e.g., 0.1 m × 0.1 m × 1.5 m = 0.015 m3).

Fig. 8. Schematic diagram showing the calculation of blossom containing height range of a downsampled tree row point cloud from a side view.
A blossom mask is generated by first initializing an empty image with the same size as the terrain map and changing a pixel’s value from 0 to 1 when a blossom point is found within the pixel’s unit region (Fig. 9a). A morphological closing is then applied onto the blossom mask to form complete tree row regions containing blossom points, and the mask is also cleaned up by removing connected pixel components with small sizes (Fig. 9b). When the terrain grid filter size is 0.1 m × 0.1 m × 0.1 m, a 100 connected pixel threshold is used in the mapping algorithm. Note for larger terrain grid filter sizes, a smaller connected pixel threshold should be used for mask cleaning as each pixel represents a larger unit region. For each tree row, or each disconnected component in the blossom mask after mask cleaning, the maximum and minimum height values of the blossom points belonging to the tree row are used to calculate the blossom containing height range. The blossom containing volumes of different tree rows are conveniently calculated by multiplying their blossom containing height ranges with squared terrain grid filter size (Fig. 9c). Generally, when apple cultivars have similar heights or user-specified tree height regions are narrow, no apparent difference will exist between blossom containing volumes of different tree rows in a blossom containing volume map.

Fig. 9. The blossom containing volume map generation process using the sample blossom point cloud downsampled by a 0.1 m × 0.1 m × 0.1 m blossom grid filter: (a) raw blossom mask; (b) closed, cleaned blossom mask; (c) blossom containing volume map.
Blossom Count and Density Calculation
Using the same principle as blossom mask generation, a blossom count map is generated by first initializing an empty image with the same size as the terrain map, and then for every downsampled blossom point that is found within a pixel’s unit region, increase the pixel value by 1. After obtaining the total blossom point count within a pixel, multiply the count by an empirically determined factor to calculate the estimated blossom count. The optimal factor value was explored in the field experiment. The final blossom density map is calculated as the ratio between the blossom count map and the blossom containing volume map (Fig. 10).

Fig. 10. Example blossom density maps of the sample orchard point cloud at different tree height regions generated with a 0.1 m × 0.1 m × 0.1 m terrain grid filter.
Preliminary Field Experiment
The purpose of conducting a field experiment in an apple orchard was to determine the optimal white color threshold for blossom points, the ideal blossom grid filter size for donwsampling blossom point clouds, and the relationship between the number of downsampled blossom points and the number of actual blossoms. However, it is beyond the scope of the study to do a thorough field examination of the blossom density mapping algorithm in terms of its accuracy and reliability against various factors. Rather, the results of the field experiment serve as a feasibility assessment of the proposed algorithm.
Data Collection
The field experiment was conducted in an apple orchard at Russell E. Larson Agricultural Research Center (40.708756° N, 77.953668° W), which was different from the one where the sample RGB data were collected. The new orchard was intentionally chosen to indirectly test the generalizability of the proposed mapping algorithm. The new apple orchard consisted of eight rows of trees and five cultivars including Gibson Golden Delicious, Spur Red Delicious, Jonamac, Jonagold, and Ace Spur Red Delicious. The orchard was roughly 70 m long and 20 m wide.
To calibrate the relationship between downsampled blossom point number and blossom count, each of the eight tree rows was divided into three sections, including a 10 m section, a 20 m section, and a 40 m section, and in total 24 tree row sections were utilized for ground truthing. Tarp strips were prepared and placed across the orchard to mark the tree row sections (Fig. 11a), which could be easily observed by UAV during data collection. On May 3, 2022, when most of the apple trees were either at or approaching peak bloom, manual blossom counts of the 24 tree row sections were collected. During the blossom counting process, two people were required and each person only counted one side of the tree row sections (Fig. 11b). As the transition of apple flower buds between different growth stages is gradual, it is difficult to clearly define a set of objective rules to quickly determine whether a flower bud is at bloom stage or not, especially when blossom distribution is very dense. To facilitate efficient blossom counting, the general rule that was adopted during the manual blossom counting process was to classify a flower bud or a cluster of flower buds as flowers when they have substantial sizes and white colors to be easily recognized as flowers. Pinkish blossoms, small, unopened blossoms, and wilted blossoms with shrunken sizes were not counted during the field experiment.

Fig. 11. Illustration of manual apple blossom counting during the field experiment: (a) top view of the apple orchard showing the tarp strips that divided each tree row into three sections; (b) blossom counting of one side of a tree row section.
To test the generalizability of the concept of UAV photogrammetry-based blossom density mapping, different camera and photogrammetry software from those used previously were employed for the field experiment. RGB image data were collected using a DJI Mavic 2 Zoom, which had a built-in RGB camera with a 4000 × 3000 resolution and a 2× optical zoom capability. Autonomous UAV flights again were conducted using DJI GS Pro with a preplanned flight path (Fig. 12a). The flight altitude was set at 15 m and the UAV speed was set at 1 m/s. Images of the apple orchard were captured every two seconds with a 40° camera pitch and the camera’s full zoom capability, resulting in roughly a 90% overlap between consecutively collected images. Another commercial photogrammetry software, DroneDeploy (San Francisco, USA), was used to reconstruct orchard point clouds (Fig. 12b). RGB data of the orchard were collected on May 3, 5, 8, 11, and 14, 2022 to monitor the tree blossom density changes with time.

Fig. 12. The apple orchard where the field experiment data collection was conducted: (a) the flight path of the UAV flight missions; (b) a reconstructed apple orchard point cloud using the set of RGB images collected on May 3, 2022, that shows the tarp strips.
Data Processing and Analysis
Each collected RGB dataset was used to reconstruct an orchard point cloud model. For the orchard point cloud of May 3, 2022, when the apple blossoms were manually counted, each of the 24 tree row sections was manually cropped out using the open-source software MeshLab (ISTI-CNR, Italy). Since there were two parameters that needed to be investigated, namely white blossom point color threshold and blossom grid filter size, various value combinations of the two parameters were studied. A white color threshold range of 0.01 to 0.2 with a step of 0.01, and a blossom grid filter size range of 0 to 0.23 m3 with a step of 0.013 m3 were defined. In total, there were 420 unique value combinations, and each combination was used to extract downsampled blossom points from the 24 cropped tree row section point clouds respectively. The relationships between the extracted downsampled blossom point numbers and the manual blossom counts were analyzed using linear regression. However, the regressions were forced to have no intercept, since ideally zero white blossom point in reconstructed orchard point clouds should indicate zero blossoms in orchards. The 420 regressions were evaluated in terms of coefficient of determination (R2) and root mean square error (RMSE), and the optimal combination of white color threshold and blossom grid filter size was selected based on both metrics.
Optimal White Blossom Color Threshold and Blossom Grid Filter Size
Fig. 13 shows the R2 and RMSE heatmaps of the 420 regressions respectively. Strong, positive linear relationships existed between the downsampled blossom points and the manual blossom counts, which proves the validity of point cloud-based apple blossom density estimation. The largest R2 of 0.85 and the smallest RMSE of 1307 were achieved when the white color threshold was 0.04 and the blossom grid filter size was 0.093 m3. As shown in Fig. 13, when the white color threshold ranged from 0.03 to 0.07 and the blossom grid filter size ranged from 0.013 m3 to 0.183 m3, most value combinations of the two parameters had relatively high R2s and low RMSEs.

Fig. 13. R2 and RMSE heatmaps of the 420 linear relationships between manual blossom counts and downsampled white blossom point numbers extracted from the 24 cropped tree row section point clouds using different white color thresholds and blossom grid filter sizes.
The proposed mapping algorithm relied on white color thresholding, an essential and effective step, to extract blossom points from an orchard point cloud. However, there are two major sources of errors to this method: non-blossom points and white color threshold level. White color is not unique to only apple blossoms in orchards. Highly reflective surfaces, man-made objects, snow, and overexposed pixels can all appear white in RGB images. While automatic camera settings generally work well for capturing images with high dynamic ranges, lowering camera exposure can potentially be beneficial in reducing non-blossom points in a blossom point cloud. Aside from the number of non-blossom white points contained in an orchard point cloud, the efficacy of white color thresholding is also dependent on the chosen saturation and intensity threshold levels. When images are captured under different lighting conditions or at different times of day, the same white color threshold might not always result in optimal blossom point separation. For example, for point clouds that are reconstructed using images captured at dawn or dusk when brightness is lacking, lower intensity thresholds are likely to be more effective for blossom point extraction. Potentially, image preprocessing techniques such as contrast stretching before point cloud reconstruction can help not only achieve more consistent image quality across datasets, but also eliminate the need of establishing optimal white color thresholds for different environmental lighting conditions. As most apple varieties have pink colored flower buds during first and full pink stages that gradually turn white during first and full bloom stages, pink color hue and low saturation thresholding can be another approach to sperate apple blossom points from an orchard point cloud.
The presumption that downsampled blossom points can be used to reliably estimate blossom counts requires that most apple flowers have a uniform size at the time of data collection. During a growing season, petals of apple flowers, which are the most visible portion of the flowers, transition from being closed (Fig. 14a) to being open (Fig. 14b), and to being wilted and detached from the flowers (Fig. 14c). The size of apple flowers during this process can change substantially, which will lead to less accurate point cloud-based blossom count estimations, considering usually not all flower buds on apple trees are at the identical physiological growth stage. Aside from developmental stage, apple variety is another factor that can contribute to inconsistent blossom size. Calibrating unique relationships between downsampled blossom point numbers and blossom counts for individual apple varieties at peak bloom have the potential to improve blossom count estimation accuracy, which, however, might not be necessary when growers only have one or a few apple varieties in their orchards.

Fig. 14. Field photos of apple blossoms at different developmental stages with different sizes: (a) small flowers with closed petals; (b) large flowers with fully opened petals; (c) small flowers with wilted petals.
Blossom Count Estimation Accuracy
Fig. 15 shows the scatter plot between downsampled blossom point number and manual blossom count when the white color threshold was 0.04 and the blossom grid filter size was 0.093 m3. An R2 of 0.85, an RMSE of 1307, and a normalized RMSE (NRMSE) of 9.02% were achieved. While the R2 verified the strong positive correlation between downsampled blossom point number and blossom count, the RMSE indicated that the methodology accuracy can be potentially further improved. Nonetheless, given the large scale of manual blossom count, NRMSE suggested the validity of the proposed mapping algorithm.

Fig. 15. The best regression relationship achieved between downsampled blossom point number and manual blossom count using a 0.04 white color threshold and a 0.09 m × 0.09 m × 0.09 m blossom grid filter.
There were many factors during the field experiment that might have influenced the results in Fig. 15. First of all, ground truth or manual blossom counts might not be very accurate. Due to the dense distribution of apple flowers, accurately and precisely counting flowers of eight 70 m-long apple tree rows at full bloom stage would be extremely laborious and time-consuming, which was not practical and feasible considering the scope and scale of the study. During the manual counting, to speed up the counting process, flower clusters were often counted rather than individual flowers and each flower cluster was assumed to contain five flowers, which might not be true for all flower clusters. Additionally, flowers of apple tree rows essentially cannot be counted by a single person without using destructive methods, as flowers growing on one side of a tree row often cannot be seen from the other side. When multiple people are involved in the counting process, accurately tracking which flowers are counted is a major challenge. It is very likely that during the field experiment, many apple flowers were either not counted at all, or counted twice by the two people from two sides of the tree rows.
Second, at any given time during a growing season, it is not likely that all flowers of apple trees are at the exact developmental stage. For example, some flowers may already start to wilt while some are yet to be fully open. The natural, inevitable varying flower sizes in the orchard was an important factor that negatively affected the accuracy of the proposed methodology. The different apple tree varieties also had slightly different peak bloom dates, which contributed to the overall flower size variation in the orchard during data collection.
Third, photogrammetry techniques have limited abilities in reconstructing small objects. In order to obtain high quality reconstructed orchard point clouds, ideally UAVs need to fly at high altitudes to prevent significant image perspective distortions so that more visual similarities between images can be preserved. However, as cameras are located farther away from apple trees, small apple flowers will no longer appear as prominent features in images, and often photogrammetry software would fail to reconstruct fine details such as small apple flowers. This explains why for low resolution cameras, flower clusters at full bloom stage would be easier to reconstruct than individual flowers at king bloom stage due to their larger overall white mass. While high UAV flight altitude is beneficial for large scale UAV mapping, for this specific application, the UAV flight altitude was carefully chosen to achieve a balance between image similarity and image detail. Nevertheless, the failure of reconstructing small blossoms could be one of the factors that affected the results.
Lastly, as flowers inside apple tree canopies have a lower chance of being observed by a UAV, occlusion of flowers can lead to lower blossom count estimation accuracy. Depending on apple variety, training system, and growth stage, dense tree canopies and dense flower distributions can both increase the number of occluded flowers. During the field experiment, all apple blossoms were counted regardless of their locations within the tree canopies, while during point cloud reconstruction maybe only a limited number of flowers located inside of the tree canopies were successfully reconstructed. Such a mismatch, especially when multiple apple varieties were involved, might be partially responsible for the imperfect results in Fig. 15. Generally, apple flowers located at upper outer tree canopies are more likely to be successfully reconstructed than those located at lower inner tree canopies, and deliberately designing UAV flight paths with appropriate flight altitude, camera pitch angle, and flying speed to maximize blossom point reconstruction success rate is vital for the proposed blossom count and density estimation methodology.
Blossom Density Monitoring Application
As a demonstration, the proposed algorithm was utilized to generate blossom density maps of the apple orchard during the blooming period using a 0.3 m × 0.3 m × 0.3 m terrain grid filter (Fig. 16). From left to right, the varieties of the eight apple tree rows in the maps are Gibson Golden Delicious, Spur Red Delicious, Jonamac, Jonagold, Gibson Golden Delicious, Gibson Golden Delicious, Ace Spur Red Delicious, and Ace Spur Red Delicious. Substantial blossom density variations within the tree rows, between the tree rows and varieties, and across the dates can be easily observed in the maps, which indicates the strong potential of the proposed methodology in helping apple growers monitor blossom density of large-scale orchards with ease.

Fig. 16. Blossom density maps of the field experiment apple orchard on multiple dates during the growing season of 2022 generated with a 0.3 m × 0.3 m × 0.3 m terrain grid filter.
The functions of blossom density maps are three-fold. First, they show the absolute and relative blossom densities of different apple varieties. For example, relatively speaking, Jonamac and Gibson Golden Delicious had higher peak blossom densities than Spur Red Delicious and Ace Spur Red Delicious. During blossom thinning, growers can focus more on the warm regions with high blossom densities than the cold regions with low blossom densities in a map to achieve uniform blossom density distribution over the whole orchard. Second, they capture the peak bloom date of different apple varieties. For example, the peak bloom date of Jonamac was May 5, and the peak bloom date of Gibson Golden Delicious was May 8. Historical blossom density maps from previous years would allow growers to better anticipate the peak bloom dates of their apple trees and prepare for blossom thinning ahead of time. Third, they record the peak bloom duration of different apple varieties. For example, the peak bloom duration of Jonagold was roughly four days, and the peak bloom duration of Gibson Golden Delicious was roughly seven days. It might be beneficial for growers to prioritize the blossom thinning of apple varieties with short peak bloom durations as they are more time-sensitive.
Implications and Future Work
The proposed blossom density mapping algorithm can assist apple growers in quickly identifying tree row regions with undesirably dense flower distributions, and hence making informed, in-time blossom thinning decisions. Compared to traditional manual orchard inspection, the algorithm allows the blossom densities of apple trees to be compared in a more objective way. Even though the absolute blossom densities estimated by the algorithm might not be particularly precise, the relative blossom densities between tree rows can be clearly reflected in the maps, which enables growers to quickly locate orchard regions requiring thinning operations. The algorithm is also helpful when orchard blossom density needs to be reevaluated. For example, after a rainstorm or mechanical blossom thinning, a UAV flight mission can be conducted over an orchard to assess its current blossom density to help determine whether further blossom thinning is still necessary.
The primary focus of the current study was to develop a point cloud-based apple blossom density estimation algorithm, based on the presumption that downsampled blossom point number and actual blossom count are positively correlated. While the preliminary field experiment confirmed the algorithm’s validity and general utility, to achieve more accurate blossom density estimations, comprehensive experiments exploring various factors that can influence the accuracy and repeatability of the proposed methodology are still in need.
To reconstruct high quality orchard point clouds, a robust photogrammetry software is essential. Currently various commercial and open-source photogrammetry software are available. Aside from PIX4Dmapper and DroneDeploy which were tested in the study, Agisoft Metashape, COLMAP, Meshroom, OpenMVG, and VisualSFM are also some of the available photogrammetry software (Maiwald and Maas 2021; Qureshi et al. 2022). It is worth investigating in future studies which software performs the best for complicated agricultural environments, as the internal photogrammetry algorithms of the software have likely been customized.
Since all information in a reconstructed point cloud comes from RGB images, image quality is another vital factor that impacts reconstructed orchard point cloud quality. As previously discussed, data collection timing, flight altitude, flight speed, camera resolution, and camera pitch angle can all affect image quality. Time of day mainly influences image brightness, and a proper brightness level is necessary for images to achieve good dynamic ranges. Flight altitude determines the tradeoff between image similarity and image detail. High flight altitudes would ensure successful reconstruction of coarse orchard point clouds with fewer blossom details. Low flight altitudes would allow cameras to observe apple flowers better, yet, reconstructed point cloud quality can suffer when significant perspective distortions are present between images. Flight speed determines the balance between image overlap, image blurriness, and flight duration. In general, high image quality and overlap should be prioritized over short data collection duration. Although it seems to be apparent that high camera resolution is advantageous for generating high-quality point clouds, it also takes longer to reconstruct point clouds using high resolution images. During photogrammetric flight missions, UAVs usually fly in a grid pattern with 90°-pitched cameras to acquire images with large frontal and side overlaps. In this case, to better observe the flowers growing on the sides of the apple tree rows, the flight mission parameters including flight altitude, flight path, and camera pitch angle were specifically chosen and designed to achieve dense blossom point cloud reconstruction. In future research, the quality of point clouds reconstructed using images captured at different times of day can be first examined to determine whether environmental brightness is an important consideration during data collection. Various image preprocessing techniques can be explored to improve image quality consistency. The optimal combination of flight altitude, flight speed, and camera pitch angle should be studied to generate complete, dense point cloud models of orchards. It would be an interesting research topic to compare point clouds reconstructed using image sets with various resolutions of the same orchard, and investigate when additional image resolution would no longer help increase blossom density estimation accuracy.
Considering that different apple varieties may have different characteristics such as canopy density and flower size, density, and distribution during their blooming periods, exploring optimal saturation and intensity thresholds and blossom grid filter sizes for individual apple varieties might help improve blossom density estimation accuracy. In the current study, there were insufficient data points to properly calibrate and validate such relationships for each apple variety. However, the preliminary analysis returned near perfect linear relationships with approximately R2s of 1 and RMSEs of 0 for Spur Red Delicious, Jonamac and Jonagold using the limited data.
Since apple blossoms are a leading indicator for crop load, their pink form at first and full pink stages might be just as useful as their white form at first and full bloom stages. Although pink flower buds are much smaller and likely harder to reconstruct than white blossoms, predicting blossom count and density utilizing the number of downsampled pink points of an apple orchard point cloud is a potential research topic. Consequently, impacts of pink color threshold and pink grid filter size on blossom density estimation will need to be investigated. As another potential extension of the current study, the proposed blossom density estimation methodology might also be applicable to other fruit trees with white flowers such as peach, pear, and citrus, although optimal white color threshold and blossom grid filter size are likely different than those for apple.
The current study developed an apple blossom density mapping algorithm utilizing RGB point cloud models reconstructed by photogrammetry software. The algorithm completes a streamlined, user-friendly apple orchard blossom density monitoring workflow, from autonomous orchard image collection using UAV, photogrammetry-based point cloud reconstruction, to blossom density map generation using the developed algorithm. The utility of the proposed algorithm lies in objective blossom density assessment and visualized blossom thinning guidance. While our preliminary field experiment demonstrated the algorithm's capability in capturing blossom density variations of different apple varieties at different dates, future studies are still needed to further explore the impacts of photogrammetry software, UAV flight mission design, and image quality on the algorithm performance.
Reference
Apolo-Apolo, O. E., Pérez-Ruiz, M., Martínez-Guanter, J., & Valente, J. (2020). A Cloud-Based Environment for Generating Yield Estimation Maps From Apple Orchards Using UAV Imagery and a Deep Learning Technique. Frontiers in Plant Science, 11(July), 1–15. https://doi.org/10.3389/fpls.2020.01086
Apple Chemical Thinning. (n.d.). http://cpg.treefruit.wsu.edu/bioregulator-sprays/apple-chemical-thinning/
Apple Training Systems - Cookbook Guidelines. (2017). https://extension.psu.edu/apple-training-systems-cookbook-guidelines
Armstrong, M., Zisserman, A., & Beardsley, P. (1994). Euclidean Reconstruction from Uncalibrated Images. In British Machine Vision Conference (pp. 509–518).
Basak, A., Juraś, I., Białkowski, P., Blanke, M. M., & Damerow, L. (2016). Efficacy of mechanical thinning of apple in Poland. Acta Horticulturae, 1138, 75–82. https://doi.org/10.17660/ActaHortic.2016.1138.10
Braun, B., Bulanon, D. M., Colwell, J., Stutz, A., Stutz, J., Nogales, C., et al. (2018). A Fruit Yield Prediction Method Using Blossom Detection. In ASABE 2018 Annual International Meeting (p. 1801542).
Crassweller, R. M., Kime, L. F., & Harper, J. K. (2016). Apple Production. Agricultural Alternatives.
Dehkordi, R. H., Burgeon, V., Fouche, J., Gomez, E. P., Cornelis, J. T., Nguyen, F., et al. (2020). Using UAV collected RGB and multispectral images to evaluate winter wheat performance across a site characterized by century-old biochar patches in Belgium. Remote Sensing, 12(15). https://doi.org/10.3390/RS12152504
Delavarpour, N., Koparan, C., Nowatzki, J., Bajwa, S., & Sun, X. (2021). A Technical Study on UAV Characteristics for Precision Agriculture Applications and Associated Practical Challenges. Remote Sensing, 13(6), 1204. https://doi.org/10.3390/rs13061204
Dias, P. A., Tabb, A., & Medeiros, H. (2018a). Apple flower detection using deep convolutional networks. Computers in Industry, 99, 17–28. https://doi.org/10.1016/j.compind.2018.03.010
Dias, P. A., Tabb, A., & Medeiros, H. (2018b). Multispecies fruit flower detection using a refined semantic segmentation network. IEEE Robotics and Automation Letters, 3(4), 3003–3010.
Dong, X., Kim, W. Y., & Lee, K. H. (2021). Drone-Based Three-Dimensional Photogrammetry and Concave Hull by Slices Algorithm for Apple Tree Volume Mapping. Journal of Biosystems Engineering, 46(4), 474–484. https://doi.org/10.1007/s42853-021-00120-y
Farjon, G., Krikeb, O., Hillel, A. B., & Alchanatis, V. (2020). Detection and counting of flowers on apple trees for better chemical thinning decisions. Precision Agriculture, 21(3), 503–521. https://doi.org/10.1007/s11119-019-09679-1
Gee, A., Prager, R., Treece, G., & Berman, L. (2003). Engineering a freehand 3D ultrasound system. Pattern Recognition Letters, 24(4–5), 757–777. https://doi.org/10.1016/S0167-8655(02)00180-0
Greene, D. W., Lakso, A. N., Robinson, T. L., & Schwallier, P. (2013). Development of a fruitlet growth model to predict thinner response on apples. HortScience, 48(5), 584–587. https://doi.org/10.21273/hortsci.48.5.584
Guitton, B., Kelner, J. J., Velasco, R., Gardiner, S. E., Chagné, D., & Costes, E. (2012). Genetic control of biennial bearing in apple. Journal of Experimental Botany, 63(1), 131–149. https://doi.org/10.1093/jxb/err261
Hočevar, M., Širok, B., Godeša, T., & Stopar, M. (2014). Flowering estimation in apple orchards by image analysis. Precision Agriculture, 15, 466–478.
Johansen, K., Raharjo, T., & McCabe, M. F. (2018). Using multi-spectral UAV imagery to extract tree crop structural properties and assess pruning effects. Remote Sensing, 10(6). https://doi.org/10.3390/rs10060854
Koenig, K., Höfle, B., Hämmerle, M., Jarmer, T., Siegmann, B., & Lilienthal, H. (2015). Comparative classification analysis of post-harvest growth detection from terrestrial LiDAR point clouds in precision agriculture. ISPRS Journal of Photogrammetry and Remote Sensing, 104, 112–125. https://doi.org/10.1016/j.isprsjprs.2015.03.003
Kolarič, J. (2010). Abscission of young apple fruits ( Malus domestica Borkh .): a review. Agricultura, 7, 31–36.
Kon, T. M., & Schupp, J. R. (2018). Apple crop load management with special focus on early thinning strategies: A US perspective. In Horticultural Reviews, Volume 46 (Vol. 46, pp. 255–298). https://doi.org/10.1002/9781119521082.ch6
Lakso, A. N., Robinson, T. L., & Greene, D. W. (2002). Using an Apple Tree Carbohydrate Model to Understand Thinning Responses to Weather and Chemical Thinners. New York State Horticultural Society, 15(3), 16–19.
Link, H. (2000). Significance of flower and fruit thinning on fruit quality. Plant Growth Regulation, 31(1–2), 17–26. https://doi.org/10.1023/a:1006334110068
Liu, Z., Guo, P., Liu, H., Fan, P., Zeng, P., Liu, X., et al. (2021). Gradient boosting estimation of the leaf area index of apple orchards in uav remote sensing. Remote Sensing, 13(16), 1–19. https://doi.org/10.3390/rs13163263
Maiwald, F., & Maas, H. G. (2021). An automatic workflow for orientation of historical images with large radiometric and geometric differences. Photogrammetric Record, 36(174), 77–103. https://doi.org/10.1111/phor.12363
Mesas-Carrascosa, F. J., Torres-Sánchez, J., Clavero-Rumbao, I., García-Ferrer, A., Peña, J. M., Borra-Serrano, I., & López-Granados, F. (2015). Assessing optimal flight parameters for generating accurate multispectral orthomosaicks by uav to support site-specific crop management. Remote Sensing, 7(10), 12793–12814. https://doi.org/10.3390/rs71012793
Nowak, B. (2021). Precision Agriculture: Where do We Stand? A Review of the Adoption of Precision Agriculture Technologies on Field Crops Farms in Developed Countries. Agricultural Research. https://doi.org/10.1007/s40003-021-00539-x
Park, J., Kim, H., Yu-Wing Tai, Brown, M. S., & Kweon, I. (2011). High quality depth map upsampling for 3D-TOF cameras. Proceedings of the IEEE International Conference on Computer Vision, 1623–1630. https://doi.org/10.1109/ICCV.2011.6126423
Pflanz, M., Gebbers, R., & Zude, M. (2016). Influence of tree-adapted flower thinning on apple yield and fruit quality considering cultivars with different predisposition in fructification. Acta Horticulturae, 1130, 605–611. https://doi.org/10.17660/ActaHortic.2016.1130.90
Pollefeys, M., Koch, R., & Gool, L. Van. (1998). Self-Calibration and Metric Reconstruction in spite of Varying and Unknown Intrinsic Camera Parameters. International Journal of Computer Vision, 1–18.
Qureshi, A. H., Alaloul, W. S., Murtiyoso, A., Saad, S., & Manzoor, B. (2022). Comparison of Photogrammetry Tools Considering Rebar Progress Recognition. The International Archives of the Photogrammetry, Remote Sensing and Spatial Information Sciences, XLIII-B2-2(June), 141–146. https://doi.org/10.5194/isprs-archives-xliii-b2-2022-141-2022
Robinson, T. L., & Lakso, A. N. (2011). Advances in Predicting Chemical Thinner Response of Apple Using a Carbon Balance Model. New York Fruit Quarterly, 19(1), 15–20. http://nyshs.org/wp-content/uploads/2016/10/3.Advances-in-Predicting-Chemical-Thinner-Response-of-Apple-Using-a-Carbon-Balance-Model.pdf
Schupp, J. R., Auxt Baugher, T., Miller, S. S., Harsh, R. M., & Lesser, K. M. (2008). Mechanical thinning of peach and apple trees reduces labor input and increases fruit size. HortTechnology, 18(4), 660–670. https://doi.org/10.21273/horttech.18.4.660
Seitz, S. M., Curless, B., Diebel, J., Scharstein, D., & Szeliski, R. (2006). A comparison and evaluation of multi-view stereo reconstruction algorithms. Proceedings of the IEEE Computer Society Conference on Computer Vision and Pattern Recognition, 1, 519–526. https://doi.org/10.1109/CVPR.2006.19
Spengler, R. N. (2019). Origins of the apple: The role of megafaunal mutualism in the domestication of Malus and rosaceous trees. Frontiers in Plant Science, 10(May), 1–18. https://doi.org/10.3389/fpls.2019.00617
Taylor, J. E., Charlton, D., & Yuńez-Naude, A. (2012). The End of Farm Labor Abundance. Applied Economic Perspectives and Policy, 34(4), 587–598. https://doi.org/10.1093/aepp/pps036
Tian, Y., Yang, G., Wang, Z., Li, E., & Liang, Z. (2020). Instance segmentation of apple flowers using the improved mask R–CNN model. Biosystems Engineering, 193, 264–278. https://doi.org/10.1016/j.biosystemseng.2020.03.008
Tsouros, D. C., Bibi, S., & Sarigiannidis, P. G. (2019). A review on UAV-based applications for precision agriculture. Information, 10(11), 349. https://doi.org/10.3390/info10110349
Tsouros, D. C., Triantafyllou, A., Bibi, S., & Sarigannidis, P. G. (2019). Data acquisition and analysis methods in UAV- based applications for precision agriculture. In 2019 15th International Conference on Distributed Computing in Sensor Systems (DCOSS) (pp. 377–384).
Tubau Comas, A., Valente, J., & Kooistra, L. (2019). Automatic apple tree blossom estimation from UAV RGB imagery. International Archives of the Photogrammetry, Remote Sensing and Spatial Information Sciences, 42(XLII-2/W13), 631–635. https://doi.org/10.5194/isprs-archives-XLII-2-W13-631-2019
USDA Foreign Agricultural Service. (2022). Fresh apples, grapes, and pears: world markets and trade.
Valente, J., Almeida, R., & Kooistra, L. (2019). A comprehensive study of the potential application of flying ethylene-sensitive sensors for ripeness detection in apple orchards. Sensors, 19(2). https://doi.org/10.3390/s19020372
Wang, C., Liu, Y., Zhang, Z., Han, L., Li, Y., Zhang, H., et al. (2022). Spray performance evaluation of a six-rotor unmanned aerial vehicle sprayer for pesticide application using an orchard operation mode in apple orchards. Pest Management Science, 78(6), 2449–2466. https://doi.org/10.1002/ps.6875
Wang, X. (Annie), Tang, J., & Whitty, M. (2020). Side-view apple flower mapping using edge-based fully convolutional networks for variable rate chemical thinning. Computers and Electronics in Agriculture, 178(April), 105673. https://doi.org/10.1016/j.compag.2020.105673
Wang, X. A., Tang, J., & Whitty, M. (2021). DeepPhenology : Estimation of apple flower phenology distributions based on deep learning. Computers and Electronics in Agriculture, 185(November 2020), 106123. https://doi.org/10.1016/j.compag.2021.106123
Wu, D., Lv, S., Jiang, M., & Song, H. (2020). Using channel pruning-based YOLO v4 deep learning algorithm for the real-time and accurate detection of apple flowers in natural environments. Computers and Electronics in Agriculture, 178(August), 105742. https://doi.org/10.1016/j.compag.2020.105742
Xiao, C., Zheng, L., Sun, H., Zhang, Y., & Li, M. (2014). Estimation of the apple flowers based on aerial multispectral image. In ASABE 2014 Annual International Meeting (p. 141912593). https://doi.org/10.13031/aim.20141912593
Xiao, D., Pan, Y., Feng, J., Yin, J., Liu, Y., & He, L. (2022). Remote sensing detection algorithm for apple fire blight based on UAV multispectral image. Computers and Electronics in Agriculture, 199(December 2021), 107137. https://doi.org/10.1016/j.compag.2022.107137
Yoder, K. S., Peck, G. M., Combs, L. D., Byers, R. E., & Smith, A. H. (2013). Using a pollen tube growth model to improve apple bloom thinning for organic production. Acta Horticulturae, 1001(June 2012), 207–214. https://doi.org/10.17660/ActaHortic.2013.1001.23
Yoder, K., Yuan, R., Combs, L., Byers, R., McFerson, J., & Schmidt, T. (2009). Effects of Temperature and the Combination of Liquid Lime Sulfur and Fish Oil on Pollen Germination, Pollen Tube Growth, and Fruit Set in Apples. HortScience, 44(5), 1277–1283.
Yuan, W., & Choi, D. (2021). UAV-based heating requirement determination for frost management in apple orchard. Remote Sensing, 13(2), 1–22. https://doi.org/10.3390/rs13020273
Education & outreach activities and participation summary
Participation summary:
The study result has been and will be shared with apple growers, tree fruit industry, and research community through:
- Presentation and workshop in IFTA 65th Annual Conference and Tours held at Hershey and Biglerville, Pennsylvania on February 12-15, 2022: "UAV Mapping: Applications Towards Frost Management and Blossom Thinning."
- Presetation in 2022 ASABE Annual International Meeting held at Houston, Texas on July 17-20, 2022: "Apple Blossom Density Estimation and Mapping Through UAV‐Based RGB Photogrammetry."
- Journal article which is submitted and currently under review: "Yuan, Wenan; Weiyun Hua; Paul Heinz Heinemann; Long He. UAV Photogrammetry-Based Apple Orchard Blossom Density Estimation and Mapping."
Project Outcomes
This project demonstrated that current commercial drones with appropriate data processing techniques such as photogrammetry can be a low-cost, convenient tool for farmers to monitor and assess crop growth status. The blossom density maps with high spatial resolution generated by the proposed algorithm allow apple growers to precisely identify orchard regions with undesirably high blossom densities, hence less cost associated with manual labor, chemical thinner, or fuel might be required. Additionally, in-time, optimal blossom thinning implies higher fruit yield with better marketable values. Less unnecessary chemical thinner spraying also indicates a more environment-friendly orchard management style, hence contributing to the sustainability of agriculture.
Through this project, the strengths and limitations of photogrammetry software for plant 3D model reconstruction as well as optimal drone flight setup such as flight speed, flight altitude, and camera pitch angle to achieve higher reconstructed point cloud quality were learned. It was also realized that significant manpower can be required for the ground truthing process in precision agriculture research such as counting flowers due to the complexity of crop structure and the large number of targets.
From a proof-of-concept standpoint, the potential of modern sensing and robotics technologies in improving the sustainability of agriculture by allowing precise and site-specific managements has been well-demonstrated in existing literature as well as this study. However, there is still a large gap between academic research and actual agricultural production in terms of technology adoption. Future research should focus on the engineering aspect of sensor-powered robotics, such as testing and improving the robustness of developed algorithm and hardware system for diverse environments, as well as designing user-friendly software interfaces and compact sensing systems.