Final report for GNE22-296
Project Information
Microbial carbon use efficiency (CUE) is a critical property of the soil ecosystem that affects both carbon (C) storage and nitrogen (N) mineralization. Microbial CUE is the proportion of C in decomposing organic material that remains assimilated in microbial biomass rather than being respired as carbon dioxide. When microbial CUE is high, plant residue inputs are more effectively stabilized into soil organic matter. However, increasing CUE reduces N-mineralization because microbial retention of C requires retention of N. This research evaluated how soil texture, cover crop residue type, and N-fertilizer additions affect CUE in agricultural soils. Experiments were conducted on two commercial farms and one research station in Pennsylvania over two years. Microbial CUE was evaluated through oxygen isotope labeling, and cover crop decomposition in litterbags. Results were analyzed with microbial community composition, soil properties, and farm management practices to determine the factors most influential in controlling CUE. Preliminary results show that microbial CUE is significantly affected by both soil type and cover crop residue composition. In addition, our estimates of microbial CUE showed an improvement while used in the N decision support tool to estimate the N credits from cover crop residues. Results from the project were disseminated through a co-learning workshop, a factsheet, farmer conferences, and an academic meeting. The improved understanding of CUE gained from this research will help farmers increase soil carbon storage as well as more precisely adjust N-fertilizer inputs based on predictions of N-mineralization from soil organic matter and crop residues, leading to greater farm profitability and fewer N losses to the environment from N over-fertilization.
- Evaluate and understand the effect of cover crop residues and the quantity and type of supplemental N fertilizer inputs on microbial carbon use efficiency.
- Assess whether microbial communities (e.g., fungal: bacteria ratios, ammonia-oxidizing bacteria) respond to different availability of carbon and nitrogen resources and determine if this influences carbon use efficiency and enzyme activity
- Determine if factors that control microbial CUE could be used to improve a nitrogen fertilizer recommendation tool that relies on an estimate of CUE to calculate N mineralization of cover crop residues and soil organic matter.
- Compare corn yield response to supplemental N fertilizer additions to the recommended N application rate from the decision support tool and evaluate how adjusting CUE in the decision support tool with field measured CUE improves the tool’s prediction
Microbial CUE is the proportion of decomposed C used by microorganisms (as a food source) to increase their microbial biomass rather than being lost through respiration1,2. Higher values of microbial CUE allow plant residue inputs to be more effectively stabilized into the microbial biomass and, ultimately, soil organic matter. But the efficient utilization of C to grow microbial biomass demands greater microbial N assimilation because microbial biomass is generally made up of one part of N for every ten parts of C. Hence, a higher CUE means less N from decomposing residues will mineralize into ammonium and be available for plants to use3. This makes microbial CUE a fundamental factor regulating N-mineralization rates. Substantial literature shows that CUE varies according to the type of decomposing substrate (e.g., cover crop C: N ratio), environmental factors, soil inorganic N availability, and microbial community composition. However, most of this knowledge comes from studies in forests or laboratories, leaving a knowledge gap in how microbial CUE behaves in agricultural soils4-7. The latter drives the necessity to evaluate, test, and validate the current understanding of CUE and N-mineralization relationships on farms to support N management decisions.
This project aims to create a robust framework gathering the relationships between microbial CUE, N-supply, and the microbial community as affected by soil properties and agricultural management. This framework will be key to improving the N-mineralization model used in a new N decision-support tool that corn growers can use to obtain recommendations for nitrogen applications based on their cover cropping practices, soil texture, and soil organic matter. N decision-support tool for this tool are currently based on soil texture as suggested by corn yield responses to soil organic matter content and cover crop biomass N and C: N ratio that were observed across a wide variety of sites8. Importantly, microbial CUE was never directly measured at these sites, and there are ranges of soil texture where the tool currently predicts a negative CUE, which is not biologically possible. Furthermore, other factors that are known to affect microbial CUE, such as the C: N ratio of decomposing plant residues, microbial community composition (e.g., bacterial: fungal ratio), and level of external N inputs, are currently not considered by the N decision support tool. A more robust understanding of model microbial CUE in agricultural systems will improve the existing decision support tool and better allow farmers to implement sustainable practices, calculating the contribution of nitrogen from cover crops and soil organic matter. Thus, having the capability to accurately predict the correct amount of supplemental nitrogen needed for corn will reduce under- and over-fertilization, thus reducing economic losses and N leaching while maintaining high crop yields. Likewise, this is not only key to helping farmers make ongoing decisions for current years; inserting this framework into the N decision-support tool will enable farmers to evaluate different scenarios according to their site-specific conditions to integrate cover crops and build up in the long-term soil organic matter.
References:
1. Manzoni, S., Capek, P., Mooshammer, M., Lindahl, B. D., Richter, ˇ A., and Šantrucková, H. (2017) Optimal metabolic regulation along resource stoichiometry gradients, Ecol. Lett., 20, 1182– 1191, https://doi.org/10.1111/ele.12815
2. Geyer K.M., P. Dijkstra, R. Sinsabaugh, S.D. Frey. (2019) Clarifying the interpretation of carbon use efficiency in soil through methods comparison. Soil Biology and Biochemistry, 128, 79–88
3. White, C.M., D.M. Finney, A.R. Kermanian, J.P. Kaye (2020) Modeling the contributions of nitrogen mineralization to yield of corn. Agr. Journal, 113, pp 490503
4. Fitch, A. A., A.K. Lang, E.D. Whalen, K. Geyer, & C. Hicks Pries. (2020) Fungal community, not substrate quality, drives soil microbial function in northeastern US temperate forests. Frontiers in Forests and Global Change, 117.
5. Frey, S. D., Lee, J., Melillo, J. M., and Six, J. (2013) The temperature response of soil microbial efficiency and its feedback to climate, Nat. Clim. Change, 3, 395–398, https://doi.org/10.1038/nclimate1796
6. Silva-Sánchez, A., M., Soares, J. Rousk (2019) Testing the dependence of microbial growth and carbon use efficiency on nitrogen availability, pH, and organic matter quality. Soil Biology and Biochemistry, 134, pp 25−35
7. Domeignoz-Horta, L.A., G., Pold, X.J., Allen, S.D., Frey, J.M., Melillo, K.M., DeAngelis. (2020) Microbial diversity drives carbon use efficiency in a model soil. Nature Communications, 11, 3684, https://doi.org/10.1038/s41467-020-17502-z
8. Sinsabaugh R.L., S. Manzoni, D.L. Moorhead, A. Richter. (2013) Carbon use efficiency of microbial communities: stoichiometry, methodology and modelling. Ecology Letters, 16, pp, 930–939
Cooperators
Research
Study site
The experimental sites were in three regions across Pennsylvania: Northumberland-Lycoming, Lancaster, and Centre counties that comprises 4 on-farm locations (Figure 1). Two sites were on commercial organic farms, and one was at the Russell E. Larson Agricultural Research Center. The climate in Pennsylvania is warm and humid during summer, where most of the corn production does not require irrigation. Average air temperature and cumulative precipitation were calculated for April to October for the experimental sites. The time frame selected corresponds to the corn growing season in Pennsylvania. Detailed site descriptions are provided in Table 1. The weather information was retrieved from the National Oceanic and Atmospheric Administration (NOAA) database and the National Weather and Climate Center of USDA-NRCS.
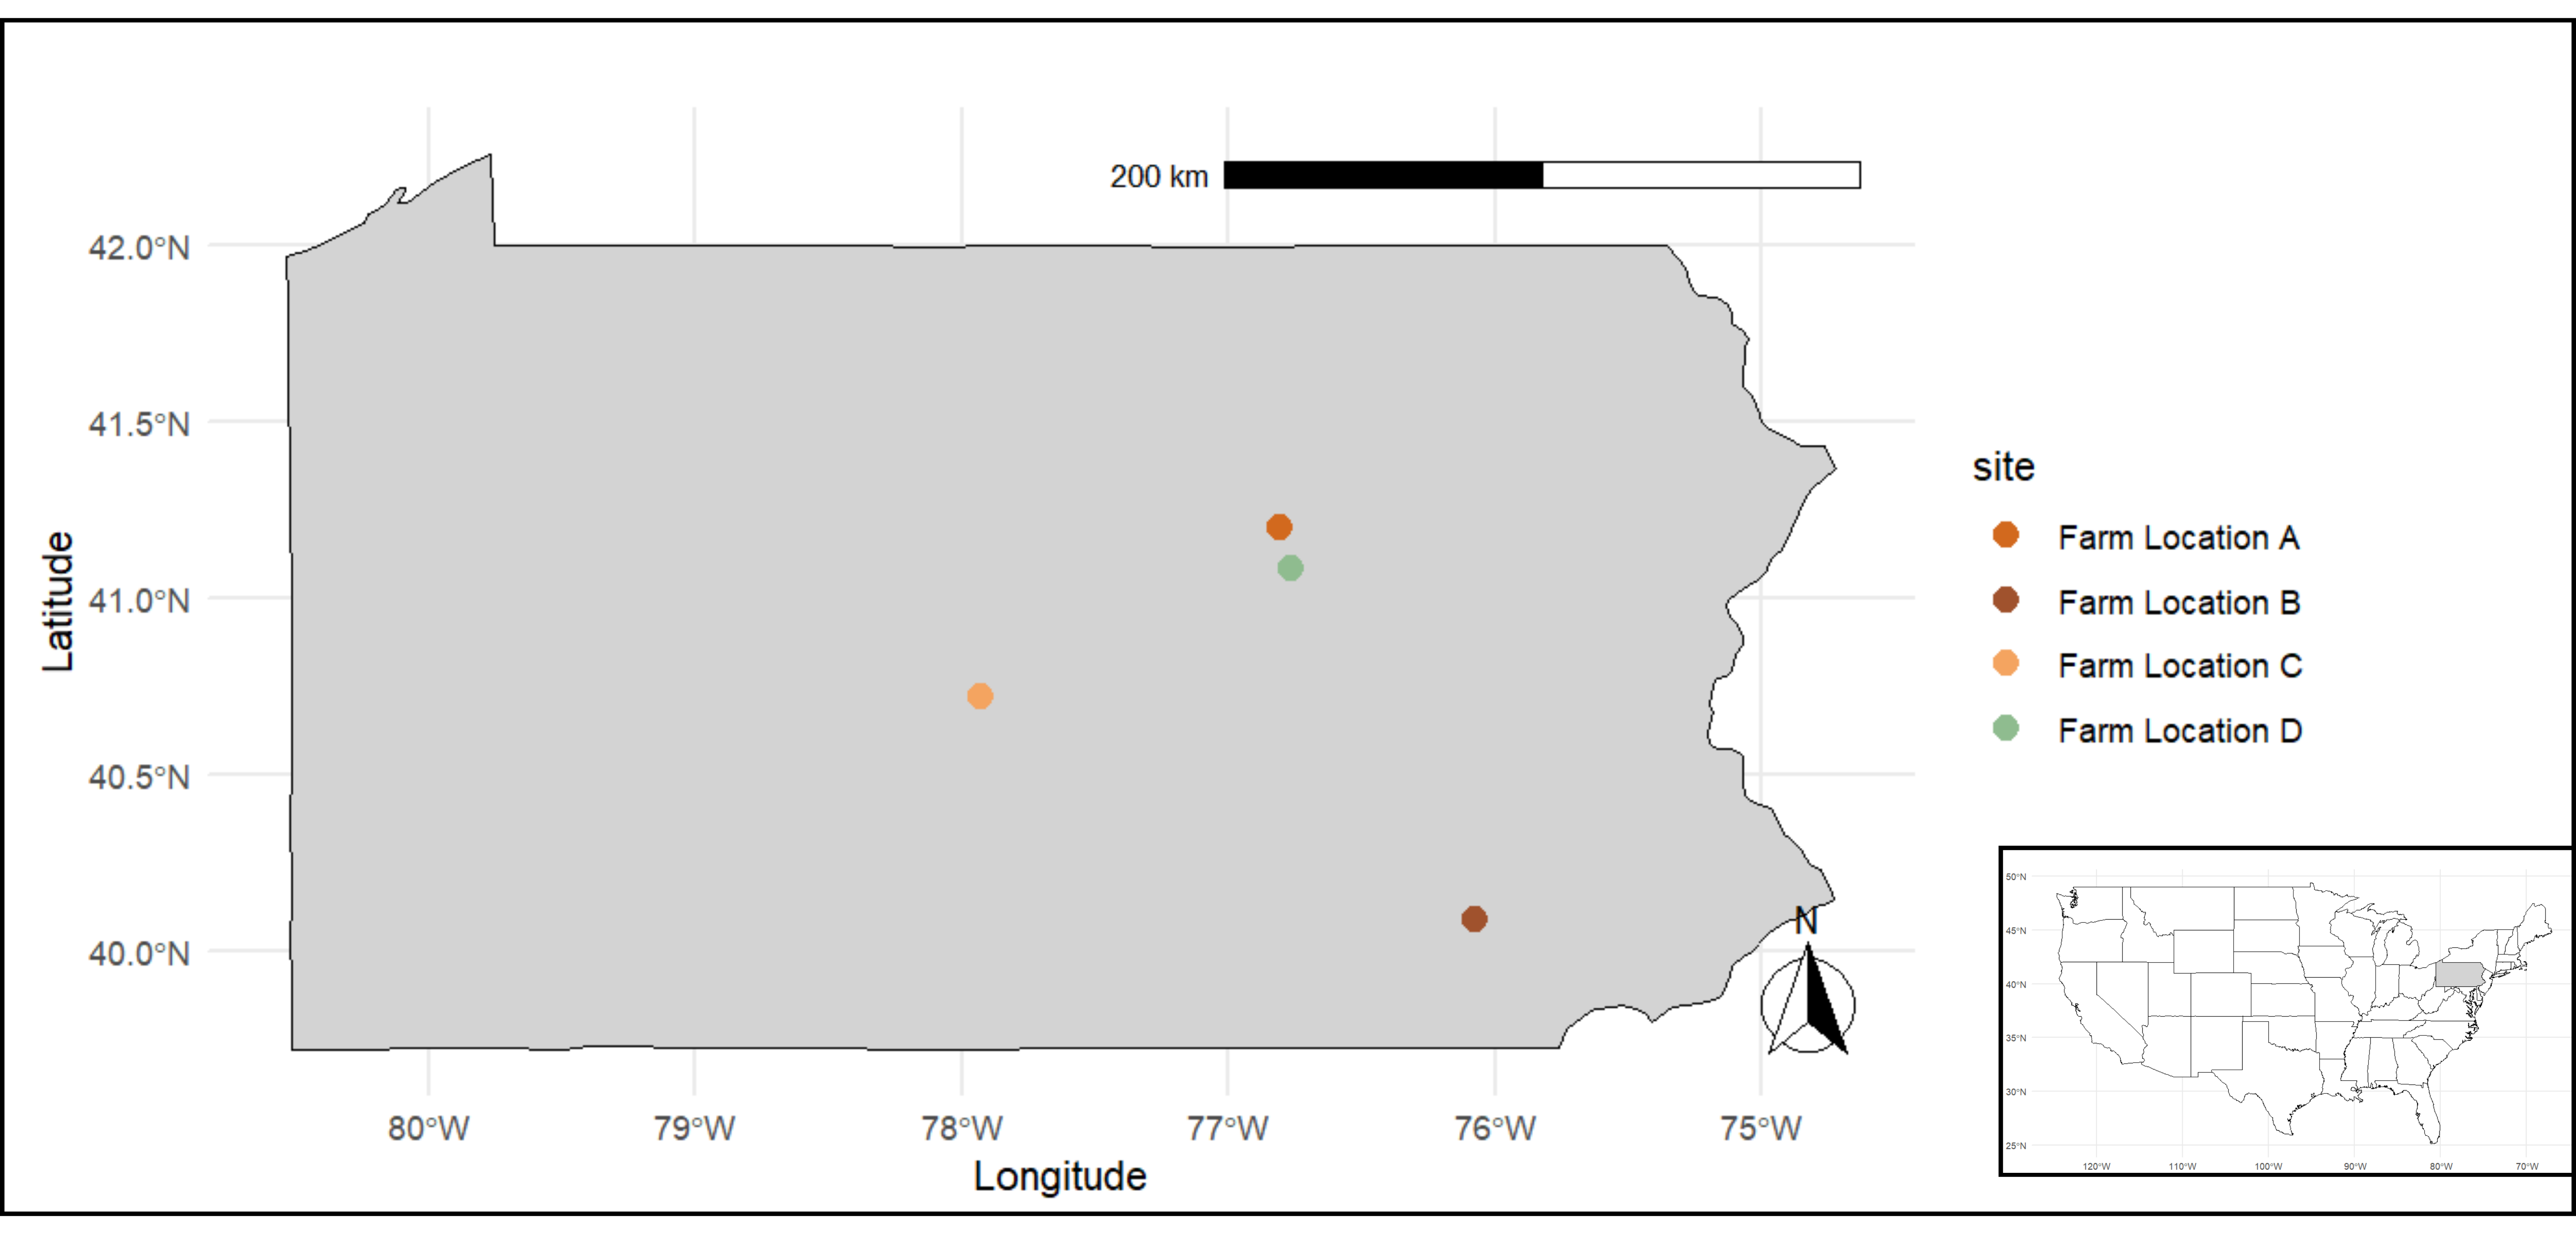
Table 1. Environmental and soil conditions of farm locations in Pennsylvania
|
Region (Year) |
Geographic Coordinates |
Soil Taxonomic Class |
*Average air temperature (C ± SD) |
*Cumulative precipitation (mm) |
|
Northumberland (2021) |
41°12′ N, 76°48′ W |
Coarse-loamy over sandy or sandy-skeletal, mixed, active, mesic Fluventic Dystrudepts |
19 ± 5 |
853
|
|
Lancaster (2021) |
40°05′ N, 76°04′ W |
Fine-loamy, mixed, active, mesic Ultic Hapludalfs |
20 ± 5 |
841 |
|
Centre (2021) |
40°43′ N, 77°55′ W |
Fine-loamy, mixed, semiactive, mesic Typic Hapludults, and Fine-loamy, mixed, semiactive, mesic Aquic Fragiudults |
17 ± 5
|
893 |
|
Lycoming (2022) |
41°05' N 76°45' W |
Fine, mixed, semiactive, mesic Typic Hapludalfs |
18 ± 5
|
559 |
|
Lancaster (2022) |
40°05′ N, 76°03′ W |
Fine, mixed, semiactive, mesic Typic Hapludalfs
|
20 ± 5 |
655 |
|
Centre (2022) |
40°43′ N, 77°55′ W |
Fine-loamy, mixed, semiactive, mesic Typic Hapludults, and Fine-loamy, mixed, semiactive, mesic Aquic Fragiudults |
16 ± 5
|
488
|
* Average air temperature and cumulative precipitation were calculated for April to October, corresponding to the corn growing season in Pennsylvania.
Experimental design
The experimental design was a Randomized Complete Block Design with four replicate blocks. The experimental design for this study started with selecting and managing cover crops at each site. On the commercial farms, farmer-collaborators chose the cover crop treatments for each year, while the research station experiment utilized a subset of three treatments from a larger group of 12, including a no-cover crop control. Specific details about the cover crop types used in the study are outlined below and summarized in Table 2. Cover crops were planted in the fall and terminated in the spring, with the exception of Northumberland in 2021.
The size of the N rate plots differed by location. At the research station, plots were 9 meters long and 4 meters wide with a 1.5-meter buffer zone, whereas at the on-farm sites, plots measured 15 meters in length and 5 meters in width, with buffer zones of 2.5 meters. The six N-levels were established as 0, 30, 60, 120, and 240 lb N/ac. Although experimental fields were divided into six N-levels for the N decision-support tool assessment, to complete the objectives of this proposal, were considered only 0, 120, and 240 lb N/ac treatments. For yield response analysis, the variety among N additions between sites was evaluated through a regression model. Because the on-farm trials are under organic production, N additions were performed using Chilean Nitrate fertilizer, a naturally occurring mineral N source allowed in organic production. Because Chilean nitrate is a mineral source of nitrogen (sodium nitrate), results from the study can also be extrapolated to conventional farmers that use mineral fertilizers such as urea and urea-ammonium-nitrate solution. Response to nutrient management with fertilizer additions were compared to on-farm nutrient management practices (with four external experimental plots at each side of the experimental fields), according to the manure applications performed by farmers.
Table 2. Cover crop treatments, termination dates and fertilization dates for experimental sites
|
Region (Year) |
Farm Location |
Cover crop species |
Crop before |
Termination Dates |
Type of termination |
Fertilization Dates |
|
|
Lycoming (2021) |
Site 1 |
OA |
SB |
May 7th |
Rotary mower and disk |
June 17th |
|
|
Lancaster (2021) |
Site 2 |
RG + CC |
WH |
April 7th |
Compact speed disk 3-4 passes |
June 23rd
|
|
|
Centre (2021) |
Site 3 Site 4 Site 5
|
CC TR No cover |
WH WH WH |
May 17 |
|
June 30th |
|
|
Northumberland (2022) |
Site 6 |
TR + CC +WP + RC + RY |
WH |
May 21st |
Rotary mower and disk |
June 29th |
|
|
Lancaster (2022) |
Site 7 |
TR + CC + WP + OA + FR
|
|
April 9-11th |
Compact speed disk 3-4 passes |
June 18th |
|
|
Centre (2022) |
Site 8 Site 9 Site 10 |
CC TR No cover |
WH WH WH |
May 11-12th |
|
June 22nd |
|
† FR, forage radish (Raphanus sativus L.); OA, oat (Avena sativa L.); RC, red clover (Trifolium pratense L.); CC, crimson clover (Trifolium incarnatum L. ‘Dixie’); RG, annual ryegrass (Lolium multiflorum Lam.); SB, soybean [Glycine max (L.) Merr.]; TR, triticale (× Triticosecale Wittm. ex A.); WH, wheat (Triticum aestivum); WP, winter pea (Pisum sativum)
Soil sampling
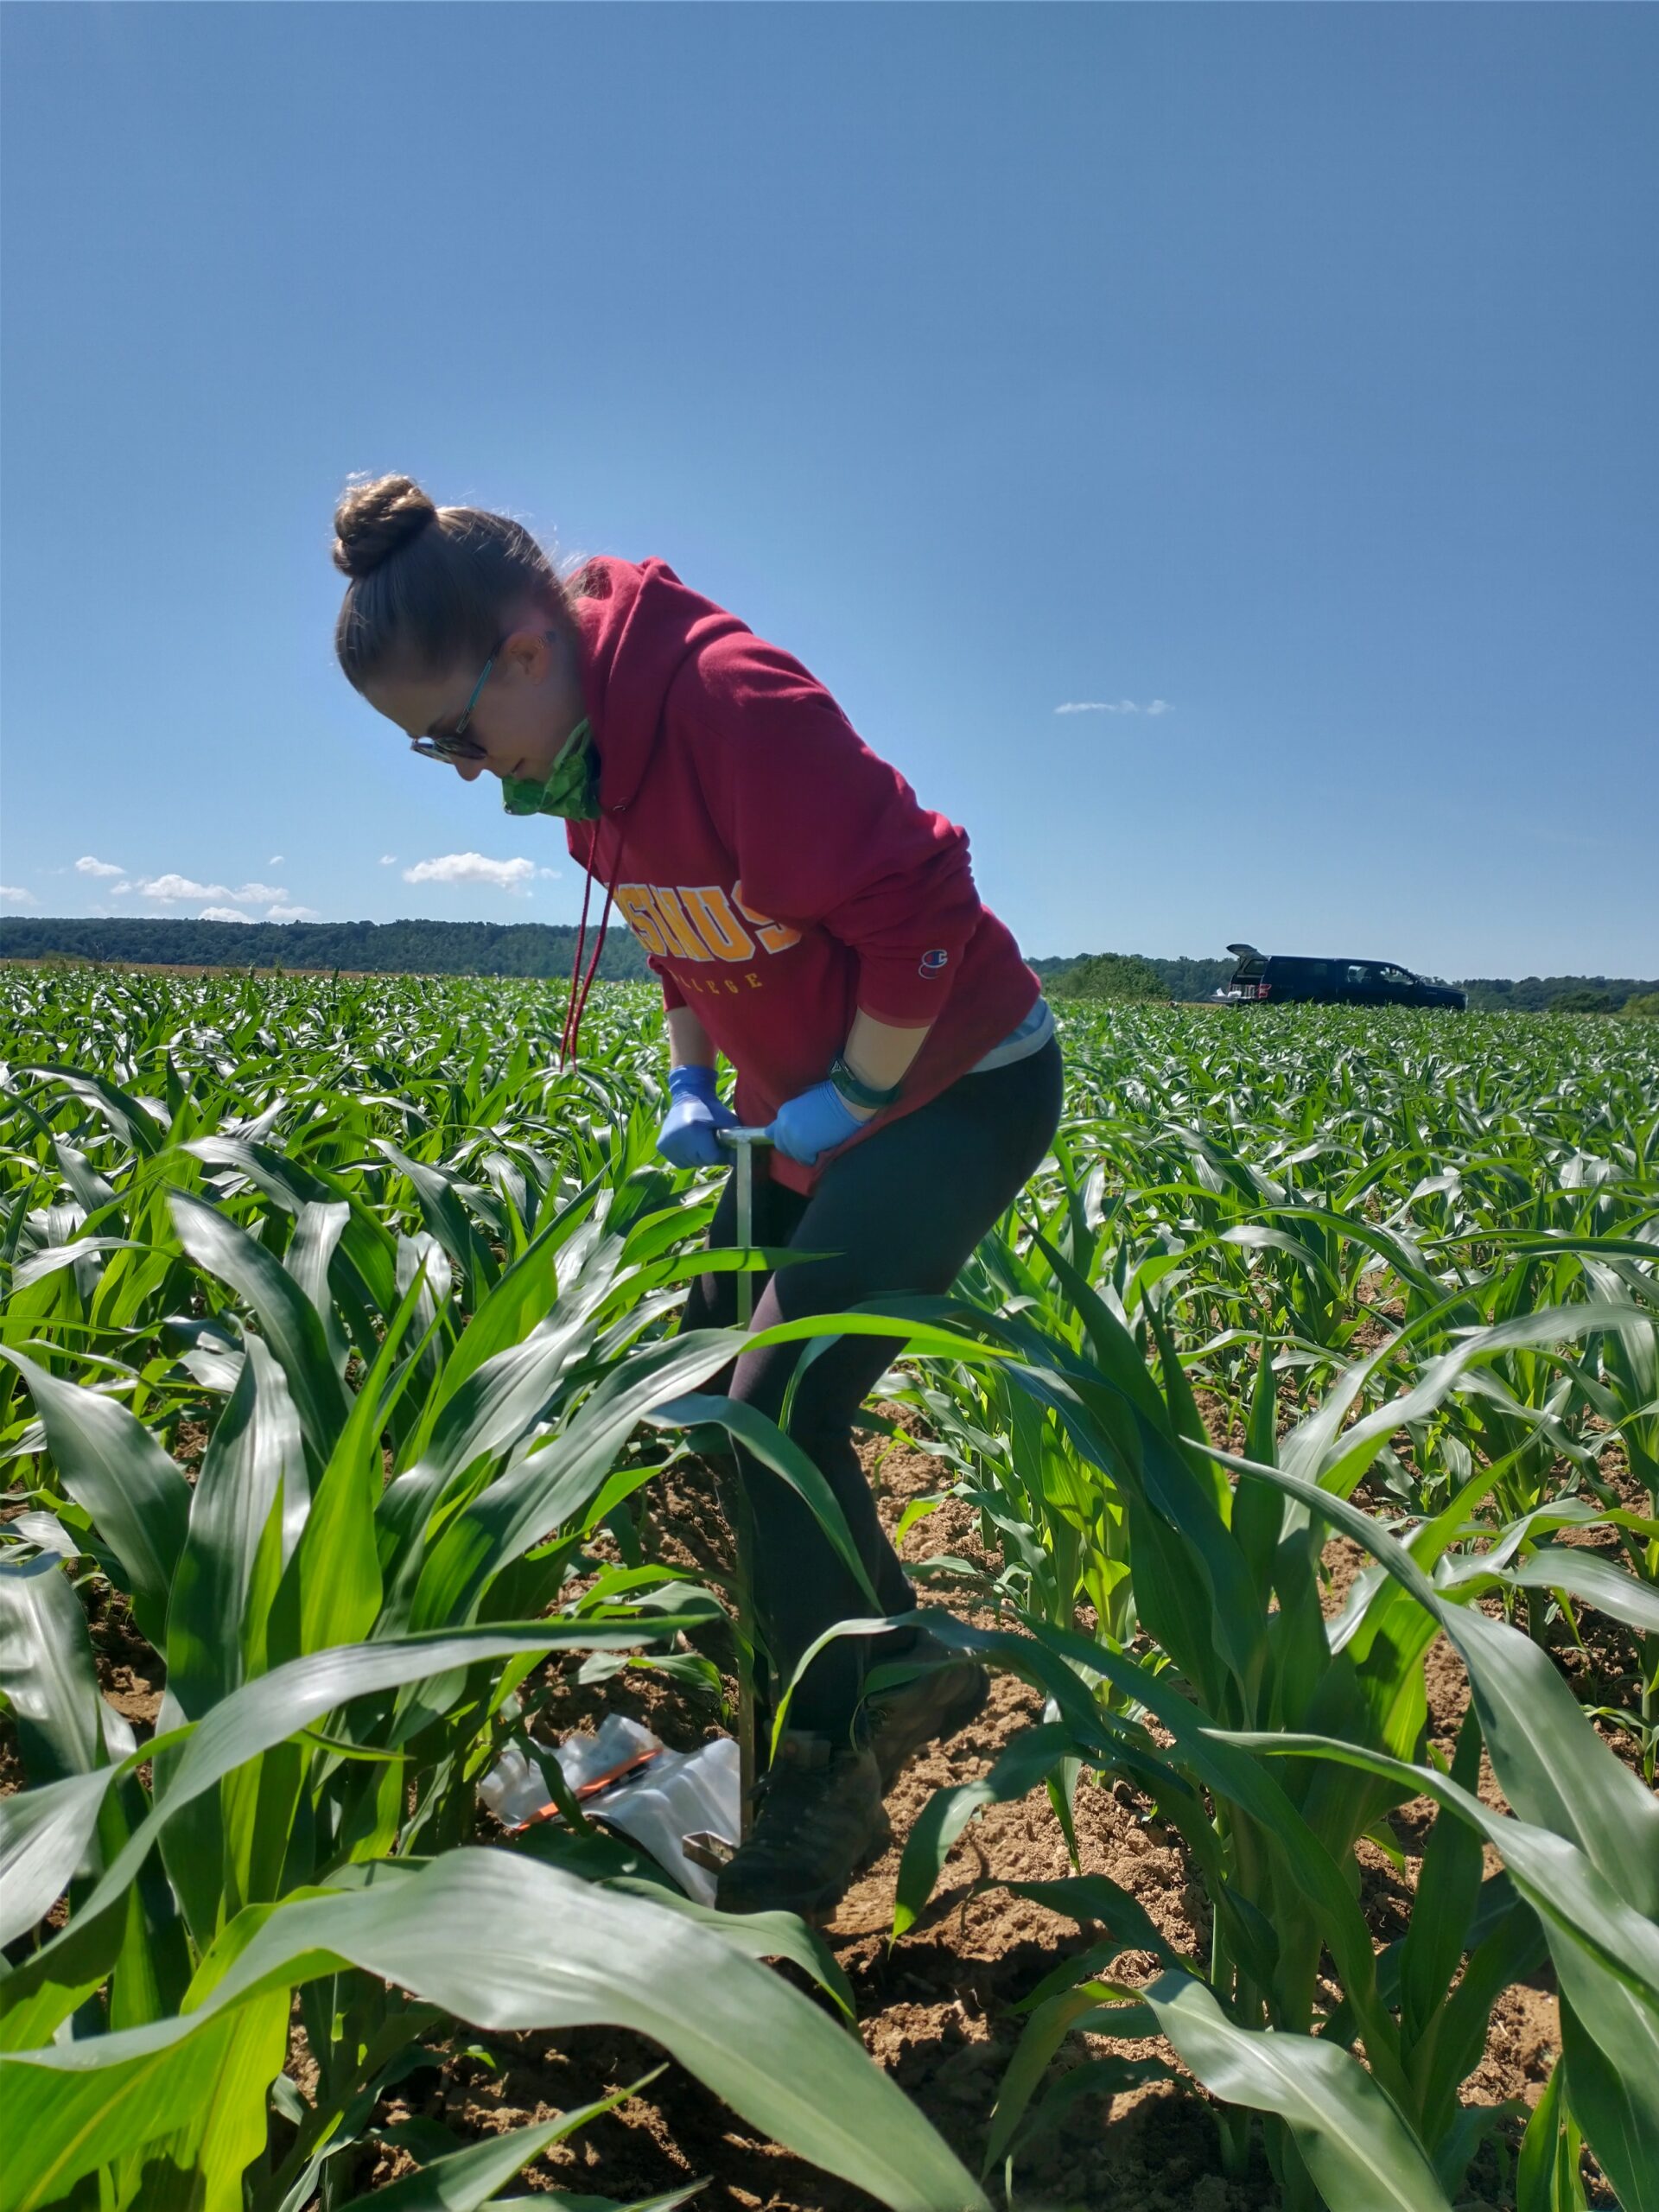
To accomplish the soil analysis related to the objectives of this study, soil samples were collected three times per year: before cover crop termination (baseline), during early corn growth (around V6 stage), and near corn harvest (Figure 2). Fifteen soil cores (1.9 cm diameter, 0-20 cm depth) were taken from random spots in each plot and combined into a composite sample. For analysis, 10 g of soil was extracted using 2M KCl and nitrate (NO3-) and ammonium (NH4+) were measured by Flow Injection Analysis (FIA). Another subsample was dried, ground, and sieved for further analysis. Total soil organic carbon (SOC) and nitrogen were determined by dry combustion. Baseline fertility tests measured P, K, Ca, Mg, S, Zn, and Cu using the Mehlich-3 method and inductively coupled plasma optical emission spectrometry (ICP-OES). Soil pH was measured in a 1:1 soil-water mixture, cation exchange capacity (CEC) was calculated from the Mehlich-3 extract, and soil texture was determined by the hydrometer method.
Cover crop biomass (Objective 1)
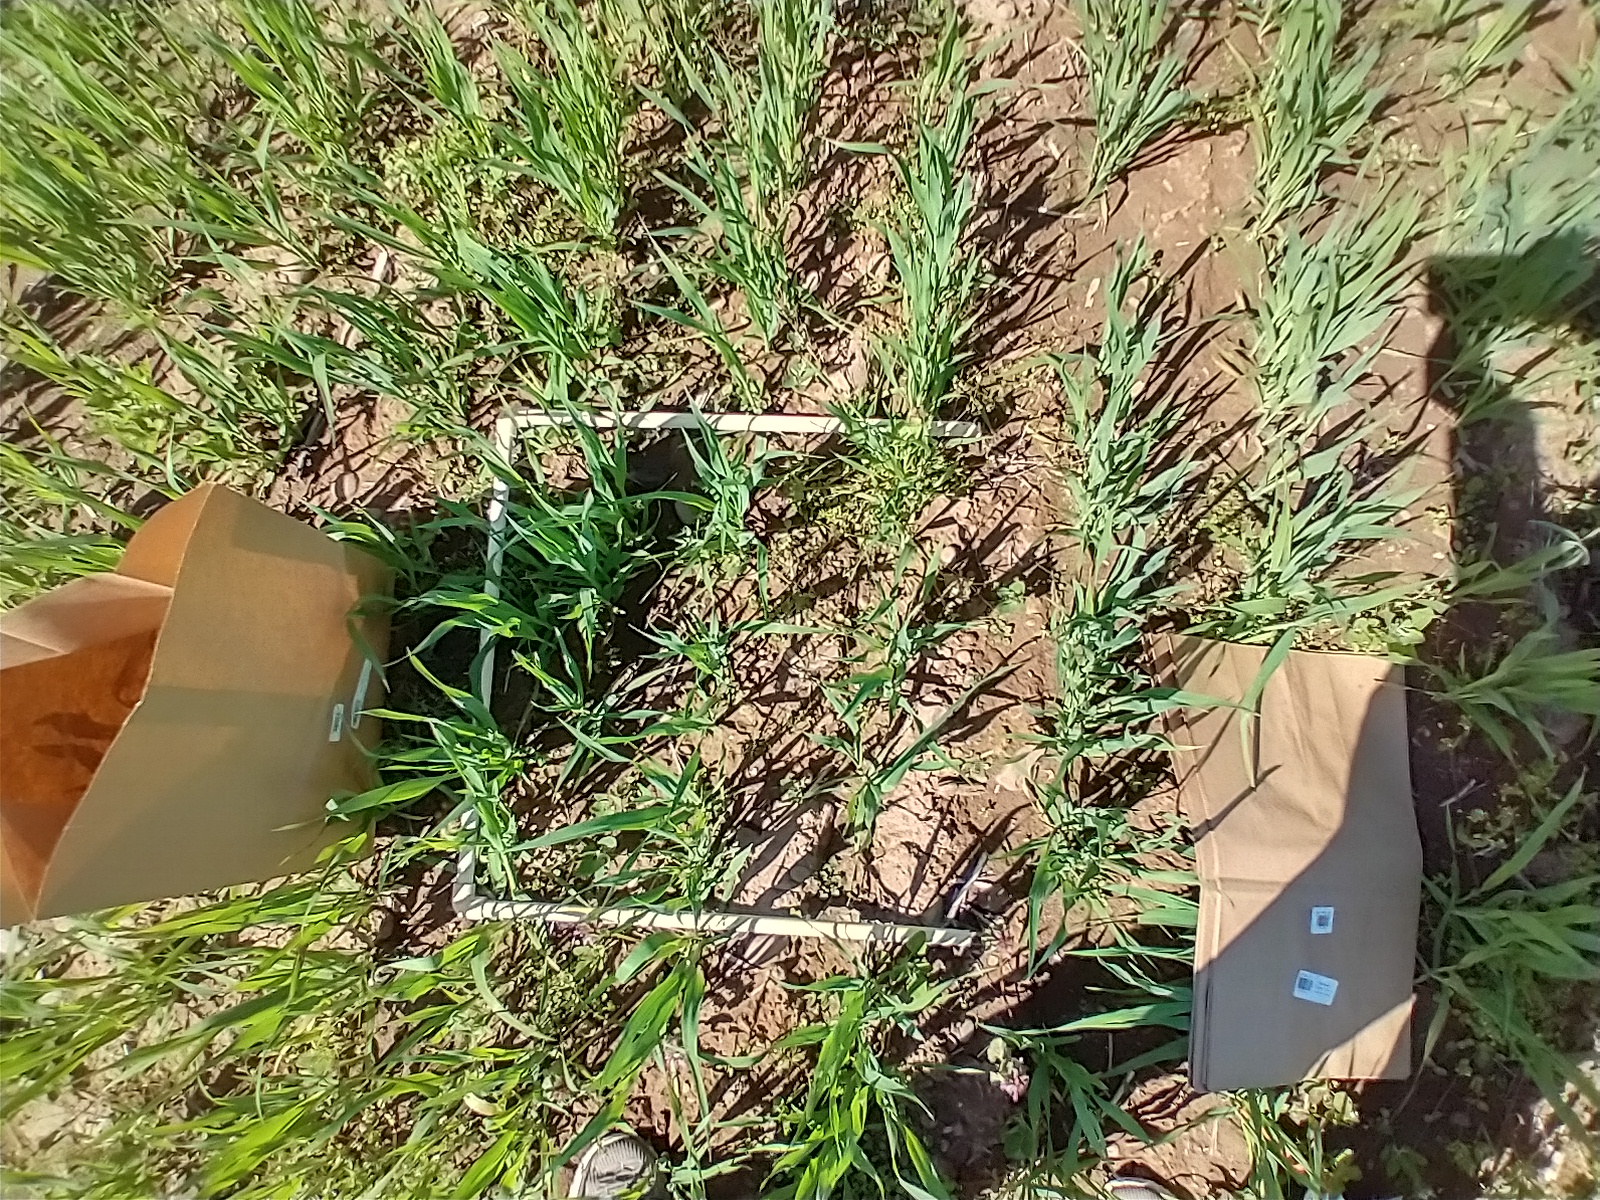
Cover crop biomass was measured in the spring just before termination, and for the Lancaster County farm in 2022, it was also measured in the fall when peak growth occurred, as the mix included species that die over winter. Biomass was collected by cutting the aboveground plants at soil level from two randomly selected small areas (0.25 m²) in each plot (Figure 3). The plant material was dried in an oven at 65°C for at least two weeks before the dry weight was recorded. The nitrogen content of the biomass was calculated by multiplying the total dry biomass (kg/ha) by the nitrogen concentration, which was determined through lab analysis.
Estimation of microbial carbon use efficiency (Objective 1 & 2)
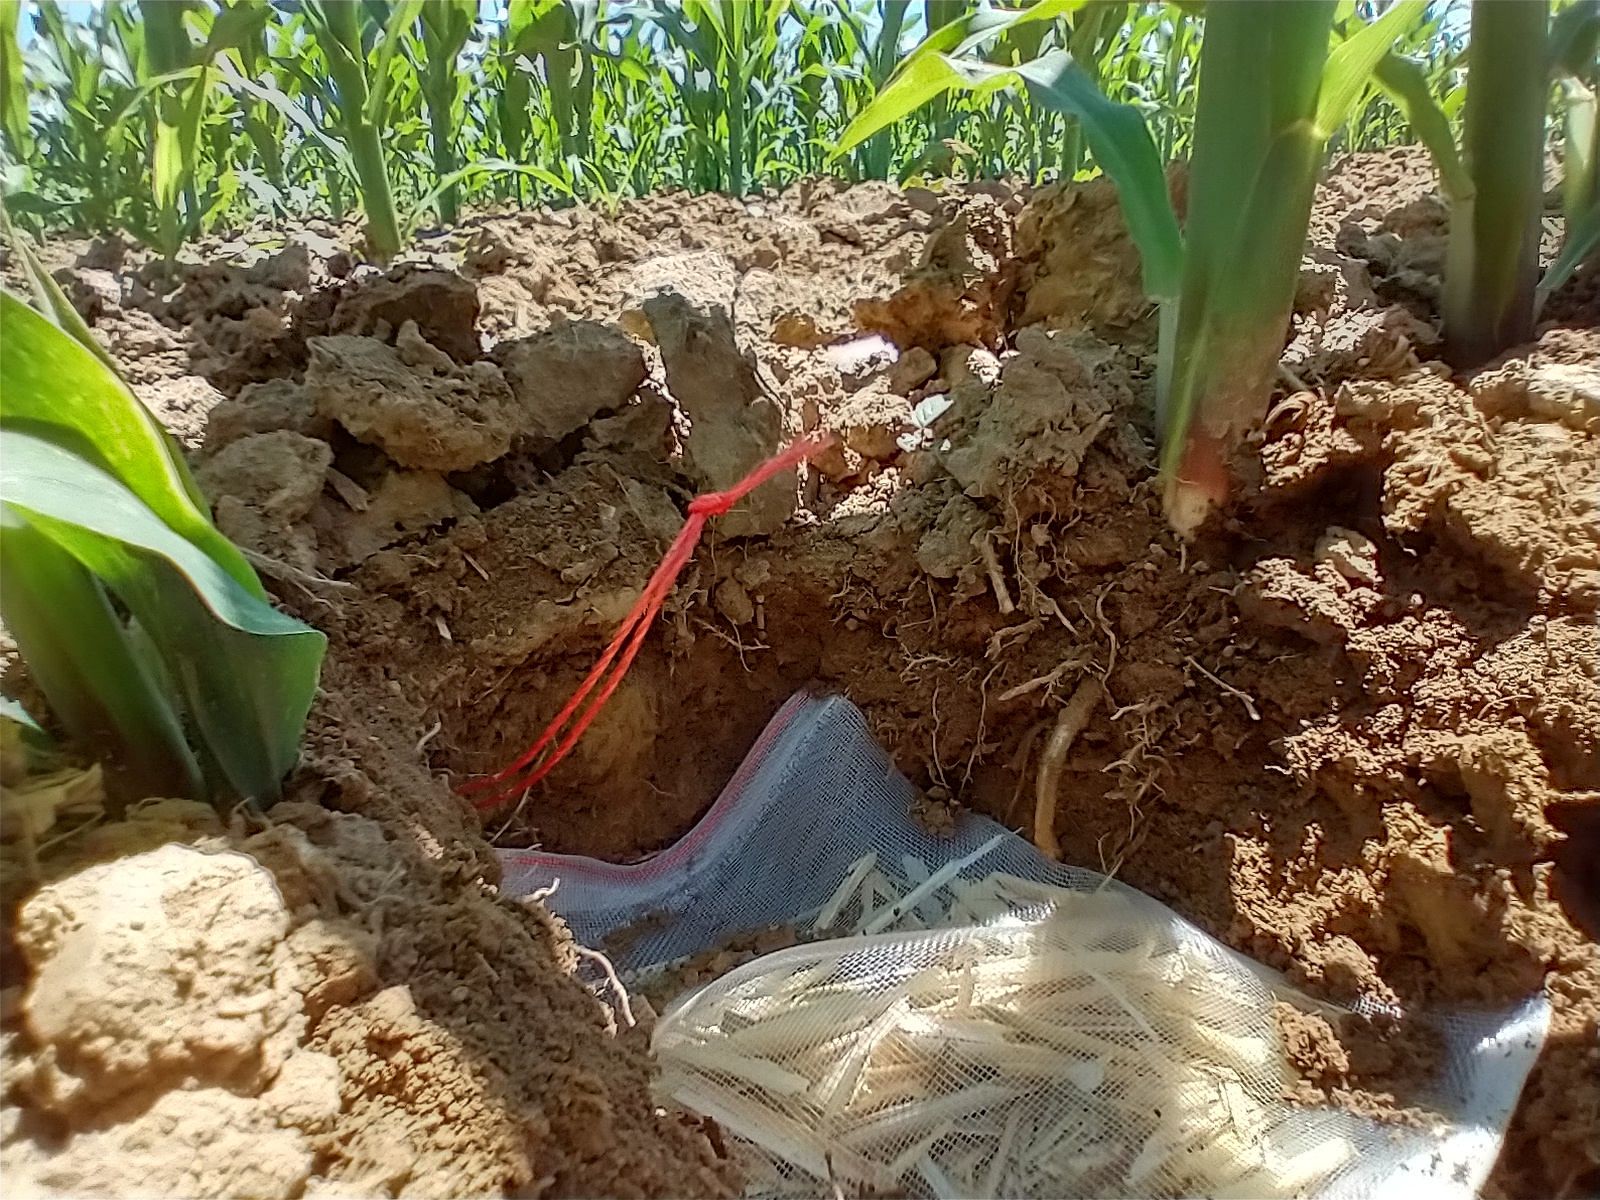
Microbial carbon use efficiency (CUE) and nitrogen mineralization were assessed using the buried litterbag technique. Litterbags, containing 5 grams of air-dried cover crop litter with varying C:N ratios (details in Table 3), were buried 10 cm deep in plots at the time of N fertilizer application, four weeks after corn planting (Figure 4). The litter was collected from field sites before termination, and the C and N concentrations were measured using dry combustion analysis. Each experimental plot received litterbags corresponding to three nitrogen rates: 0, 120, and 240 lb N/ac. Five litterbags for each C:N ratio were buried in each plot and periodically removed throughout the growing season. This allowed for tracking N release from the litter over time. Litterbags were rinsed at the start to account for leaching of soluble components, ensuring that measurements reflected the more stable fractions of biomass. The decomposition data were used to model CUE using the equation from Manzoni et al. (2008), which separates the effects of leaching and microbial processing on C and N losses.
Although the first method to evaluate microbial CUE was completed, the second procedure proposed in this study is still in progress. Briefly, soil samples were incubated for 5 days at 15°C before analysis. The 18O-water tracing method uses 18O-labeled water incorporated into microbial DNA to calculate total microbial growth and then microbial CUE. A subsample of soil (0.25 g) was labeled with 18O water to reach 20.0% 18O in the final soil water content. Samples were placed in vials to incubate at 15°C for up to 48 hours, during which microbial respiration was measured. After the incubation, a 1 mL gas sample was taken to determine CO2 concentration with a LICOR-7100 infrared gas analyzer. Soil was frozen at –20°C until DNA extraction. DNA extraction was conducted using a kit and following the manufacturer’s protocol (n=288). DNA samples were dried and sent to a lab facility for δ18O quantification. We are currently waiting to have this information to proceed with further steps. Cumulative respiration data described above will be used for the calculation of CUE with 18O-water according to Spohn et al. (2016b).
Microbial communities (Objective 2)
Phospholipid fatty acid (PLFA) analysis was conducted in July 2024 at a third-party lab on samples from the 2022 experiments, along with 10 samples from 2021 for cross-comparison. A preliminary analysis is included in this report. The Next Generation Sequencing (NGS) analysis, performed on 2021 samples, assessed the size, composition, and structure of the soil microbial community. DNA was extracted, and PCR targeted the amoA gene for nitrification potential, the V3 region of the 16S rRNA for bacteria, and the ITS1 region for fungi. Amplicon sequencing and bioinformatics was conducted at Penn State.
Agronomic measurements (Objective 3 & 4)
After corn reached maturity, yields at the commercial farm locations were measured by harvesting two rows, each five meters long. The plants were cut above the brace roots, with ears separated from the rest of the biomass. The ears were weighed, and a subsample of three ears per plot was analyzed for moisture content and shell-out percentage, allowing conversion of fresh ear weight to grain weight at 15.5% moisture. At the research station, corn was harvested using a small plot combined that measured grain weight and moisture content with an onboard scale and sensor.
An ANOVA was performed to identify outliers, using studentized residuals beyond ±2.5. An F-test (α = 0.10) was used to determine if the experiment was responsive to nitrogen (N) additions. If significant, a quadratic plus plateau model was applied to find the optimal N rate. The significance of the linear and quadratic terms was used to evaluate the N response. If the F-test showed significance but no visible response was apparent, least squares means were checked to see if the zero N treatment was significantly lower than other N levels. If not, the site was classified as non-responsive, following White et al. (2024) for recalibrating the pre-sidedress nitrate test (PSNT).
N recommendation model (Objective 3 & 4)
To improve nitrogen (N) fertilizer recommendations for corn, we adapted a biogeochemical model from Arrington et al. (2024), which is used in White et al.'s (2024) N fertilizer decision tool. The model takes into account N contributions from decomposing cover crops and the breakdown of soil organic matter. It includes microbial processes, considering microbial carbon use efficiency (CUE) and the C:N ratio between microbes and their food. Microbial CUE is based on soil texture (sand and clay content) and is averaged over the growing season. The model predicts corn yields without fertilizer by using N from the soil and cover crops, and the difference between this unfertilized yield and potential yield helps determine the N fertilizer recommendation. We modified the tool to factor in soil texture, C concentration, and C:N ratio, along with site-specific microbial CUE from litterbag decomposition, and compared these N recommendations to the agronomic optimum N rate for each site.
**The following results and discussion are based on preliminary findings, as these results will be integrated into my dissertation.
Research results and discussion according to objectives.
Objective 1 - Evaluate and understand the effect of cover crop residues and the quantity and type of supplemental N fertilizer inputs on microbial carbon use efficiency.
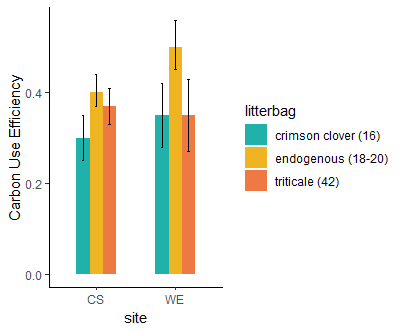
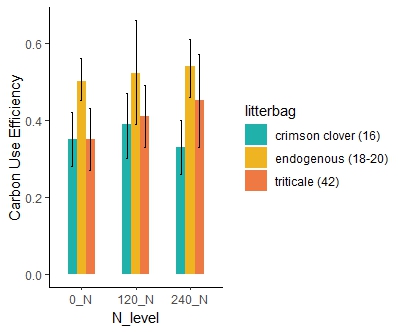
The cover crop practices across the two farms during the two years of the study (Table 3) showed a wide variation in the N content of the cover crop biomass. The N release patterns (Figure 5) for each site, based on the cover crop type (range of initial C:N ratio) and the added nitrogen fertilizer, showed how much nitrogen the cover crops contributed to the soil. This method allowed us to estimate the microbial CUE (Table3 and Figure 6 -7), a key parameter to adjust the nitrogen fertilizer recommendation tool. The study found that higher microbial CUE leads to nitrogen being tied up in the soil, while lower CUE supports nitrogen release. The specific CUE level that causes nitrogen tie-up depends on the soil type. Cover crops with a lower C:N ratio (16) maintained a stable CUE even with additional fertilizer (Figure 7), while cover crops with a higher C:N ratio (42) showed an increase in CUE with more fertilizer. When cover crops have a high C:N ratio, microbes may need more nitrogen fertilizer to break down efficiently the carbon in the residues from cover crops. Litter from cover crops grown on each farm had notably higher CUE, possibly because the microbial community there is better adapted to decompose that specific cover crop type.
Table 3 - Cover crop types, characterization of biomass N content, and C:N ratio across sites
|
*Farm Location |
Cover crop species |
Plots n |
Winter-killed cover crop N (kg of N ha) |
Winter-hardy cover crop N (kg of N ha) |
Winterhardy C:N (g/g) |
|
Site 1 |
OA |
4 |
- |
85 |
17 |
|
Site 2 |
RG + CC |
4 |
- |
100 |
15 |
|
Site 3 |
CC |
4 |
- |
155 |
14 |
|
Site 4 |
TR |
4 |
- |
65 |
32 |
|
Site 5 |
No cover |
4 |
- |
- |
- |
|
Site 6 |
TR + CC +WP + RC + RY |
4 |
- |
237 |
13 |
|
Site 7 |
TR + CC + WP + OA + FR |
4 |
92 |
65 |
15 |
|
Site 8 |
CC |
4 |
- |
45 |
13 |
|
Site 9 |
TR |
4 |
- |
29 |
32 |
|
Site 10 |
No cover |
4 |
- |
- |
- |
*Farm sites 1 to 5 correspond to experiments conducted in 2021, while farm sites 6 to 10 correspond to experiments conducted in 2022. † FR, forage radish (Raphanus sativus L.); OA, oat (Avena sativa L.); RC, red clover (Trifolium pratense L.); CC, crimson clover (Trifolium incarnatum L. ‘Dixie’); RG, annual ryegrass (Lolium multiflorum Lam.); SB, soybean [Glycine max (L.) Merr.]; TR, triticale (× Triticosecale Wittm. ex A.); WH, wheat (Triticum aestivum); WP, winter pea (Pisum sativum)
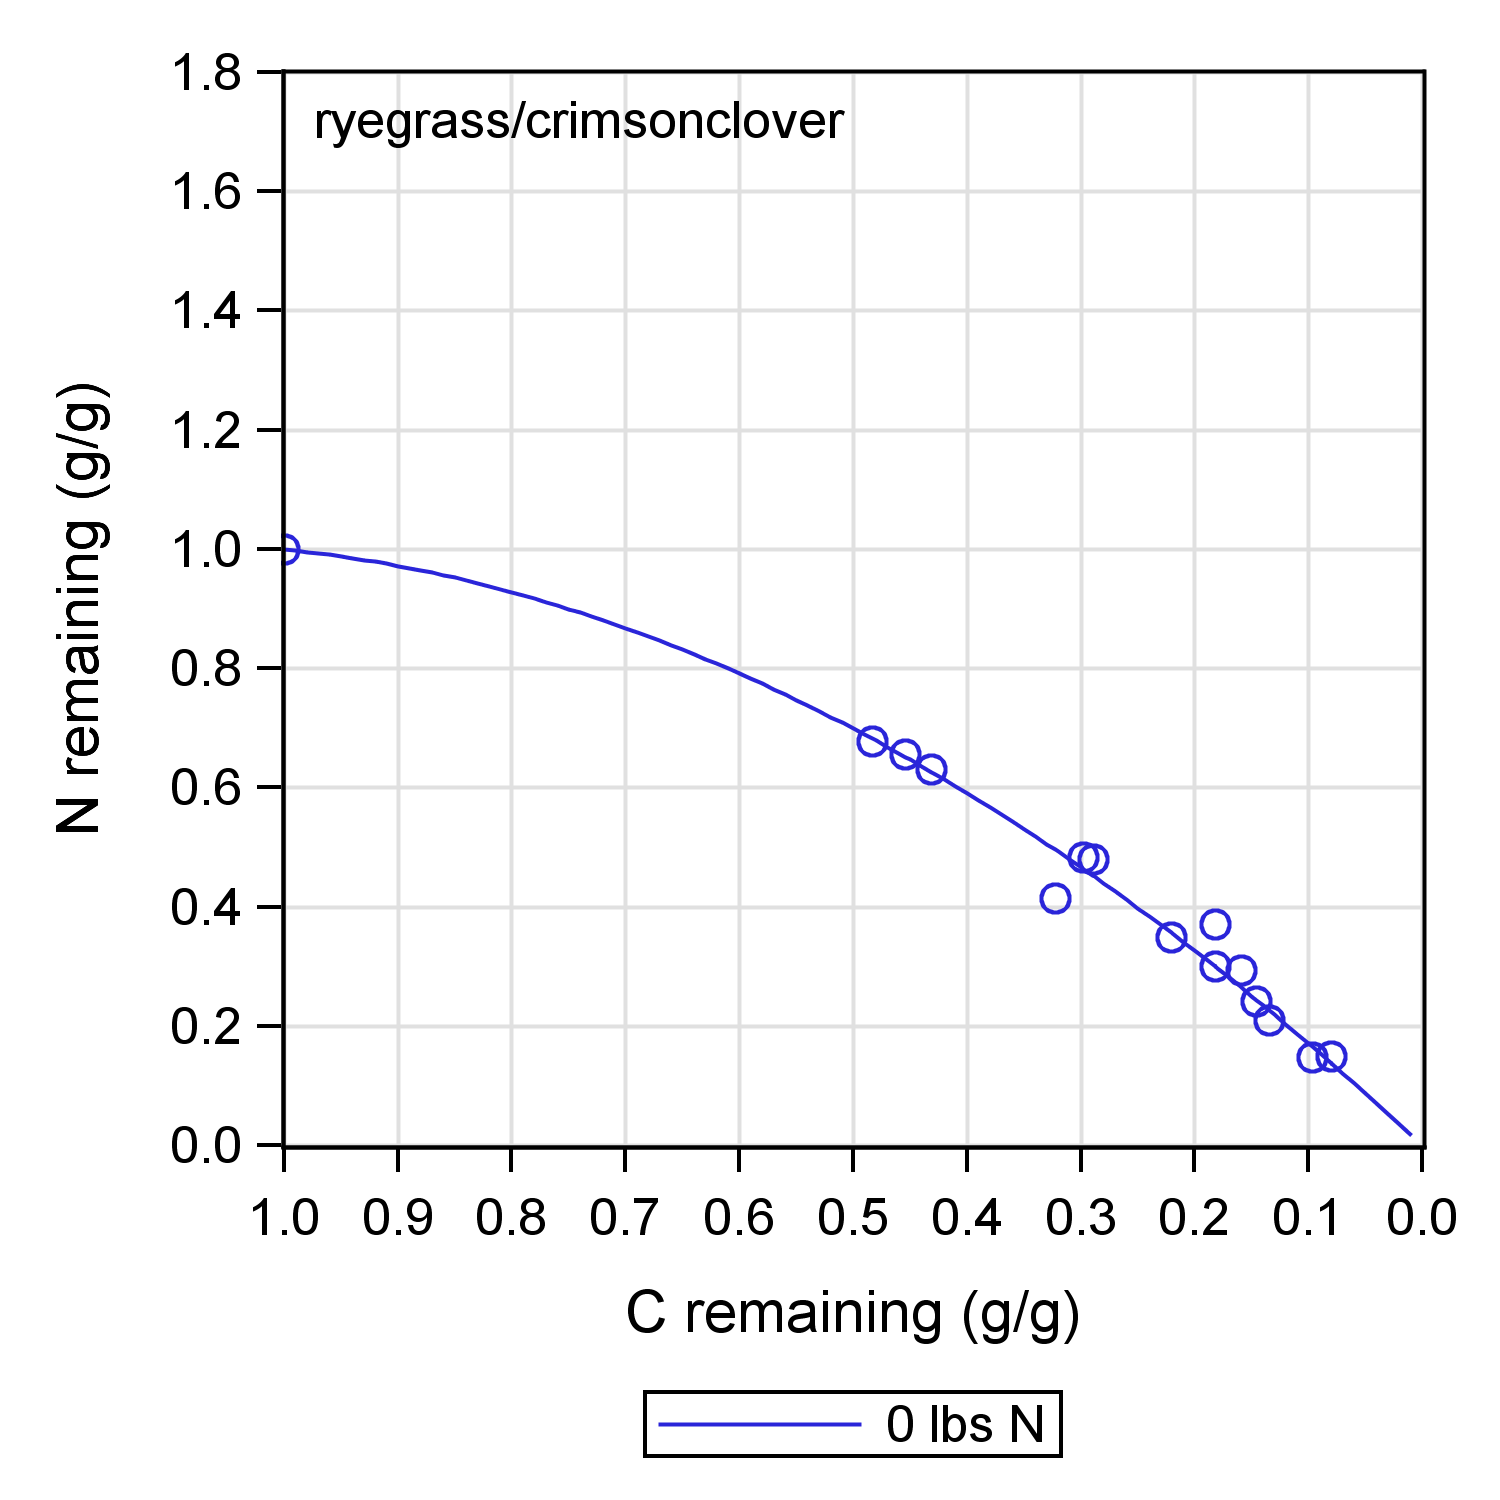
Figure 5 - Carbon and nitrogen release curves based on litterbag samples collected throughout the corn growth period.
Table 4. Estimated microbial carbon use efficiency (CUE) by litterbag type across study sites.
|
Farm |
Litterbag cover crop type |
Estimated CUE ± SE (95% Confidence Level) |
Soil Critical C:N
|
|
Site 1 |
CC |
0.382 ± 0.060 (0.261-0.503) |
26 |
|
|
TR |
0.486 ± 0.214 (0.443-0.529) |
21 |
|
|
OA |
0.825 ± 0.017 (0.790-0.860) |
12 |
|
Site 2 |
CC |
0.359 ± 0.021 (0.316-0.402) |
28 |
|
|
TR |
0.396 ± 0.020 (0.343-0.448) |
25 |
|
|
RG + CC |
0.519 ± 0.021 (0.476-0.562) |
19 |
|
Site 3 |
CC |
0.420 ± 0.033 (0.354-0.486) |
24 |
|
|
TR |
0.491 ± 0.024 (0.444-0.539) |
20 |
|
Site 4 |
CC |
0.356 ± 0.033 (0.289-0.423) |
28 |
|
|
TR |
0.423 ± 0.016 (0.391-0.454) |
24 |
|
Site 5 |
CC |
0.493 ± 0.022 (0.425-0.560) |
20 |
|
|
TR |
0.423 ± 0.014 (0.393-0.453) |
24 |
|
Site 6 |
CC |
0.557 ± 0.116 (0.325-0.789) |
33 |
|
|
TR |
0.522 ± 0.028 (0.465-0.580) |
23 |
|
|
TR + CC +WP + RC + RY |
0.316 ± 0.041 (0.233-0.380) |
31 |
|
Site 7 |
CC |
0.307 ± 0.036 (0.234-0.380) |
18 |
|
|
TR |
0.436 ± 0.009 (0.416-0.460) |
19 |
|
|
TR + CC + WP + OA + FR |
0.326 ± 0.016 (0.294-0.359) |
32 |
|
Site 8 |
CC |
0.390 ± 0.080 (0.228-0.552) |
26 |
|
|
TR |
0.454 ± 0.020 (0.414-0.494) |
22 |
|
Site 9 |
CC |
0.395 ± 0.014 (0.367-0.424) |
29 |
|
|
TR |
0.400 ± 0.014 (0.367-0.424) |
25 |
|
Site 10 |
CC |
0.197 ± 0.028 (0.142-0.253) |
51 |
|
|
TR |
0.387 ± 0.014 (0.358-0.415) |
26 |
† FR, forage radish (Raphanus sativus L.); OA, oat (Avena sativa L.); RC, red clover (Trifolium pratense L.); CC, crimson clover (Trifolium incarnatum L. ‘Dixie’); RG, annual ryegrass (Lolium multiflorum Lam.); TR, triticale (× Triticosecale Wittm. ex A.); WP, winter pea (Pisum sativum). Soil critical C:N ratio is calculated as 10/CUE where 10 is assumed microbial biomass C:N.
Objective 2. Assess whether microbial communities (e.g., fungal: bacteria ratios, ammonia-oxidizing bacteria) respond to different availability of carbon and nitrogen resources and determine if this influences carbon use efficiency and enzyme activity
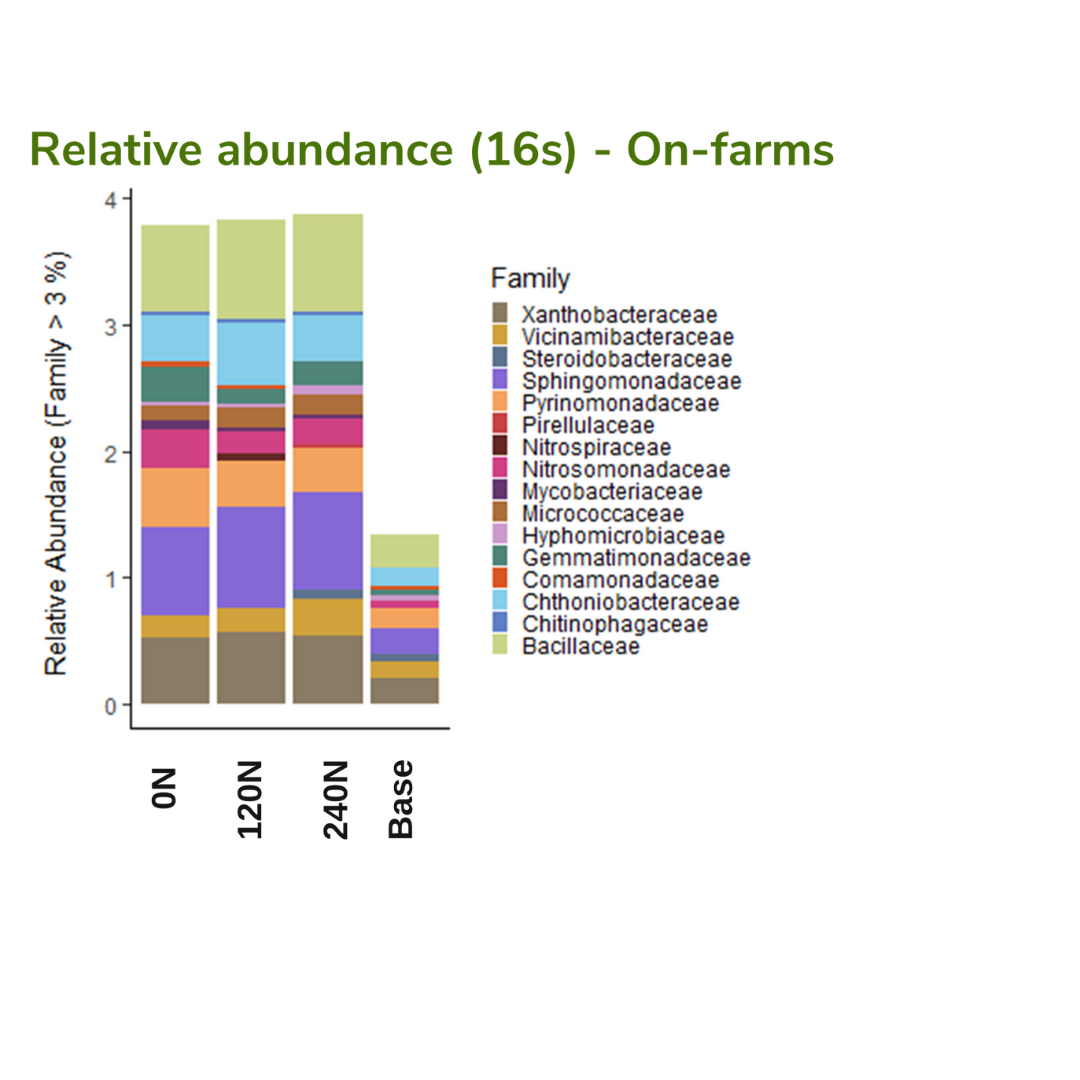
The Next Generation Sequencing analysis was used to evaluate the soil microbial community. Preliminary results (Figure 8) showed slight changes in the relative abundance of the bacterial community (family level) across the different N additions (p-value > 0.05) but a significant change between on-farms (p-value = 0.001) and lapse of time from cover crop termination to the corn harvest (p-value=0.001). Interestingly, the bacterial community presented an increase in the relative abundance from base soil samples obtained a couple of weeks before cover crops were terminated and before corn was planted to soil samples obtained when corn was growing. Living vegetation such as corn and cover crops provides highly labile C sources through root exudates; however, comparing the root system from both types of crops, corn could provide more inputs of labile C sources that provide an energy source to microorganisms. Another aspect to consider in this preliminary analysis is the behavior of bacteria from the family Nitrosomonadacea. The Nitrosomonadacea family group is responsible for transforming ammonia to nitrate. The group showed a decrease in relative abundance while increasing the supplemental N addition; this could be related to the nitrate added in fertilizer.
The PLFA analysis conducted on samples collected in 2022 from sites 6-10 showed significant differences across sites, N levels, and sampling events in terms of total living organisms, total bacteria, and total fungi (Table 5). When the fungi:bacteria ratio was evaluated across sites, it remained consistent with values ranging between 0.2 and 0.3. A higher fungi:bacteria ratio indicates that fungi dominate the microbial community, which is often related to active organic matter decomposition of materials rich in C. Furthermore, site 9 had the highest fungi:bacteria ratio, likely because of the presence of cover crop residues with a higher C:N ratio, triticale monoculture. This suggests that the higher C:N ratio from triticale cover crops residues at site 9 may have promoted fungal dominance, as fungi are more efficient at breaking down complex, and C rich residues than bacteria.
Table 5. Statistics from ANOVA comparing PLFA results among N levels, sampling events and farm locations (sites)
|
Factor |
Total living microbial biomass |
Total bacteria |
Total fungi |
||||
|
df |
F value |
Pr (>F) |
F value |
Pr (>F) |
F value |
Pr (>F) |
|
|
Site |
8 |
13.99 |
*** |
15.60 |
*** |
12.35 |
*** |
|
N level |
9 |
3.33 |
** |
3.32 |
** |
4.24 |
*** |
|
Sampling event |
2 |
4.06 |
* |
2.57 |
- |
11.81 |
*** |
|
Site * N level |
16 |
1.57 |
- |
1.60 |
- |
2.42 |
** |
|
Site * Sampling event |
4 |
7.79 |
*** |
5.45 |
*** |
6.65 |
*** |
|
N level * Sampling event |
7 |
3.64 |
** |
3.42 |
** |
3.45 |
** |
|
Site * N level * Sampling event |
7 |
1.12 |
N.S. |
0.914 |
N.S. |
1.37 |
N.S. |
|
Residuals |
79 |
|
|
|
|
|
|
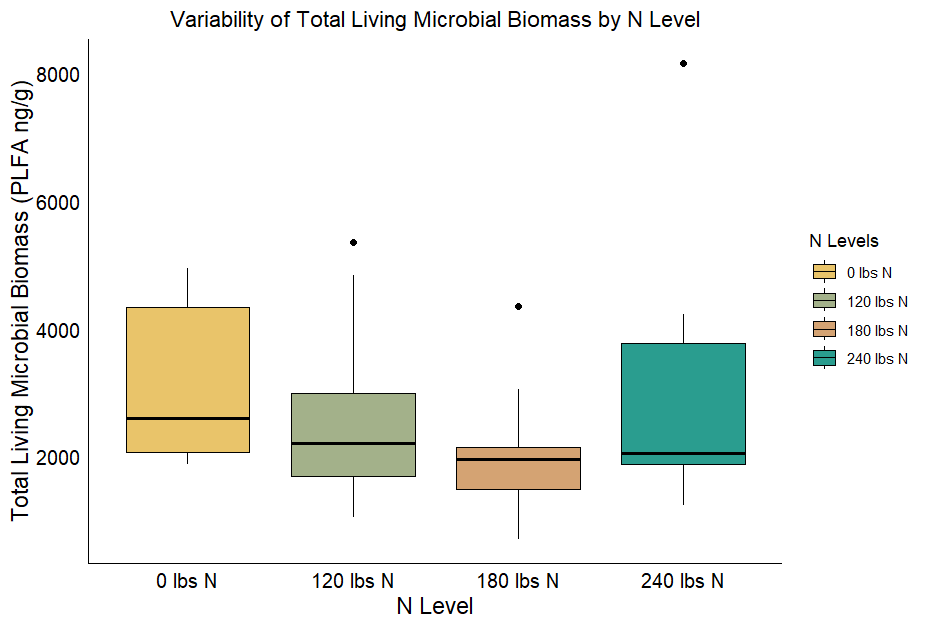
Figure 9 - Boxplots showing the variation in the total living microbial biomass between different N levels for experiments conducted in 2022.
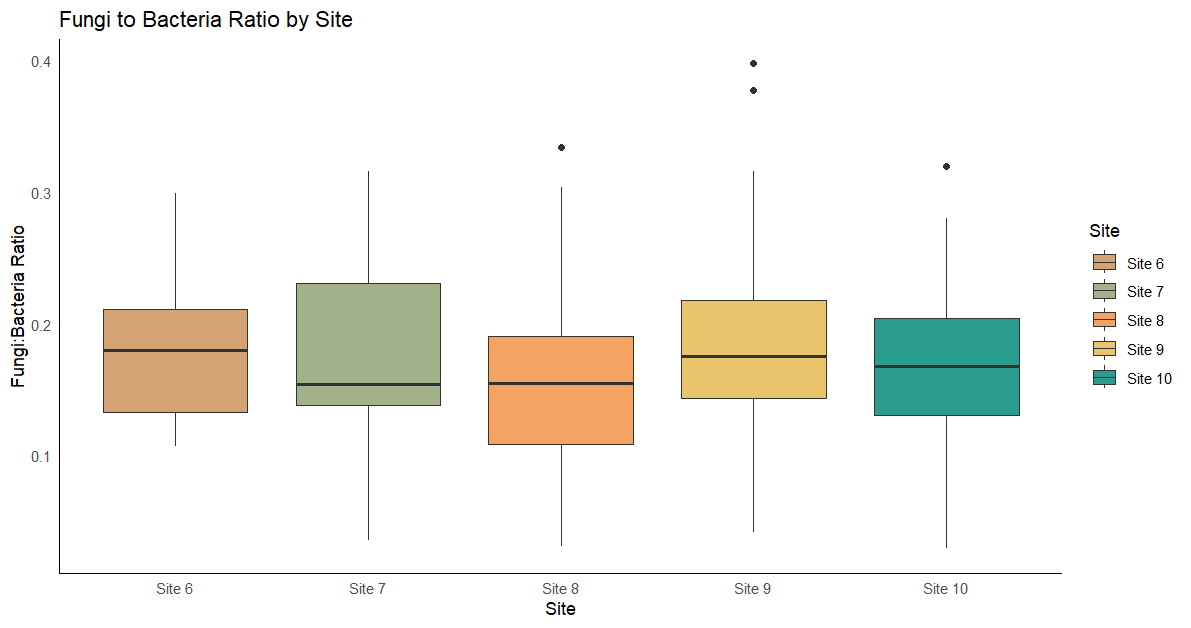
Figure 10 - Boxplots showing the variation in the fungi-to-bacteria ratio across sites for experiments conducted in 2022.
Objective 3 - Determine if factors that control microbial CUE could be used to improve a nitrogen fertilizer recommendation tool that relies on an estimate of CUE to calculate N mineralization of cover crop residues and soil organic matter.
The analysis of soil properties reflected differences between sites (Table 6). The soil pH values have a range from 6.20 to 7.34, the average P levels was 56 ppm and K levels 131 ppm. Nutrient concentrations and soil properties showed statistically significant variation among sites, except sulfur (S). The analysis of soil inputs for the N tool biochemical equation showed variations in soil C, N, and soil texture properties between farm locations (Table 7). Soil C percentages ranged from 1.24% to 1.96%, while soil N varied between 0.11% and 0.20%. The C:N ratio was consistent at most sites, with values ranging from 9 to 14. Soil texture characteristics also were different across the sites, where sand content varied significantly, with the highest value recorded at site 1 (with 67%) and the lowest at site 2 (with 17%). These variations in soil properties between farm locations provided the opportunity to test the N decision support tool under a range of conditions.
An ANOVA test analyzing the interaction between N levels and sites showed that CUE varied significantly across sites but was not affected by N levels. Although initial results from 2021 showed variation in CUE among different N levels for endogenous cover crops (those cover crops grown on the farm), the overall analysis indicated that N levels did not have a significant effect. These findings suggest that further investigation into the Home Field Advantage hypothesis could be valuable. This would enable to explore whether cover crops grown on the farm in 2021 exhibited enhanced CUE due to microbial communities that had adapted specifically to those cover crops. This could provide insights into how local microbial adaptations influence nutrient cycling and C processing in agroecosystems.
Table 6. Soil properties from all sites and results from an ANOVA test (α = 0.05).
|
Farm Location |
soil pH |
M3-P |
M3-K |
Ca
|
Mg |
S |
CEC |
OM % |
||
|
|
|
(meq/100g) |
||||||||
|
Site 1 |
6.88 ab |
95 a |
141 abc |
1162 bcd |
77 b |
9 |
7.3 b |
1.77 d |
||
|
Site 2 |
6.74 ab |
82 a |
123 abc |
1759 a |
130 a |
14 |
11.25 a |
3.28 a |
||
|
Site 3 |
6.70 b |
37 b |
130 abc |
1259 bcd |
153 a |
8 |
9.47 ab |
2.20 cd |
||
|
Site 4 |
6.48 b |
36 b |
150 ab |
1100 d |
112 ab |
8 |
9.10 ab |
2.26 cd |
||
|
Site 5 |
6.45 b |
42 b |
155 a |
1074 d |
106 ab |
9 |
9.02 ab |
2.34 cd |
||
|
Site 6 |
7.15 a |
75 ab |
98 bc |
1503 abc |
153 a |
9 |
9.05 ab |
2.61 bc |
||
|
Site 7 |
6.86 ab |
75 ab |
96 c |
1543 ab |
123 ab |
17 |
9.47 ab |
2.97 ab |
||
|
Site 8 |
6.52 b |
42 b |
138 abc |
1138 dc |
133 a |
8 |
8.88 ab |
1.93 d |
||
|
Site 9 |
6.49 b |
42 b |
143 abc |
1066 d |
110 ab |
7 |
9 ab |
2.12 cd |
||
|
Site 10 |
6.60 b |
39 b |
144 ab |
1232 bcd |
150 a |
15 |
9.35ab |
2.09 cd |
||
Table 7: Soil inputs for N Tool biochemical equations in the model
|
Farm location |
Soil % C |
Soil % N |
Soil C: N |
Sand % |
Clay % |
|
Site 1 |
1.53 |
0.11 |
14 |
67 |
12 |
|
Site 2 |
1.96 |
0.20 |
10 |
17 |
30 |
|
Site 3 |
1.33 |
0.14 |
10 |
36 |
24 |
|
Site 4 |
1.38 |
0.14 |
10 |
36 |
25 |
|
Site 5 |
1.43 |
0.14 |
10 |
31 |
26 |
|
Site 6 |
1.52 |
0.17 |
9 |
20 |
30 |
|
Site 7 |
1.74 |
0.20 |
9 |
28 |
26 |
|
Site 8 |
1.24 |
0.12 |
10 |
35 |
24 |
|
Site 9 |
1.31 |
0.13 |
10 |
35 |
25 |
|
Site 10 |
1.29 |
0.13 |
11 |
30 |
27 |
Table 8: Statistics comparing the differences and interactions among N levels, and sites for estimates obtained from microbial carbon use efficiency using litterbags.
|
Factor |
df |
F test |
Pr(>F) |
|
Site |
9 |
4.70 |
*** |
|
N level |
1 |
0.79 |
N.S. |
|
Site*N level |
9 |
0.61 |
N.S. |
|
Residual |
179 |
|
|
Objective 4 - Compare corn yield response to supplemental N fertilizer additions to the recommended N application rate from the decision support tool and evaluate how adjusting CUE in the decision support tool with field measured CUE improves the tool’s prediction
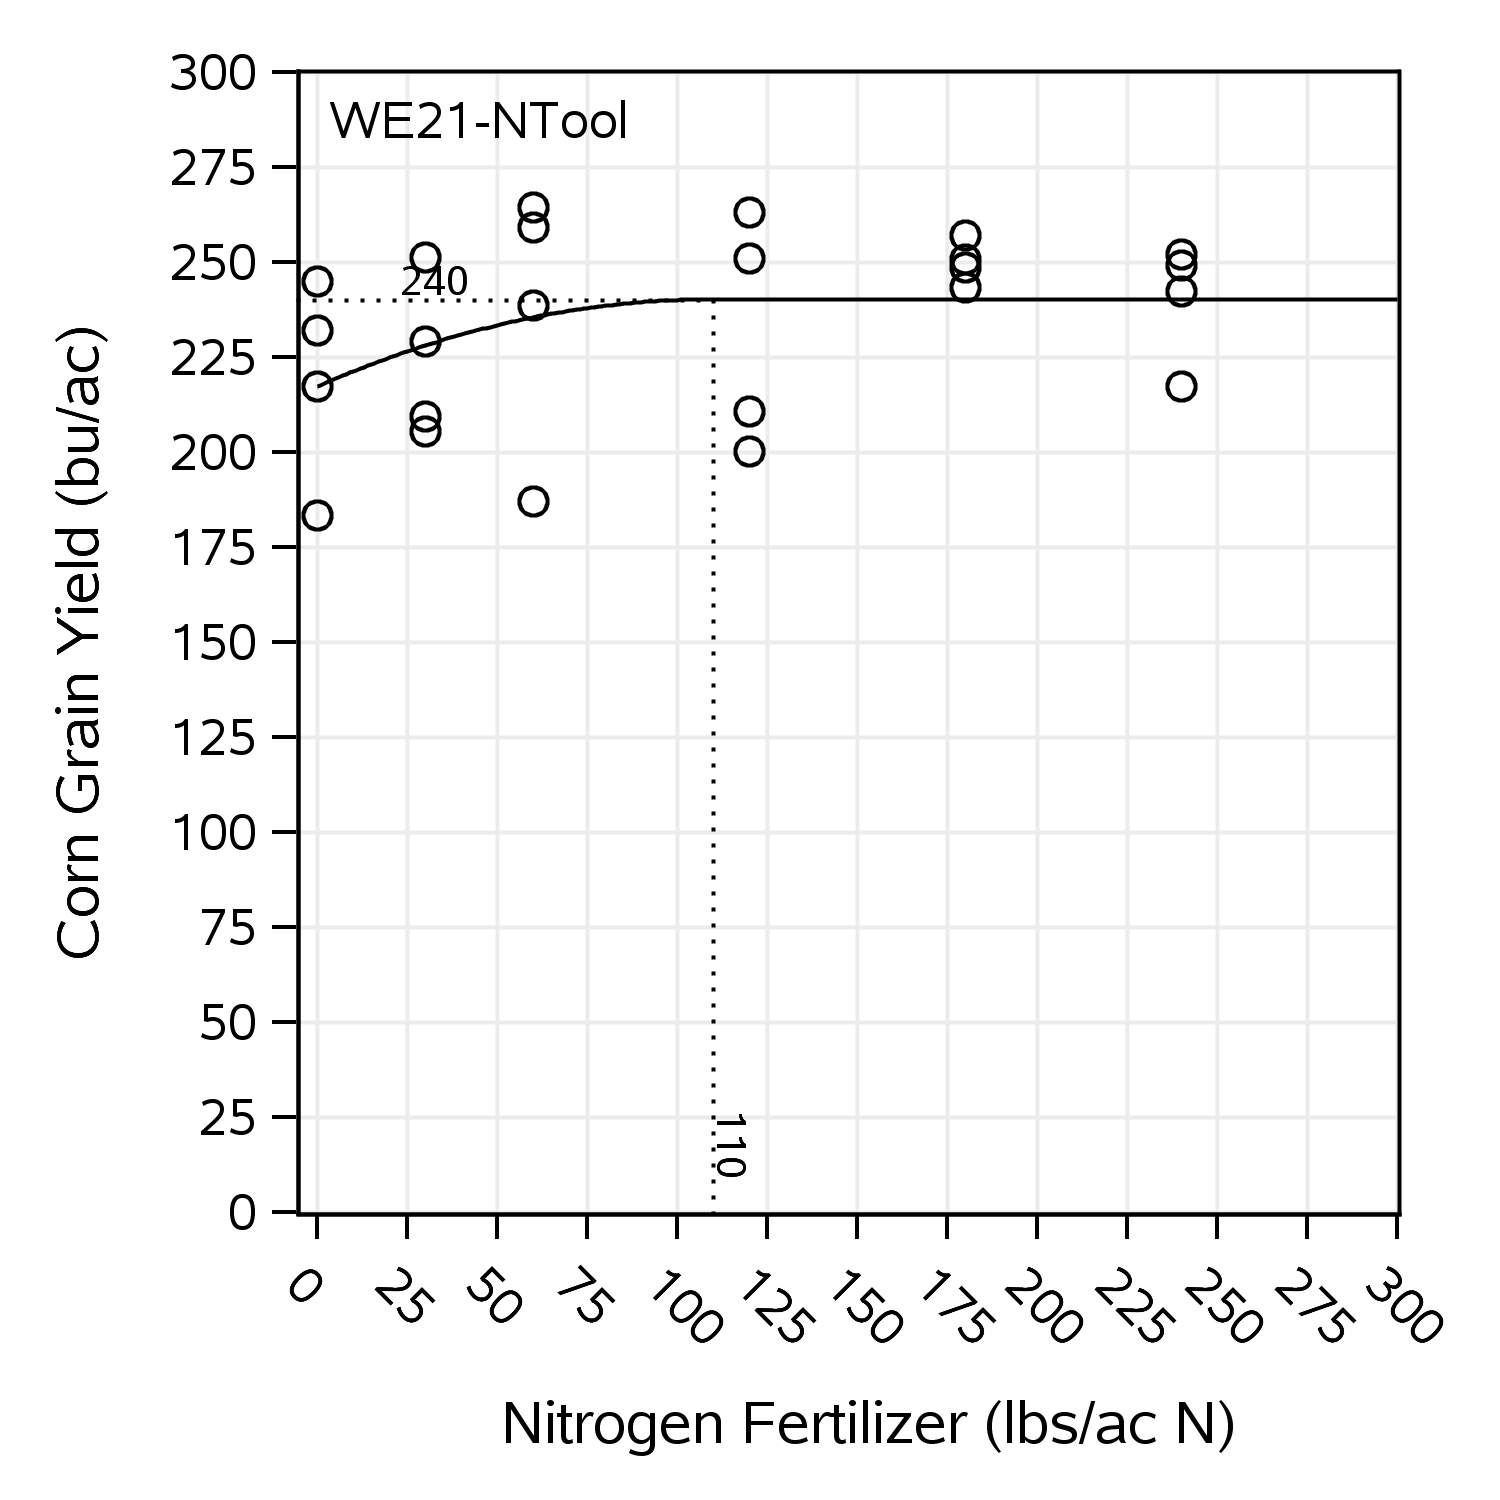
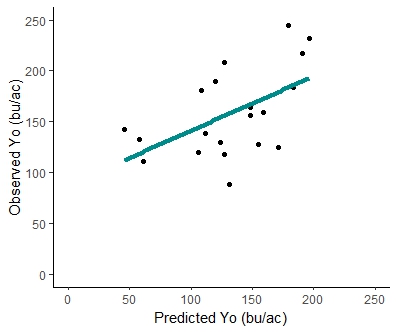
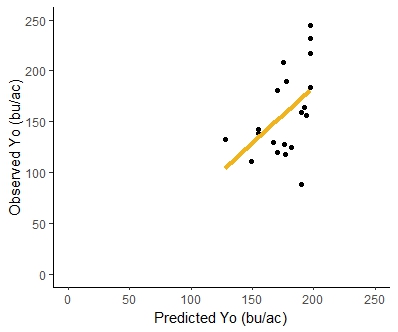
The unfertilized yield for on-farm 1 was consistent for both years, resulting in 220 bu/ac for the first year and 217 bu/ac for the second year. The unfertilized yield at the on-farm 2 was 174 bu/ac for the first year and 130 bu/ac for the second year. Table 9 summarizes the experimental yield with unfertilized plots, the corn yield goal where the response curve reaches the plateau, and the N supplemental addition required to achieve the corn yield goal (Nx). The response curve was developed for each on-farm site per year; Figure 11 shows an example. A scatter plot comparing the unfertilized corn yield observed to the predicted unfertilized corn yield from the decision tool (Figure 12) resulted in an R2 = .47 (p-value=0.003), with a linear equation of y=0.68x+73.72. The estimated values from the decision tool are derived from estimated CUE values that predict cover crops and soil organic matter credits. To evaluate how adjusting CUE in the decision support tool with field-measured CUE from the litterbag study could improve the tool's prediction, two different regression analyses were compared: 1. using measured litterbag CUE to predict both cover crops and soil organic matter credits, and 2. using litterbag CUE only to estimate cover crop credits, while using tool's biogeochemical equations to estimate soil organic matter credits. The first analysis showed an R2=0.19 (p-value=0.08) and the linear equation y=1.16x - 41.82, indicating a poor fit using litterbag CUE to estimate cover crops and soil organic matter credits. However, the latter analysis showed an R2=0.36 (p-value=0.01) with the linear equation y=0.81x+44.23 (Figure 13), indicating a better fit even than when the tool's equation estimated for both types of N credits (cover crops and soil organic matter). The better fit could be due to litterbag CUE values coming directly from cover crops litter, while estimated CUE from biogeochemical equations in the tool use soil texture. Soil texture impact directly the decomposition of soil organic matter pools.
Table 9: On-farm experimental yields and corn yield goals in bu/ac.
| Year 1 | Year 2 | |||
| On-farm 1 | On-farm 2 | On-farm 1 | On-farm 2 | |
| Experimental Y0 (bu/ac) | 220 | 174 | 217 | 130 |
| Corn yield goal (plateau) (bu/ac) | 240 | 200 | 230 | 158 |
| Experimental Nx (lbs N/ac) | 110 | 25 | 0 | 4 |
Table 10 – Parameter estimations (Mg/ha) and statistics for the response curves in quadratic plus plateau models.
|
|
Parameter Estimates |
||||||
|
Farm Location |
Pr > |t| |
a |
b |
c |
Plateau |
xp |
df |
|
Site 1 |
0.6385 |
9.27 |
0.059 |
6.0 x 10⁻³ |
10.61 |
45.63 |
23 |
|
Site 2 |
0.5429 |
11.68 |
0.011 |
2.0 x 10⁻⁴ |
12.94 |
238.44 |
24 |
|
Site 3 |
0.0025 |
6.18 |
0.073 |
8.1 x 10⁻³ |
7.88 |
45.83 |
23 |
|
Site 4 |
0.0208 |
8.6 |
0 |
1.0 x 10⁻³ |
8.6 |
0 |
24 |
|
Site 5 |
0.0320 |
6.26 |
0.040 |
2.5 x 10⁻⁴ |
7.86 |
81.45 |
24 |
|
Site 6 |
0.1529 |
6.75 |
0.043 |
2.2 x 10⁻⁴ |
8.83 |
96.43 |
24 |
|
Site 7 |
0.0394 |
11.56 |
0.035 |
5.2 x 10⁻⁴ |
12.15 |
33.71 |
23 |
|
Site 8 |
0.2042 |
6.92 |
0 |
9.36 x 10- 6 |
6.92 |
- |
20 |
|
Site 9 |
0.0030 |
4.86 |
0.041 |
1.7 x 10⁻⁴ |
7.50 |
126.15 |
20 |
|
Site 10 |
0.0030 |
5.18 |
0.026 |
1.4 x 10⁻⁴ |
6.43 |
95.88 |
20 |
Although the main components of the research have been completed, certain components remain under work and review, thus the final conclusions are still being refined. Key findings and recommendations are provided based on the current results, but further analysis may offer additional insights.
Preliminary conclusions by objectives:
Objective 1 - Microbial CUE varies depending on the C:N ratio of the cover crop residues and the amount of supplemental N fertilizer. Estimates from litterbags with cover crops having lower C:N ratios maintained a stable CUE across different N applications. However, litterbags with cover crops having higher C:N ratios exhibited variation in CUE according to N fertilizer addition, requiring more N to efficiently decompose the residues.
Objective 2 - The microbial community composition changed across sites and over time, but N levels had a limited impact on them. Fungal dominance increased at sites with higher C:N ratios.
Objective 3 - Variations in soil properties and microbial CUE across sites did not significantly correlate with N levels, suggesting that site-specific factors, such as soil texture and soil organic matter content, play a more important role in microbial CUE. This highlights the importance of the N recommendation tool to account for site-specific soil conditions, which could improve its predictions of N mineralization from cover crops and soil organic matter.
Objective 4 - Adjusting the biogeochemical equation in the N tool to include field-measured microbial CUE for estimating N credits from cover crops, while leaving the tool's estimates for soil organic matter credits, could enhance its predictive power for N management in corn production.
Education & outreach activities and participation summary
Participation summary:
1. Co-learning workshop – A co-learning workshop was held in Snyder County, PA, in March 2024, with six stations. The purpose of this workshop was to share academic and farmer learning experiences based on the results of this project. The audience of approximately 20 participants included farmers, Extension personnel, and stakeholders from non-profit organizations that provide consulting services to farmers. Both on-farm collaborators, who hosted research plots, are active members of regional organic farmer learning networks facilitated by Extension Educators who were team members in the USDA-OREI project.

Figure 14. Workshop hosted in Snyder County in March 2024, demonstrating how to retrieve data needed for the N-tool from the NRCS Web Soil Survey interface.
2. Farmer conference workshop – In February 2022, a post-doctoral researcher collaborating on the main research, Dr. Kathleen Arrington, and I shared preliminary results of my research and demonstrated how these findings are being used in the new N fertilizer recommendation tool. This presentation was part of the “Making Cover Crops Pay” Extension webinar series and reached an audience of approximately 100 farmers and agronomists.
3. Fact sheet –A preliminary fact sheet was prepared for a farmer's meeting scheduled for December 16th, 2022, but the meeting had to be rescheduled due to weather conditions. The information in the fact sheet was designed to enhance the use of the decision-support tool and promote sustainable nutrient management.
4. Academic meeting – The scientific results were presented at the SSSA-ASA-CSA meeting in November 2022 to inform researchers about the relationships between microbial carbon use efficiency (CUE), nitrogen mineralization, and the ability of the N decision support tool to utilize these measurements for recommending N fertilizer rates. Additionally, results from two years of research were presented at the SSSA summer conference in 2024.
Project Outcomes
The preliminary results from the 2021 litterbag study have contributed to improving the calibration of the N-tool, making it more precise for N management. This tool can help farmers optimize N fertilizer use, reducing excess application and thereby lowering input costs. By refining the N recommendations based on microbial carbon use efficiency (CUE) estimates from litterbags, farmers can achieve better yields with more efficient fertilizer use, thus potentially cost savings while increasing profitability. In addition, by encouraging more precise N applications, the tool helps minimize the environmental impact of excess of N that could be lost through runoff and leaching. The use of this decision-support tool empowers farmers with data-driven insights that enhance their decision-making taking into consideration site-specific measurements for their farms and management practices.
-
The project helped me to learn more about biogeochemical processes that are embedded in processes we observe at the farm level. I was able to see how the microscopic level affects the macro level, such as yield, and how farm management decisions, like cover crop use or applying different N rates, can impact these outcomes.
-
It was very rewarding for me to share with farmers, explore their curiosity and questions about the project, and learn from them, while also providing them with research results. In my perspective, it is essential that science apply a holistic and transdisciplinary approach
-
I developed important skills for organizing long-term projects, from planning field trips that optimized time and resources to address multiple objectives, to learning how to delegate responsibilities and find alternatives when something did not work the first time. Although this grant is small, it required developing responsibility in managing both budget and time, which are crucial skills in academia and other professional fields. This experience has given me the confidence to apply for larger grants.
-
I would love to apply the knowledge gained here to other areas or crops , in addition to always include components in research that support decision-making for stakeholders. It is important that stakeholders are integrated into the outcomes of the research to ensure its practical relevance.