Final report for GNE22-300
Project Information
In the Northeast, low availability of perennial cool-season forages during June through August stresses farm budgets and can lead to overgrazing which harms the long-term productivity and health of agricultural lands. Summer forage shortfalls will likely worsen as the climate changes and becomes hotter and dryer. Forage crabgrass (Digitaria ciliaris and Digitaria sanguinalis) is a warm-season annual forages that is productive in the southern United States but unknown in the Northeast. However, the ecology of its weedy relatives and recent studies from the Midwest suggest that it could be a useful alternative summer forage in northeastern dairy and livestock farming.
To fully investigate the innovative use of crabgrass in the Northeast, three experiments were performed at the University of Massachusetts:
1) Quick-N-Big crabgrass was planted at four times (mid-May, early June, mid-June, and late June) and three seeding rates (3.4, 6.7, and 10.1 kg ha–1). Weekly sampling explored the relationship between growth stages and forage yield and quality.
2) Four improved crabgrass varieties were evaluated for yield and quality with four nitrogen fertilizer treatments (56 kg ha–1 at planting, 112 kg ha–1 at planting, 56 kg ha–1 at planting and 56 kg ha–1 after the first harvest, and no nitrogen control). The crabgrass was harvested twice each summer to evaluate performance in a multi-cut system.
3) Crabgrass, pearl millet, and sudangrass were grown and evaluated for their forage quality as hay and haylage.
The experimental results yielded the following management recommendations for forage crabgrass production in the Northeast:
1) Both crabgrass species are viable summer annual forages in the Northeast US and could be used for grazing, baled hay, and wrapped haylage using widely available equipment.
2) 3000 kg ha–1 of dry matter can be grown in six to seven weeks with relative forage quality over 100 and more than 15 percent protein.
3) Highest high-quality yields are achieved by planting in the first half of June.
4) 56 kg N ha–1 per forage harvest is sufficient for forage production.
5) D. Sanguinalis has moderately better forage quality than D. ciliaris, but D. ciliaris has higher (although slower) regrowth potential.
1) Explore basic information on optimal sowing date, seeding rate, and time of harvest of Quick-N-Big crabgrass. Measure weekly growth, yield, and forage quality of crabgrass between 4 and 10 weeks after planting for crabgrass sown at four planting dates (mid-May to late June) and three seeding rates (3.4, 6.7, and 10.1 kg ha–1). Investigate the relationship between crabgrass growth stage, seasonal progression, and forage quality and yield. (Experiment 1)
2) Evaluate yield and quality performance of four crabgrass varieties (Digitaria ciliaris: Dal's Big River and Mojo and Digitaria sanguinalis: Quick-N-Big and Quick-N-Big Spreader) grown under different nitrogen management treatments (56 kg ha–1 at planting, 112 kg ha–1 at planting, 56 kg ha–1 at planting and 56 kg ha–1 after the first harvest, and no nitrogen control) and quantify their regrowth after first-cut harvest. (Experiment 2)
3) Determine the quality of crabgrass hay compared to pearl millet and sudangrass and assess the quality of haylage made in mini-silos from chopped crabgrass, pearl millet, and sudangrass. (Experiment 3)
4) Establish research-based recommendations for the holistic production of crabgrass in the Northeast.
In the US Northeast, low pasture and hay productivity from late June through August stresses farm budgets and can also lead to overgrazing which harms the long-term productivity and health of agricultural lands. Summer forage shortfalls will likely worsen as the climate shifts towards hotter and dryer conditions. Crabgrass (Digitaria ciliaris (Retz.) Koeler and Digitaria sanguinalis (L.) Scop.) is a warm-season annual forage that is commonly used in the southern United States but is relatively unknown in the Northeast. However, the ecology of its weedy relatives and recent studies from the Midwest suggest that new varieties of crabgrass would be a useful alternative summer forage in northeastern dairy and livestock farming.
Crabgrass has been shown to be a high-quality summer annual forage in the southern United States (Dalrymple, 1975; Teutsch et al., 2005; Blount et al., 2003). Trials at the Noble Research Institute in Oklahoma found average daily gains of 1.8 pounds for cattle on crabgrass pasture (Stalcup, 2007). Variety trials by North Carolina Extension indicated that crabgrass forages yielded more than 2,500 pounds dry matter per acre in one harvest with the best varieties closer to 3,000 and crude protein up to 15.5% and total digestible nutrients up to 63% (Harmon, 2021). The results of other research indicated that there were significant yield and forage quality tradeoffs between crabgrass varieties (Rocateli and Abreu, 2020). Hall (2000) concluded that crabgrass has similar yield and quality as early bloom orchardgrass in Virginia. Furthermore, evaluation by Wisconsin Extension has shown that crabgrass can be a productive part of forage rotations in the northern United States as well, with typical yields of up to 3,500 pounds per acre and 15% crude protein and 58% dry matter digestibility (Newman, 2019). Other researchers have shown that crabgrass quality compares favorably to common summer annual grasses like pearl millet and the sorghum family (Kichler, 2018), grows fast and can be harvested very quickly (Jennings, 2018), regrows easily for multiple cuttings (Beck et al., 2007), is highly palatable (Newman, 2019), and lacks prussic acid (Tuetsch, 2019).
Very little research has been done on crabgrass in the Northeast. Weinart-Nelson et al. (2021) reported that crabgrass was suitable for horse pasture systems in Maine. Close relatives of forage crabgrass (Digitaria spp.) are common weeds throughout the region (Kim et al., 2002). This indicates that forage crabgrass can likely be grown successfully in the United States Northeast.
Taken as a whole, this research evaluated forage crabgrass and its productivity and quality as an innovative multi-cut summer forage in the Northeast to help meet summer forage shortfalls in dairy and livestock operations. This is essential since climate change will likely lead to increasingly hot and dry summers over the coming decades in the Northeast (Wolfe et al., 2017). By building on previous research and extension, this project allows regional farmers to confidently use crabgrass as a forage crop to improve their forage inventory and farm sustainability.
Cooperators
- (Educator and Researcher)
- (Educator and Researcher)
- (Researcher)
Research
Abbreviations:
Forage quality metrics: ADF, Acid Detergent Fiber; DDM, Digestible Dry Matter; DM: Dry Matter, DMI, Dry Matter Intake; NDF, Neutral Detergent Fiber; NFC, Non-Fibrous Carbohydrates; RFV, Relative Feed Value; TDN, Total Digestible Nutrients.
Crabgrass varieties: DR, Dal's Big River; MO, Mojo; QB, Quick-N-Big; QS, Quick-N-Big Spreader.
Experimental Site and Agronomic Management
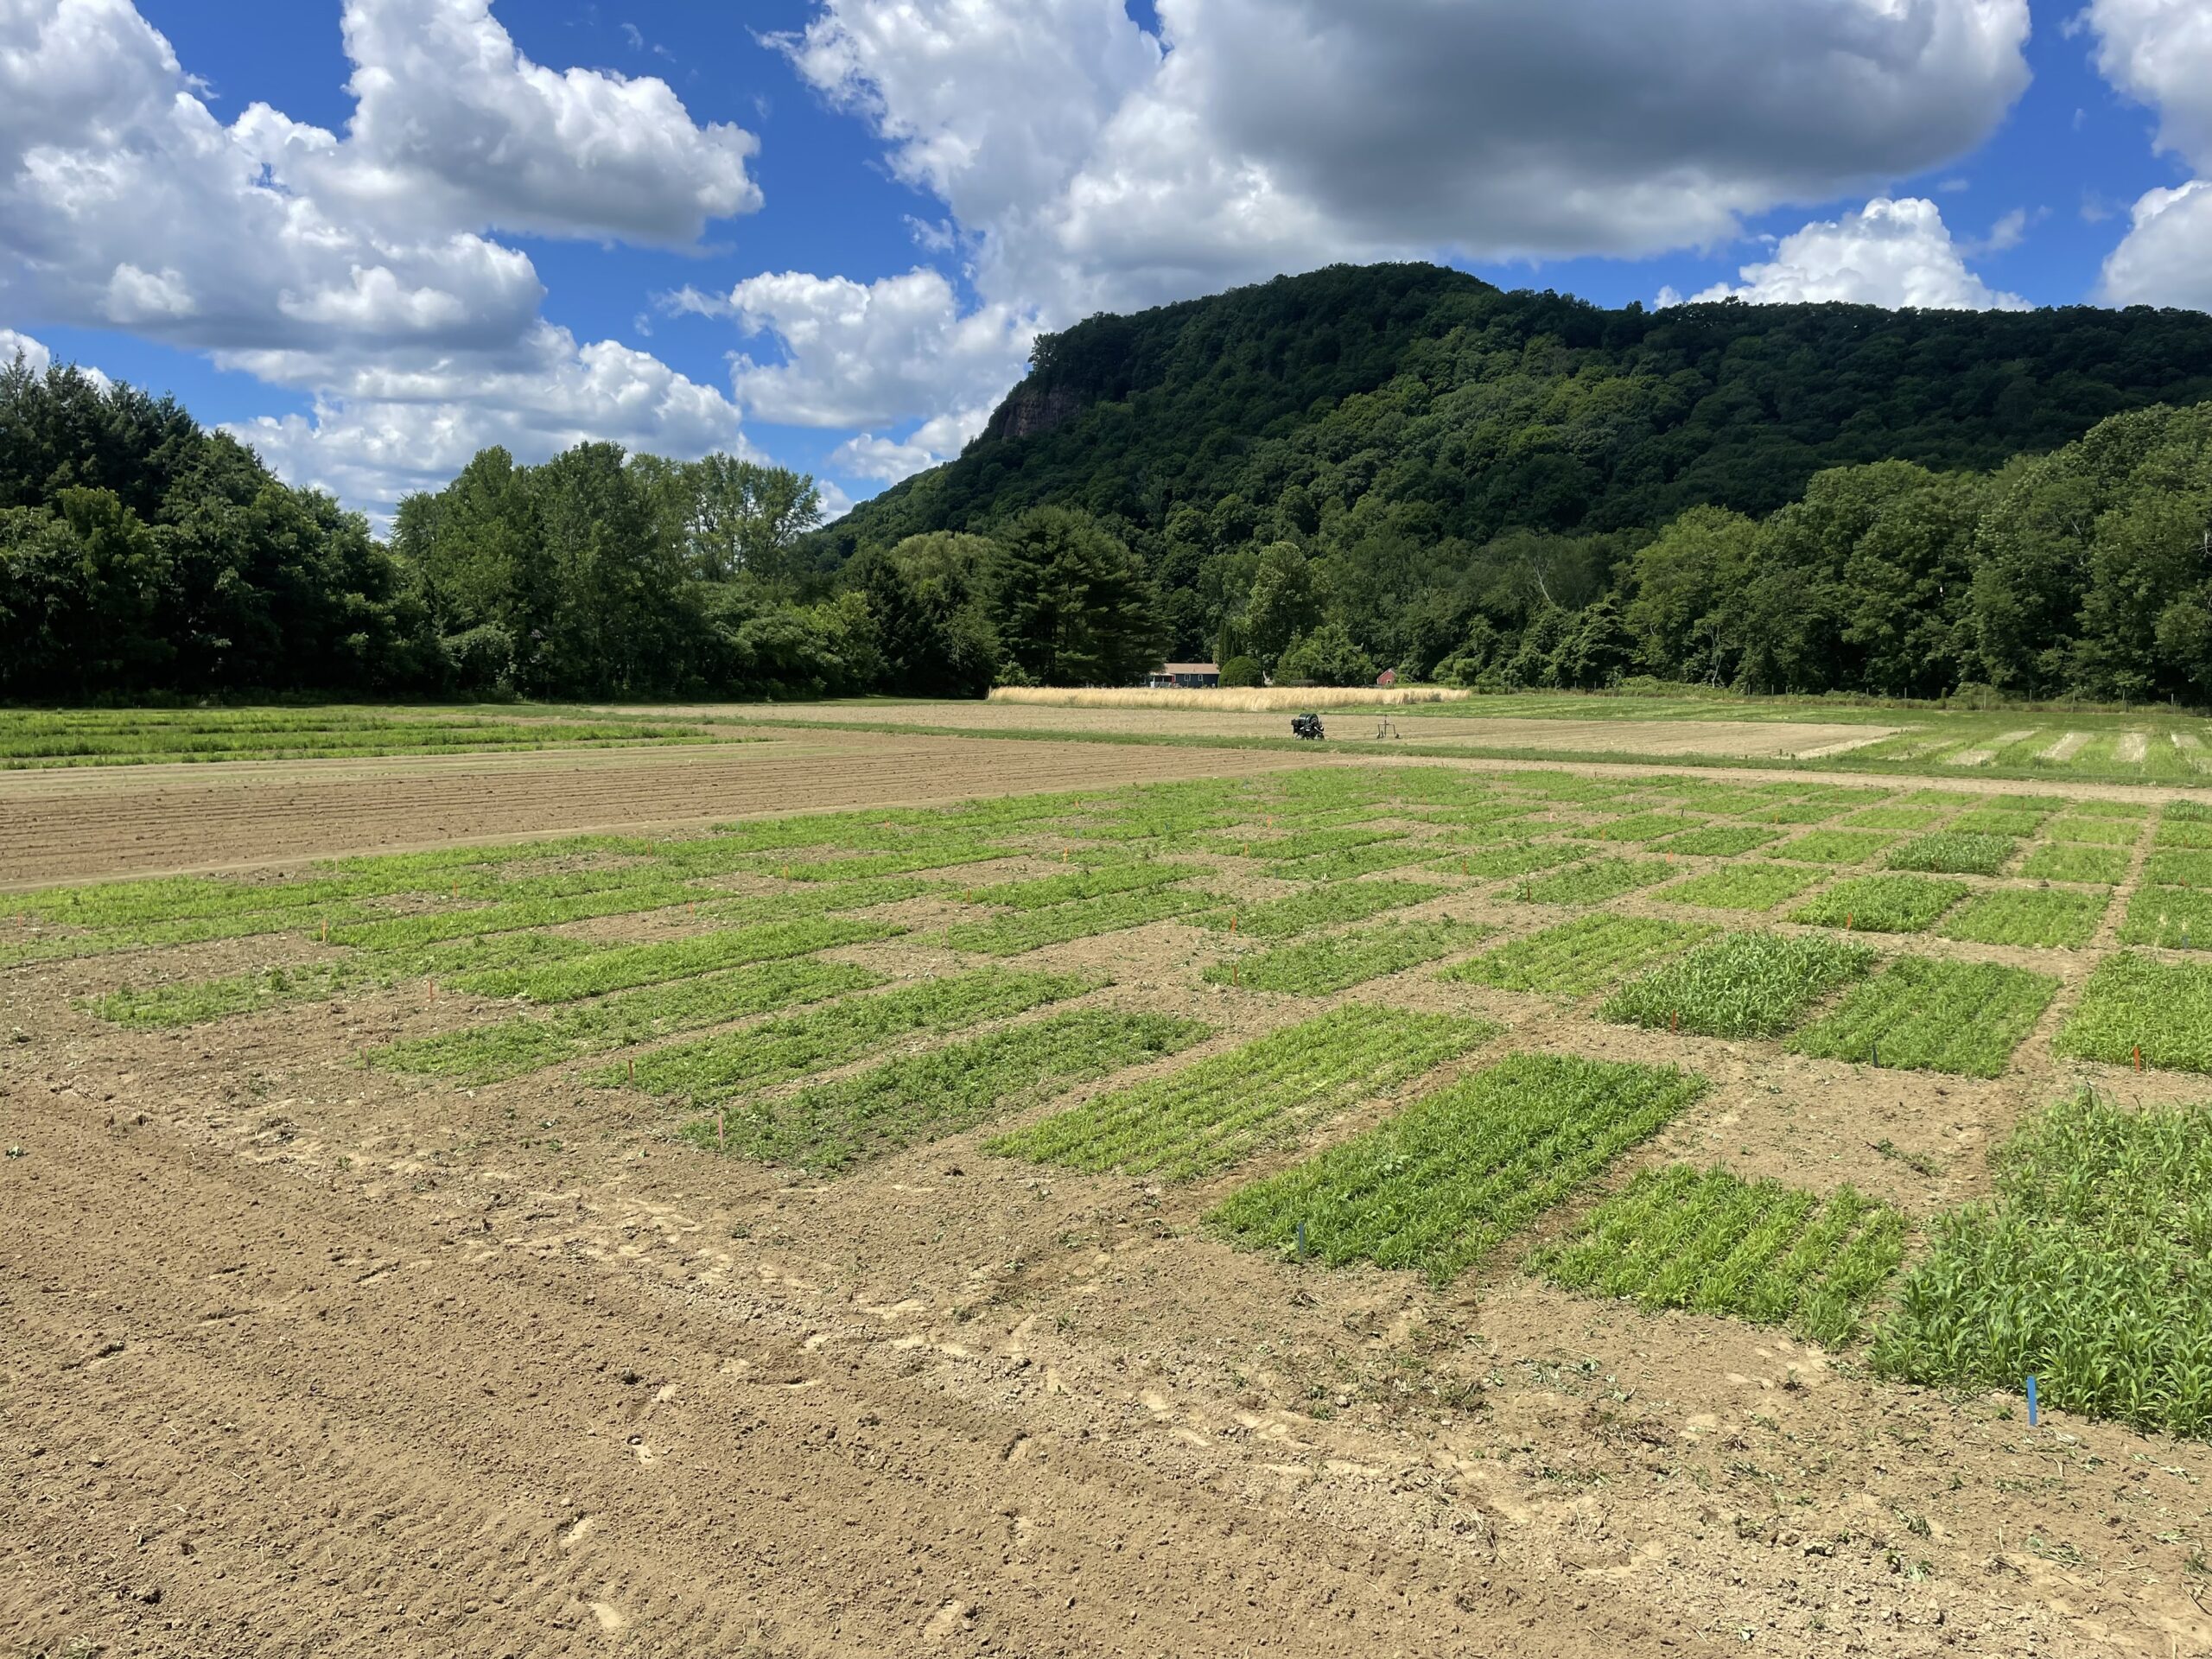
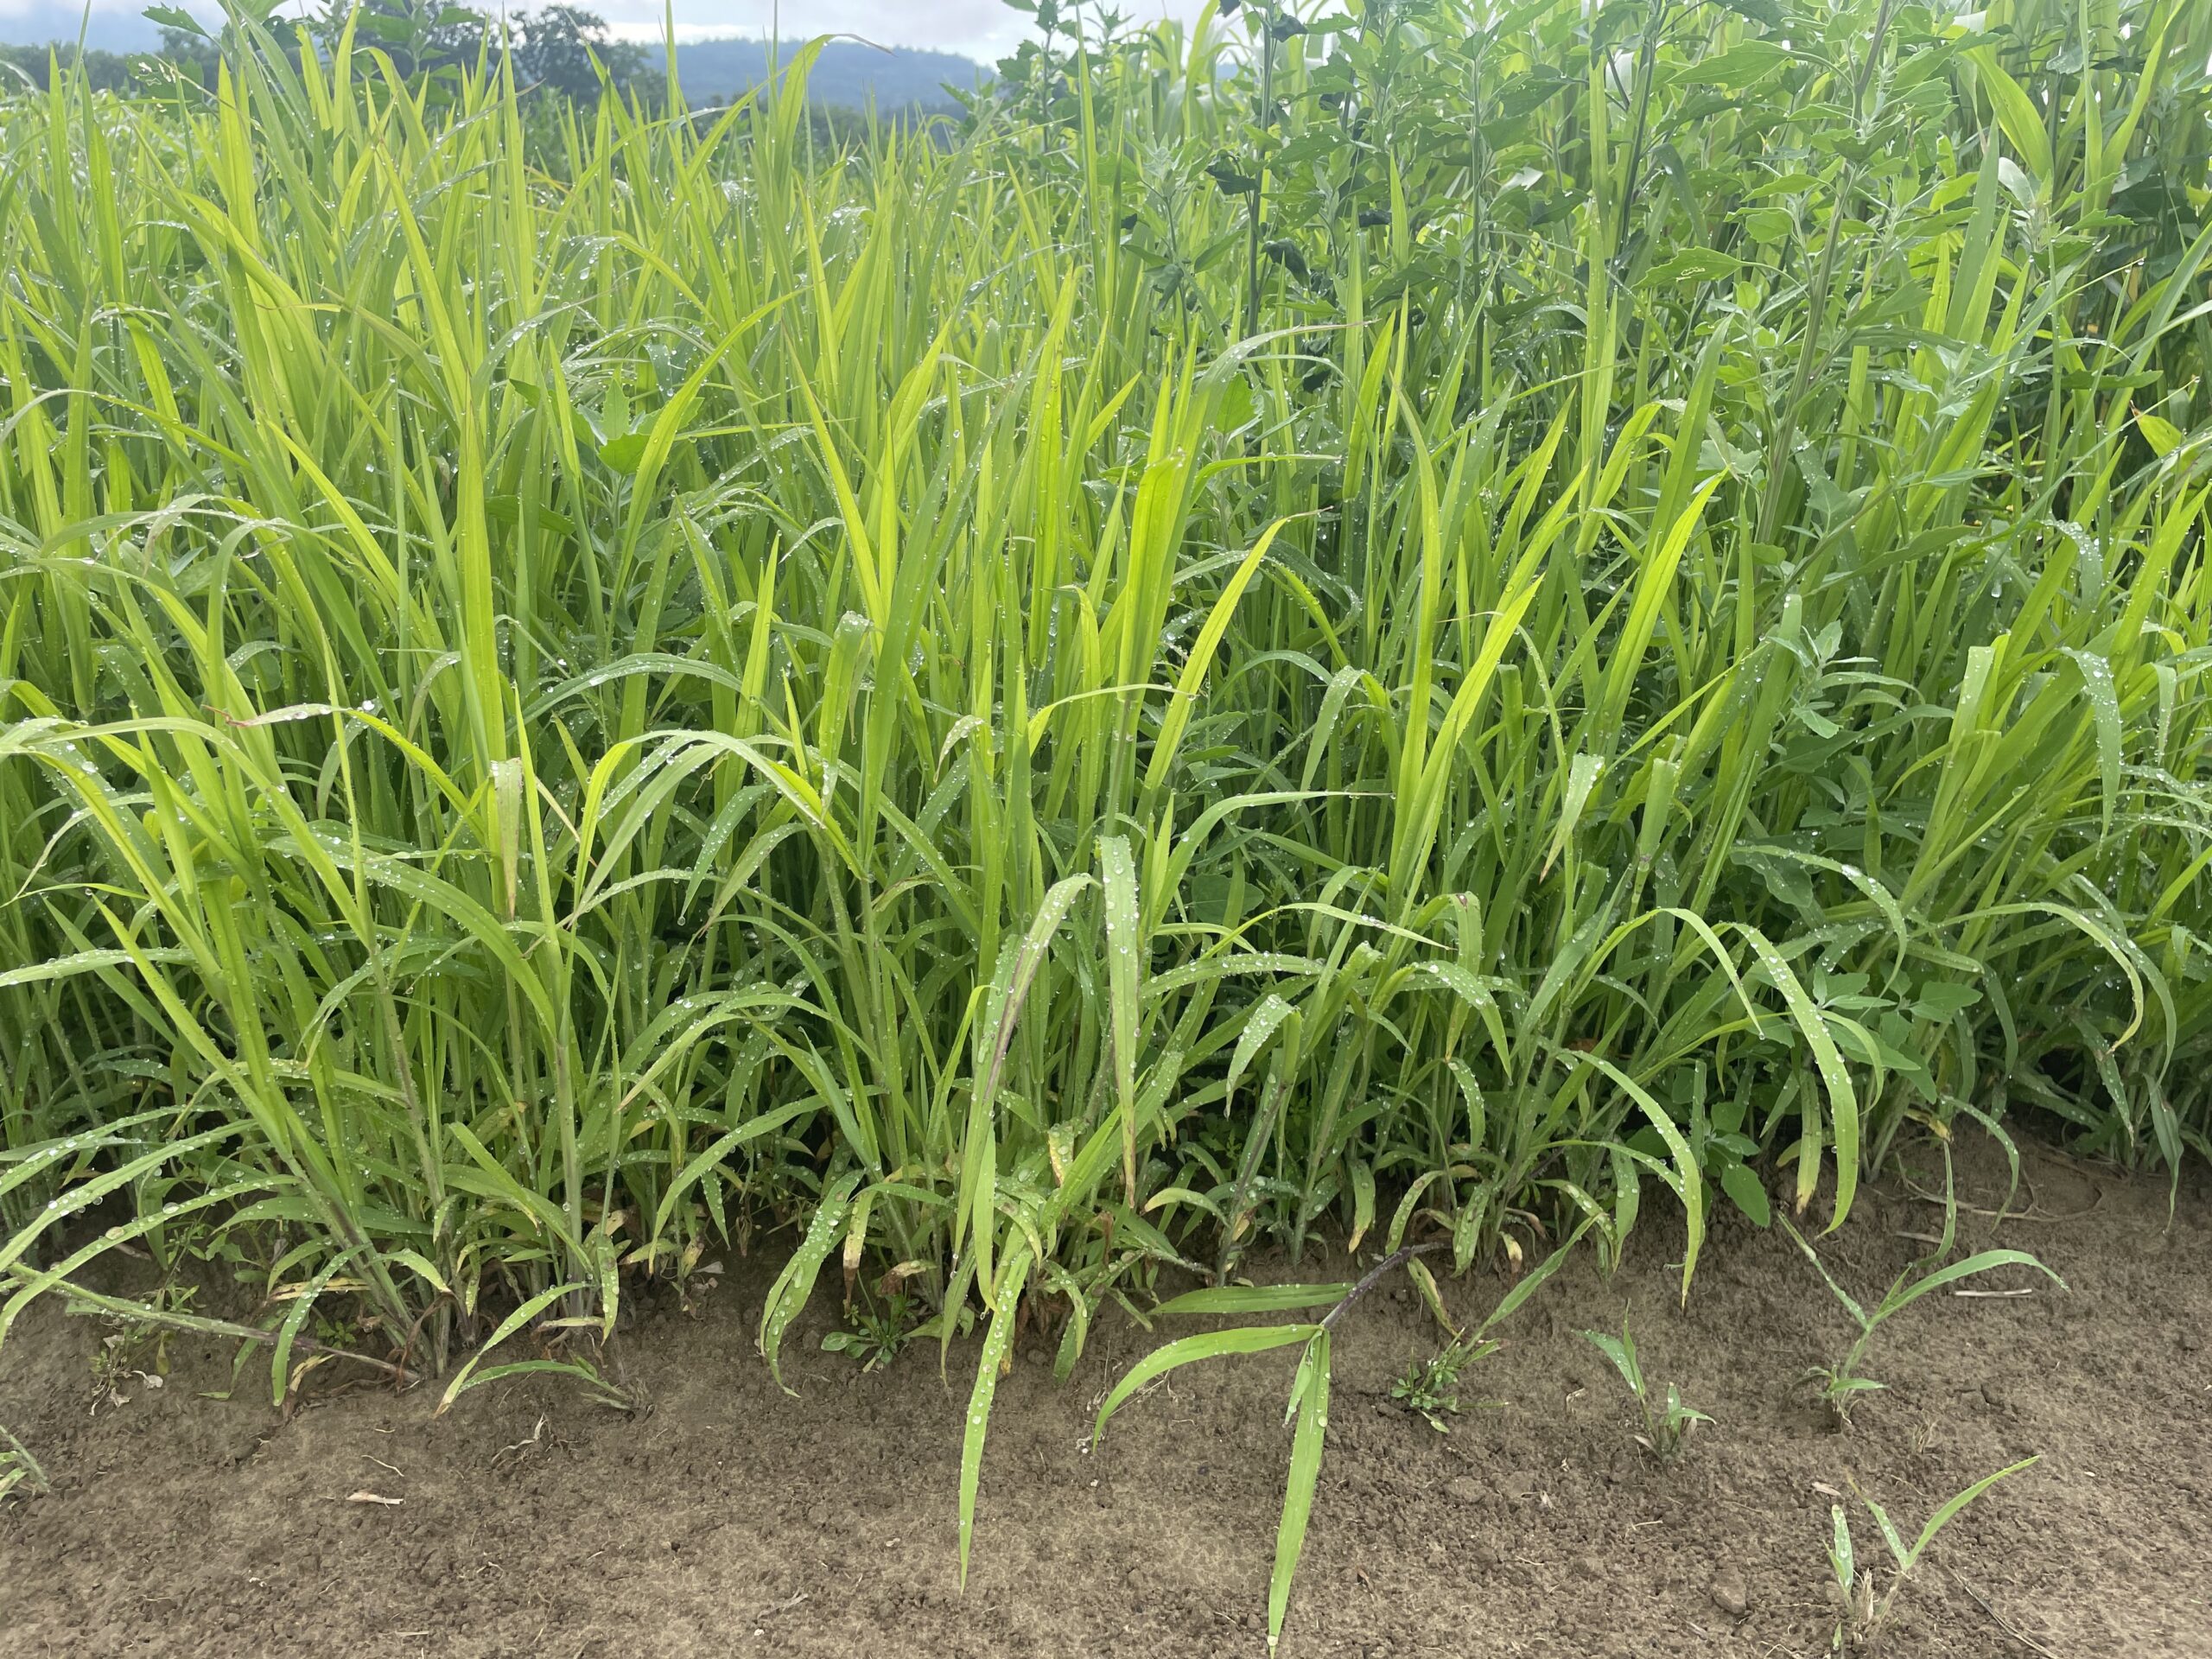
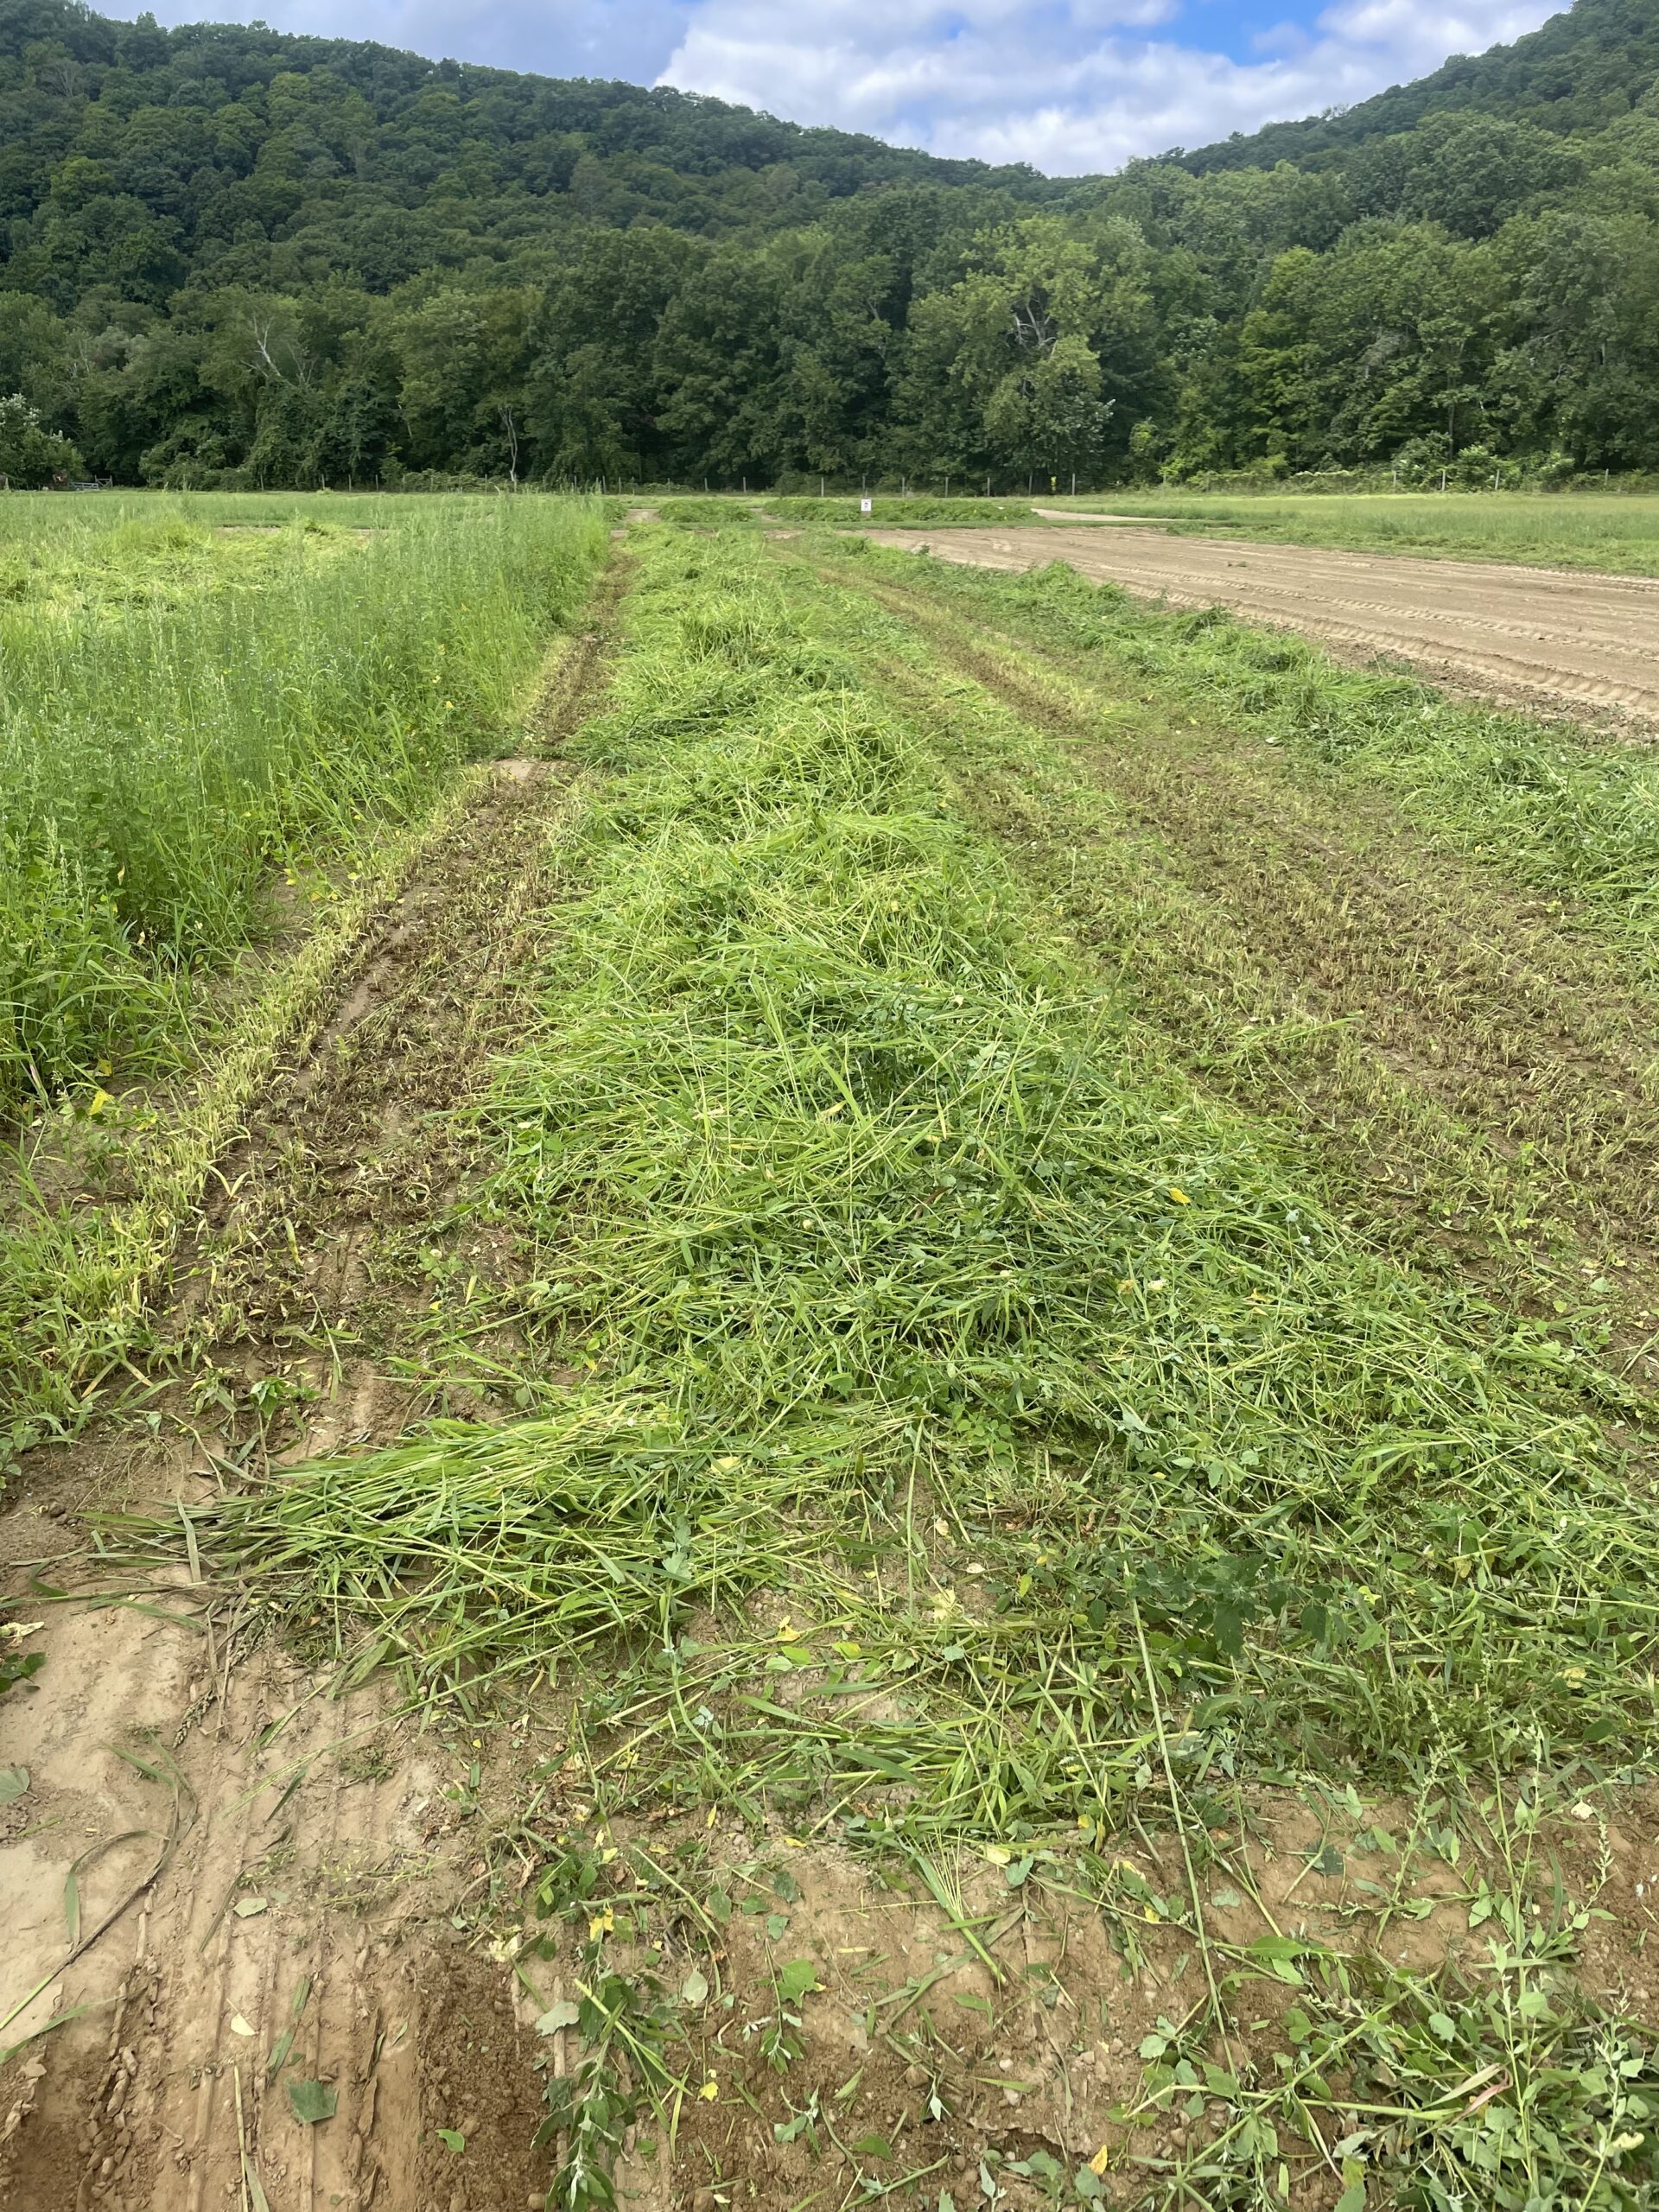
Forage crabgrass management was investigated in three experiments conducted at the UMass Crop Research Farm in South Deerfield MA in 2022 and 2023 (Pictures 1-3). The soil was a Winooski silt loam (Coarse-silty, mixed, superactive, mesic Fluvaquentic Dystrudepts). Over 2022 and 2023, the weather was diverse and represented some of the possible summer weather extremes regionally (Table 1).
Field preparation using mechanical tillage was performed at the end of April and the beginning of May in both years. Baseline soil tests showed that non-treatment soil amendments were not needed to meet plant nutrition needs. All experiments were planted using a custom-made Brillion cone seeder.
Experiment 1: Crabgrass planting date, seeding rate, and harvest age
Treatment implementation, and seasonal progression
Quick-N-Big crabgrass was planted in a four-replication, split-plot RCBD with planting date as the main plots and seeding rate as the sub-plot. Quick-N-Big crabgrass was chosen for this experiment because it performed as the best variety in northern trials done by Wisconsin Extension (Newman, 2019). There were four planting date treatments: 1) mid-May (18 May 2022 and 19 May 2023), 2) early June (1 June 2022 and 1 June 2023), 3) mid-June (15 June 2022 and 14 June 2023), and 4) late June (29 June 2022 and 28 June 2023) and three seeding rate treatments: 3.4, 6.7, and 10.1 kg seed ha–1. June planting dates were cultivated prior to planting to produce a clean seedbed for each planting date. Each sub-plot measured 1.8 by 12.2 m. Nitrogen fertilizer was applied at planting to add 56 kg ha–1 of nitrogen in the form of calcium ammonium nitrate.
Sampling and measurement
Experimental plots were observed and sampled weekly between 4 and 9 weeks after planting. Since planting date was a treatment, evaluation of mid-May plots began before the final planting on 16 June 2022 and 14 June 2023 while late June plantings were measured and harvested until 1 September 2022 and 29 August 2023. A one-quarter m2 quadrat of each plot was collected to assess yield. Weed biomass was measured four weeks after planting from a 1/4 m2 quadrat. Growth stage (Moore et al., 1991) and plant height were measured in the 6.7 kg ha–1 plots. Forage samples from the 6.7 kg ha–1 plots were ground and analyzed for forage quality characteristics.
The results were statistically analyzed with a mixed-effect model with fixed effect explanatory variables of planting date as a discrete effect and seeding rate and harvest age as continuous effects. Year and block were treated as random effects. Response variables were weed biomass, growth stage, yield, and forage quality parameters. Separate analysis was conducted with growth stage as an explanatory discrete fixed effect and yield and forage quality parameters as the response variables with the same random effects as described above.
Experiment 2: Crabgrass variety, nitrogen fertility, and multiple harvest
Treatment implementation, and seasonal progression
Four improved crabgrass varieties from two species [Digitaria sanguinalis (L.) Scop: Quick-N-Big (QB) and Quick-N-Big Spreader (QS), Digitaria ciliaris (Retz.) Koeler: Dal's Big River (DR), and Mojo (MO)] were planted in a factorial split plot RCBD experiment with variety as the main plot and nitrogen fertility as the sub plot. There were four nitrogen treatments: 1) low - 56 kg ha–1 at planting, 2) high - 112 kg ha–1 at planting, 3) split - 56 kg ha–1 at planting and 56 kg ha–1 after the first harvest, and 4) no nitrogen control.
The crabgrass was planted at 6.7 kg ha–1 live seed on 2 June 2022 and 1 June 2023 in sub-plots measuring 1.8 by 6.1 m. The nitrogen fertilizer was applied in the form of calcium ammonium nitrate (27% N).
Sampling and measurement
When the forages were in the boot stage (stage R0) (Moore et al., 1991), 1/4 m2 quadrats of the crabgrass was harvested ten cm above the ground. The rest of the plots were clipped and removed around the sample area. Additional nitrogen fertilizer was applied after harvest to the split N treatment. The crabgrass was then allowed to regrow. Second-cut crabgrass forage was measured, sampled, and analyzed in the same manner as the first-cut harvest when varieties reached boot stage. Varieties did not reach boot stage at the same time for the first cut in 2022 or for the second cut in either year. The difference in regrowth time was especially notable in 2022. In 2022, first cut QB and QS (D. sanguinalis) reached boot stage on 21 July 2022 while DR and MO (D. ciliaris) matured later and were sampled on 30 July 2022. All varieties reached boot stage at the same time in 2023 and first cut harvest was on 25 July 2023. Regrowth maturity time differed between the species in both years. Second cut samples were collected on 9 August 2022 and 17 August 2023 for QB and QS and on 1 September 2022 and 23 August 2023 for DR and MO varieties.
The results were statistically analyzed as a mixed effect model with main effect explanatory variables of nitrogen rate as a continuous fixed effect and variety and harvest number as discrete fixed effects. Year and block were random effects. Response variables were days to harvests, harvest yields, and various forage quality parameters.
Experiment 3: Comparison of crabgrass to pearl millet and sudangrass
Treatment implementation, and seasonal progression
Quick-N-Big crabgrass, Exceed BMR pearl millet, and AS9301 sudangrass were arranged in a four-replicate RCBD with plots 1.8 x 6.1 m. The grasses were planted at a rate of 6.7 kg ha–1 seed for crabgrass, 20 kg ha–1 for pearl millet and 30 kg ha–1 for sudangrass. All three crops were planted on 1 June 2022 and 1 June 2023. Forages received 56 kg ha–1 nitrogen as calcium ammonium nitrate (27% N) at planting.
Sampling and measurement
On 26 July 2022 and 19 July 2023, one quarter m2 quadrats of the forages were harvested ten cm above the ground when crabgrass was in the boot stage and pearl millet and sudangrass were more than 90 cm tall. The biomass was dried and analyzed for forage quality, The response variables of yield and forage quality parameters were statistically analyzed with forage species and harvest number as fixed explanatory variables, and with block and year as random effects.
Silage fermentation and analysis
Samples were also collected to make haylage on 26 July 2022 and 20 July 2023. All of the forages were separately chopped to 1-cm lengths using an Ohio forage chopper (Wooster, OH, USA). Four replications of each species were then packed into mini-silos (1-liter HDPE plastic jars). The plant material for each mini-silo was packed by hand into each plastic jar. A 2-cm-wide iron bar was used to pack (compress) the forage and each jar was filled with a minimum of 820 g of forage to minimize the amount of air in each mini-silo.
The mini-silos were sealed and stored at an average of 20°C for five months. The silage samples were sent to Dairy One Forage Lab (Ithaca, NY, USA) to test for forage quality and fermentation profile. The samples were frozen before shipping so that they did not mold in transport. Forage quality was measured in terms of crude protein, ADF, NDF, non-fiber carbohydrates, total digestible nutrients, net energy for lactation, and relative forage value. Silage fermentation profile was evaluated in terms of acid content (lactic, acetic, lactic/acetic ratio, propionic, butyric, iso-butyric), VFA score, total acids, pH, crude protein, crude protein equivalent from ammonia, and ammonia N as a percentage of total N.
The silage quality results were analyzed as a four-replicate, completely randomized design with the plant species treatment as a fixed discrete explanatory variable, year as a random effect, and the various components of silage quality as response variables.
Comparison among experiments
Each experiment focused on different aspects of forage crabgrass management, but all three experiments contained treatments in which the management was analogous. Specifically, all three experiments contained treatments where Quick-N-Big crabgrass was planted in early June at a seeding rate of 6.7 kg ha–1 with 56 kg N ha–1 at planting and harvested about 7 weeks after planting. The analogous treatments from each experiment were statistically compared with the experiment number as a categorical fixed effect, year as a random effect, and dry matter yield and forage quality components as response variables in order to assess the uniformity of crabgrass performance across all three experiments.
Dry Forage Quality Analysis and Calculation
The collected forage from all experiments was dried in a forced-air oven at 54° C to constant weight, weighed to calculate dry matter yield, and ground to 1 mm using a Foss mill. Samples were then analyzed for forage quality in terms of crude protein, Neutral Detergent Fiber (NDF), Acid Detergent Fiber (ADF), NDF digestibility, fat, and ash, using a 2400 RTW SpectraStar near infrared (NIR) spectrometer (Unity Scientific, Milford, MA, USA) following the methods for powdered forage detailed in (KPM, 2022). The ground forage reflectance was analyzed for forage quality parameters using the SpectraStar proprietary calibration for Hay - Grass produced by Aunir (AB Vista, Marlborough, UK) for KPM Analytics (Westborough, MA, USA) (KPM, 2024).
Other forage quality parameters were derived from the NIR results using the following equations:
(1) NFC = 100 – (NDFn + crude protein + EE + ash)
where NDFn (nitrogen free NDF) = NDF × 0.93 and EE (ether extract) = fatty acids + 1
(2) TDN = [(NFC × 0.98) + (crude protein × 0.87) + (fatty acids × 0.97 × 2.25) + (NDFn × NDFDp/100)] – 10
where terms are previously defined and NDFDp (digestible NDF) = 22.7 + 0.664 × NDFD
(3) DDM = 88.9 – (0.779 × ADF)
(4) DMI (percent of body weight of dairy cattle) = 120/NDF
(5) RFV = DDM × DMI/1.29
Variables in equations 1-5 are expressed as a percentage of dry matter (DM) basis unless otherwise noted based on Undersander and Moore, 2002; Oba and Allen, 1999; and Mertens, 1987. Forage quality metrics calculated as percentages of dry matter were converted to g kg–1 DM. for analysis. Please see section 2.4.3 for details of silage quality analysis.
Statistical Methods
All statistical analysis was performed using R statistical software (R Core Team, 2024) using the packages lmerTest (Kuznetsova et al., 2017) for mixed effect ANOVA analysis, emmeans (Lenth, 2024) and multcomp (Hothorn et al., 2008) for mean separation, MuMIn (Bartoń, 2024) for marginal R2, and readxl (Wickham and Bryan, 2023) and tidyverse (Wickham et al., 2019) for data management. In all experiments, dry matter yield was log-transformed to account for heterogeneous variance. In order to maintain statistical validity of mean separations following log-transformation, geometric rather than arithmetic means are used for dry matter means throughout this report. No transformations were needed for other response variables and thus arithmetic means are reported for forage quality parameters, crabgrass height, and weed biomass. For forage quality parameters (protein, ADF, NDF, NDF digestibility, NFC, DDM, TDN, DMI, and RFV) overall family-wise error rate was maintained at ⍺ ≤ 0.05 using Holm-Bonferroni ordered significance levels (Holm, 1979) to assess the effect of explanatory variables on each forage quality parameter within each experiment. See each experiment section above for additional details on explanatory variable selection.
Crabgrass Management Effects
Dry Matter Yield and Height
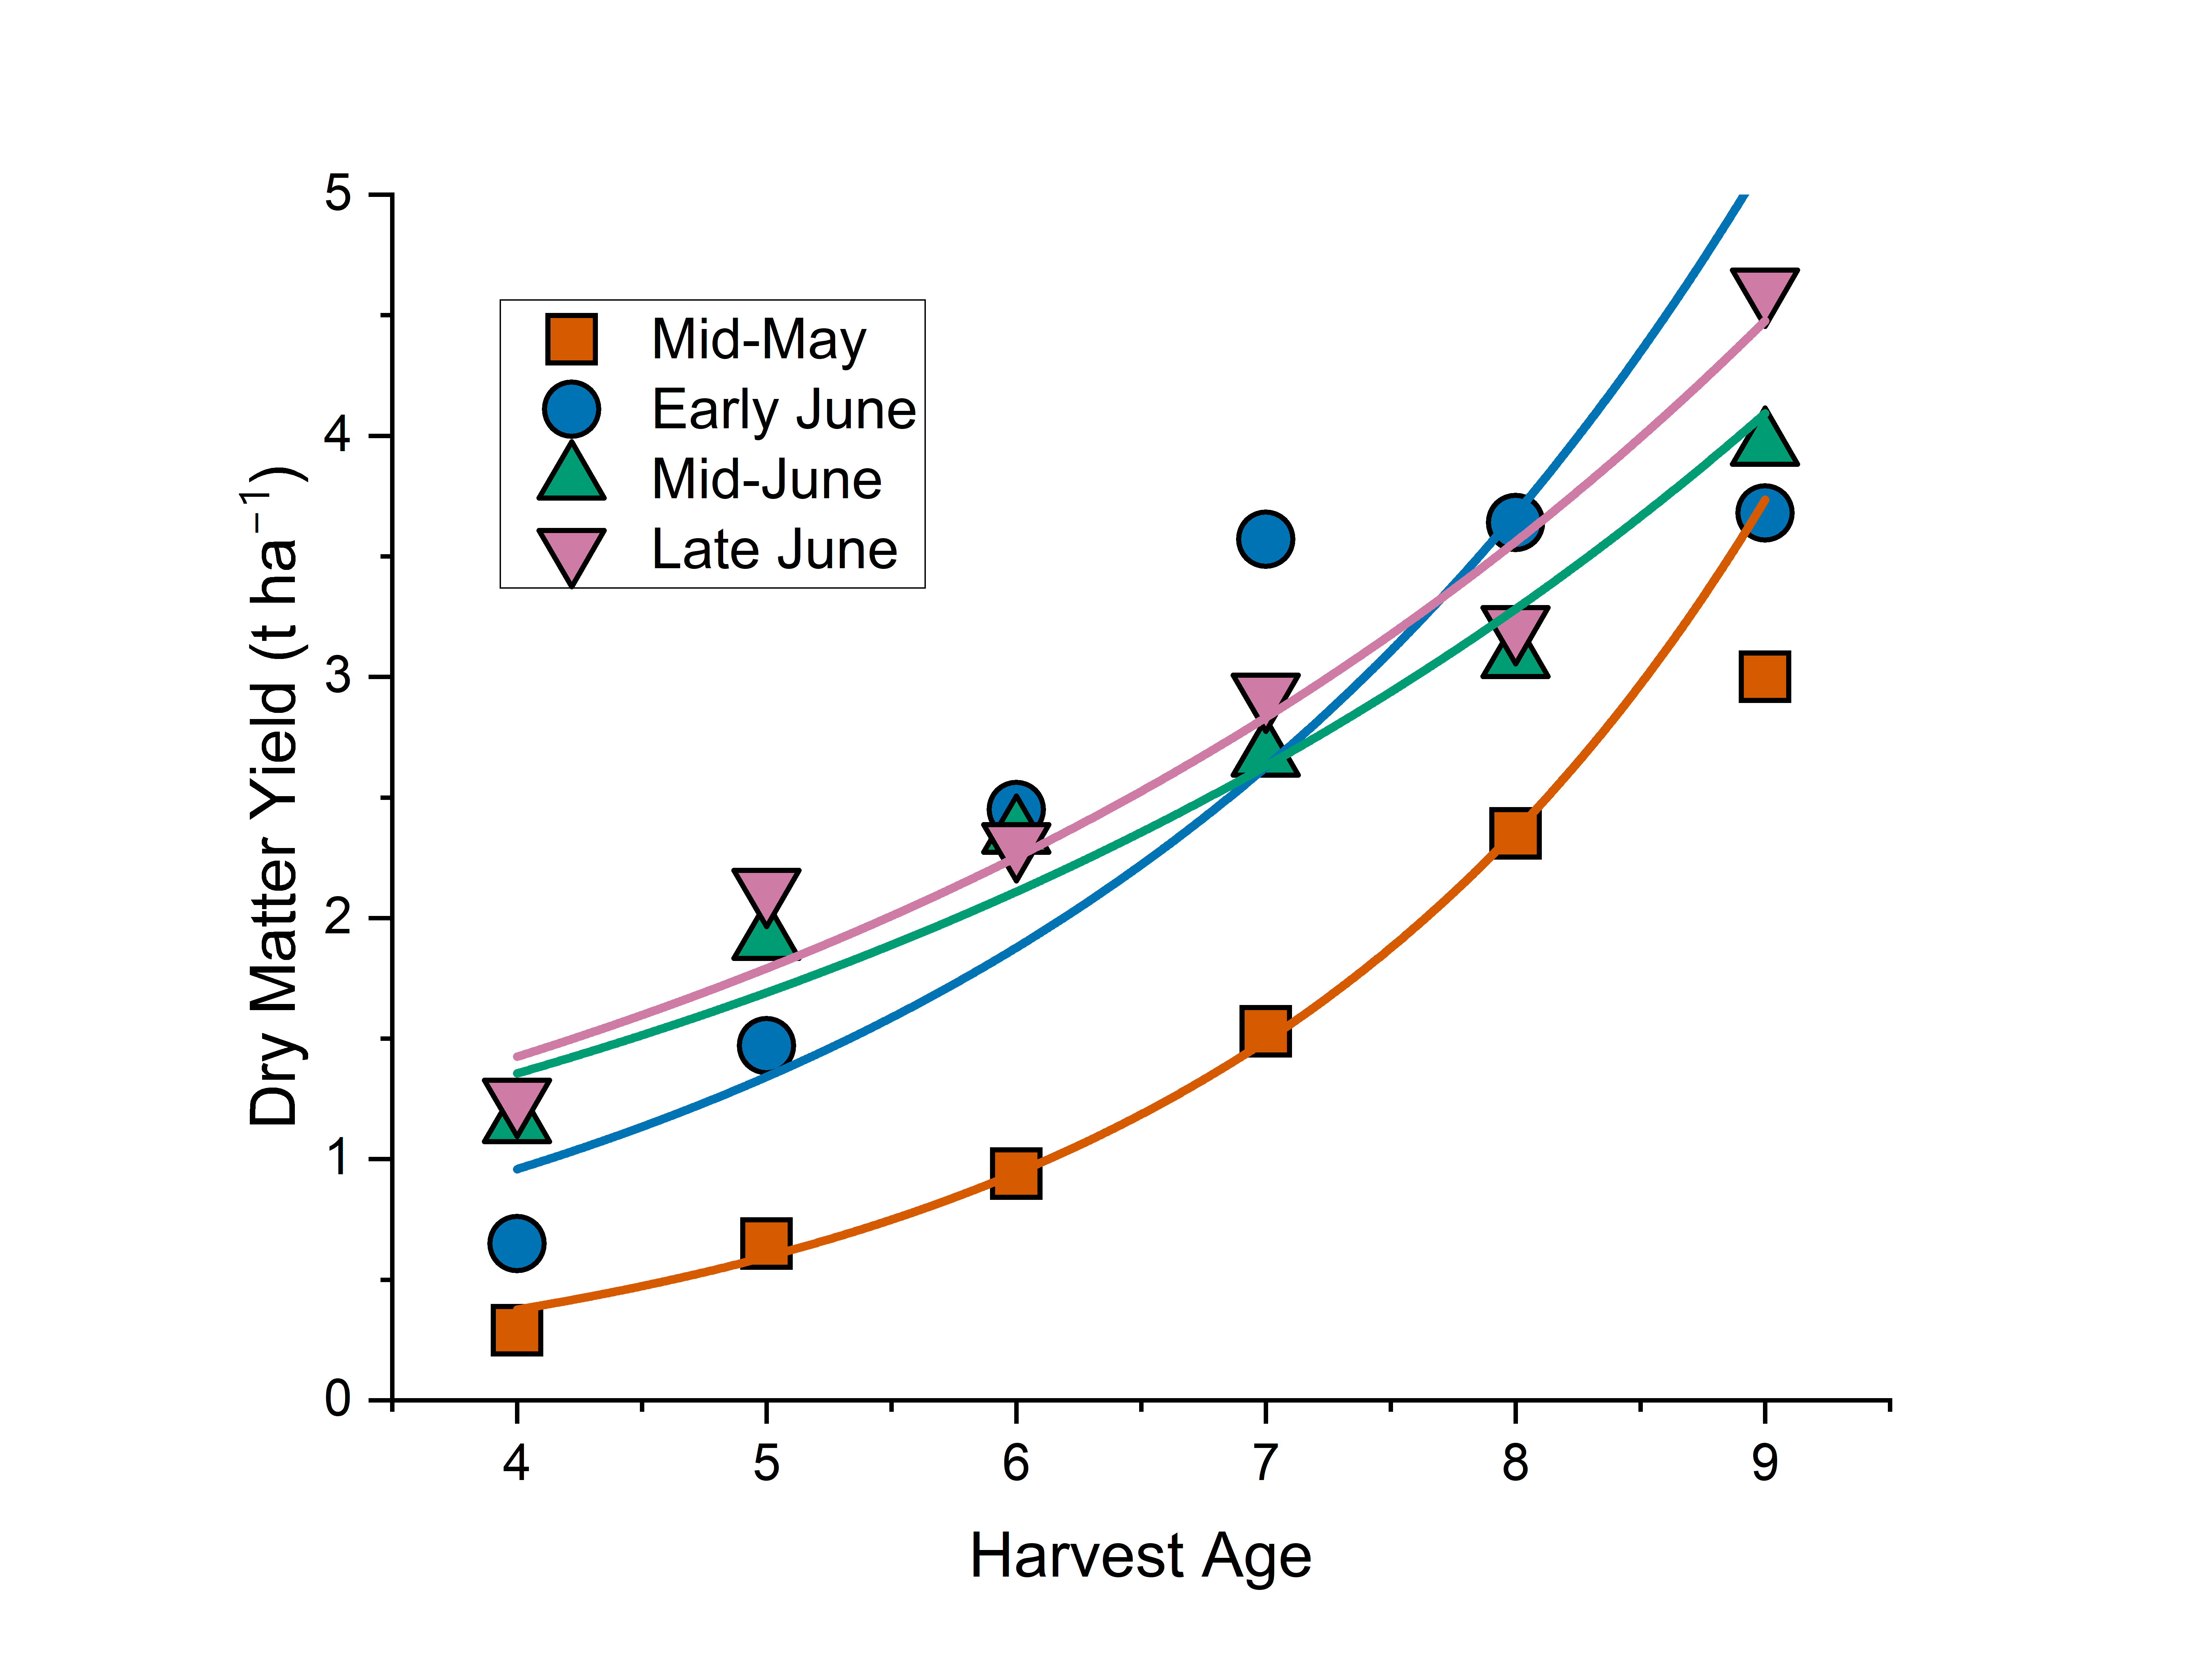
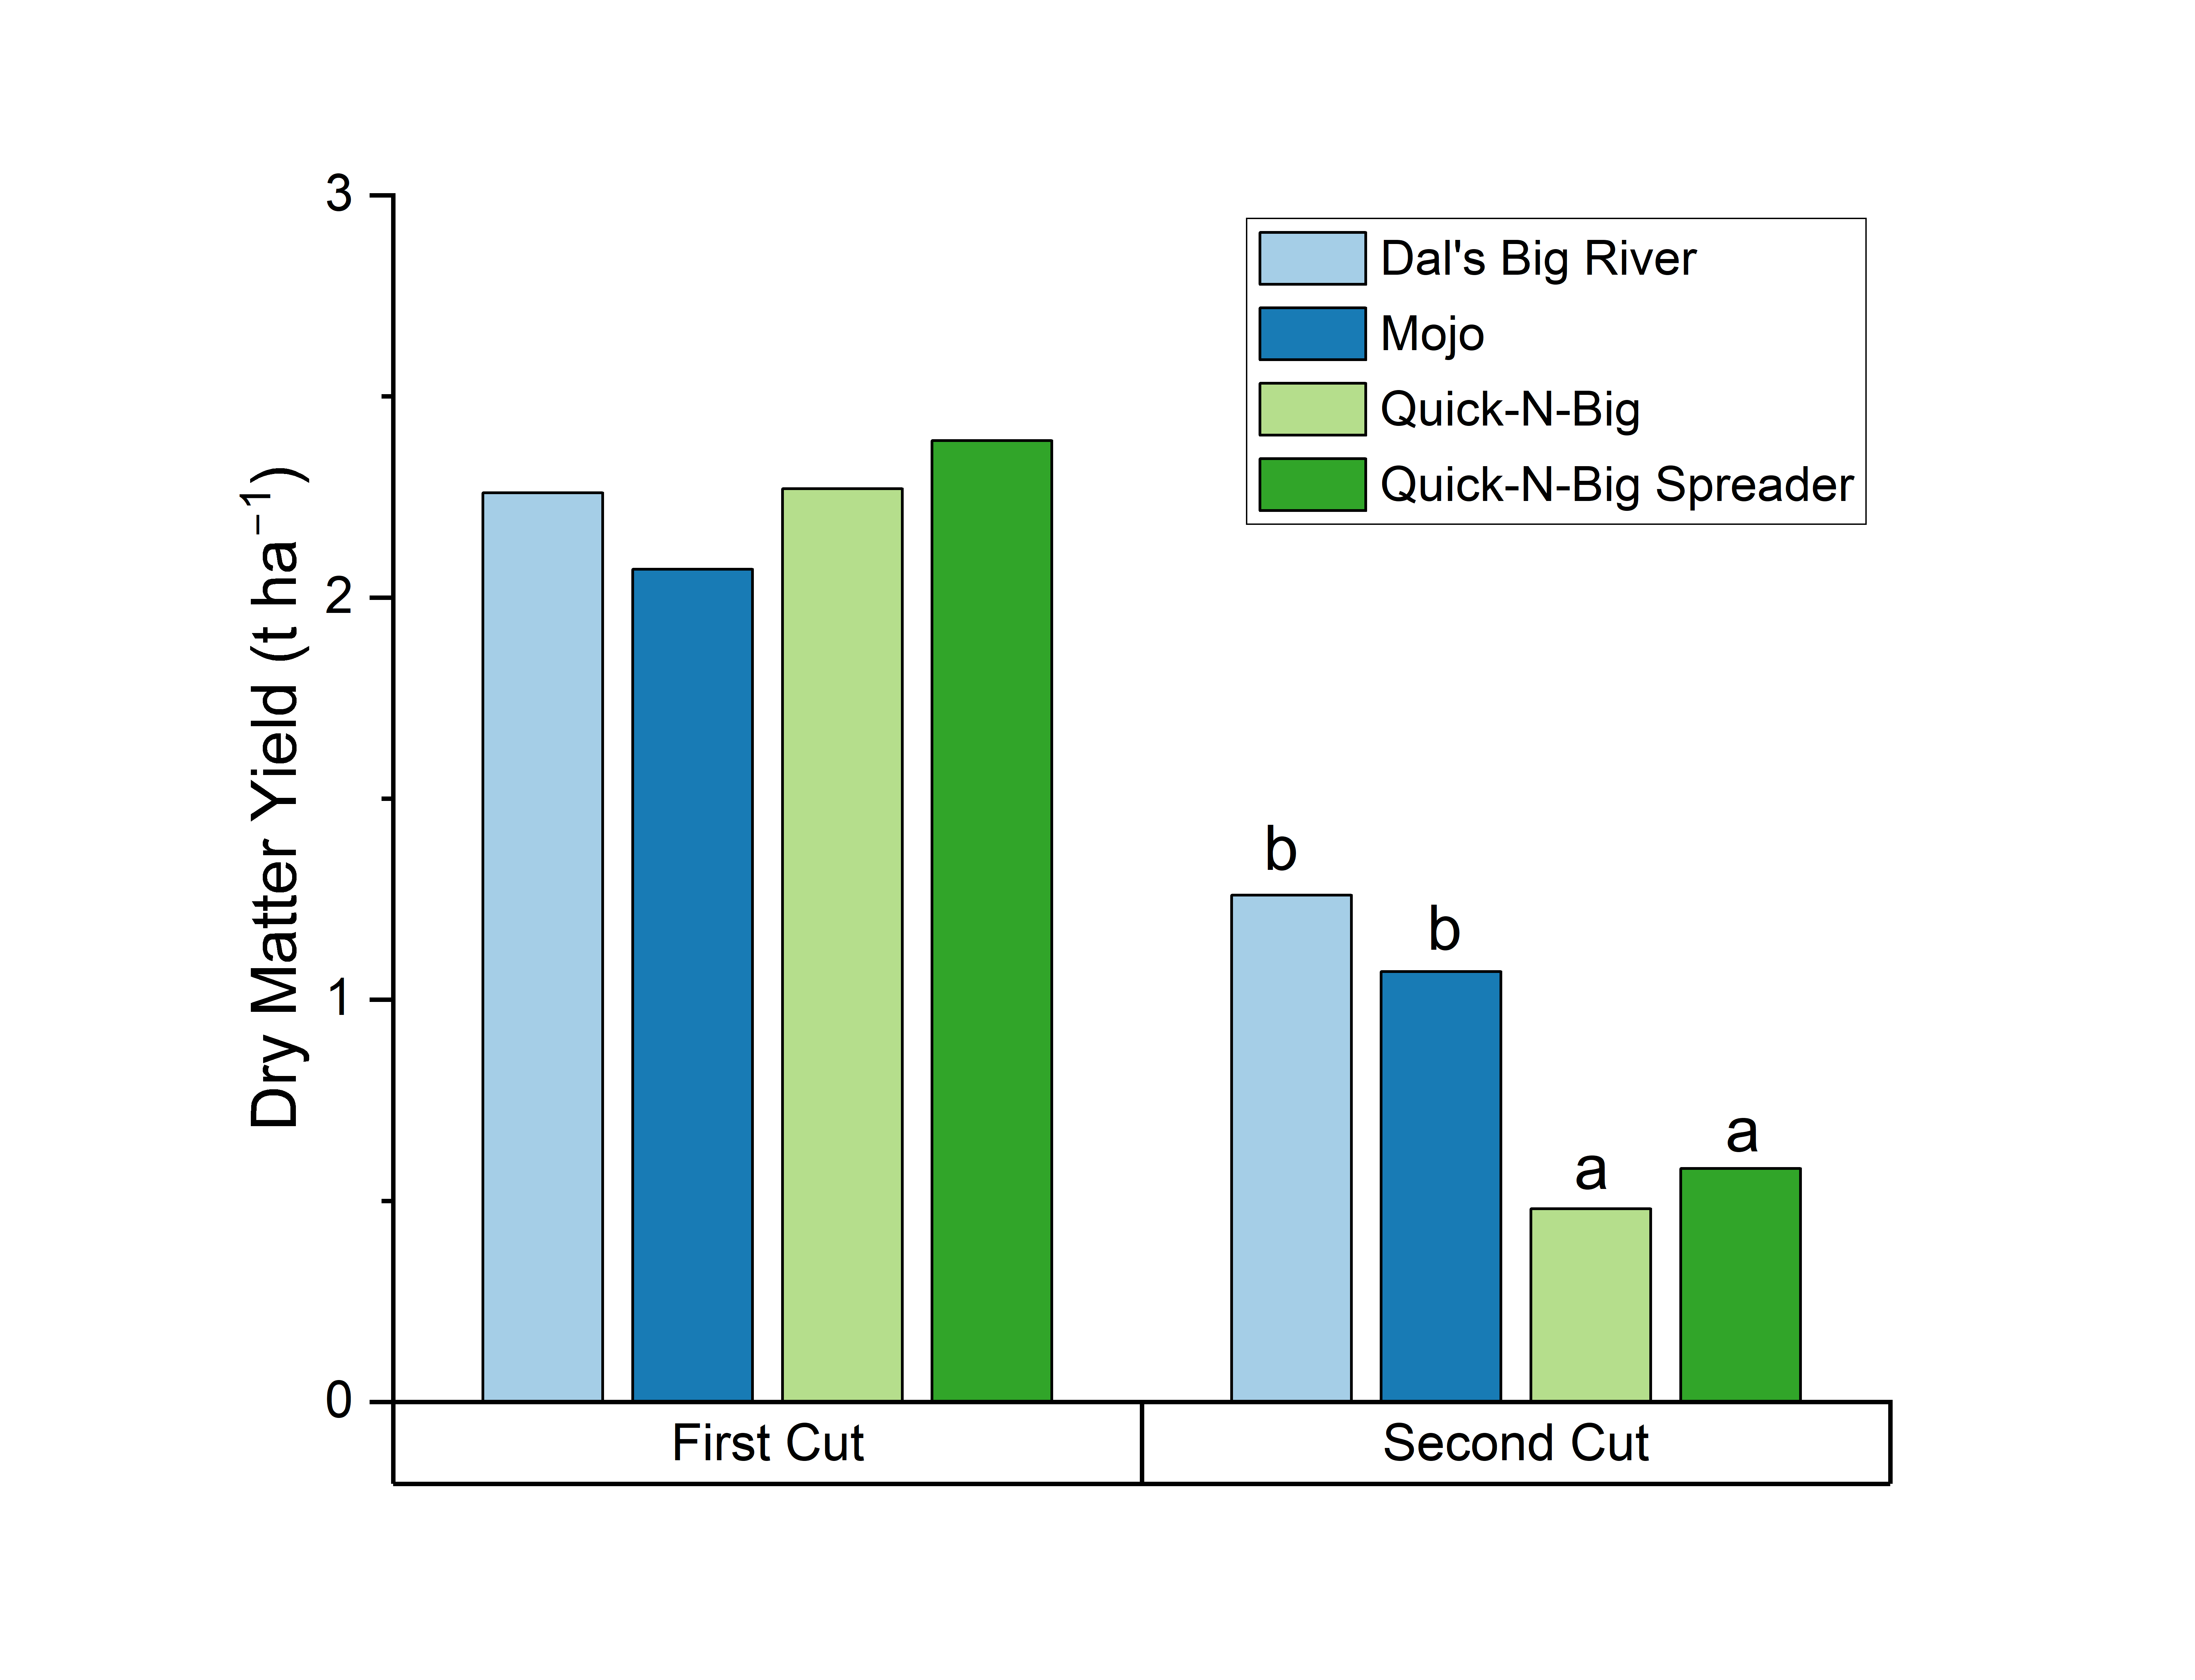
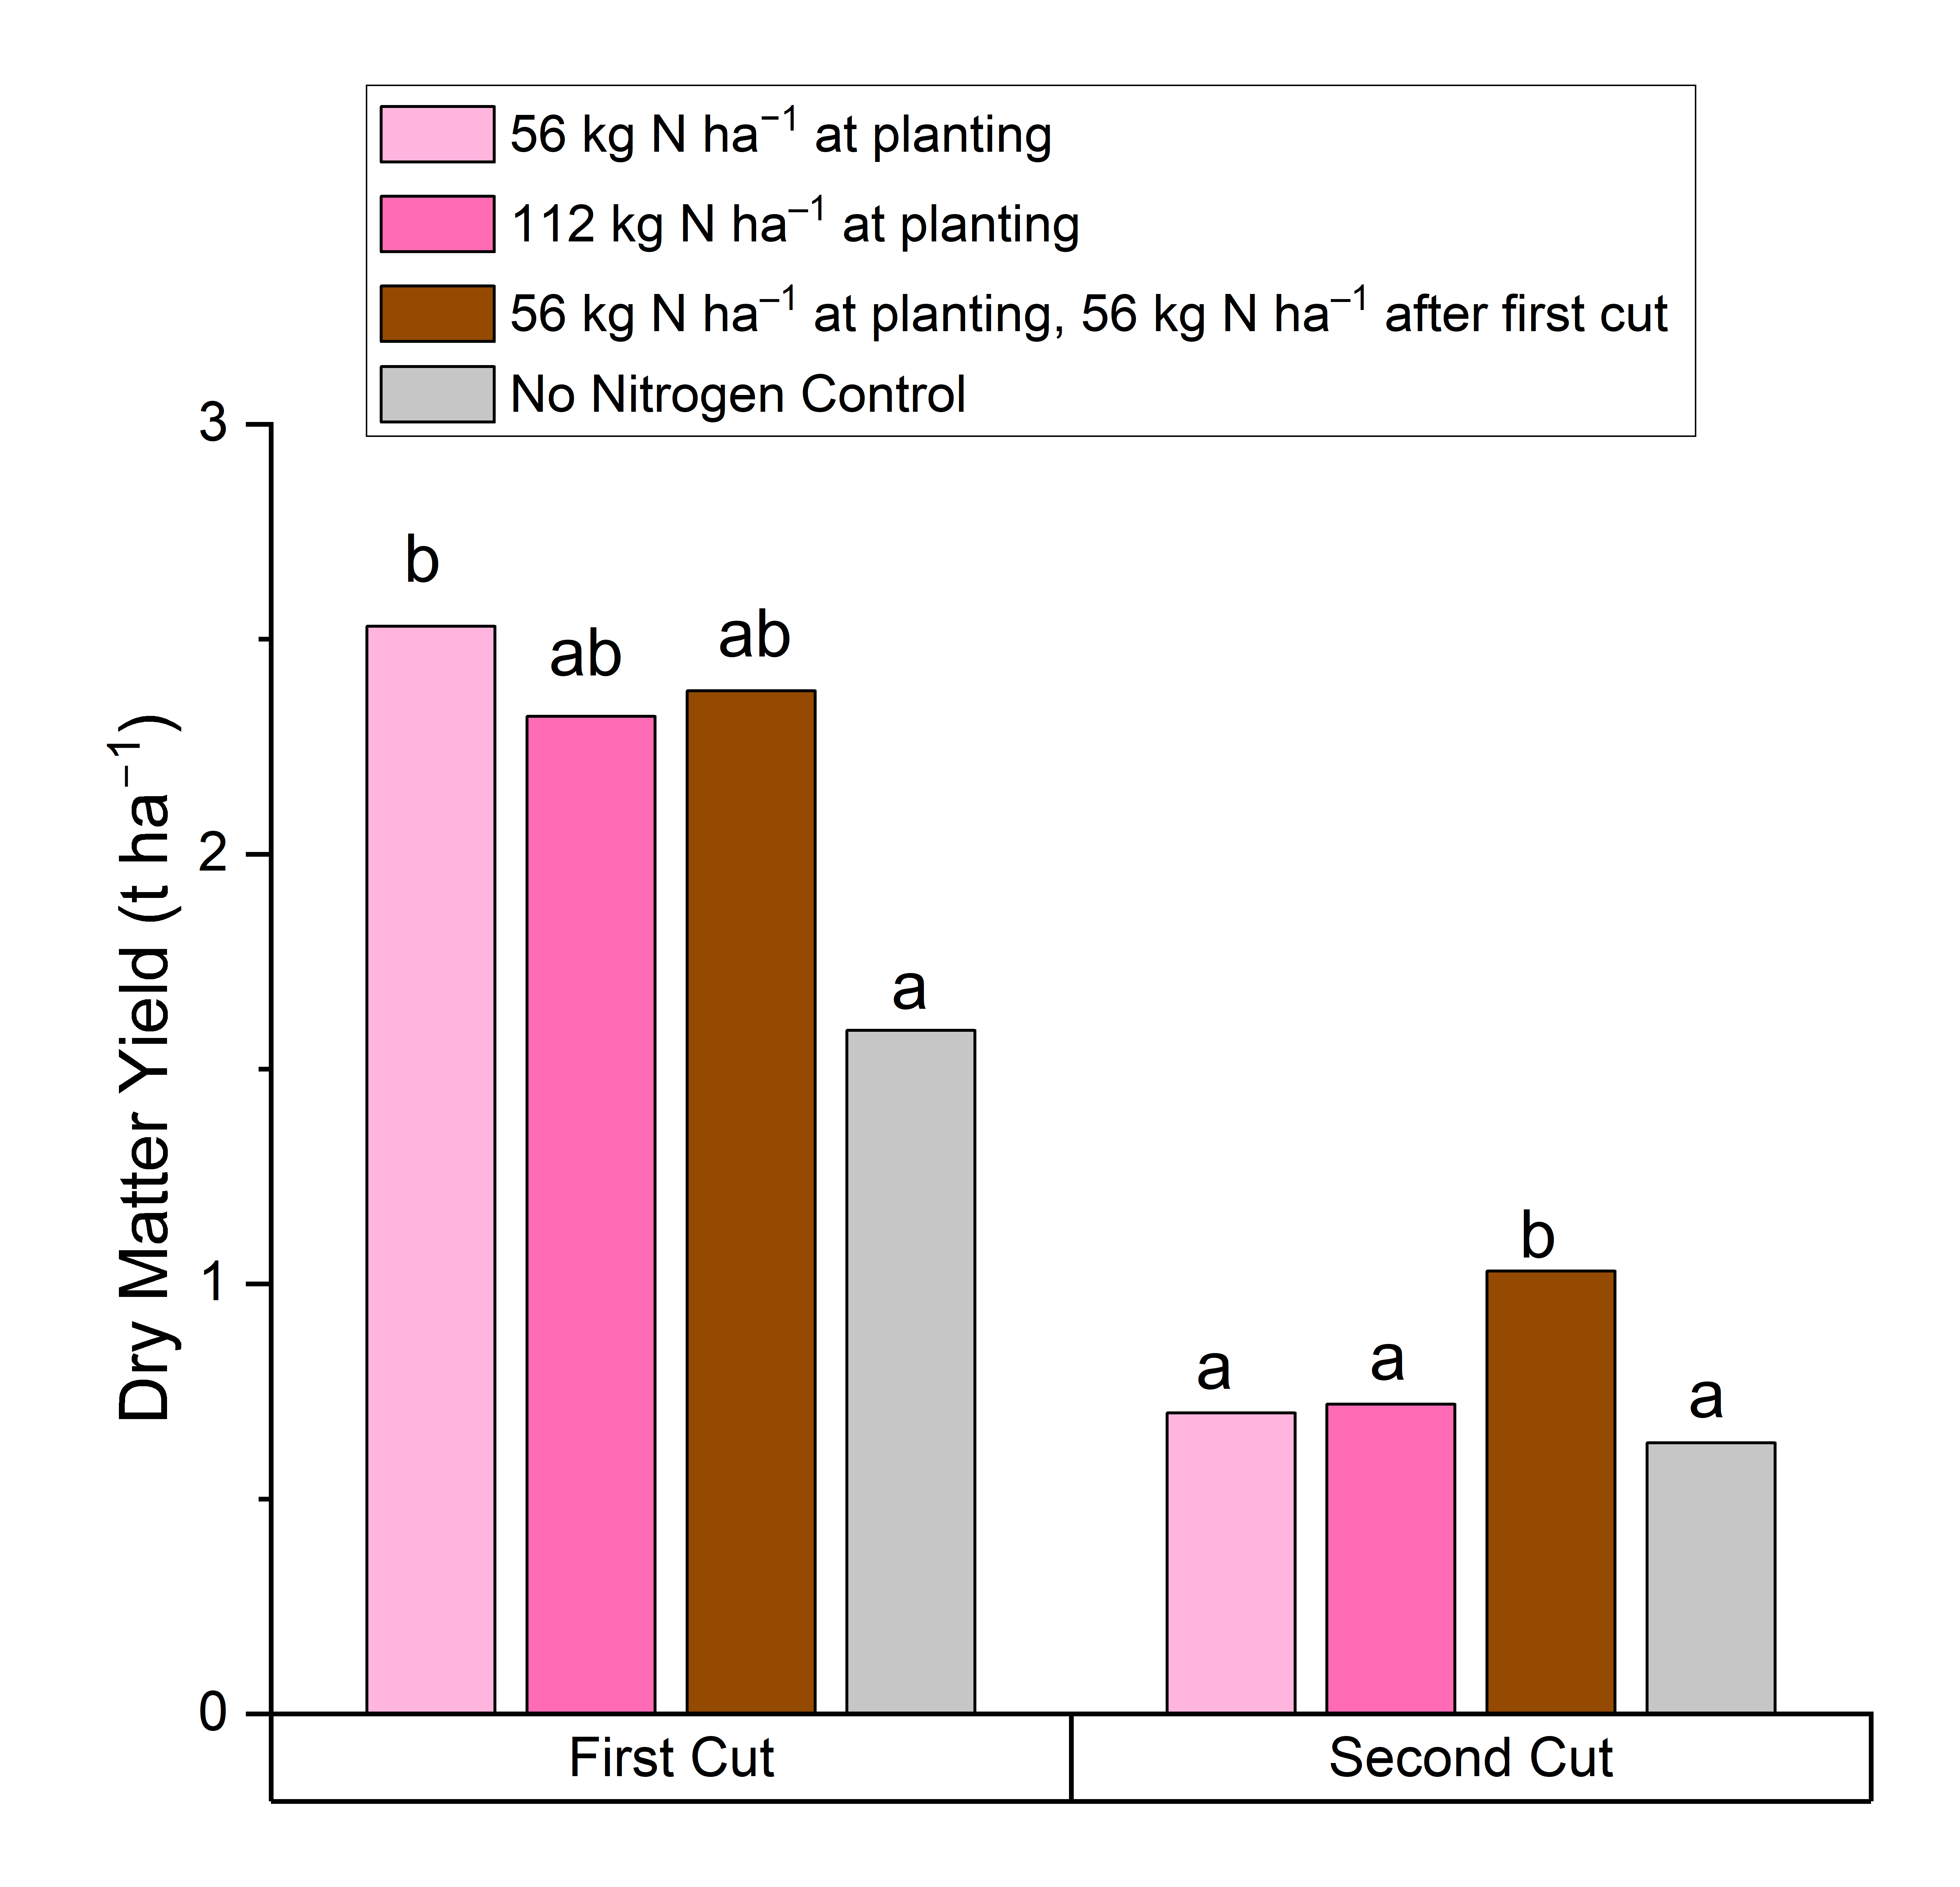
Crabgrass yield increased faster when planted in the summer than in the late spring (Figure 1, Table 2). Both yield and height were higher between 4 and 9 weeks of age at later planting dates (Table 2 and Table 3). For example, mid-May planting had a yield of 0.65 t ha–1 five weeks after planting while the same age plants had higher yields the later the planting date (early June: 1.47 t ha–1, mid-June: 1.91 t ha–1, late June: 2.12 t ha–1). Increasing the seeding rate led to higher yield on average (2.18 t ha–1 at 10.1 kg seed ha–1 compared to 1.98 t ha–1 at 6.7 kg seed ha–1 and 1.73 t ha–1 at 3.4 kg seed ha–1), although this effect was most notable for younger plants (Table 2). First cut yield was not different among varieties but D. ciliaris (DR and MO) had much better regrowth (average: 1.17 t ha–1) than the average of 0.53 t ha–1 in D. sanguinalis varieties (QB and QS) (Figure 2, Table 4). There was no yield response to more than 56 kg N/ha for the first cut and but applying an additional 56 kg N/ha increased second cut yield to 1.03 t ha–1 compared to an average of 0.68 t ha–1 after either single application of N fertilizer at planting treatment (Table 4, Figure 3). In terms of both yield and height, mid- and late June planted crabgrass at 4 weeks old (yield: 1.20 t ha–1, height: 39 cm) was roughly comparable to early June at 5 weeks old (yield: 1.47 t ha–1, height: 48 cm) and mid-May at 6 weeks (yield: 0.94 ha–1, height: 45 cm) (Table 2 and Table 3). The differences at the end of sampling were also consistent with slower growth at earlier planting dates, especially mid-May, and at 9 weeks, later planting dates led to higher yield (mid-May: 3.00 t ha–1, early June: 3.68 t ha–1, mid-June: 3.96 t ha–1, late June: 4.61 t ha–1) (Table 2, Figure 1).
Protein
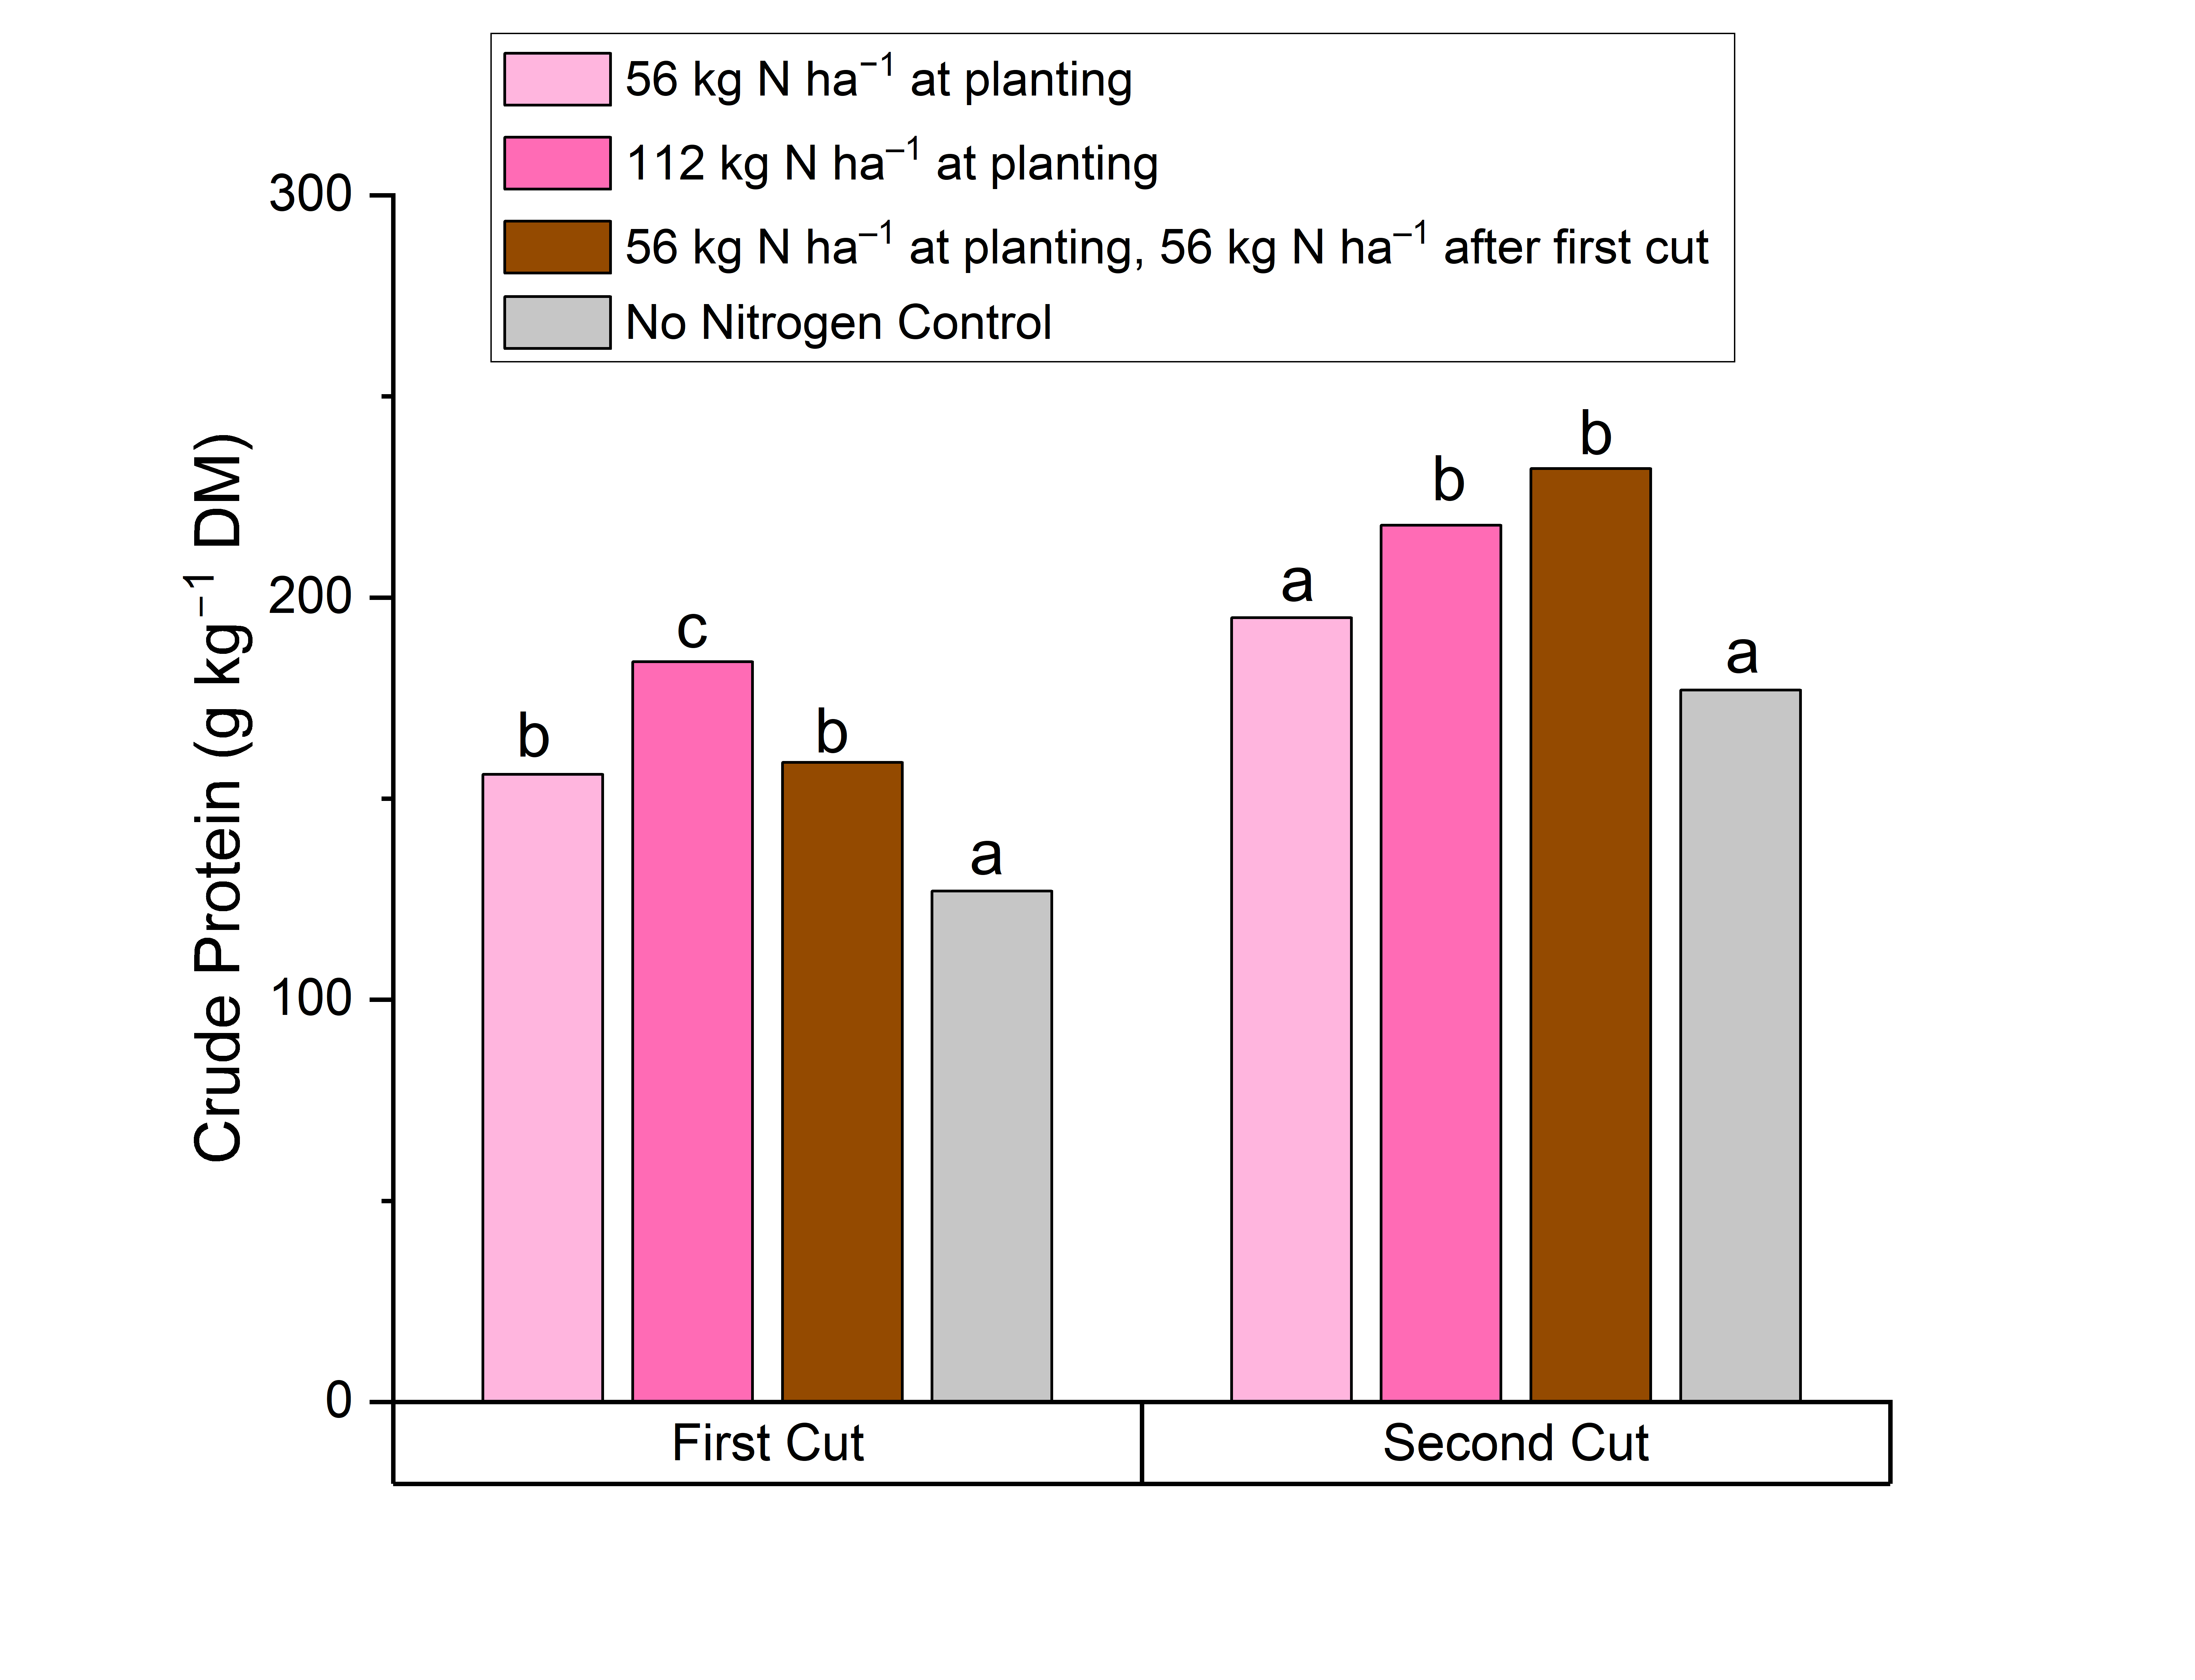
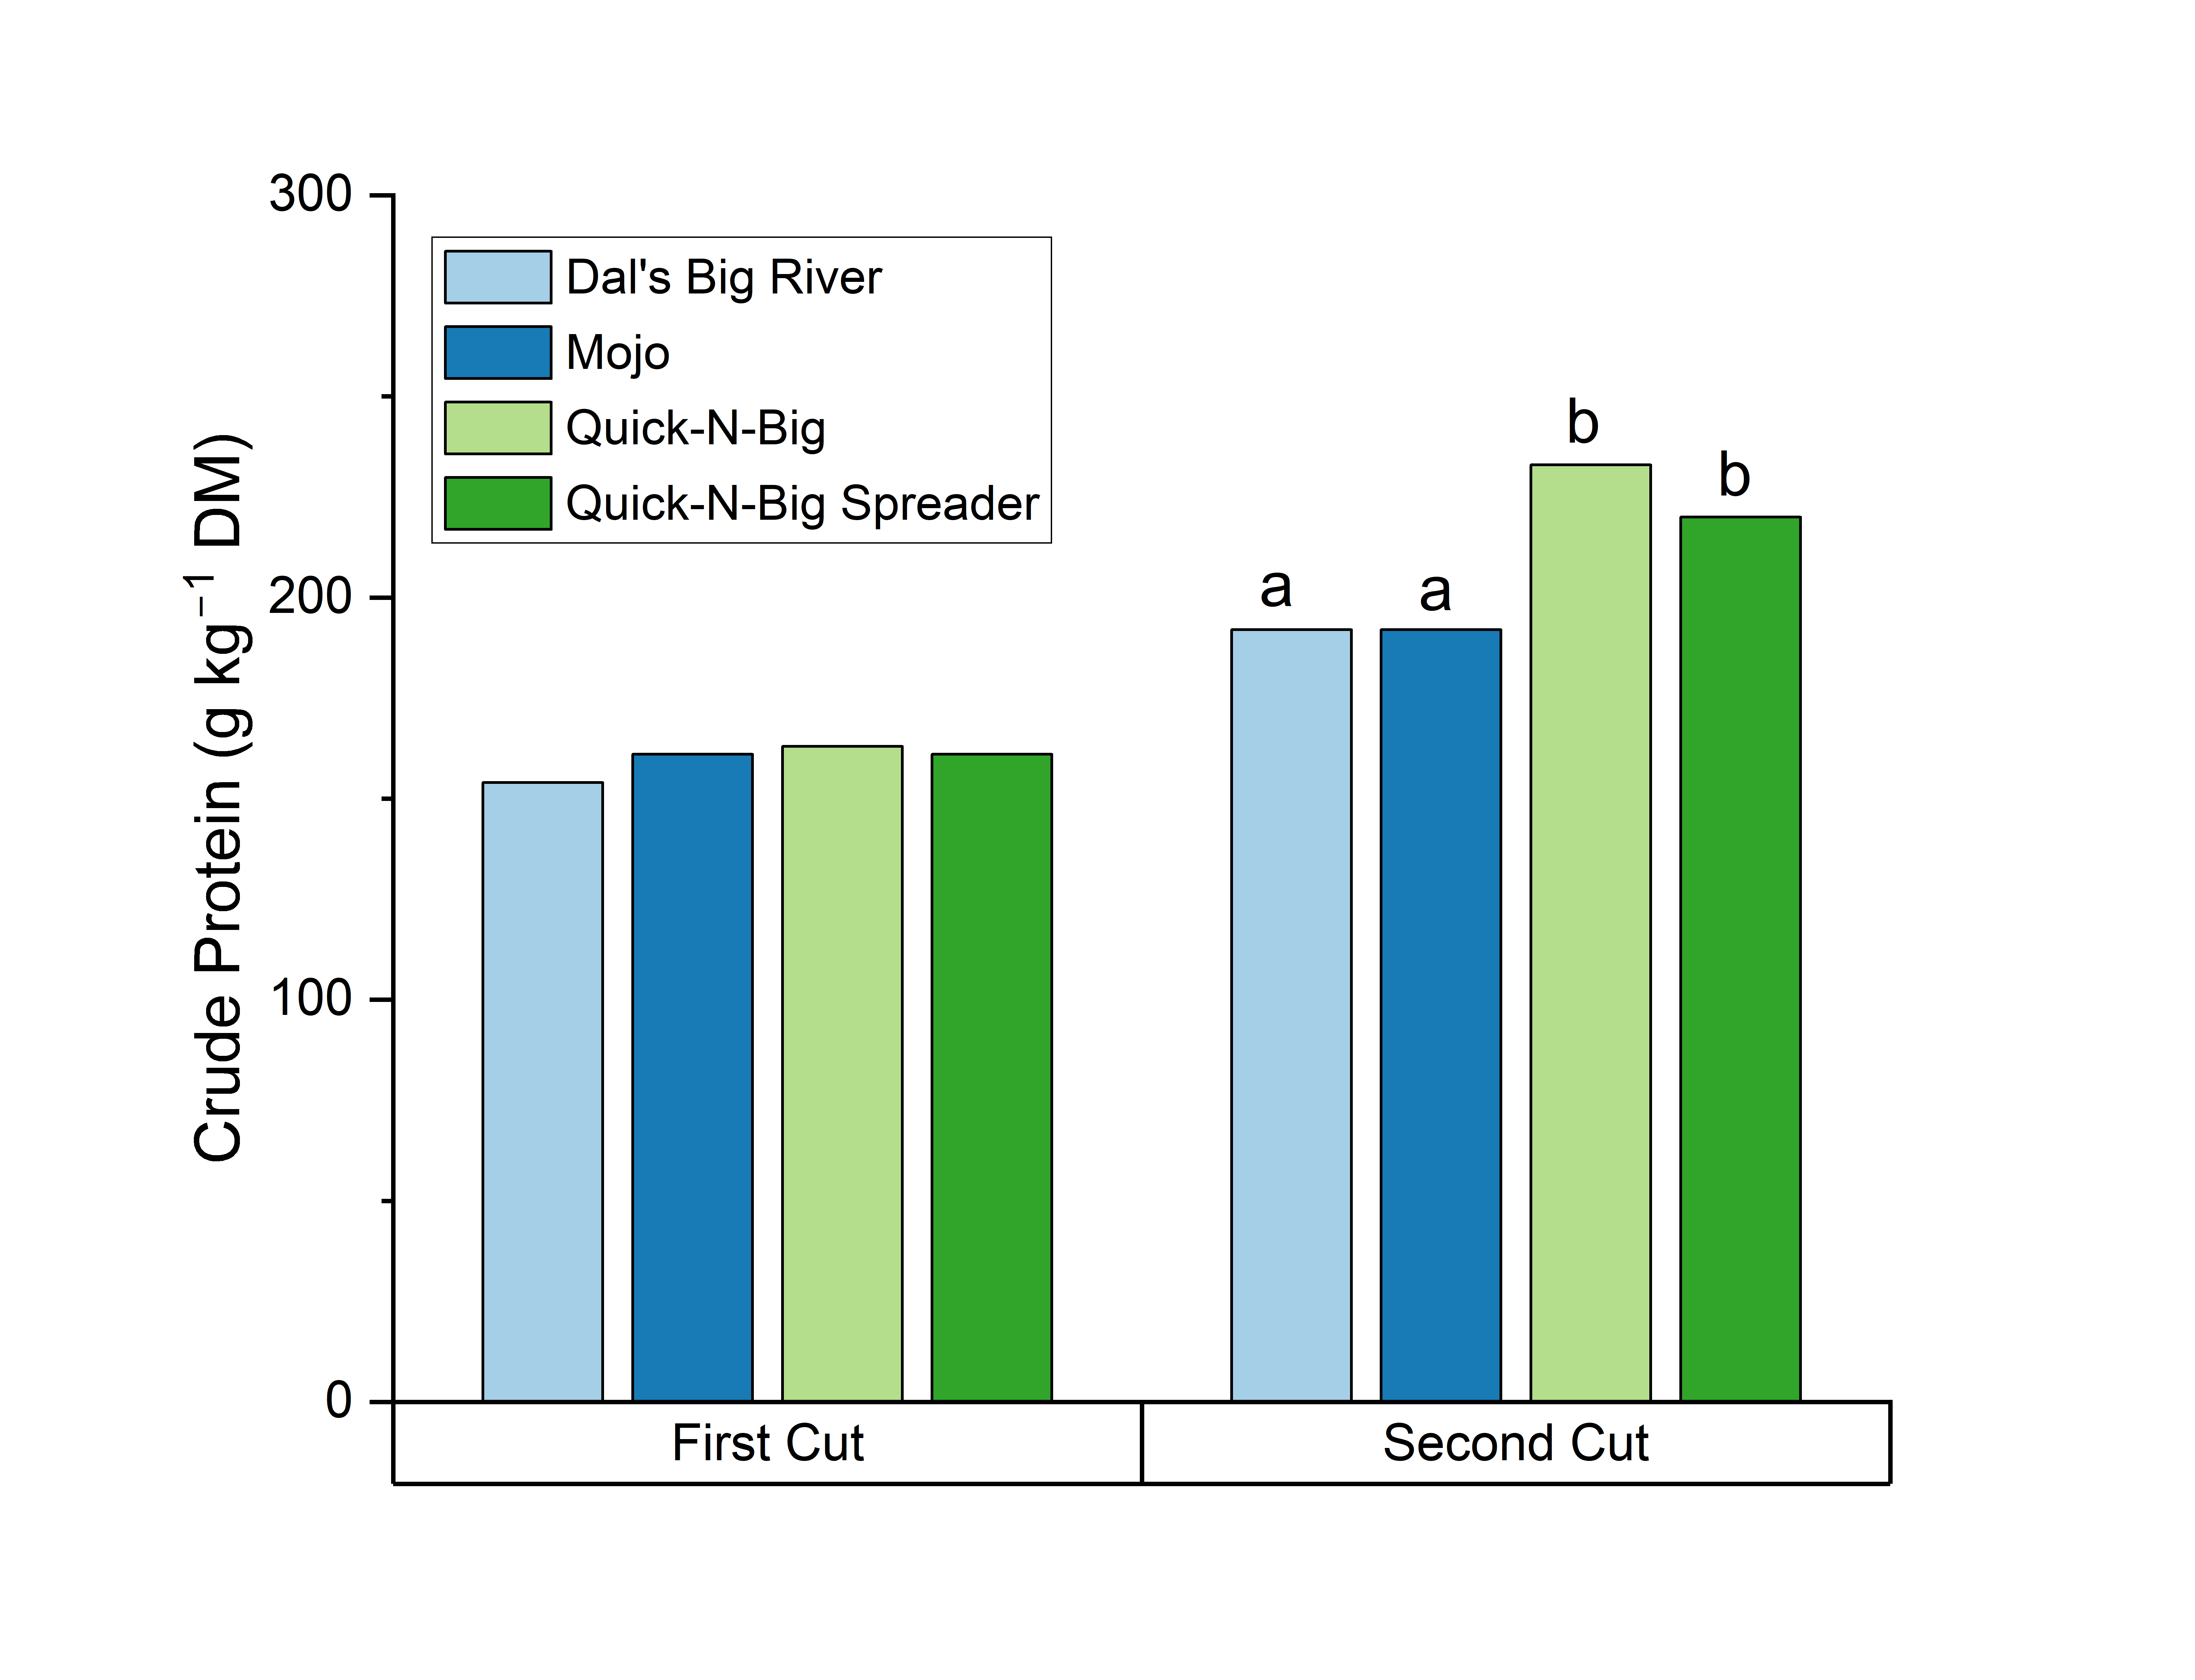
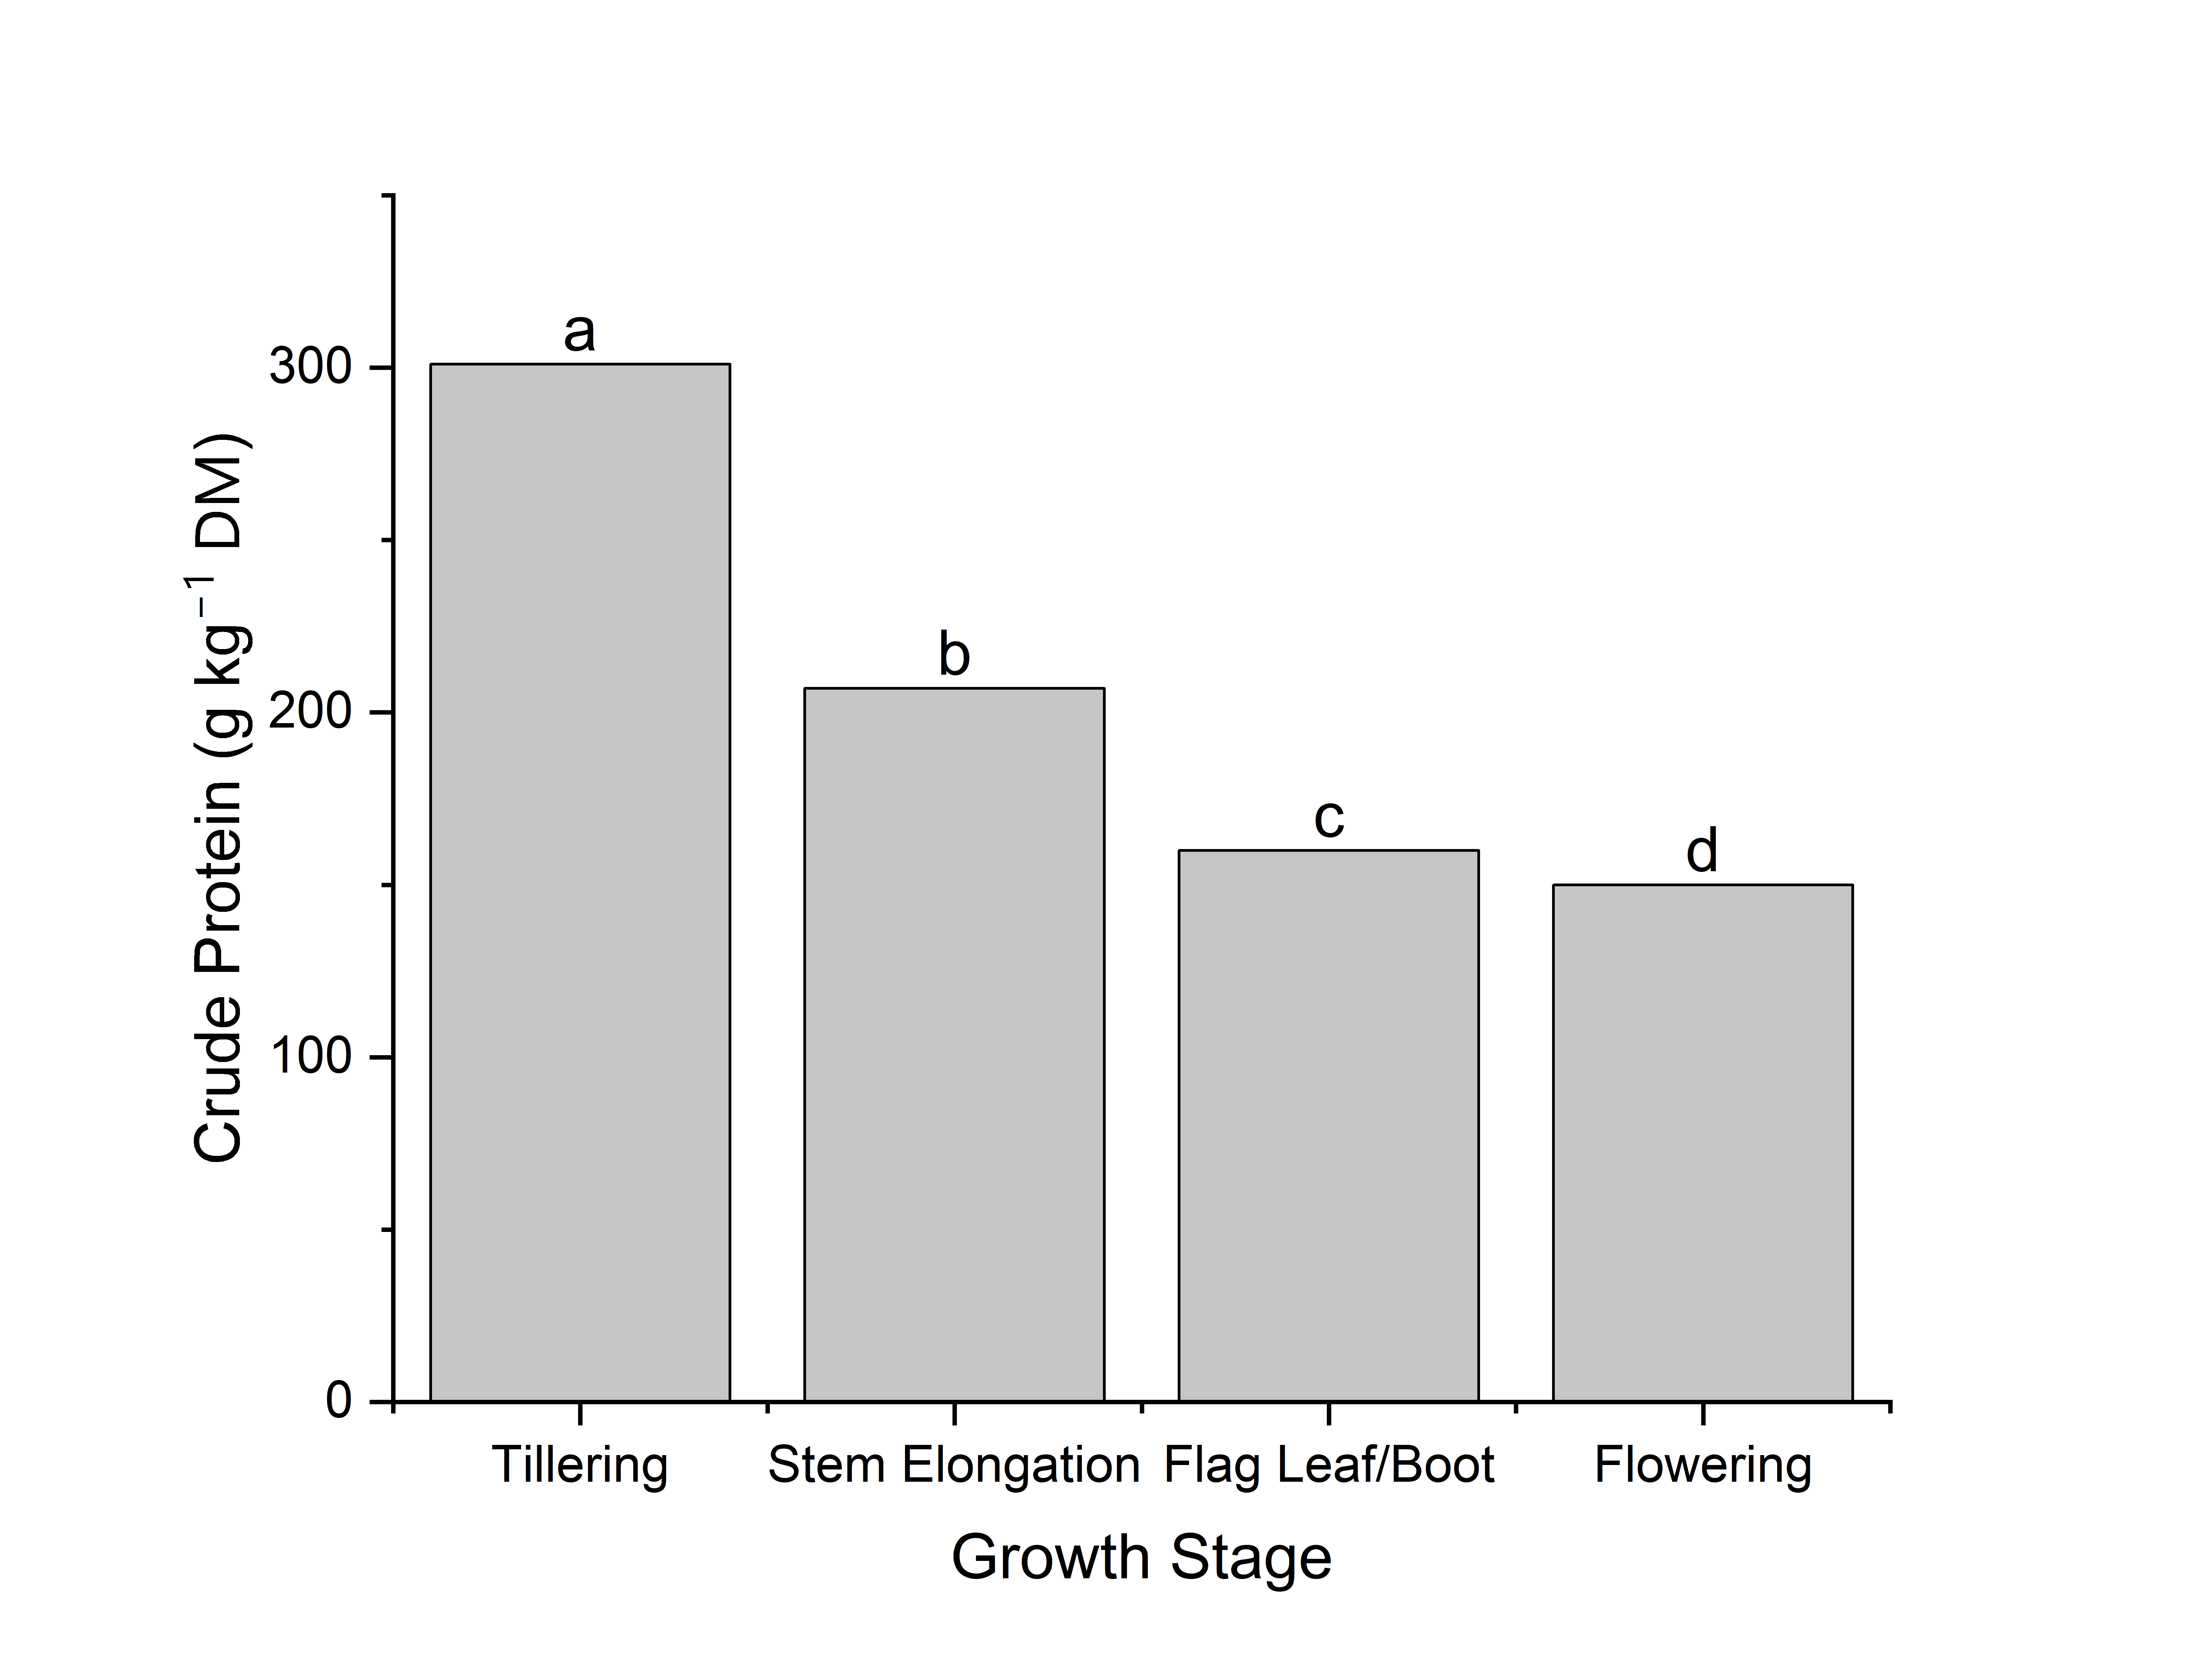
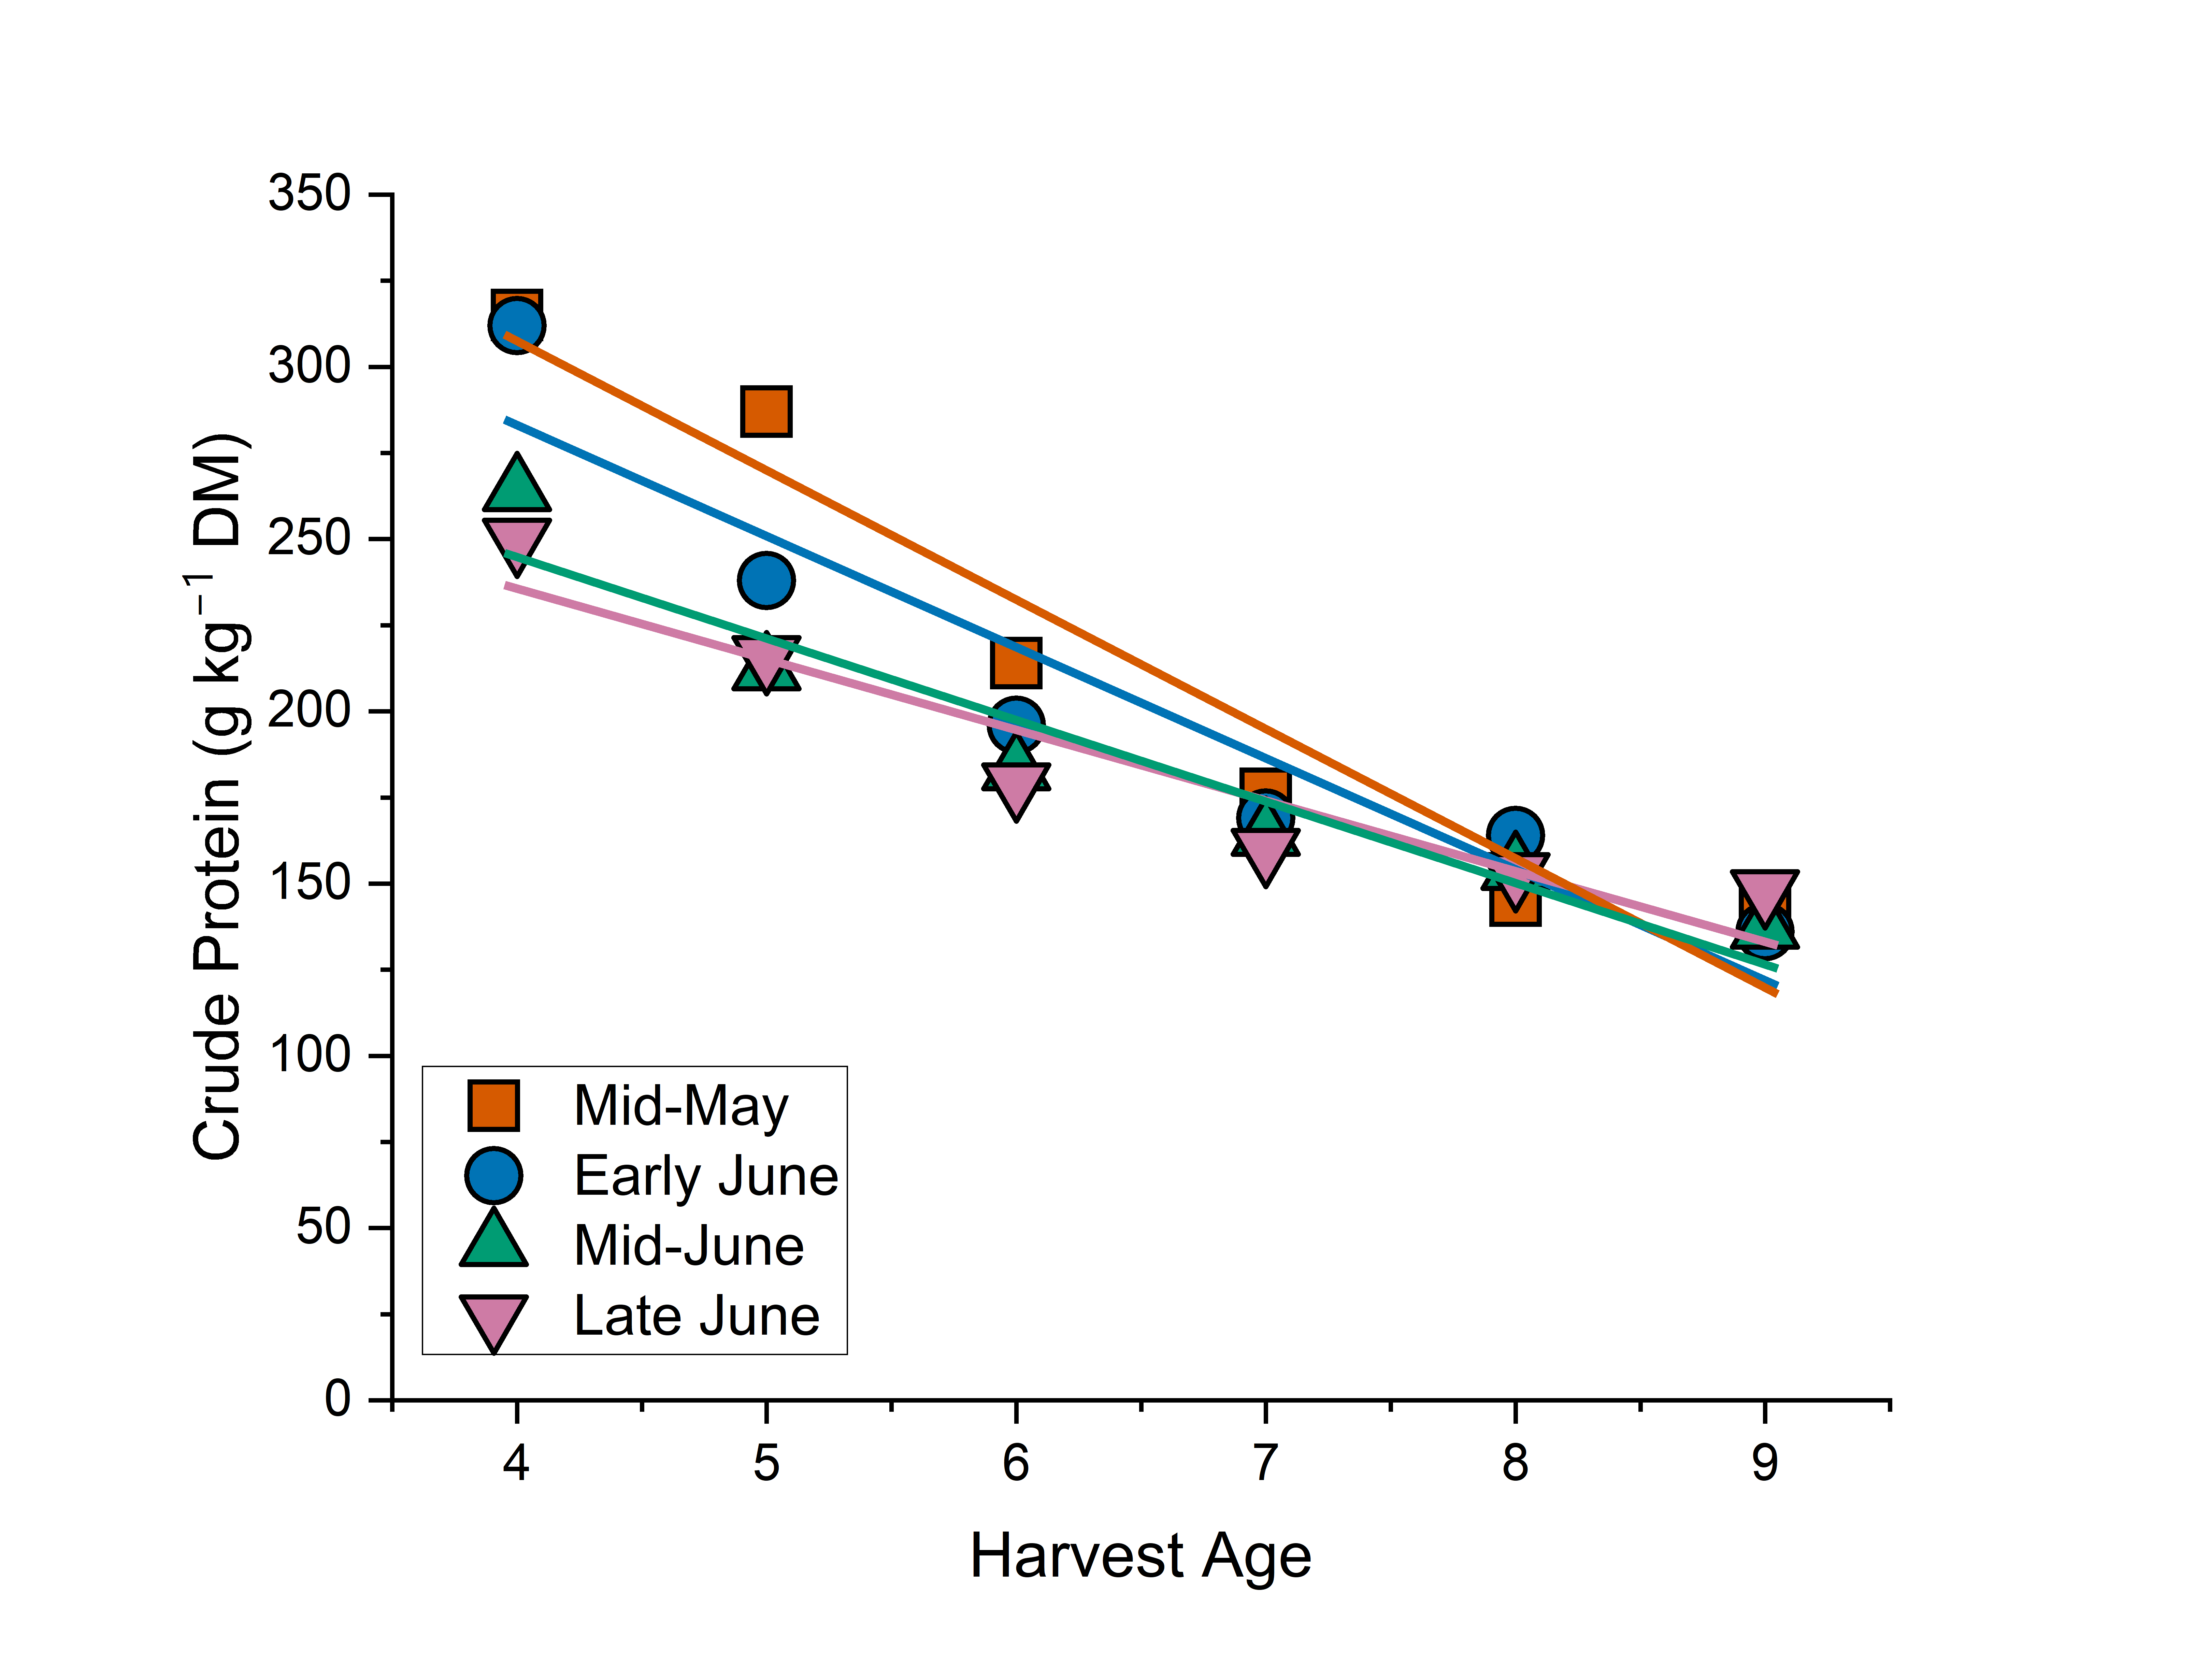
All crabgrass varieties had higher protein content at higher N fertilizer rates and during the second cutting (Table 4, Figure 4). QB and QS (D. sanguinalis) protein content increased more between the first and second cuts (from 162 g kg–1 at first cutting to 227 g kg–1 at second cutting) than between first and second cutting in DR and MO (D. ciliaris) (first cut: 158 g kg–1, second cut: 192 g kg–1) (Table 4, Figure 5). In terms of both age and growth stage, the protein content across all varieties dropped from 301 g kg–1 at tillering to 150 g ka–1 at flowering as the plants matured (Table 5, Figure 6). Because earlier plantings were less mature after four weeks, they had correspondingly higher average protein content (mid-May and early June: 314 g kg–1, mid- and late June: 257 g kg–1), but all planting dates had similar protein content after 9 weeks when they were all at flowering stage (141 g kg–1 across all planting dates) (Figure 7, Table 6).
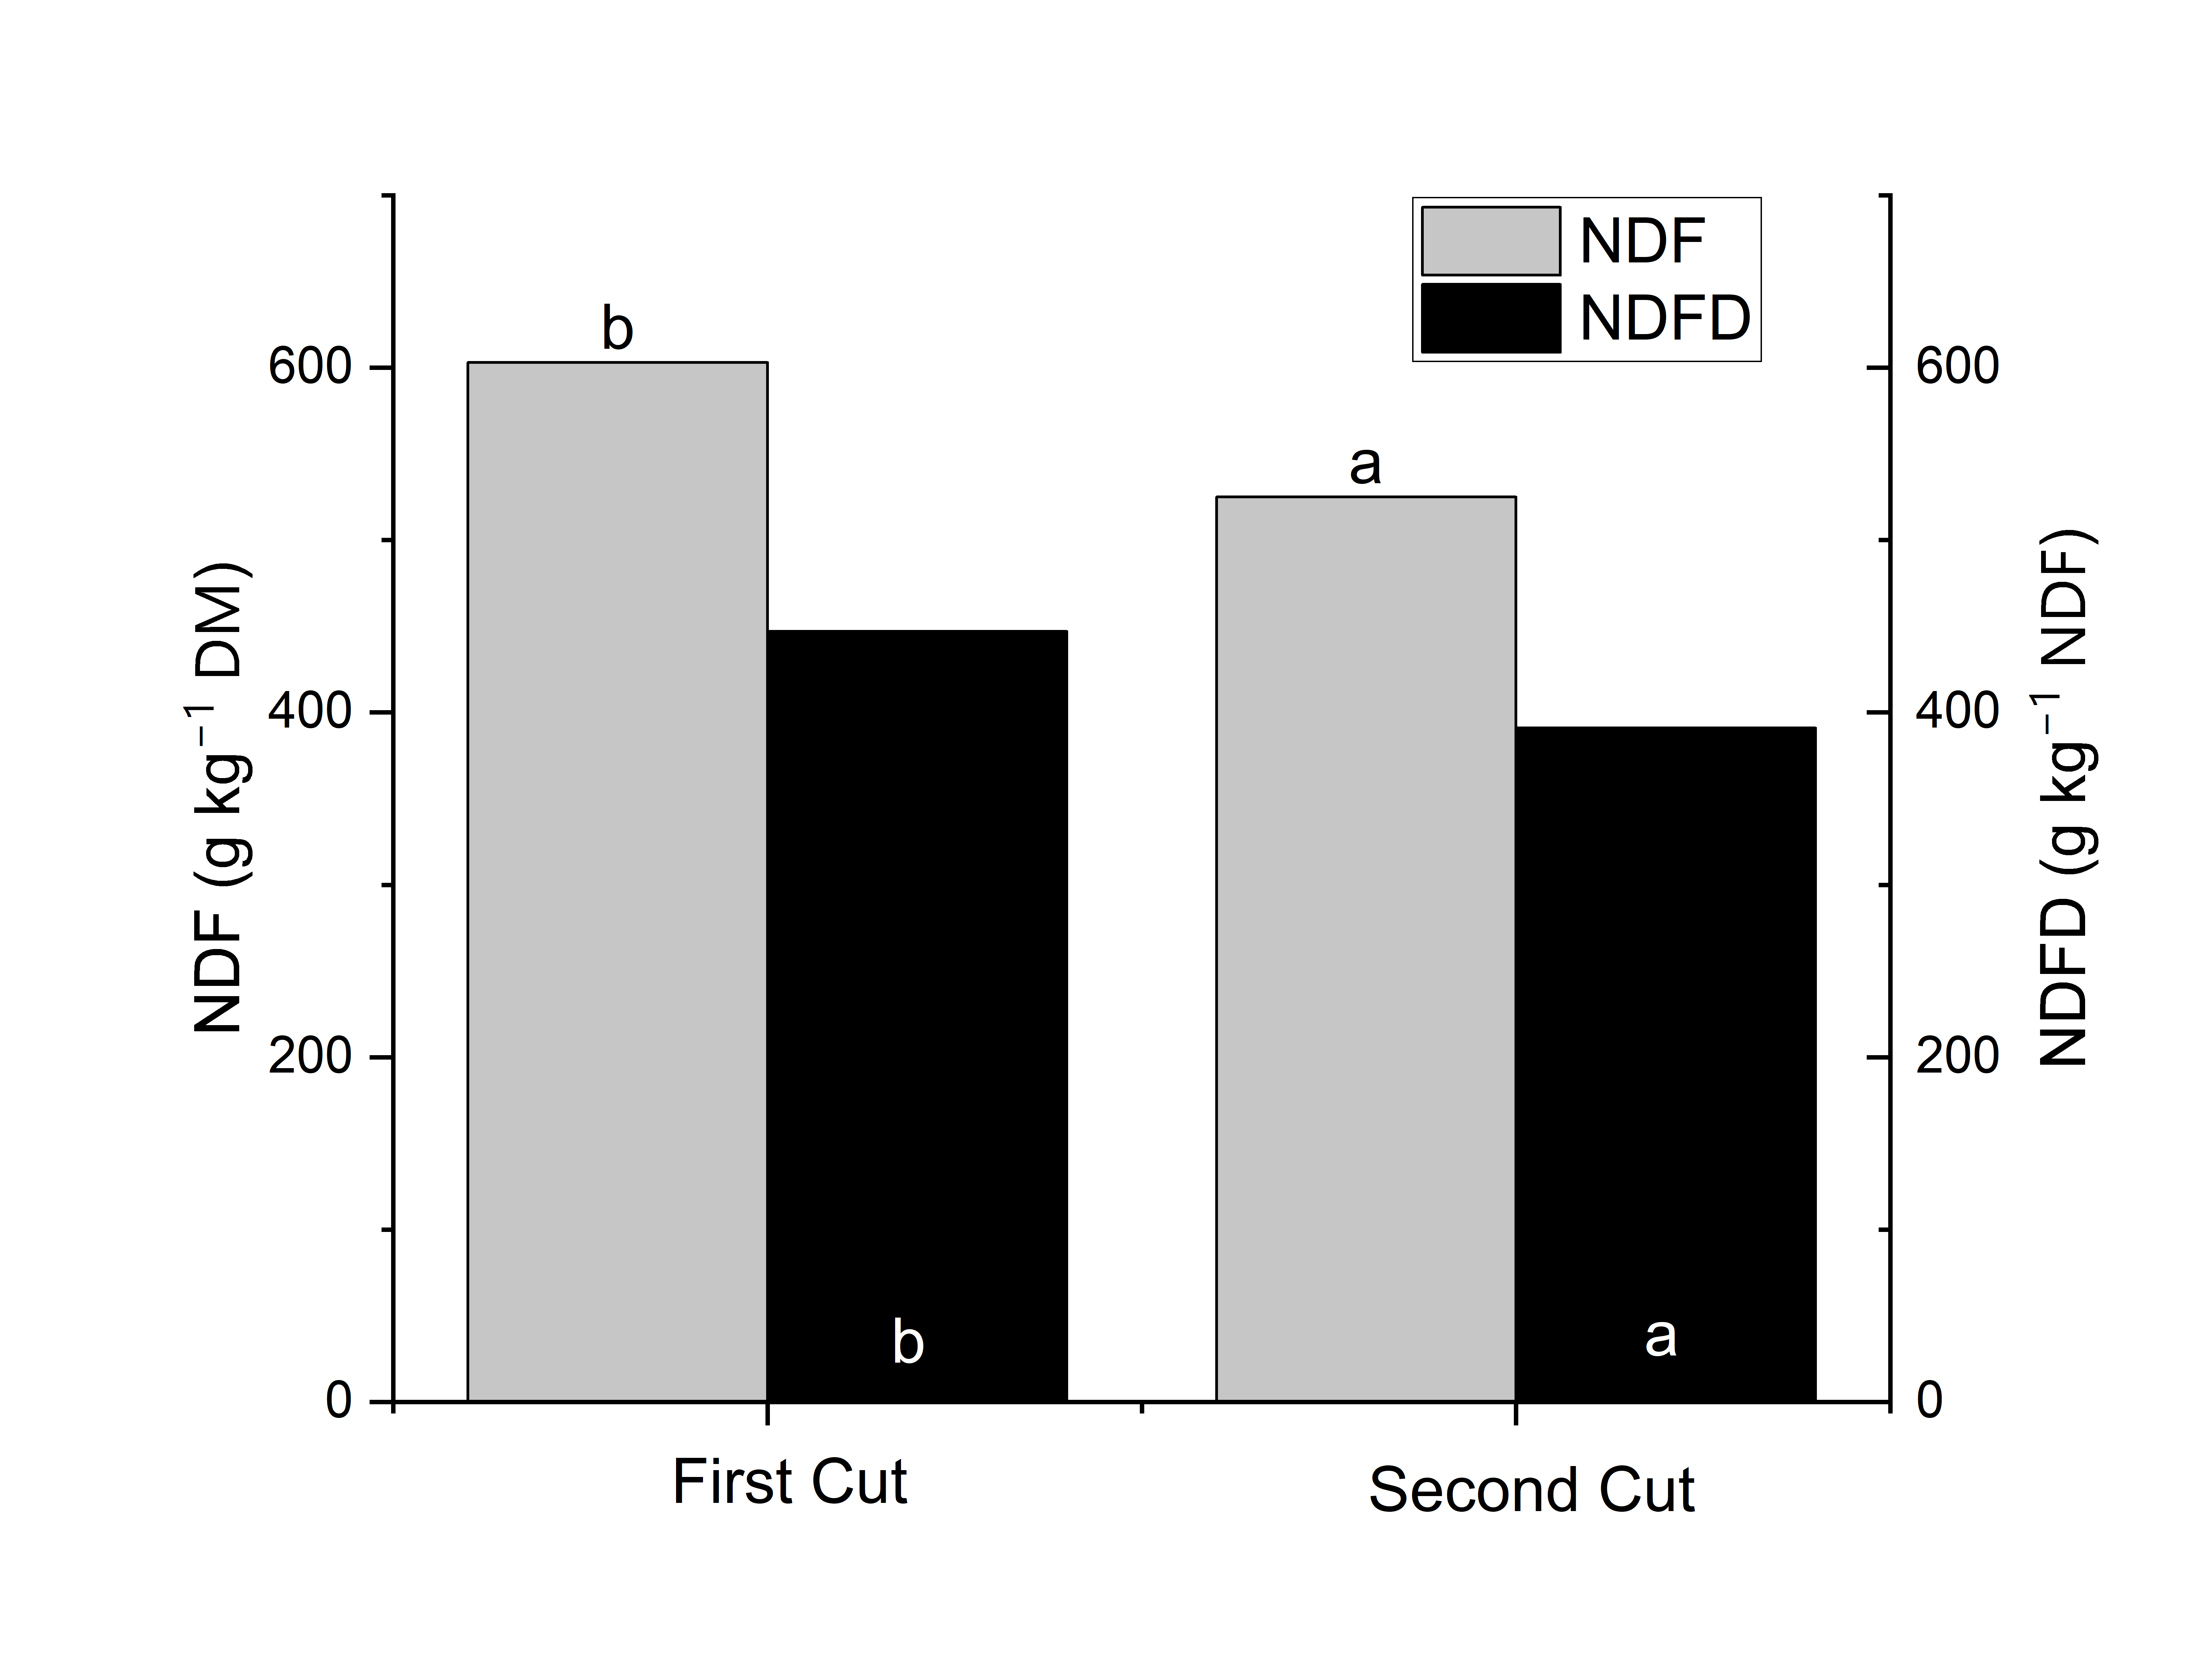
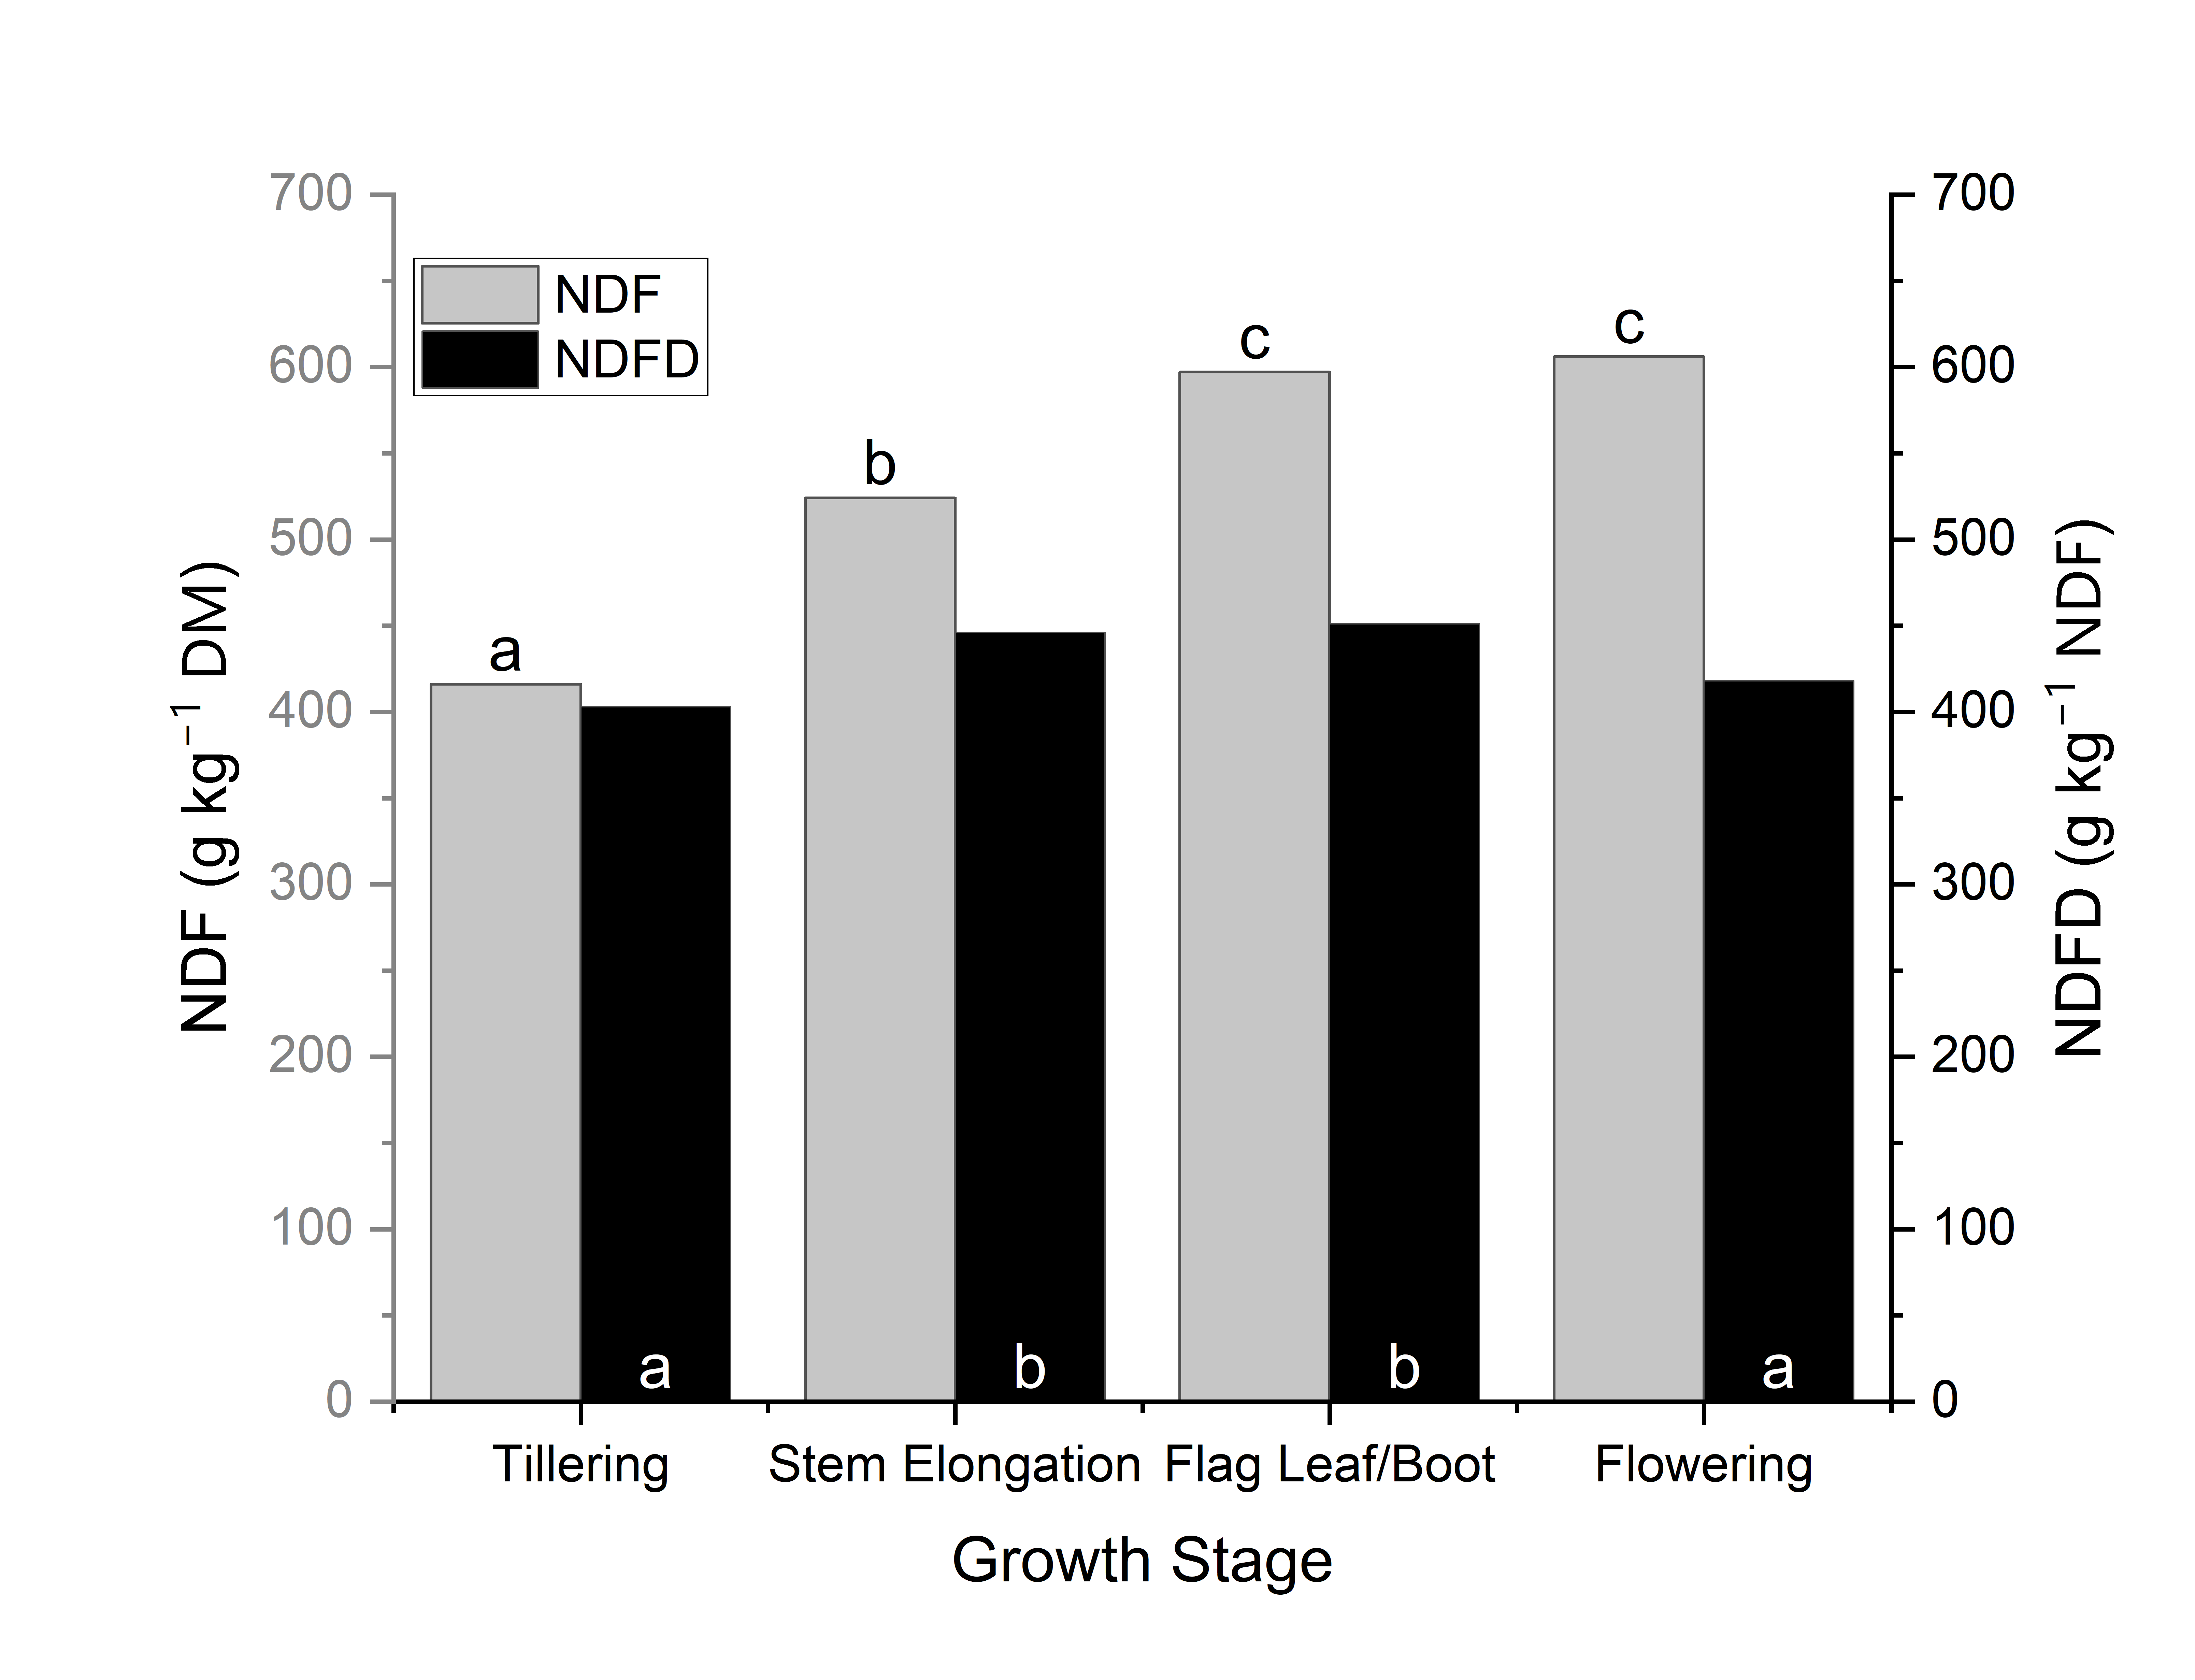
Fiber
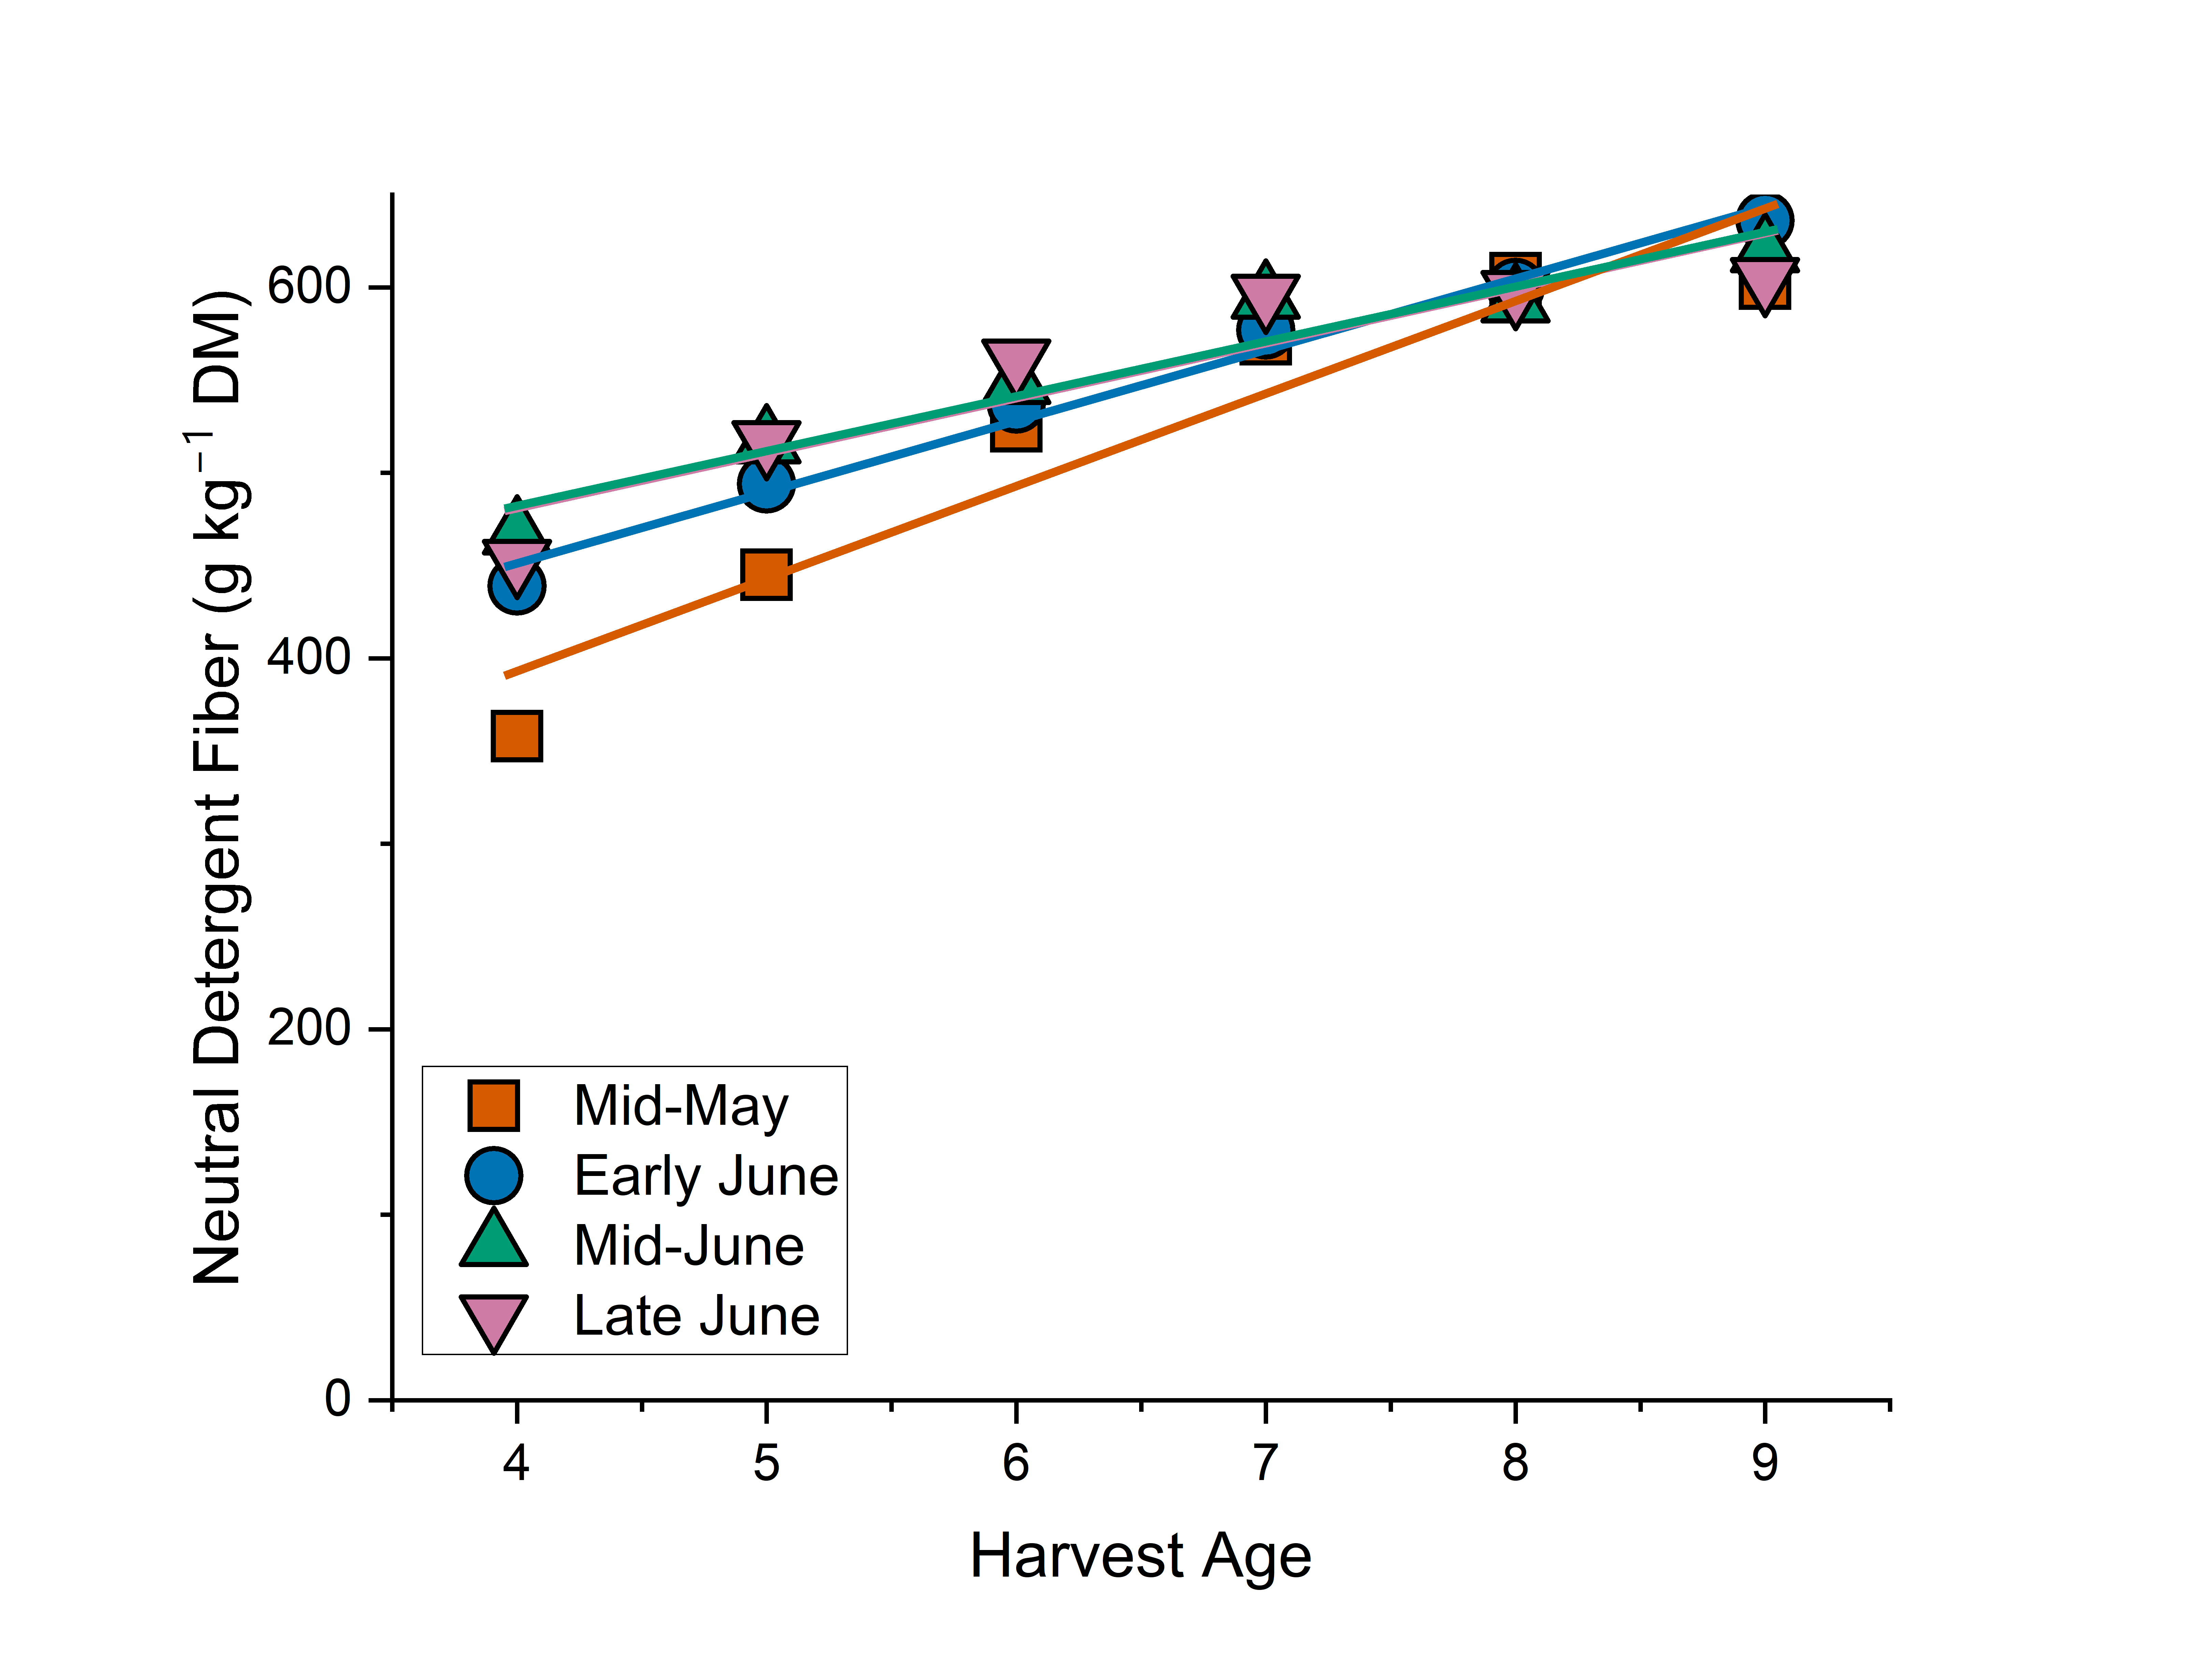
Both ADF and NDF content increased between four and nine weeks of age (ADF from 260 to 387 g kg–1 and NDF from 429 to 616 g kg–1) and at more mature stages of development (Table 3, Table 5, and Table 6; Figure 8). Lower N fertilization led to moderately higher fiber levels (Table 4). There were minimal differences between varieties, but all varieties had higher fiber content and digestibility at the first cutting (NDF: 603 g kg–1, NDF digestibility: 447 g kg NDF–1) than the second (NDF: 525 g kg–1, NDF digestibility: 391 g kg NDF–1) (Figure 9). Fiber digestibility peaked from stem elongation to flag leaf/boot stage at 446 to 451 g kg NDF–1 (Table 5, Figure 10). Combined with the different pace of development at different planting dates, this meant that fiber digestibility was higher towards the end of sampling for mid-May (450 g kg NDF–1 eight weeks after planting) and early June (494 g kg NDF–1 seven weeks after planting) planting dates and towards the beginning of sampling for later planting dates (mid-June: 449 g kg NDF–1 five weeks after planting, late June: 437 g kg NDF–1 four weeks after planting) (Figure 11). There were no differences in fiber digestibility among varieties or due to different nitrogen fertilization regimes (Table 4).

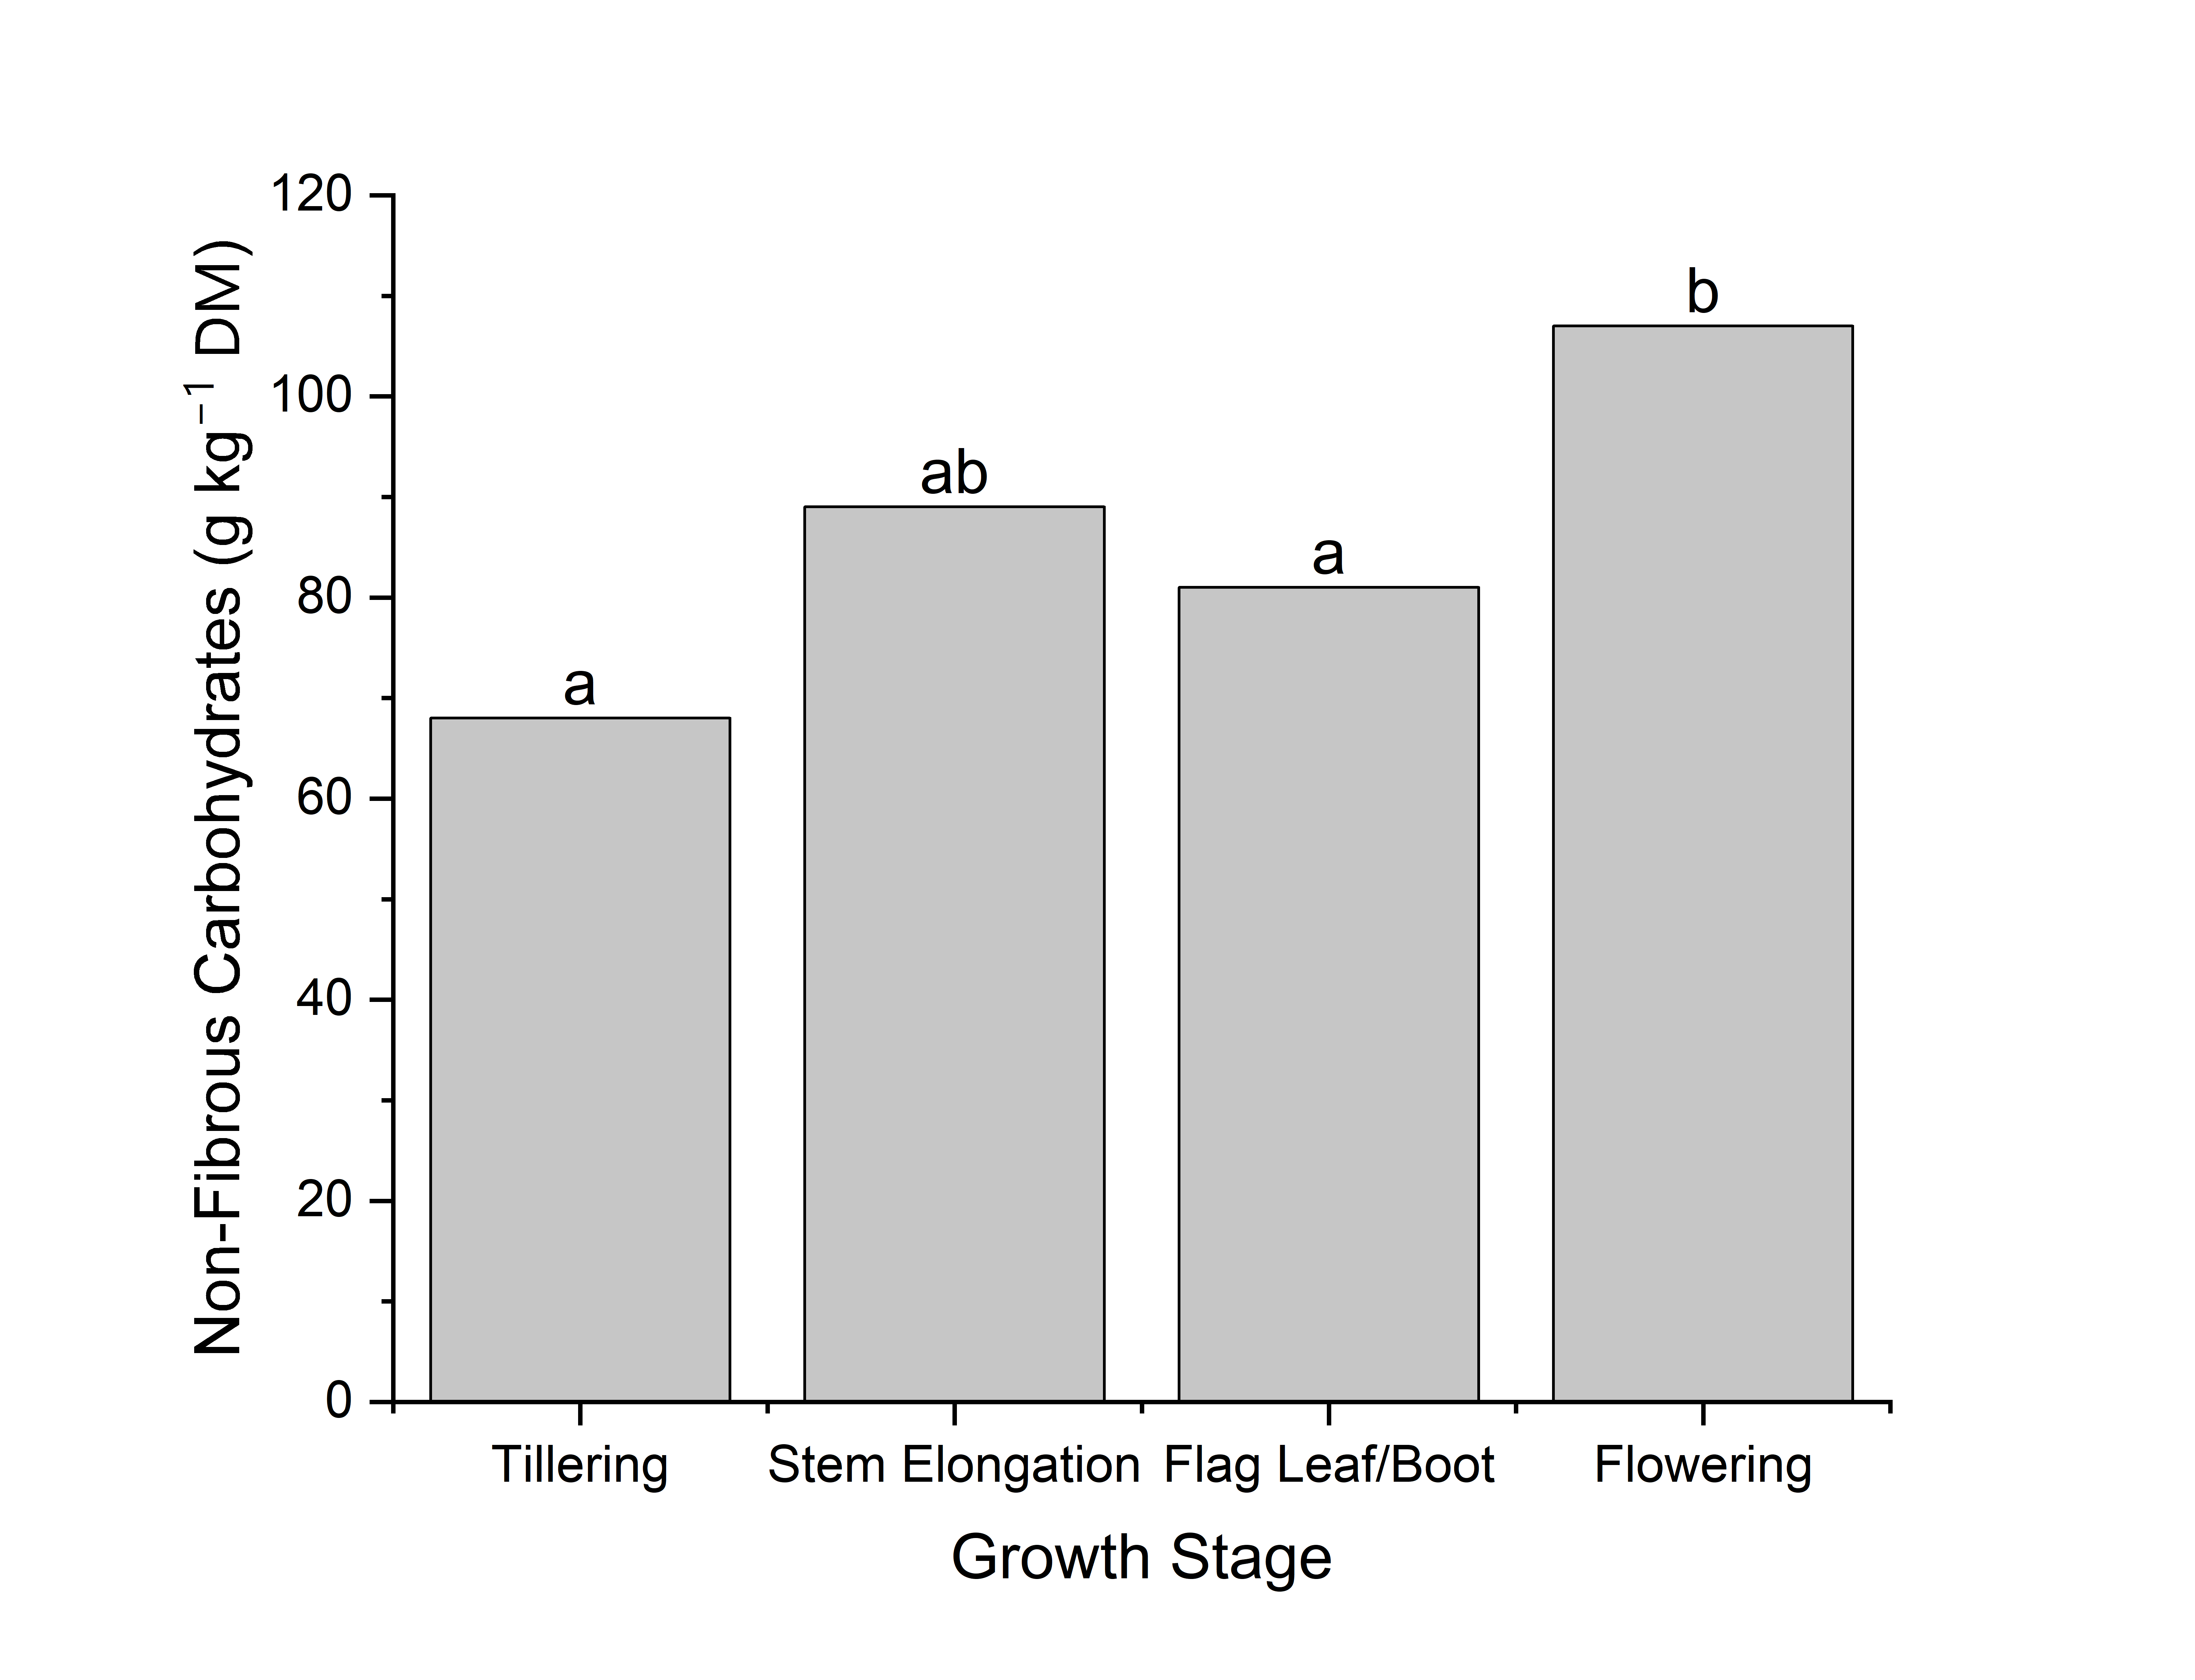
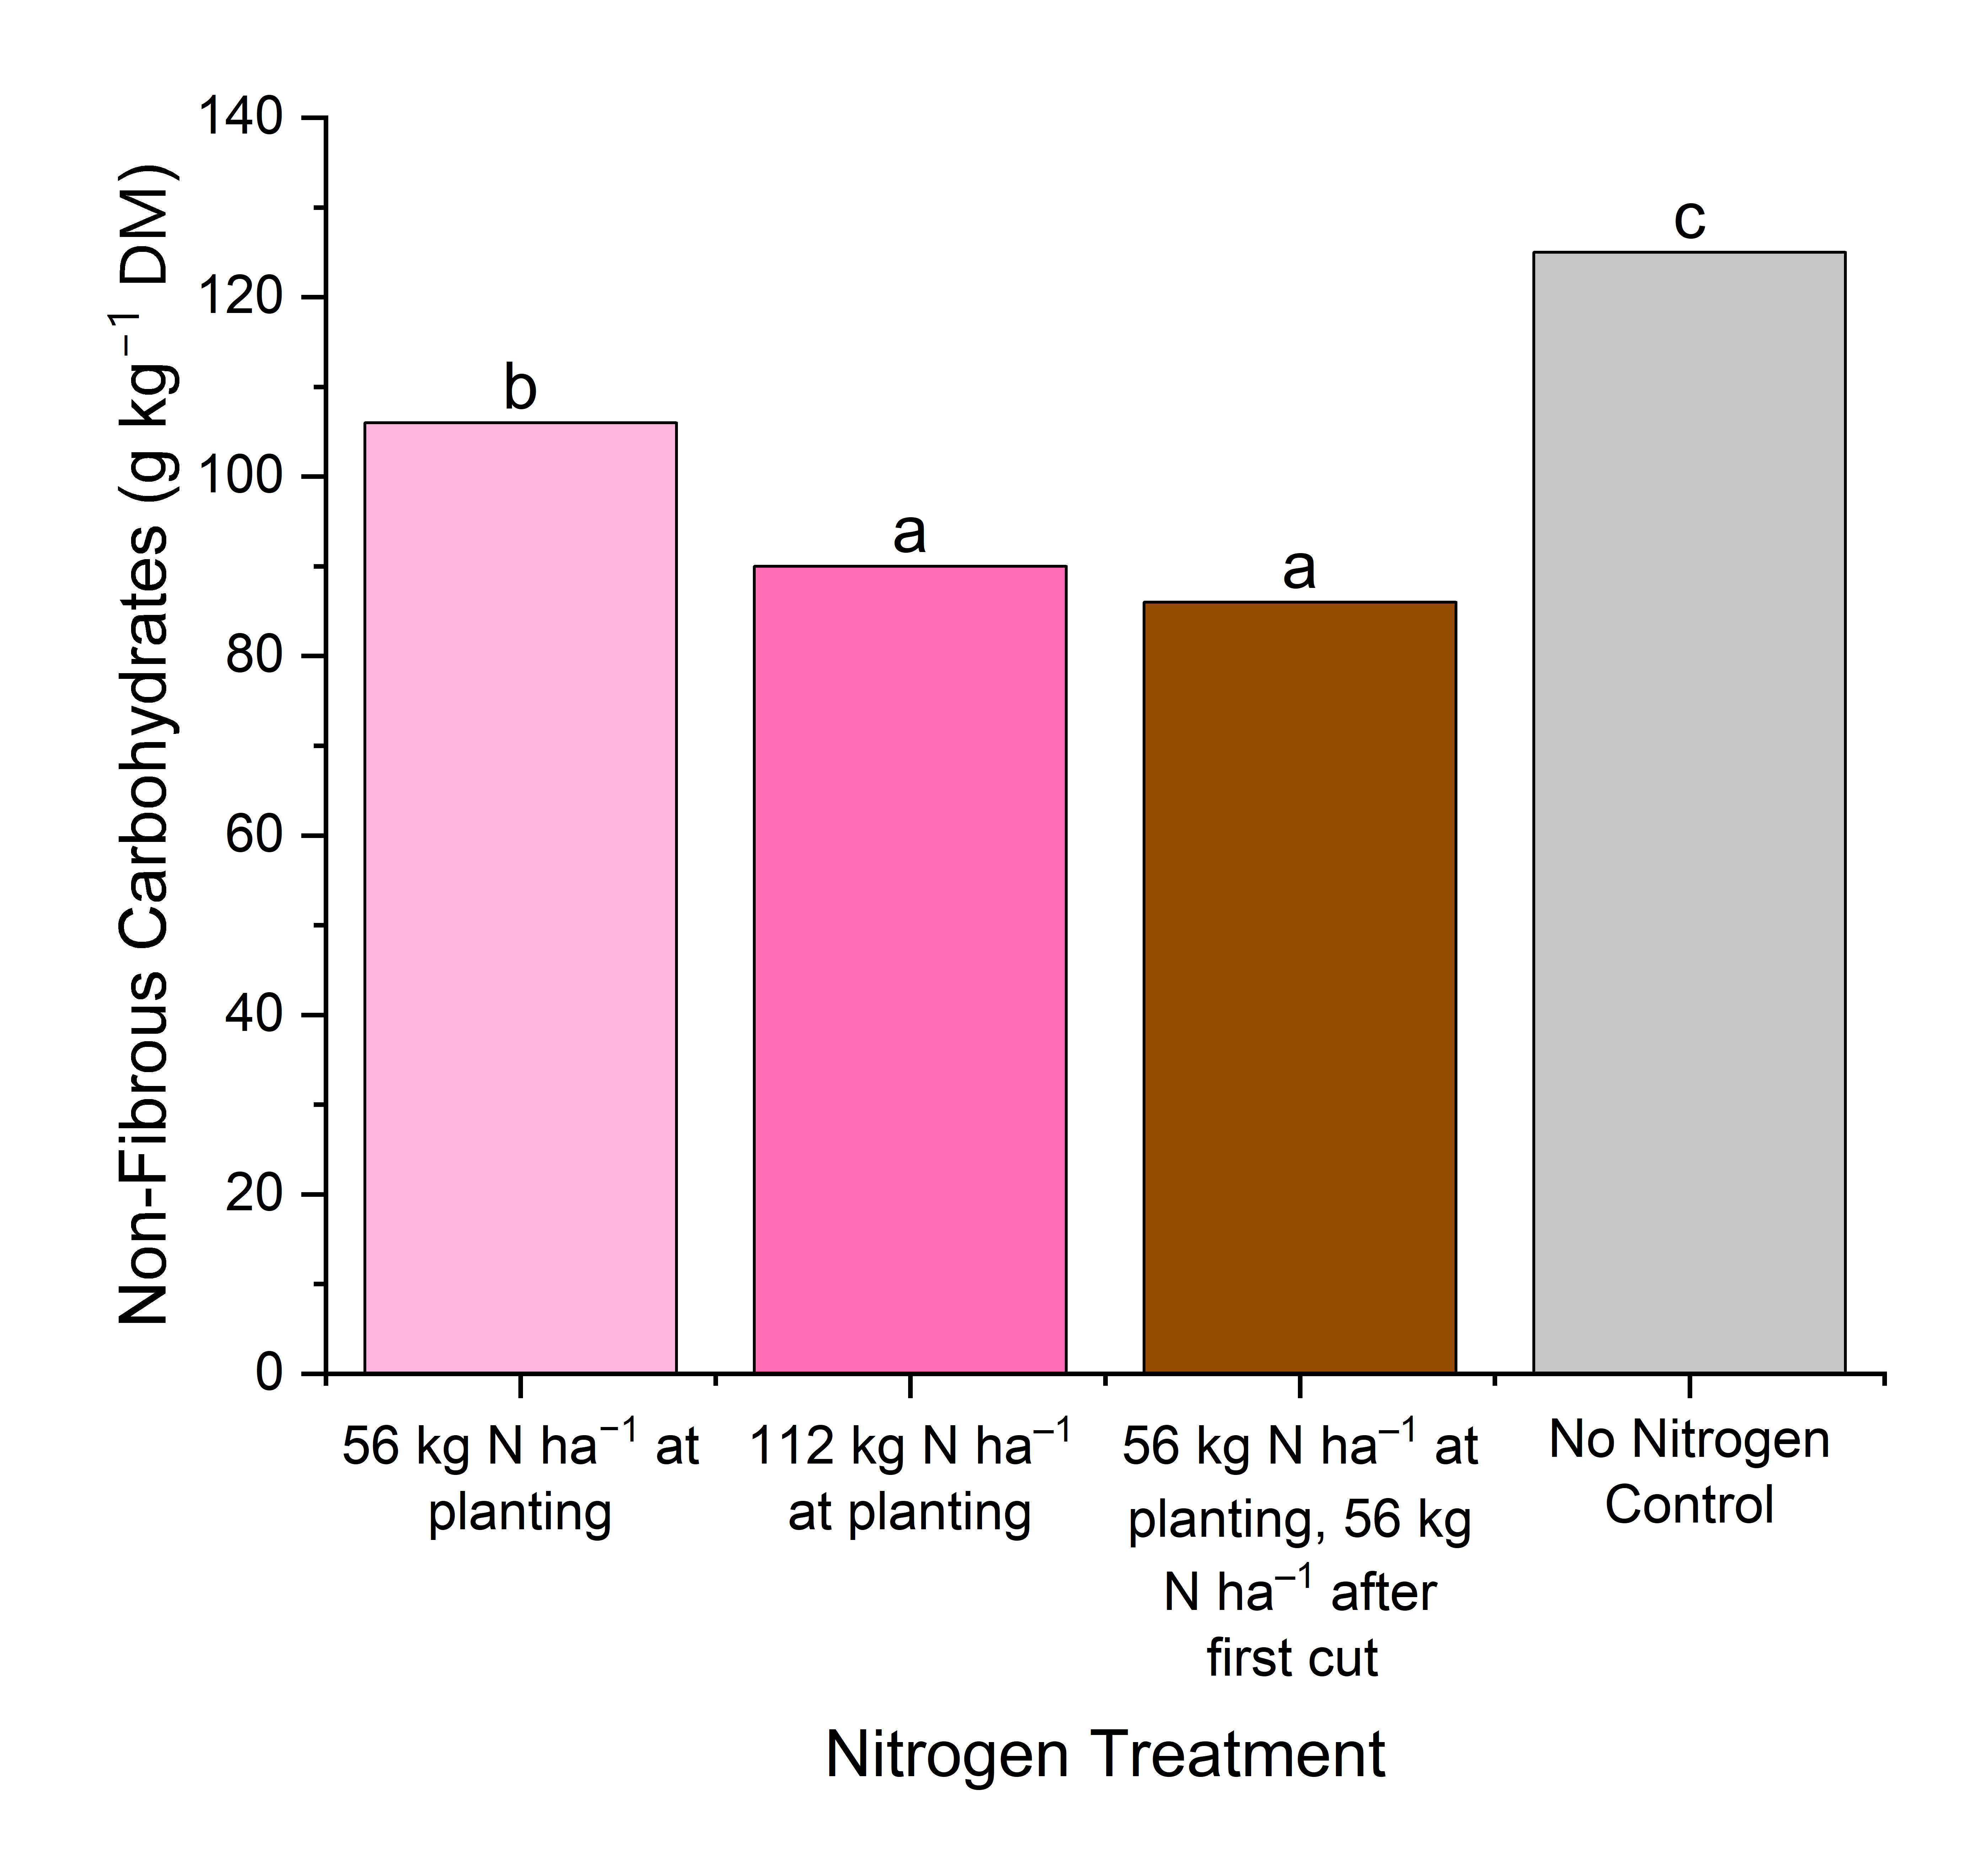
Non-Fibrous Carbohydrates
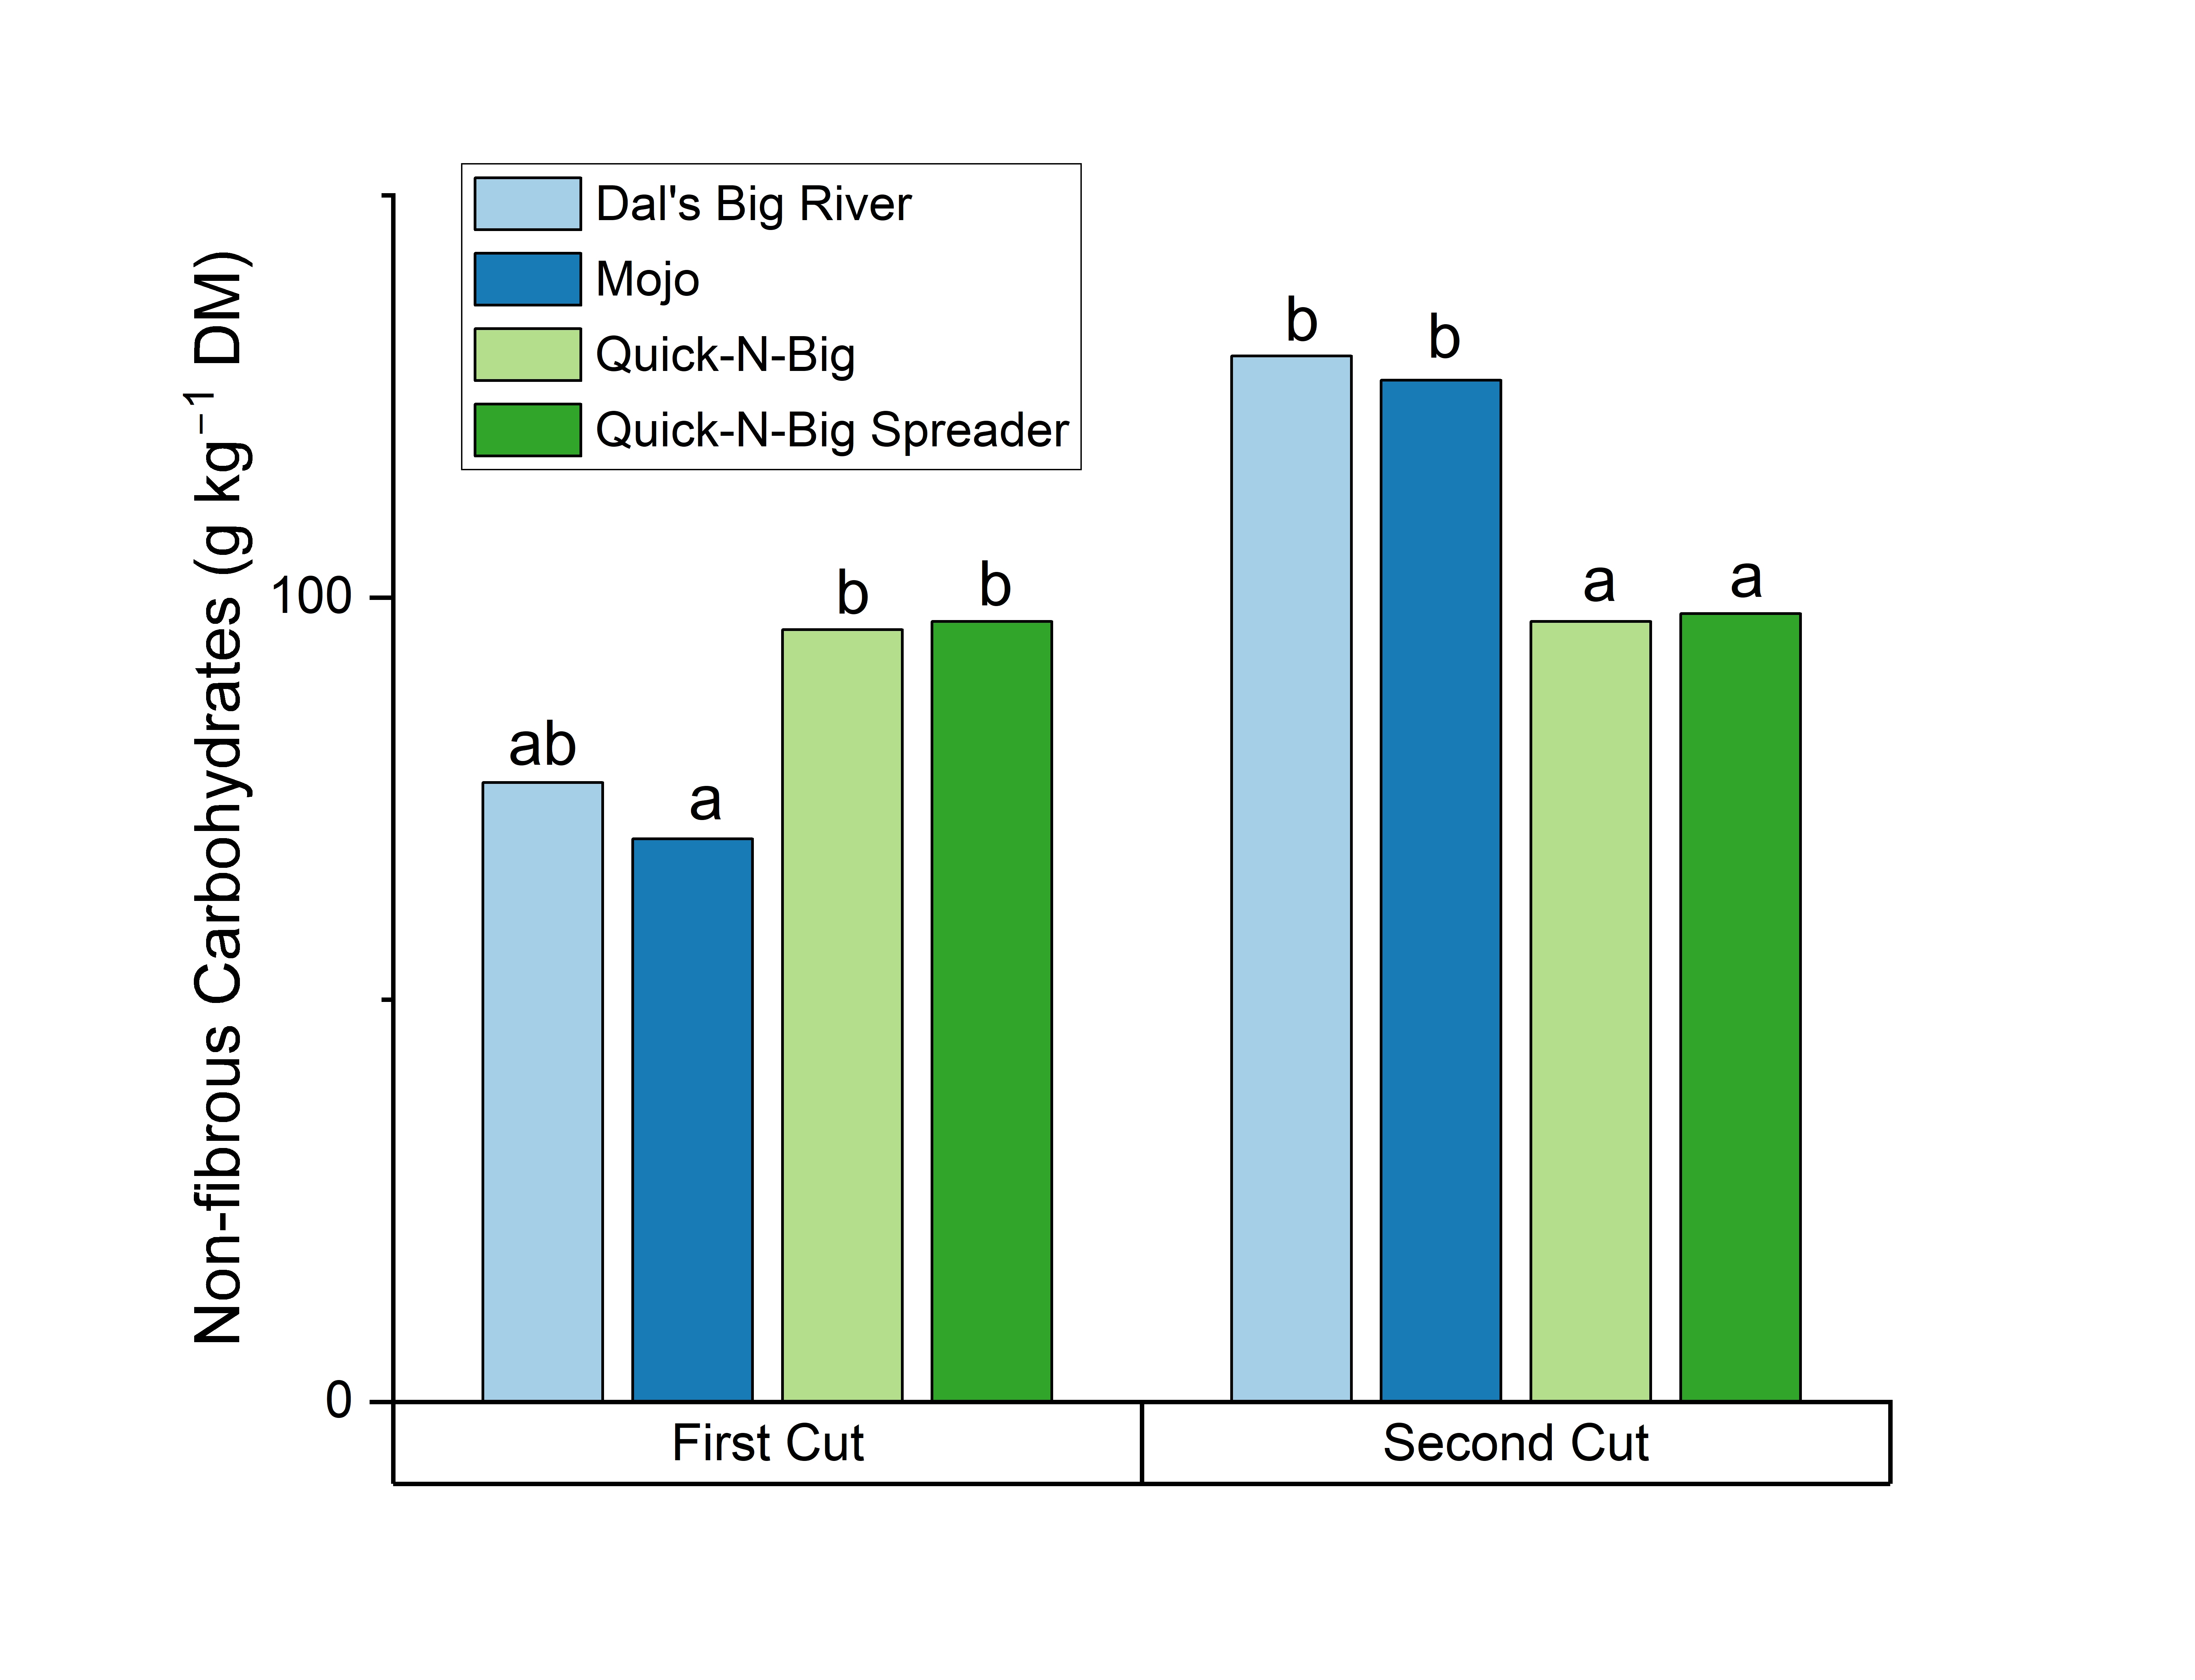
Older crabgrass had higher NFC (Table 3), with flowering stage having higher NFC content (107 g kg–1) than boot/flag leaf (81 g kg–1) or tillering (68 g kg–1) growth stages (Table 5, Figure 12). Stem elongation had NFC content not significantly different than any other growth stage (89 g kg–1). Lower levels of N fertilization also led to higher NFC (high and split N: 88 g kg–1, low N: 106 g kg–1, no N: 125 g kg–1) (Table 4, Figure 13). The different varieties had markedly different NFC content. Specifically, DR and MO had much higher NFC at the second cutting (129 g kg–1) than the first (74 g kg–1), but little changed for QB and QS between cuttings (between 96 and 98 g kg–1) (Table 4, Figure 14).
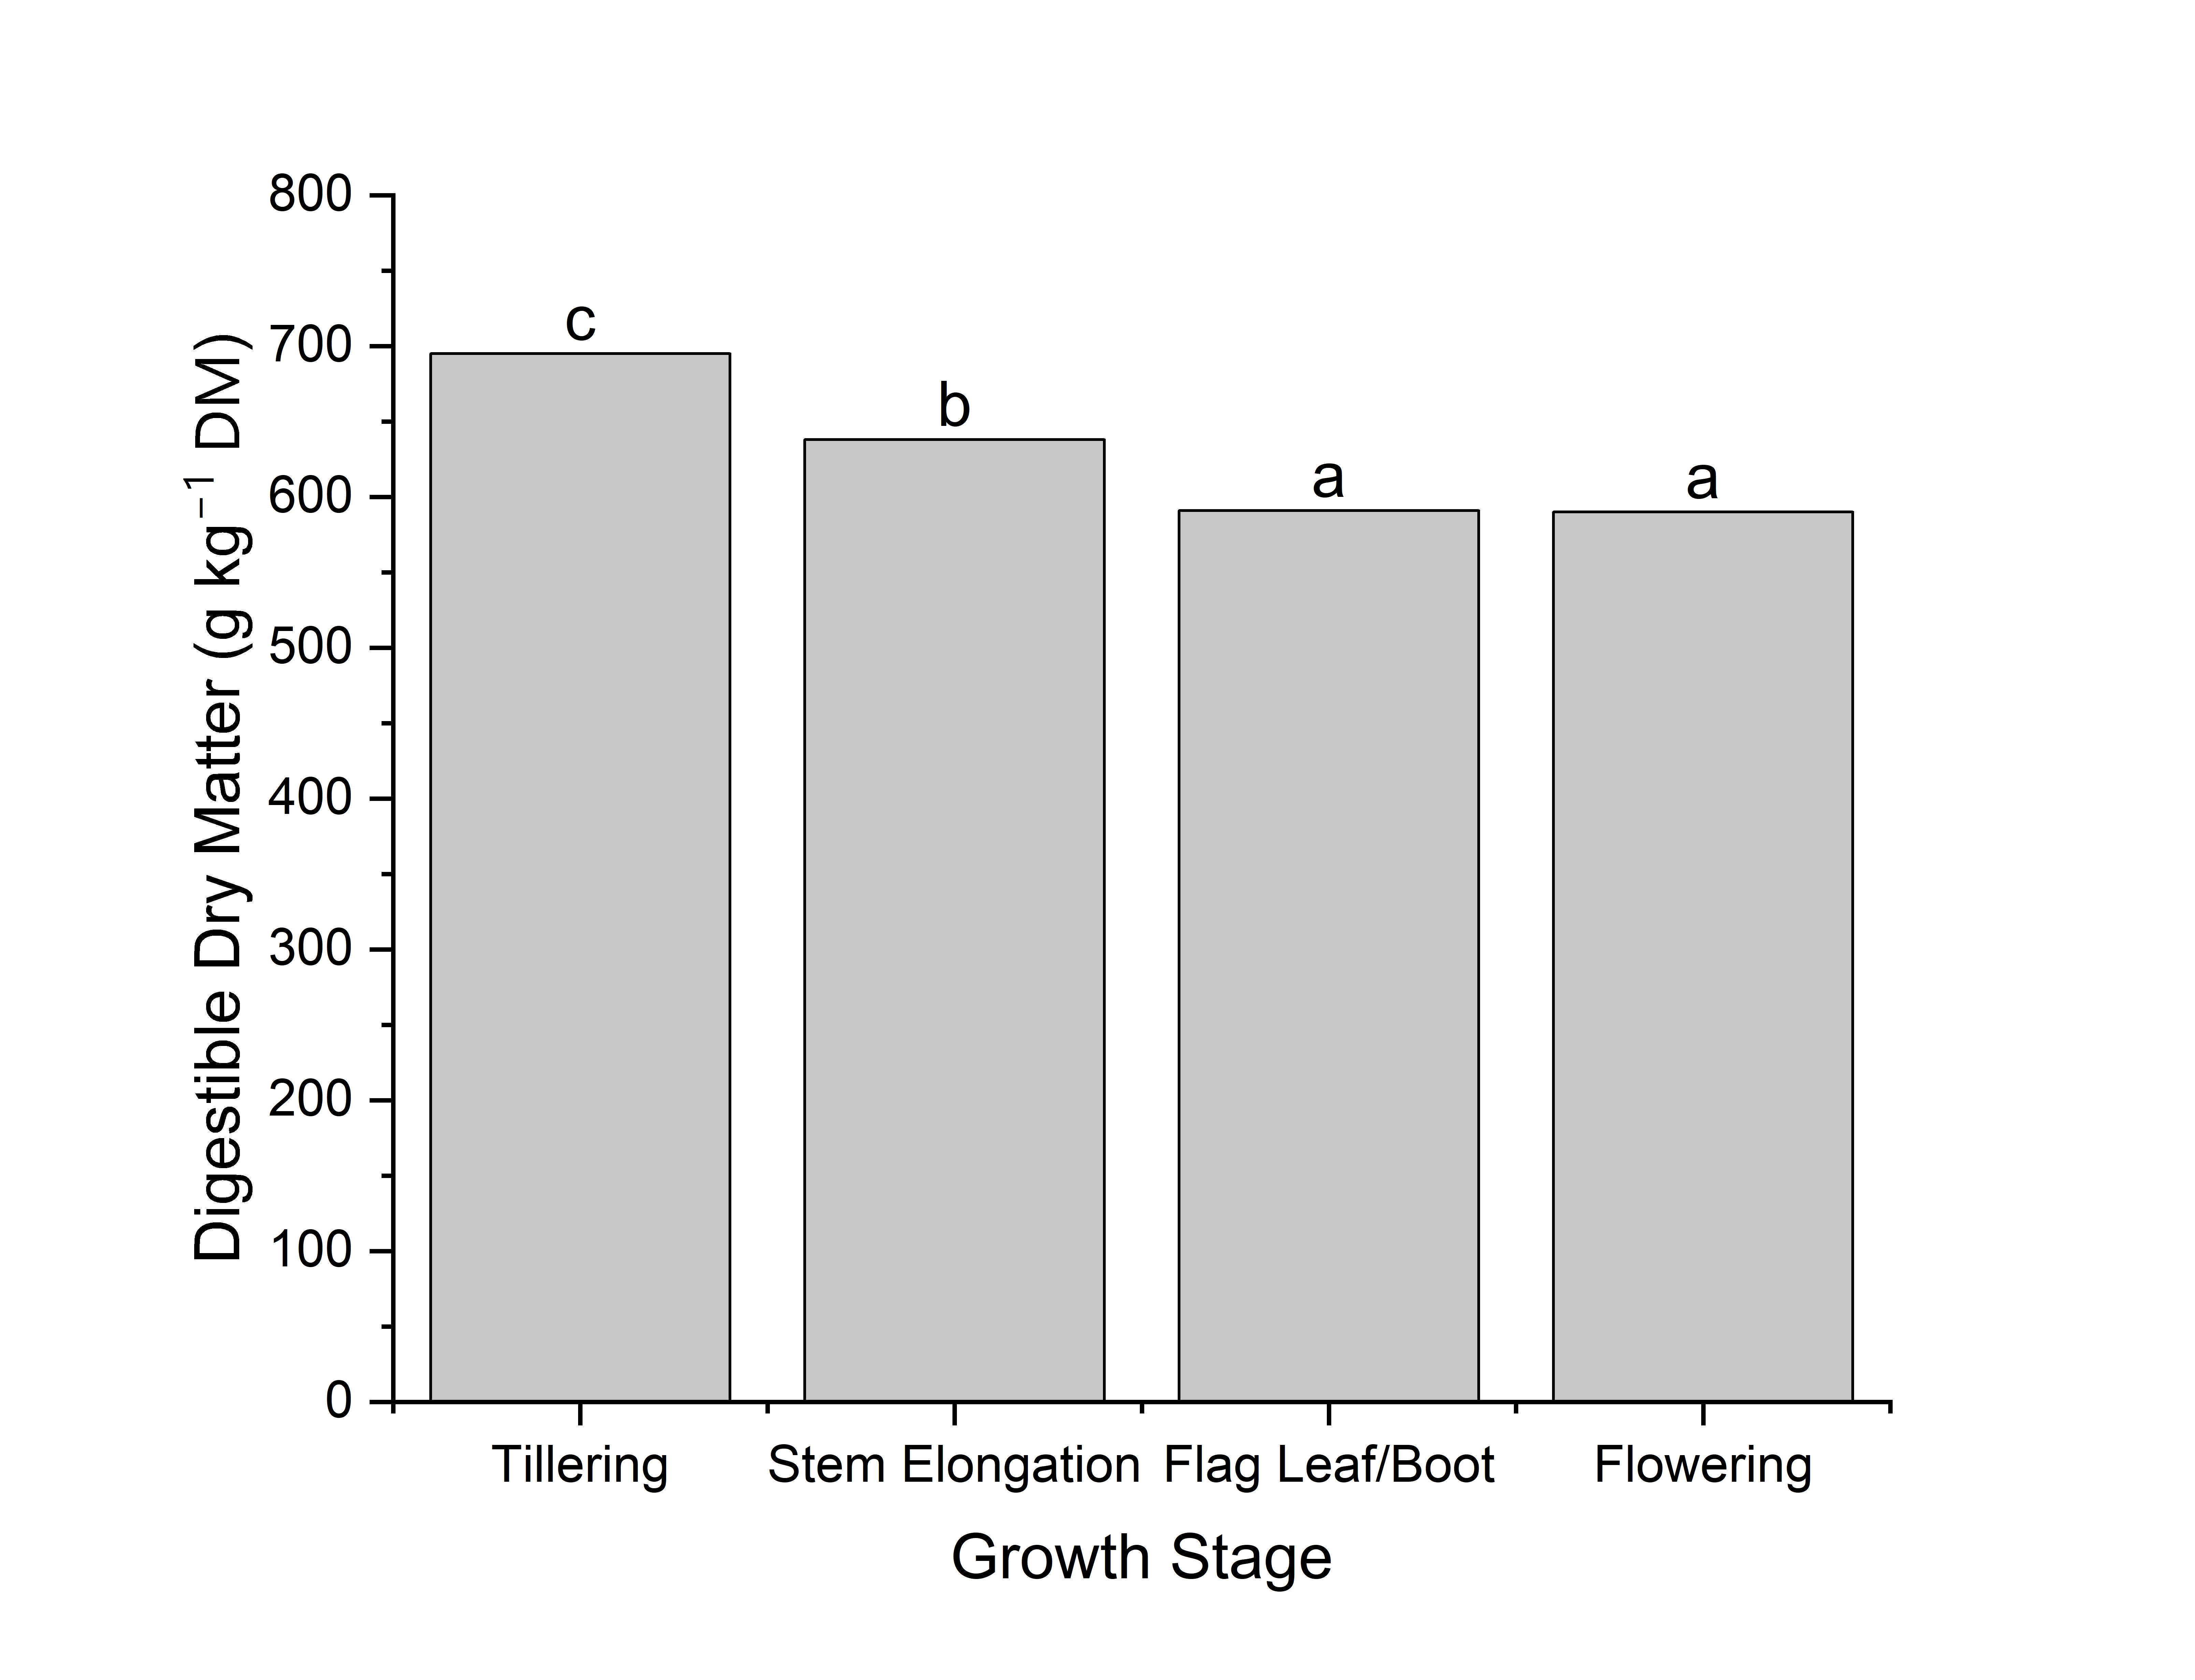
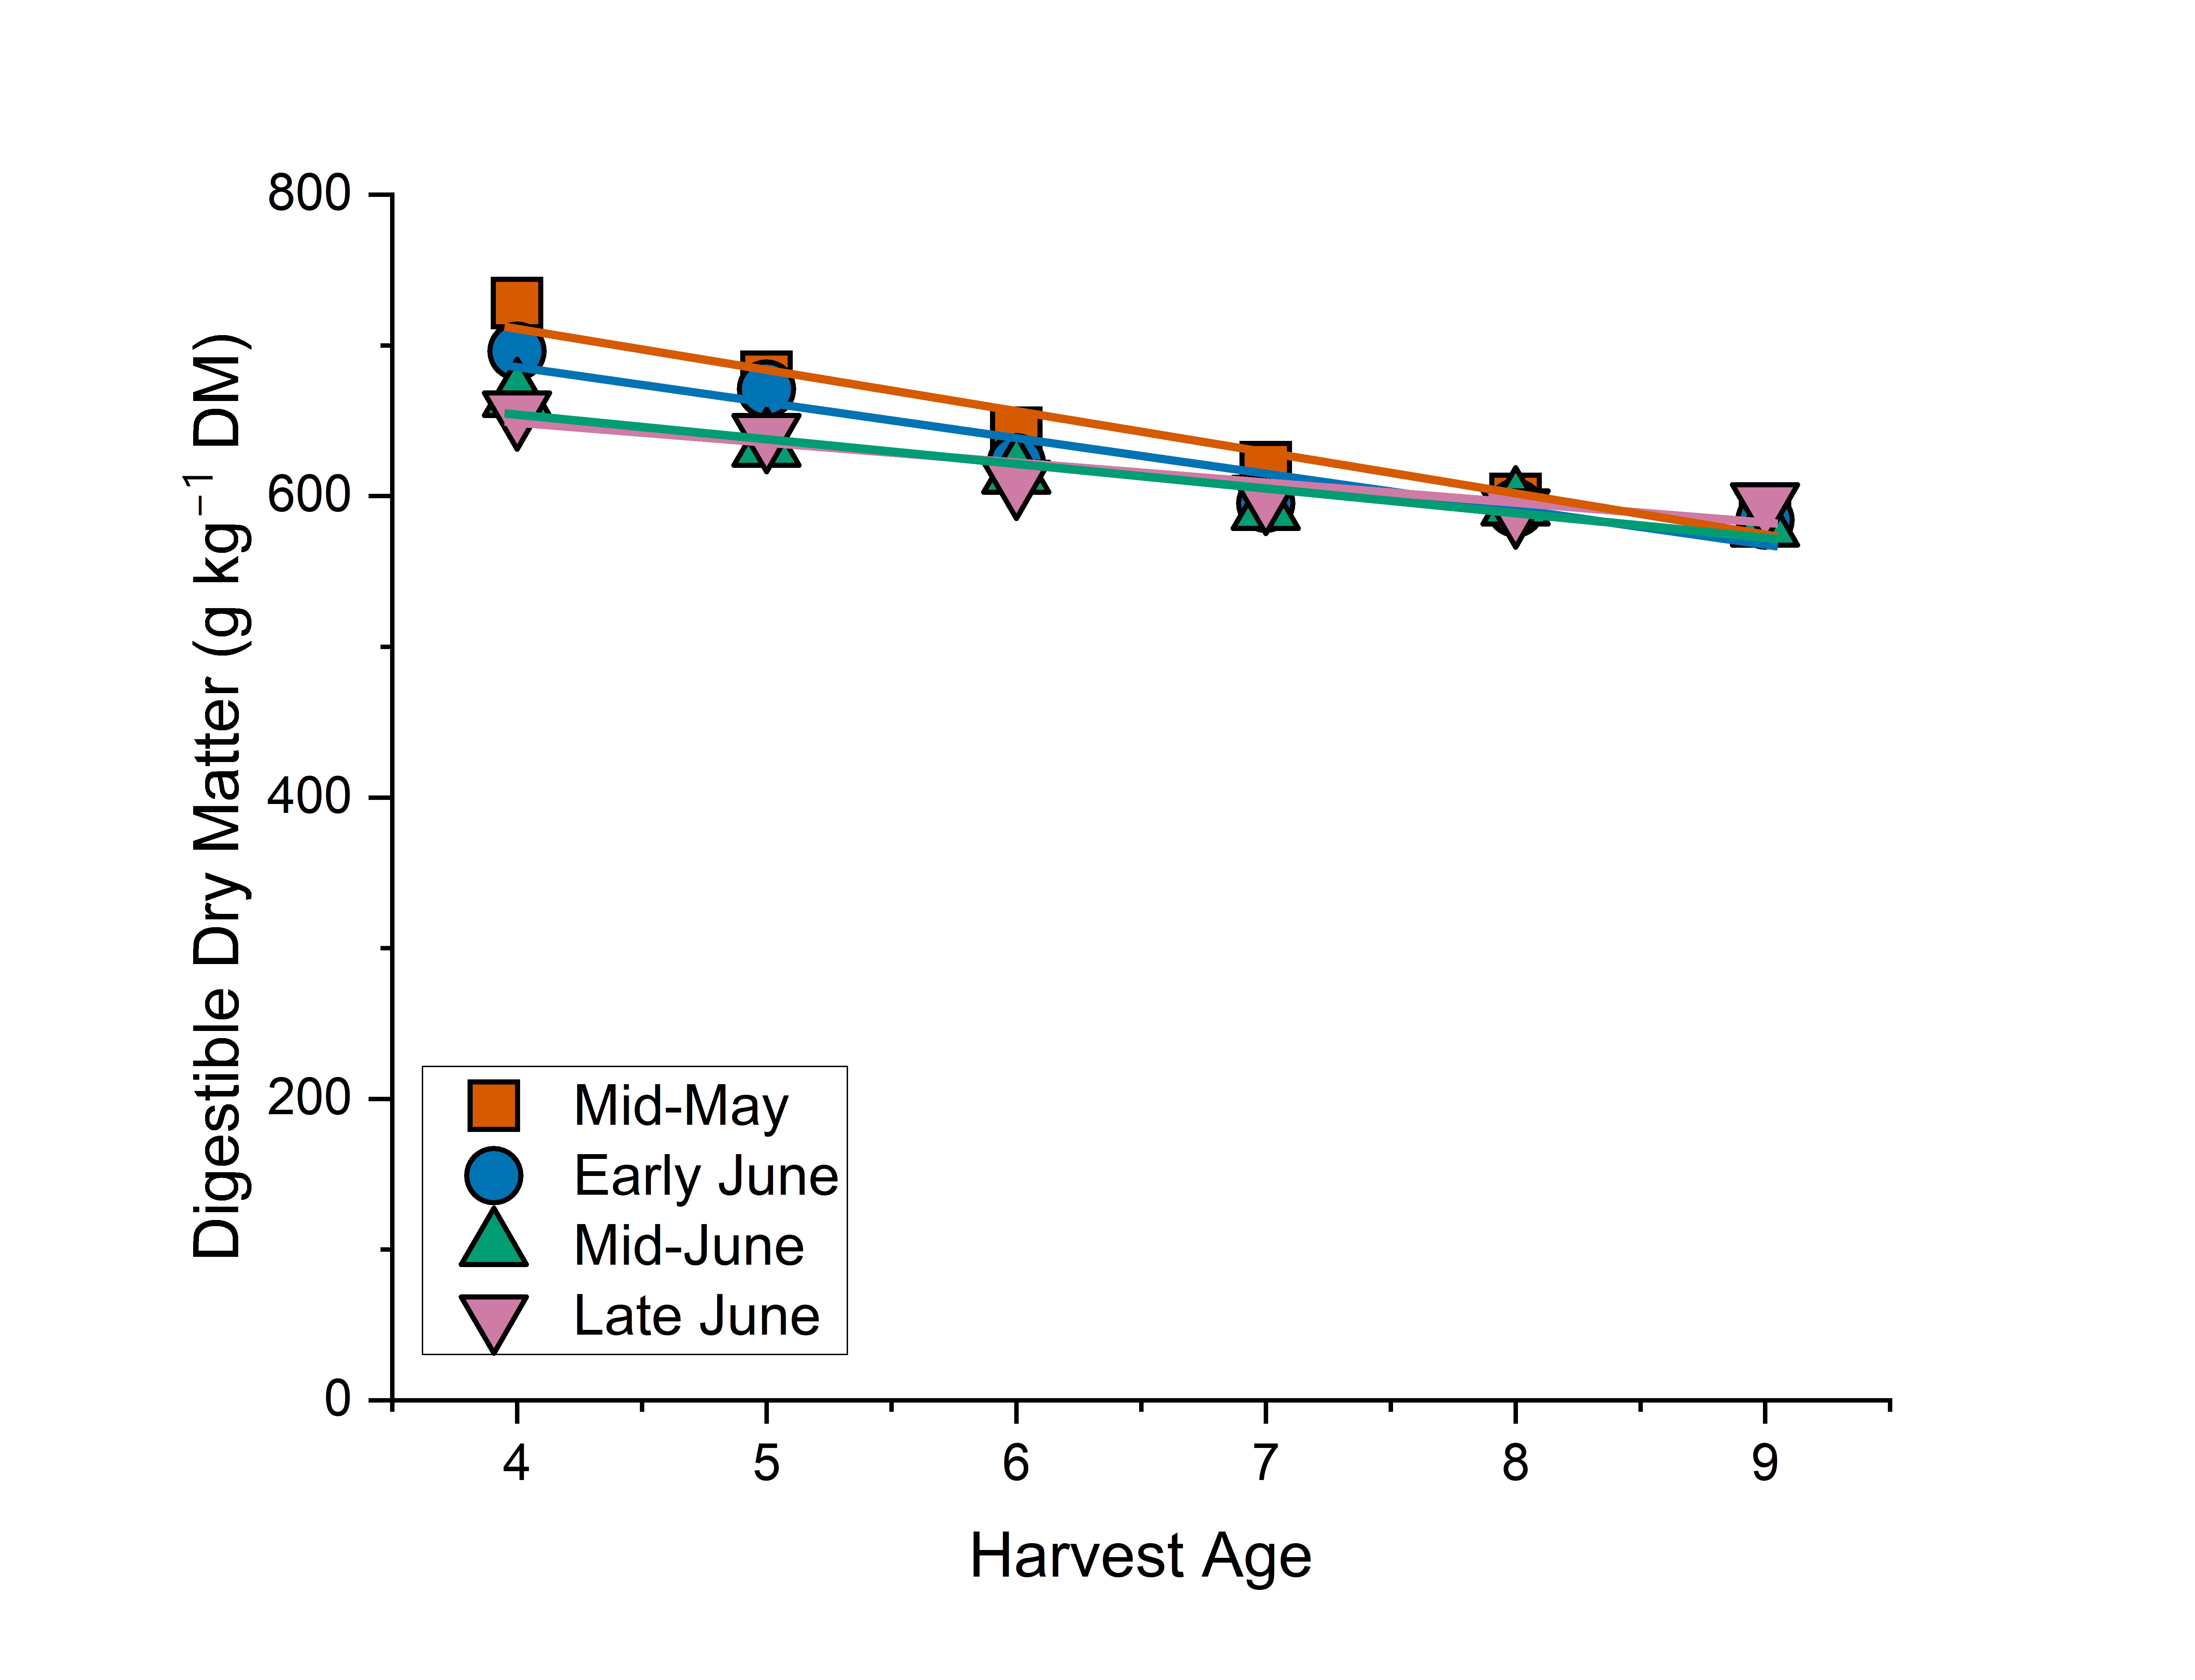
Digestible Dry Matter
Crabgrass had higher DDM at earlier growth stages and younger ages (more than 650 g kg–1 at 4 weeks and decreasing to less than 600 g kg–1 at 9 weeks) (Table 3, Table 5, and Table 6; Figures 15 and 16). Increasing nitrogen fertilization also increased DDM with 112 kg/ha (625 g kg–1) and split N treatment (658 g kg–1) having the significantly higher DDM than the unfertilized control (618 g kg–1) over both cuts (Table 4). However, the difference from fertilization was smaller than the difference associated with crabgrass age (a decrease of between 13 and 27 g kg–1 week–1). There were no differences among varieties (Table 4).
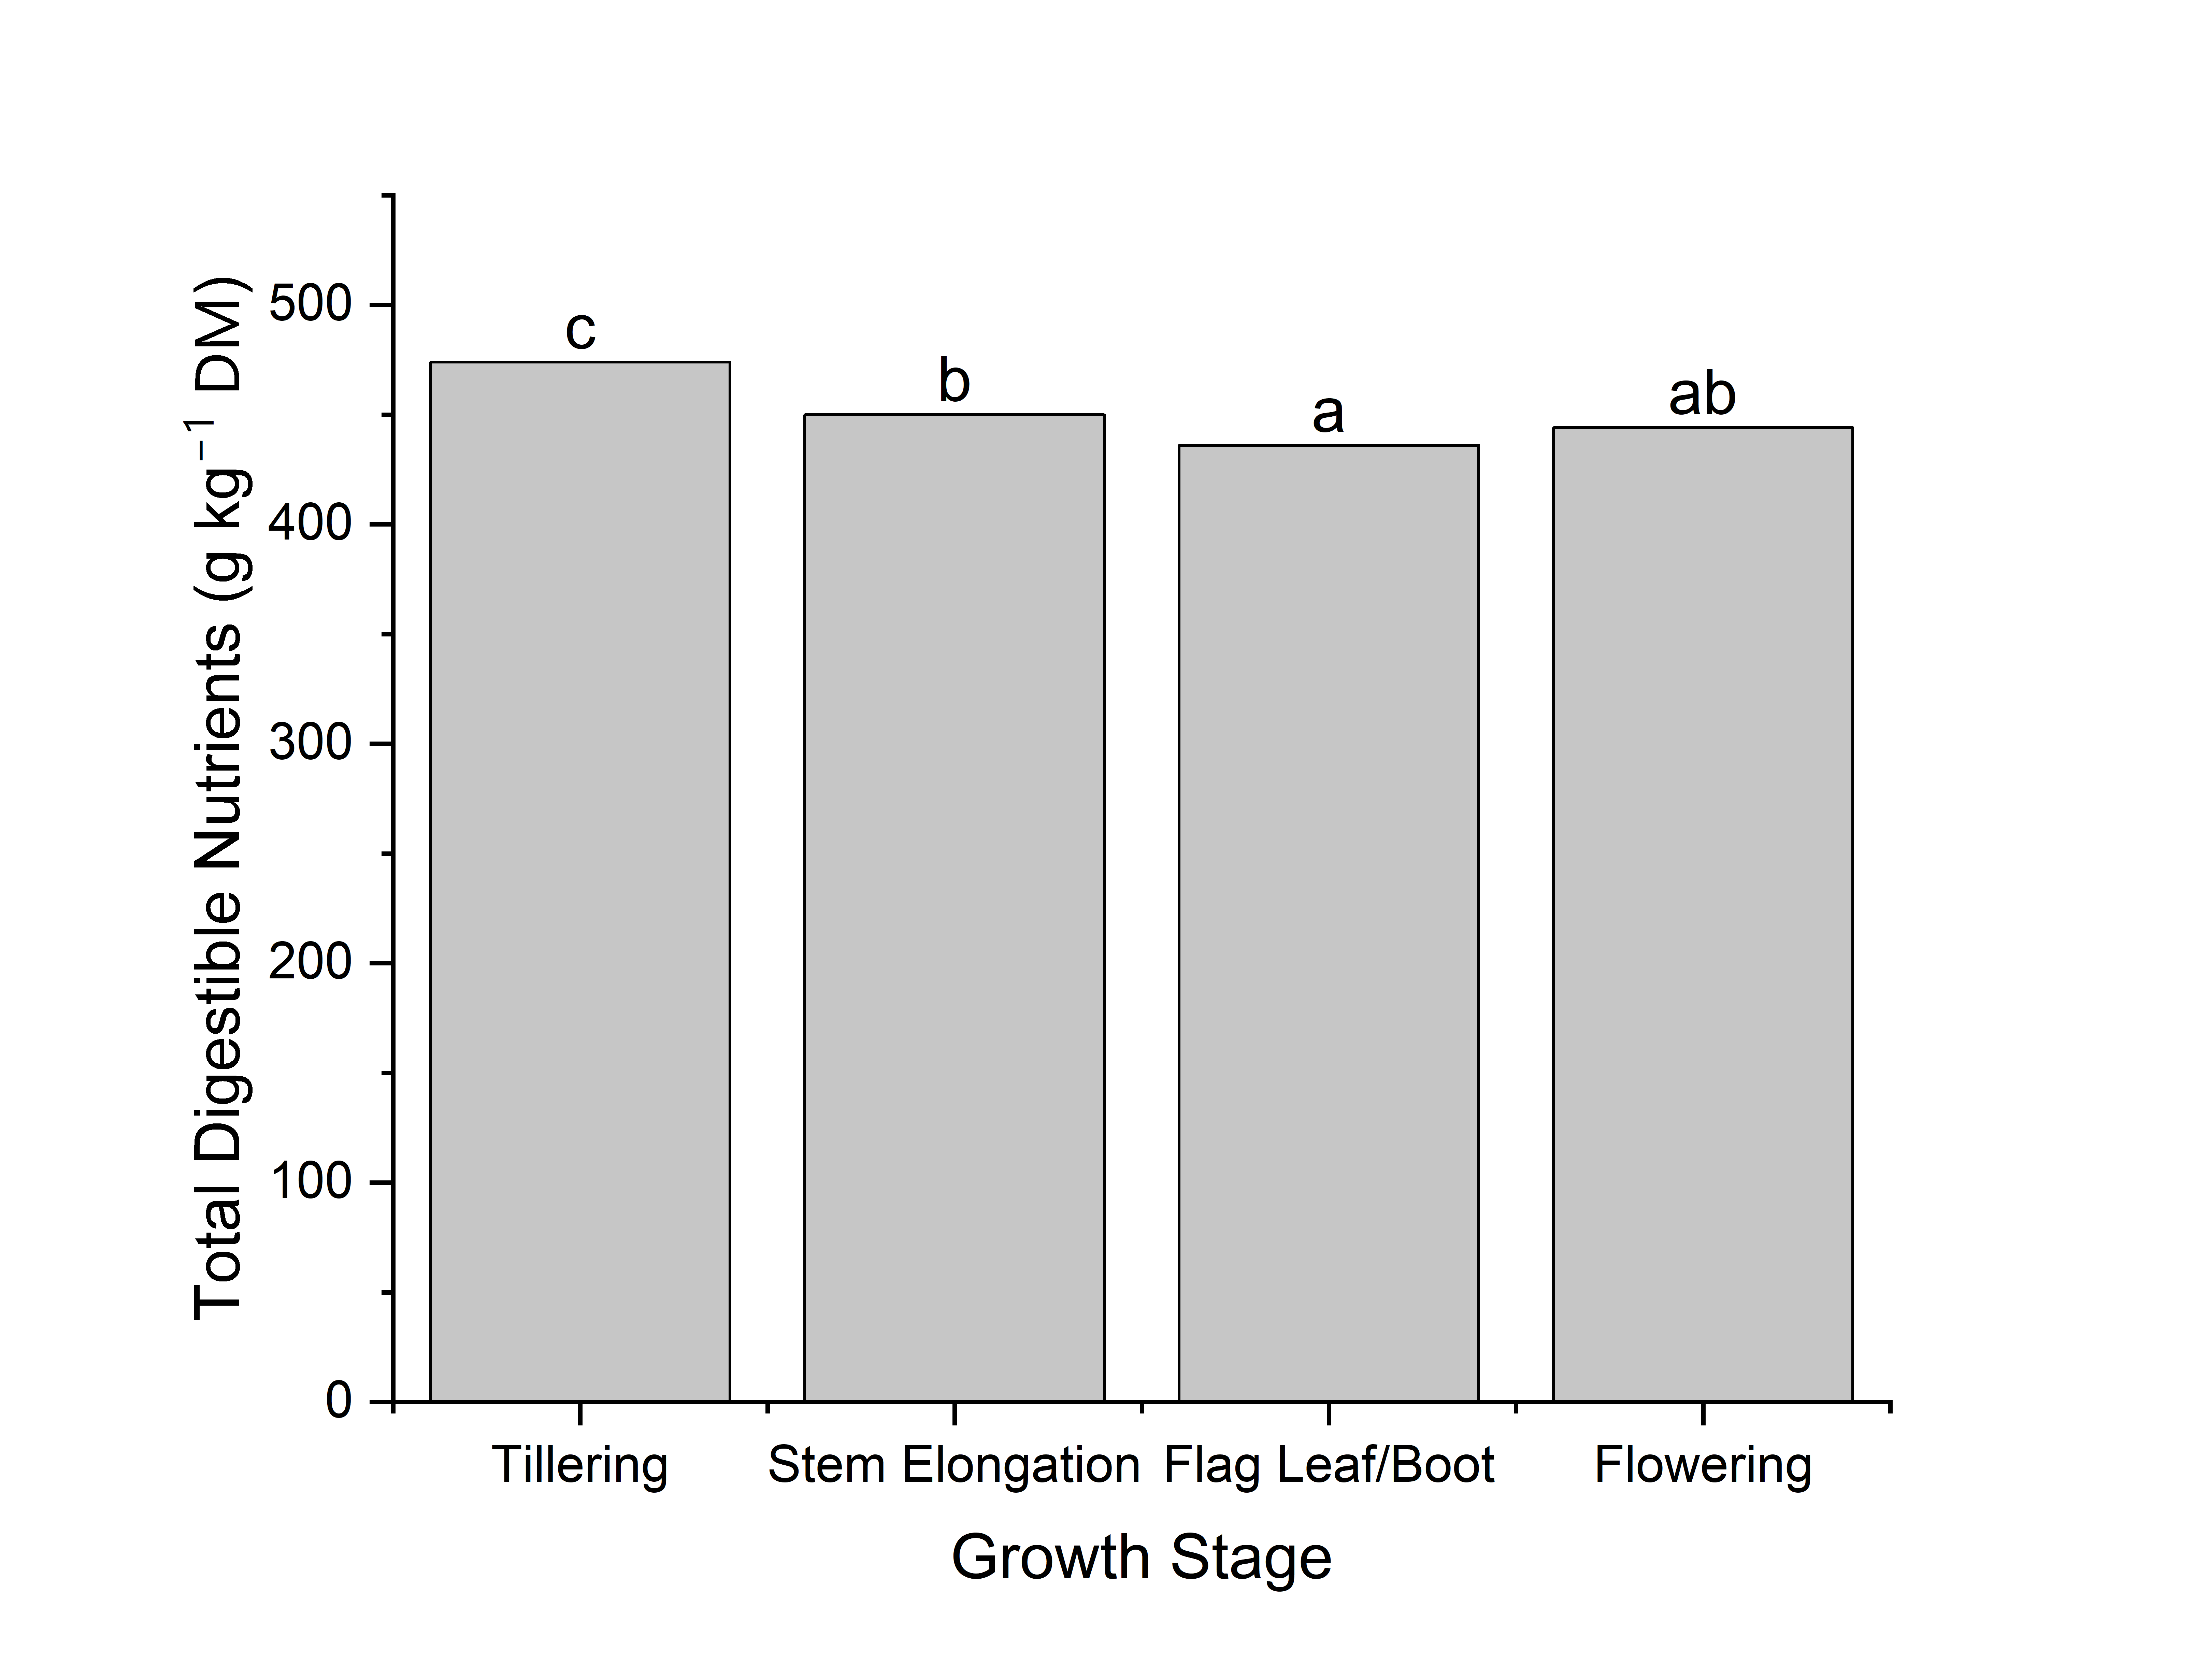
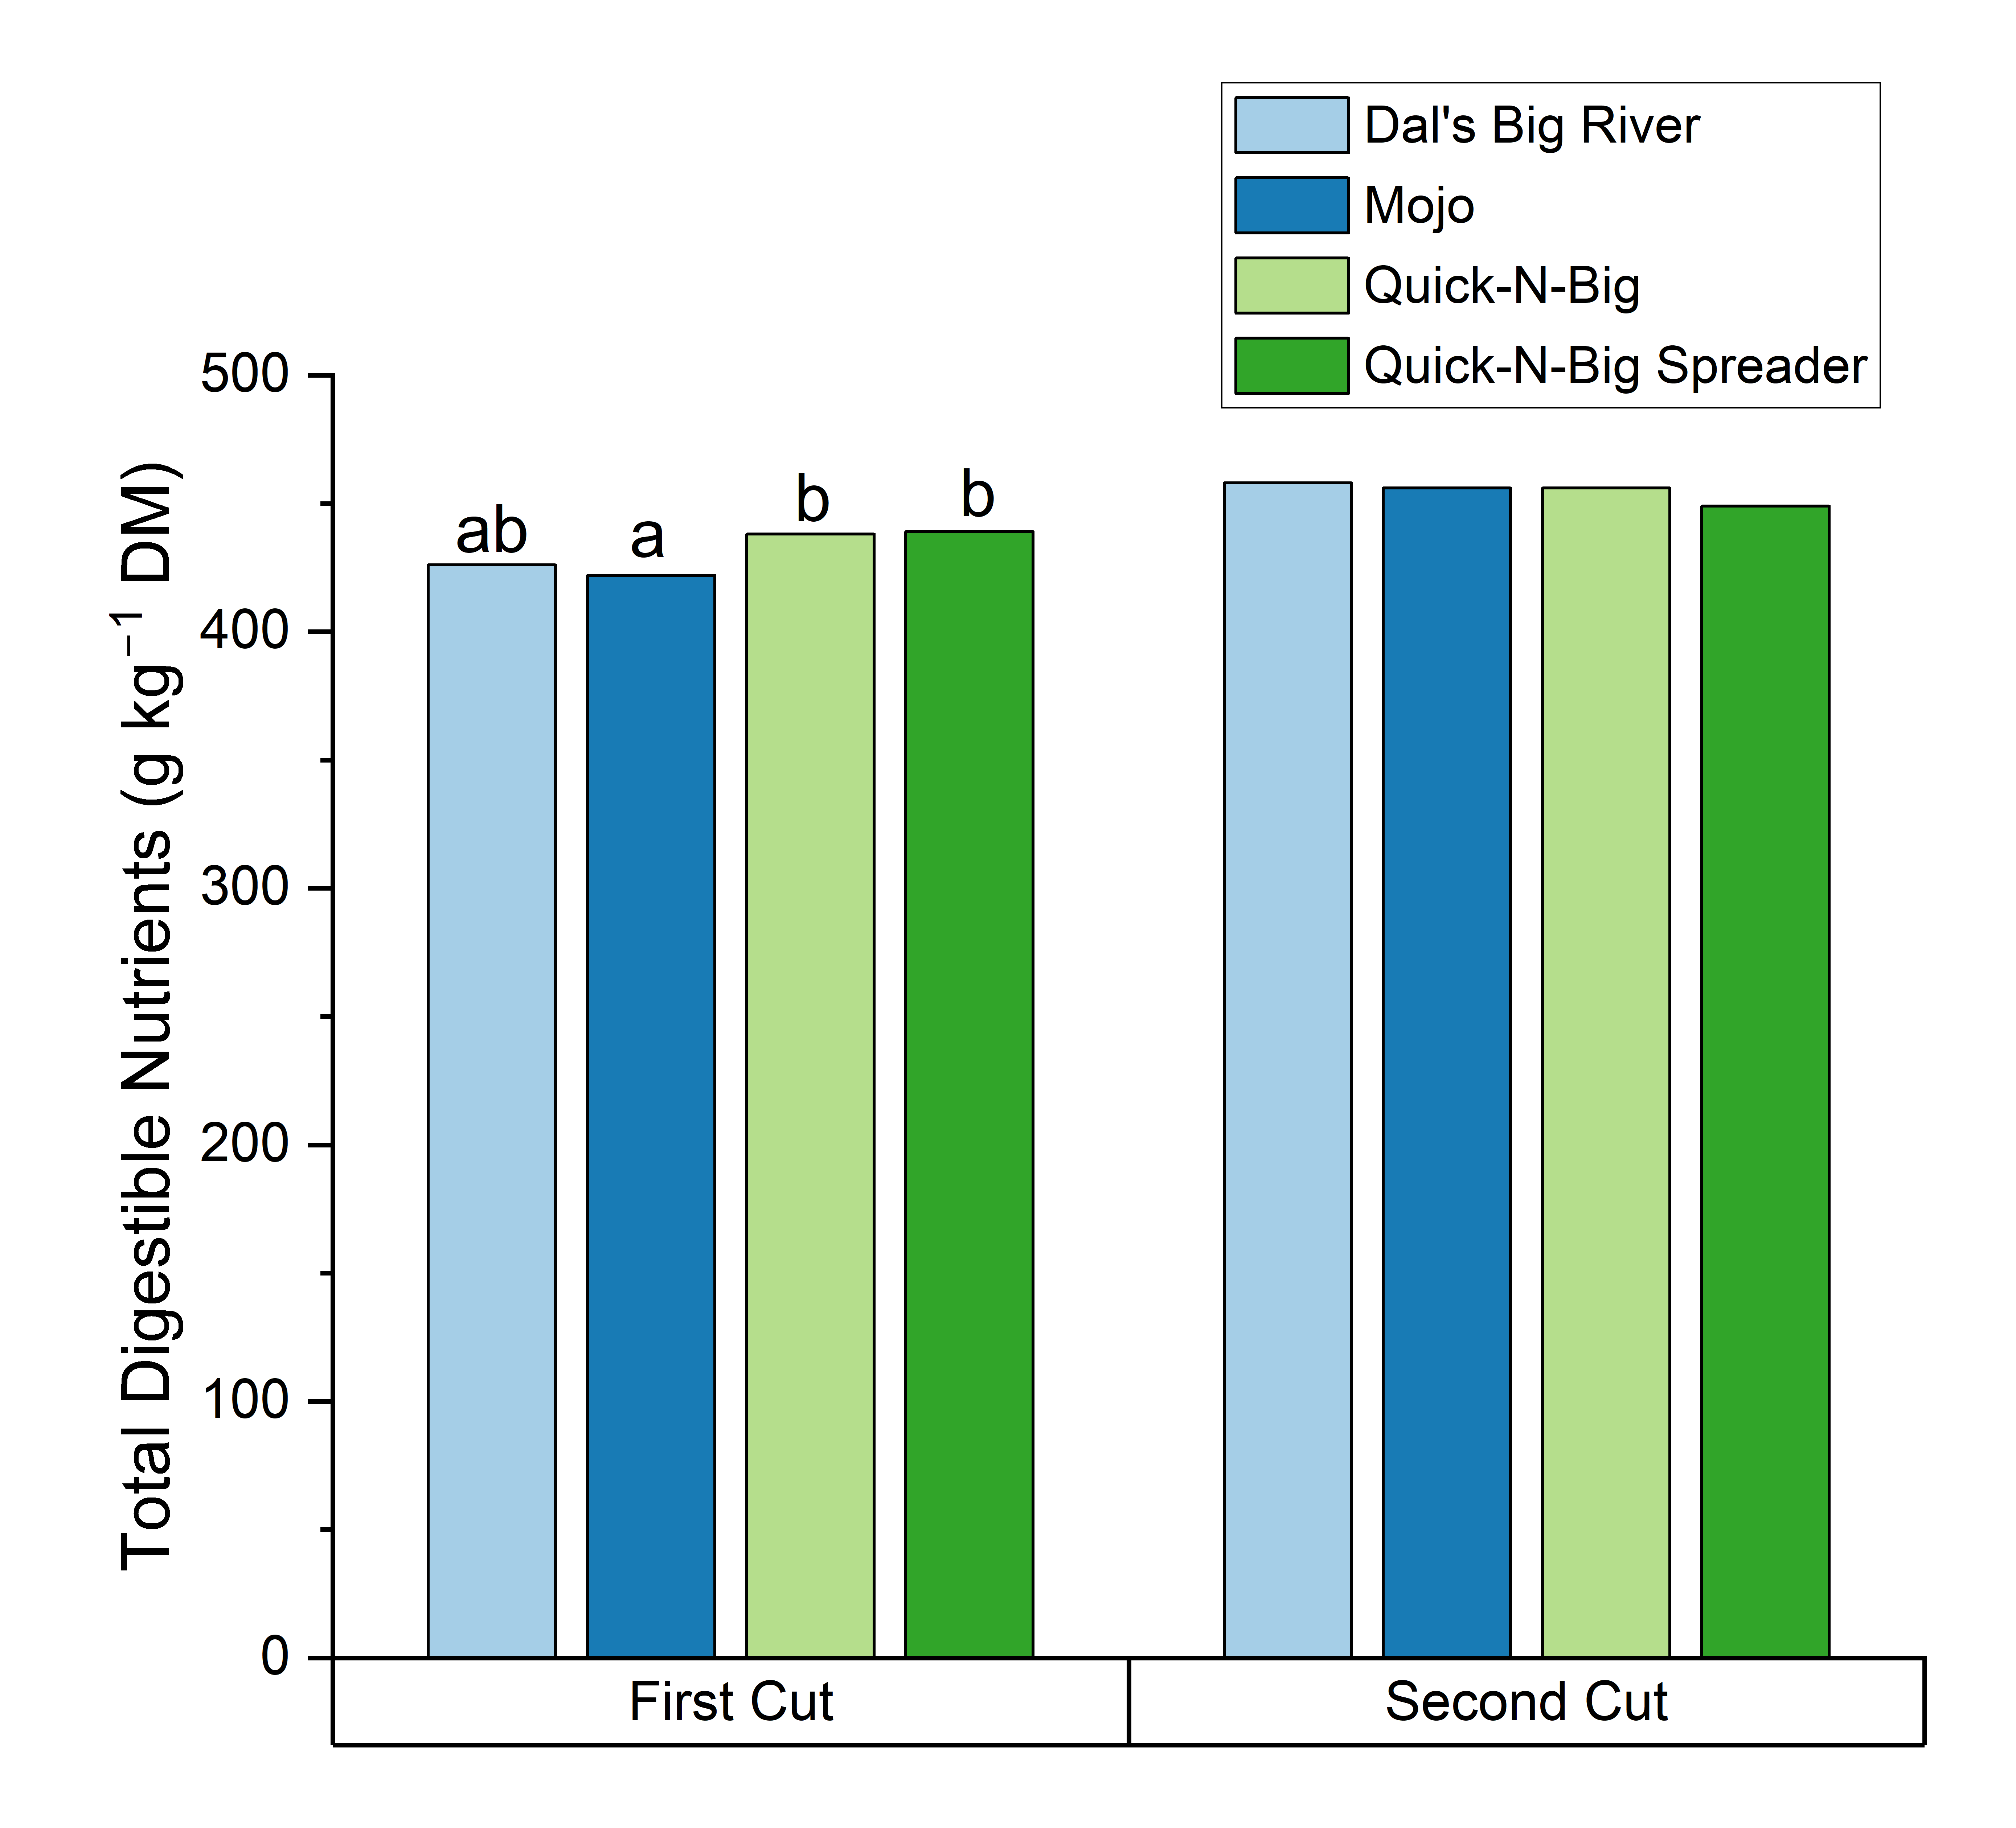
Total Digestible Nutrients
Crabgrass at tillering growth stage had higher TDN (474 g kg–1) than at later growth stages (an average of 443 g kg–1) (Table 5, Figure 17). Differences between planting dates were small but mid-May planting did lead to higher TDN at four weeks old (505 g kg–1 compared to 461 g kg–1 on average for later planting dates) (Table 3). QB and QS (439 g kg–1) had a little higher TDN than DR and MO (424 g kg–1) at the first cut and all varieties had higher, and not different from each other, TDN at the second cut (an average of 458 g kg–1) (Table 4, Figure 18). N fertilization did not affect TDN content (Table 4).
Dry Matter Intake
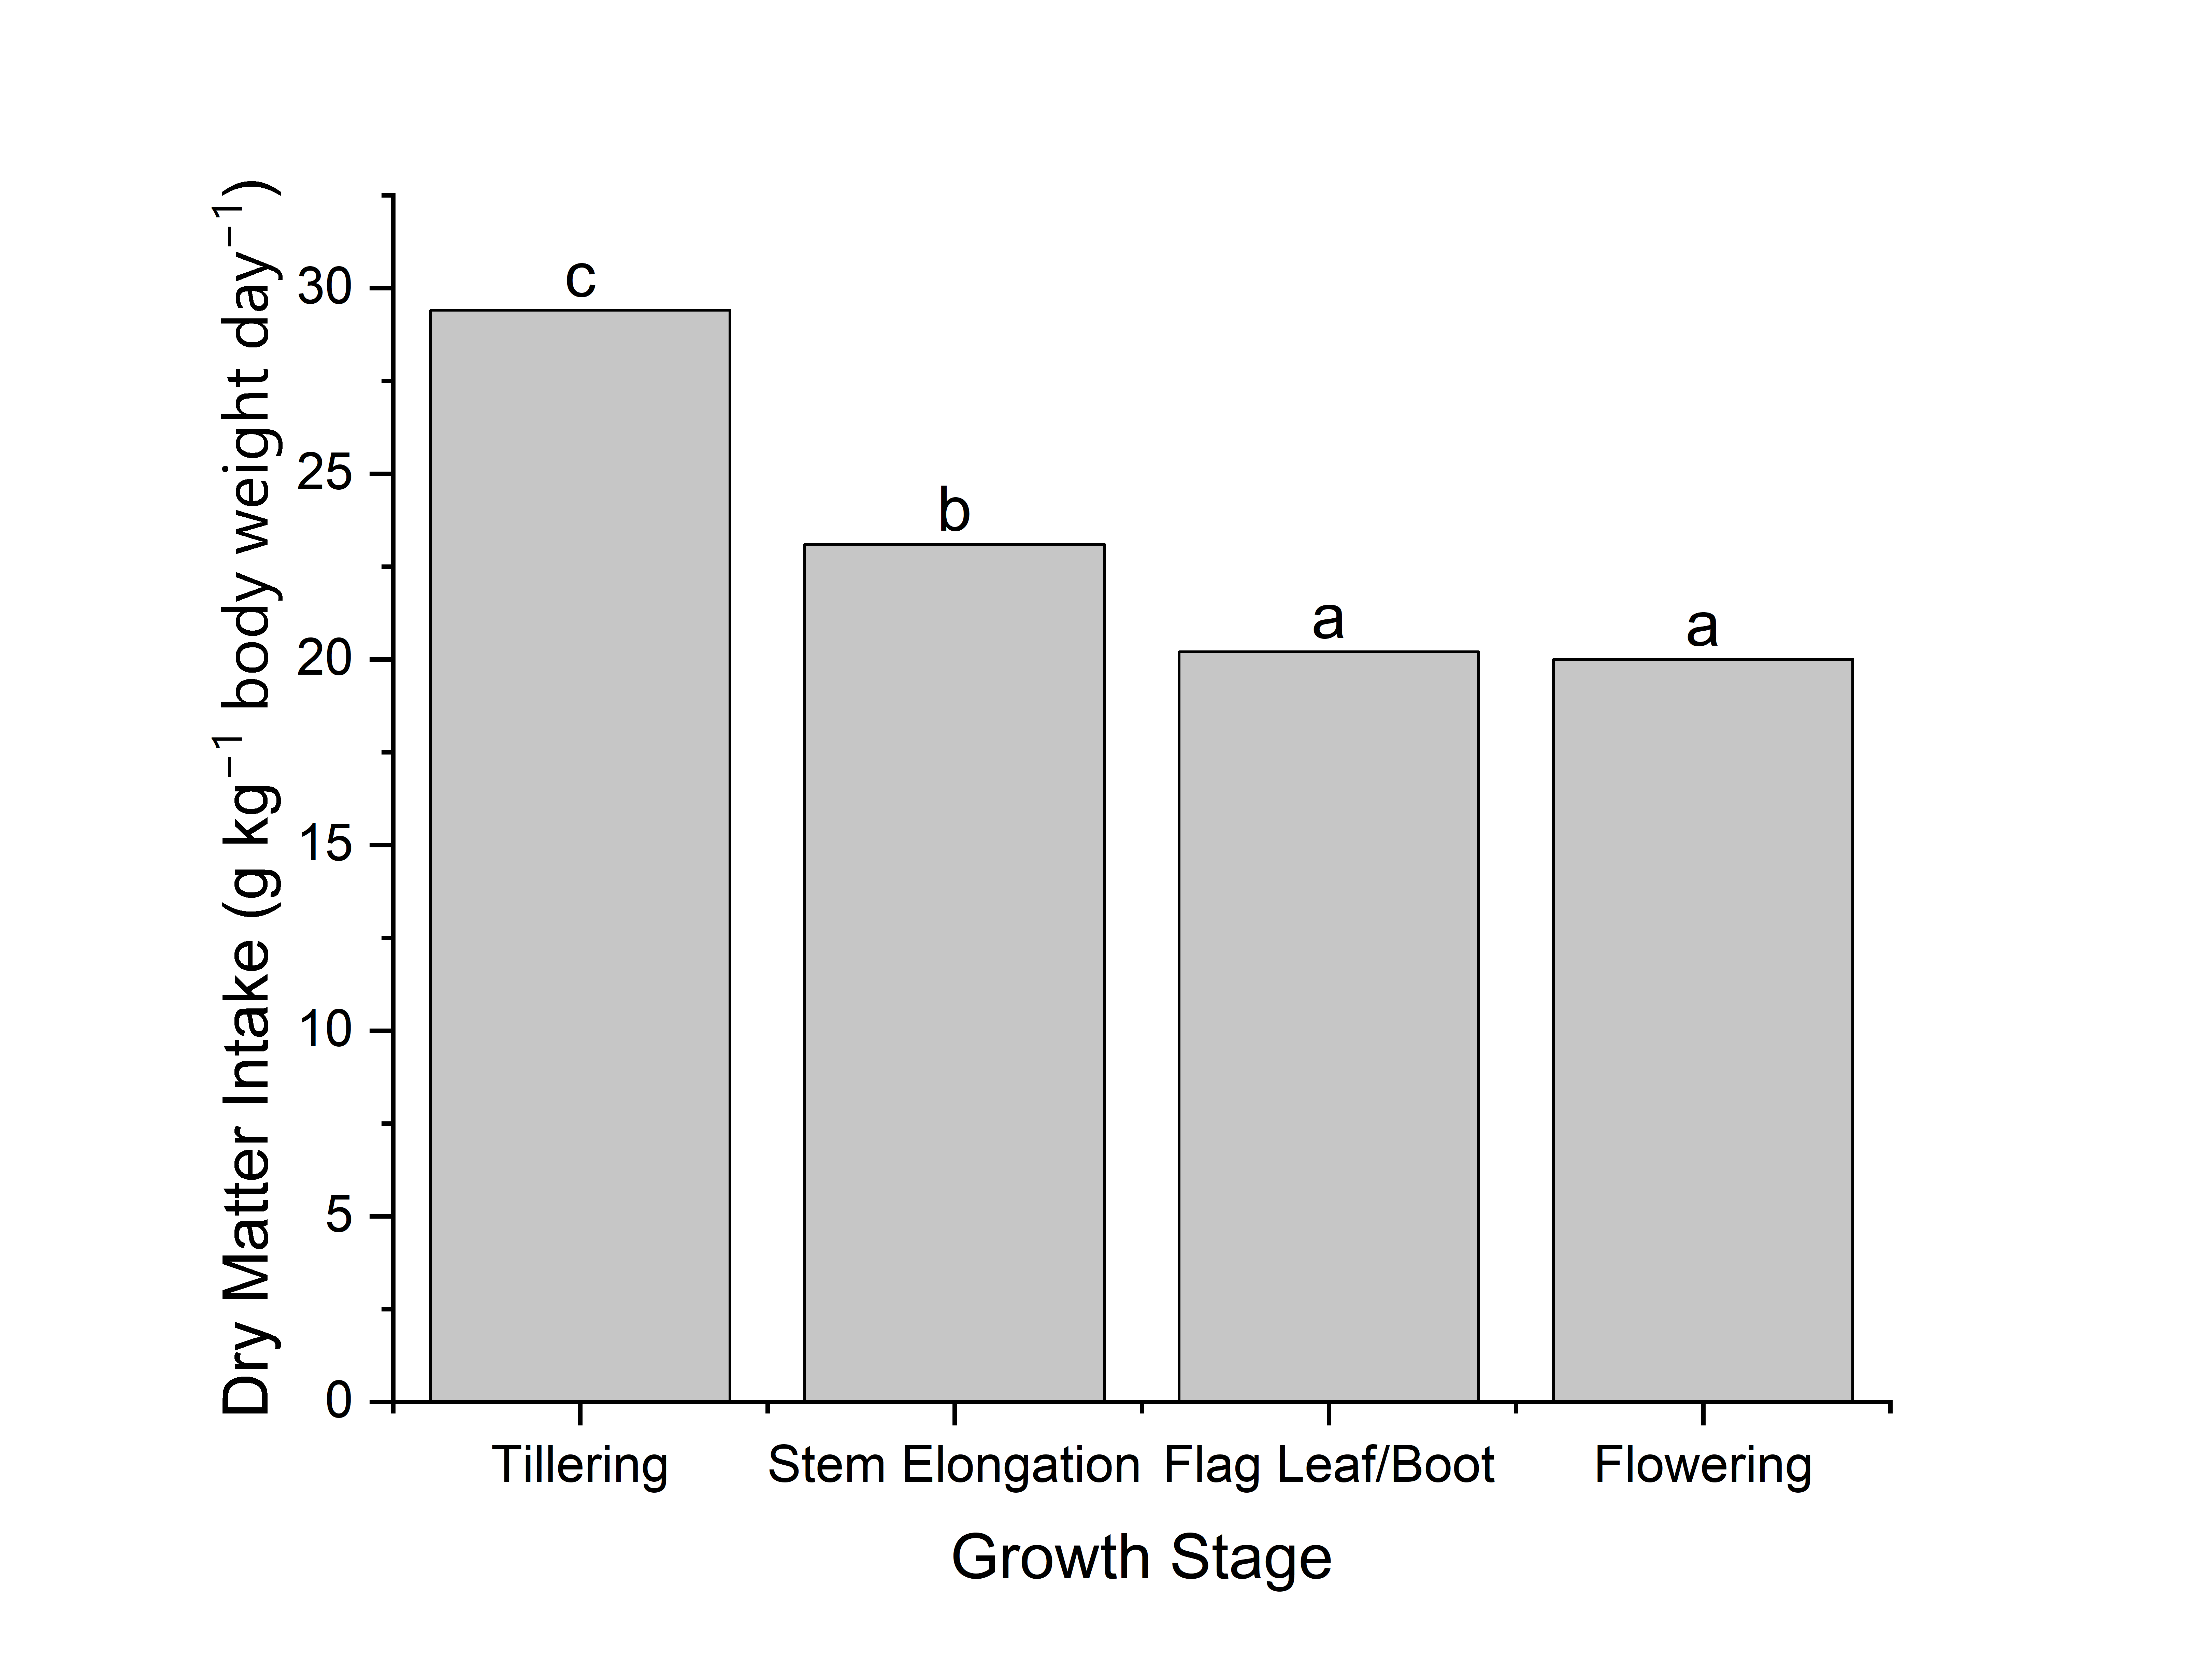
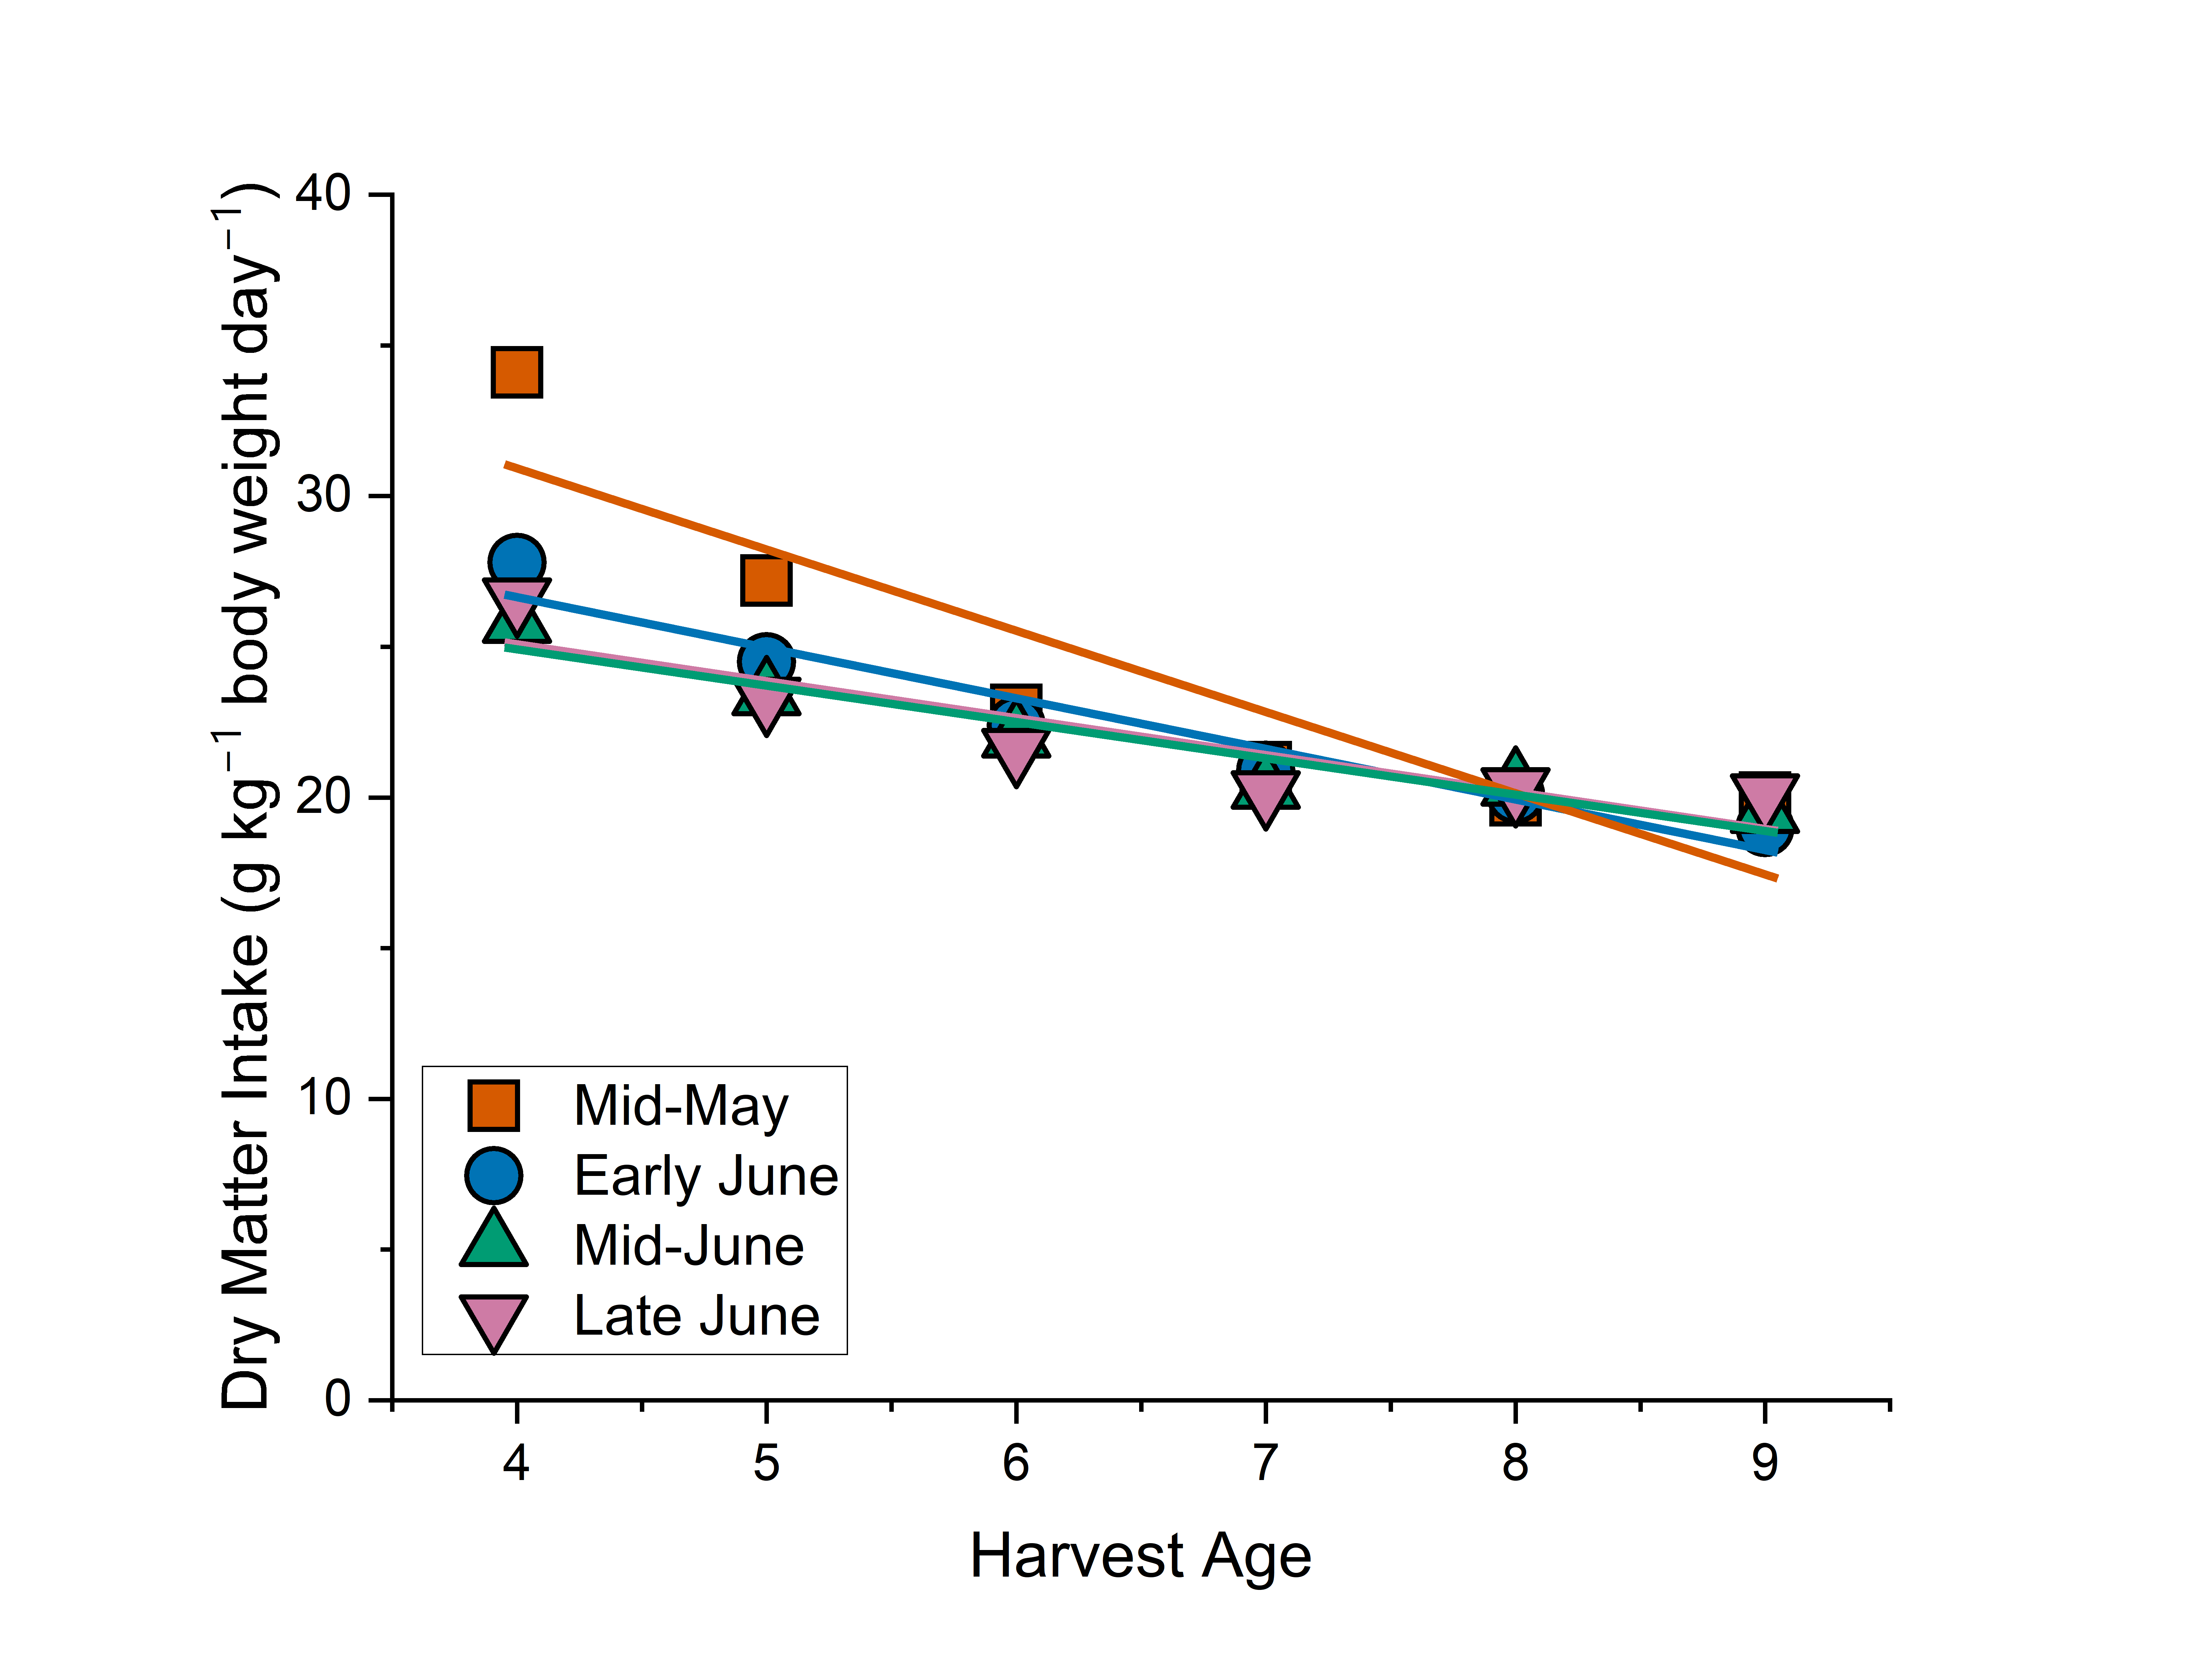
Earlier crabgrass growth stages (an average of 26.3 g kg BW–1 day–1 at tillering and stem elongation compared to 20.1 g kg BW–1 day–1 between flag leaf and flowering) and younger ages had higher DMI values which corresponded with the mid-May planting date having higher DMI overall (24.2 g kg BW–1 day–1) compared to an average of 22.1 g kg BW–1 day–1 at for June plantings) (Table 3, Table 5, and Table 6; Figures 19 and 20). DMI was higher at the second cutting (23.0 g kg BW–1 day–1 across all varieties compared to 20.0 g kg BW–1 day–1 at first cutting). 112 kg/ha N at planting had higher DMI (22.1 g kg BW–1 day–1) than 56 kg/ha at planting (21.1 g kg BW–1 day–1) or no nitrogen fertilization (20.7 g kg BW–1 day–1) but it was not significantly higher than the split N treatment (21.6 g kg BW–1 day–1). QB and QS (an average of 21.9 g kg BW–1 day–1) had higher DMI than DR and MO (and average of 21.0 g kg BW–1 day–1) (Table 4).
Relative Feed Value
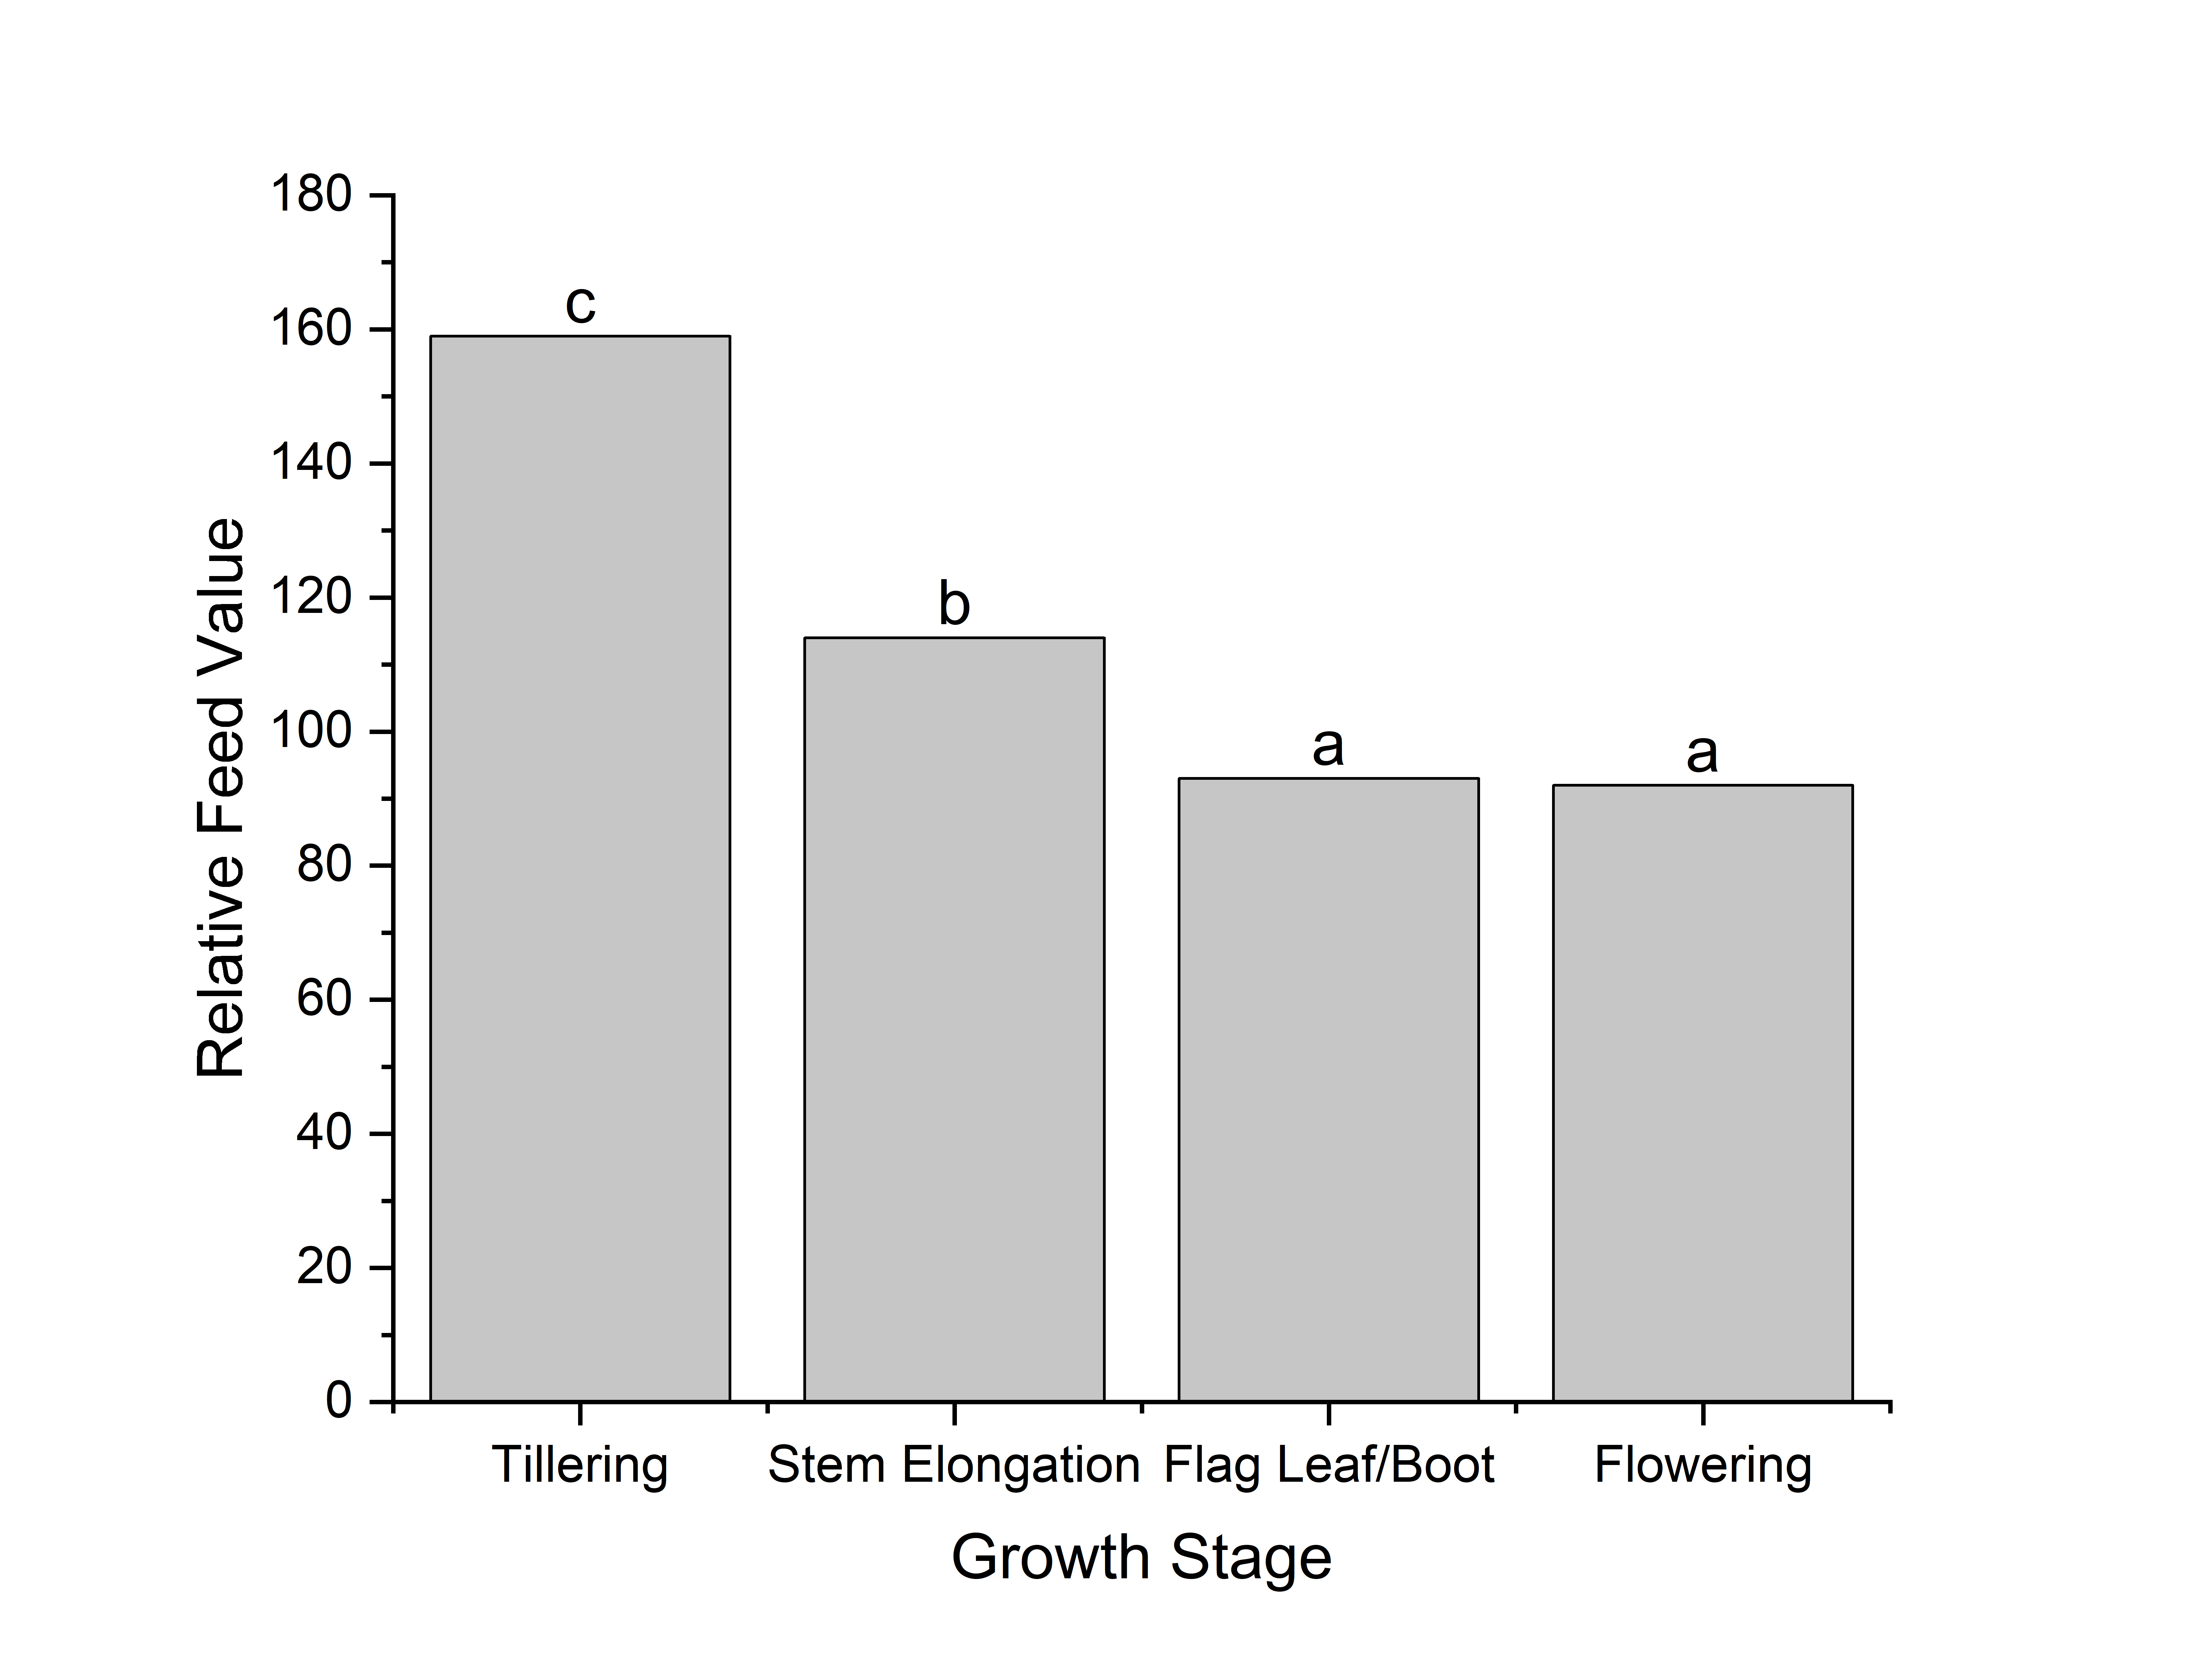
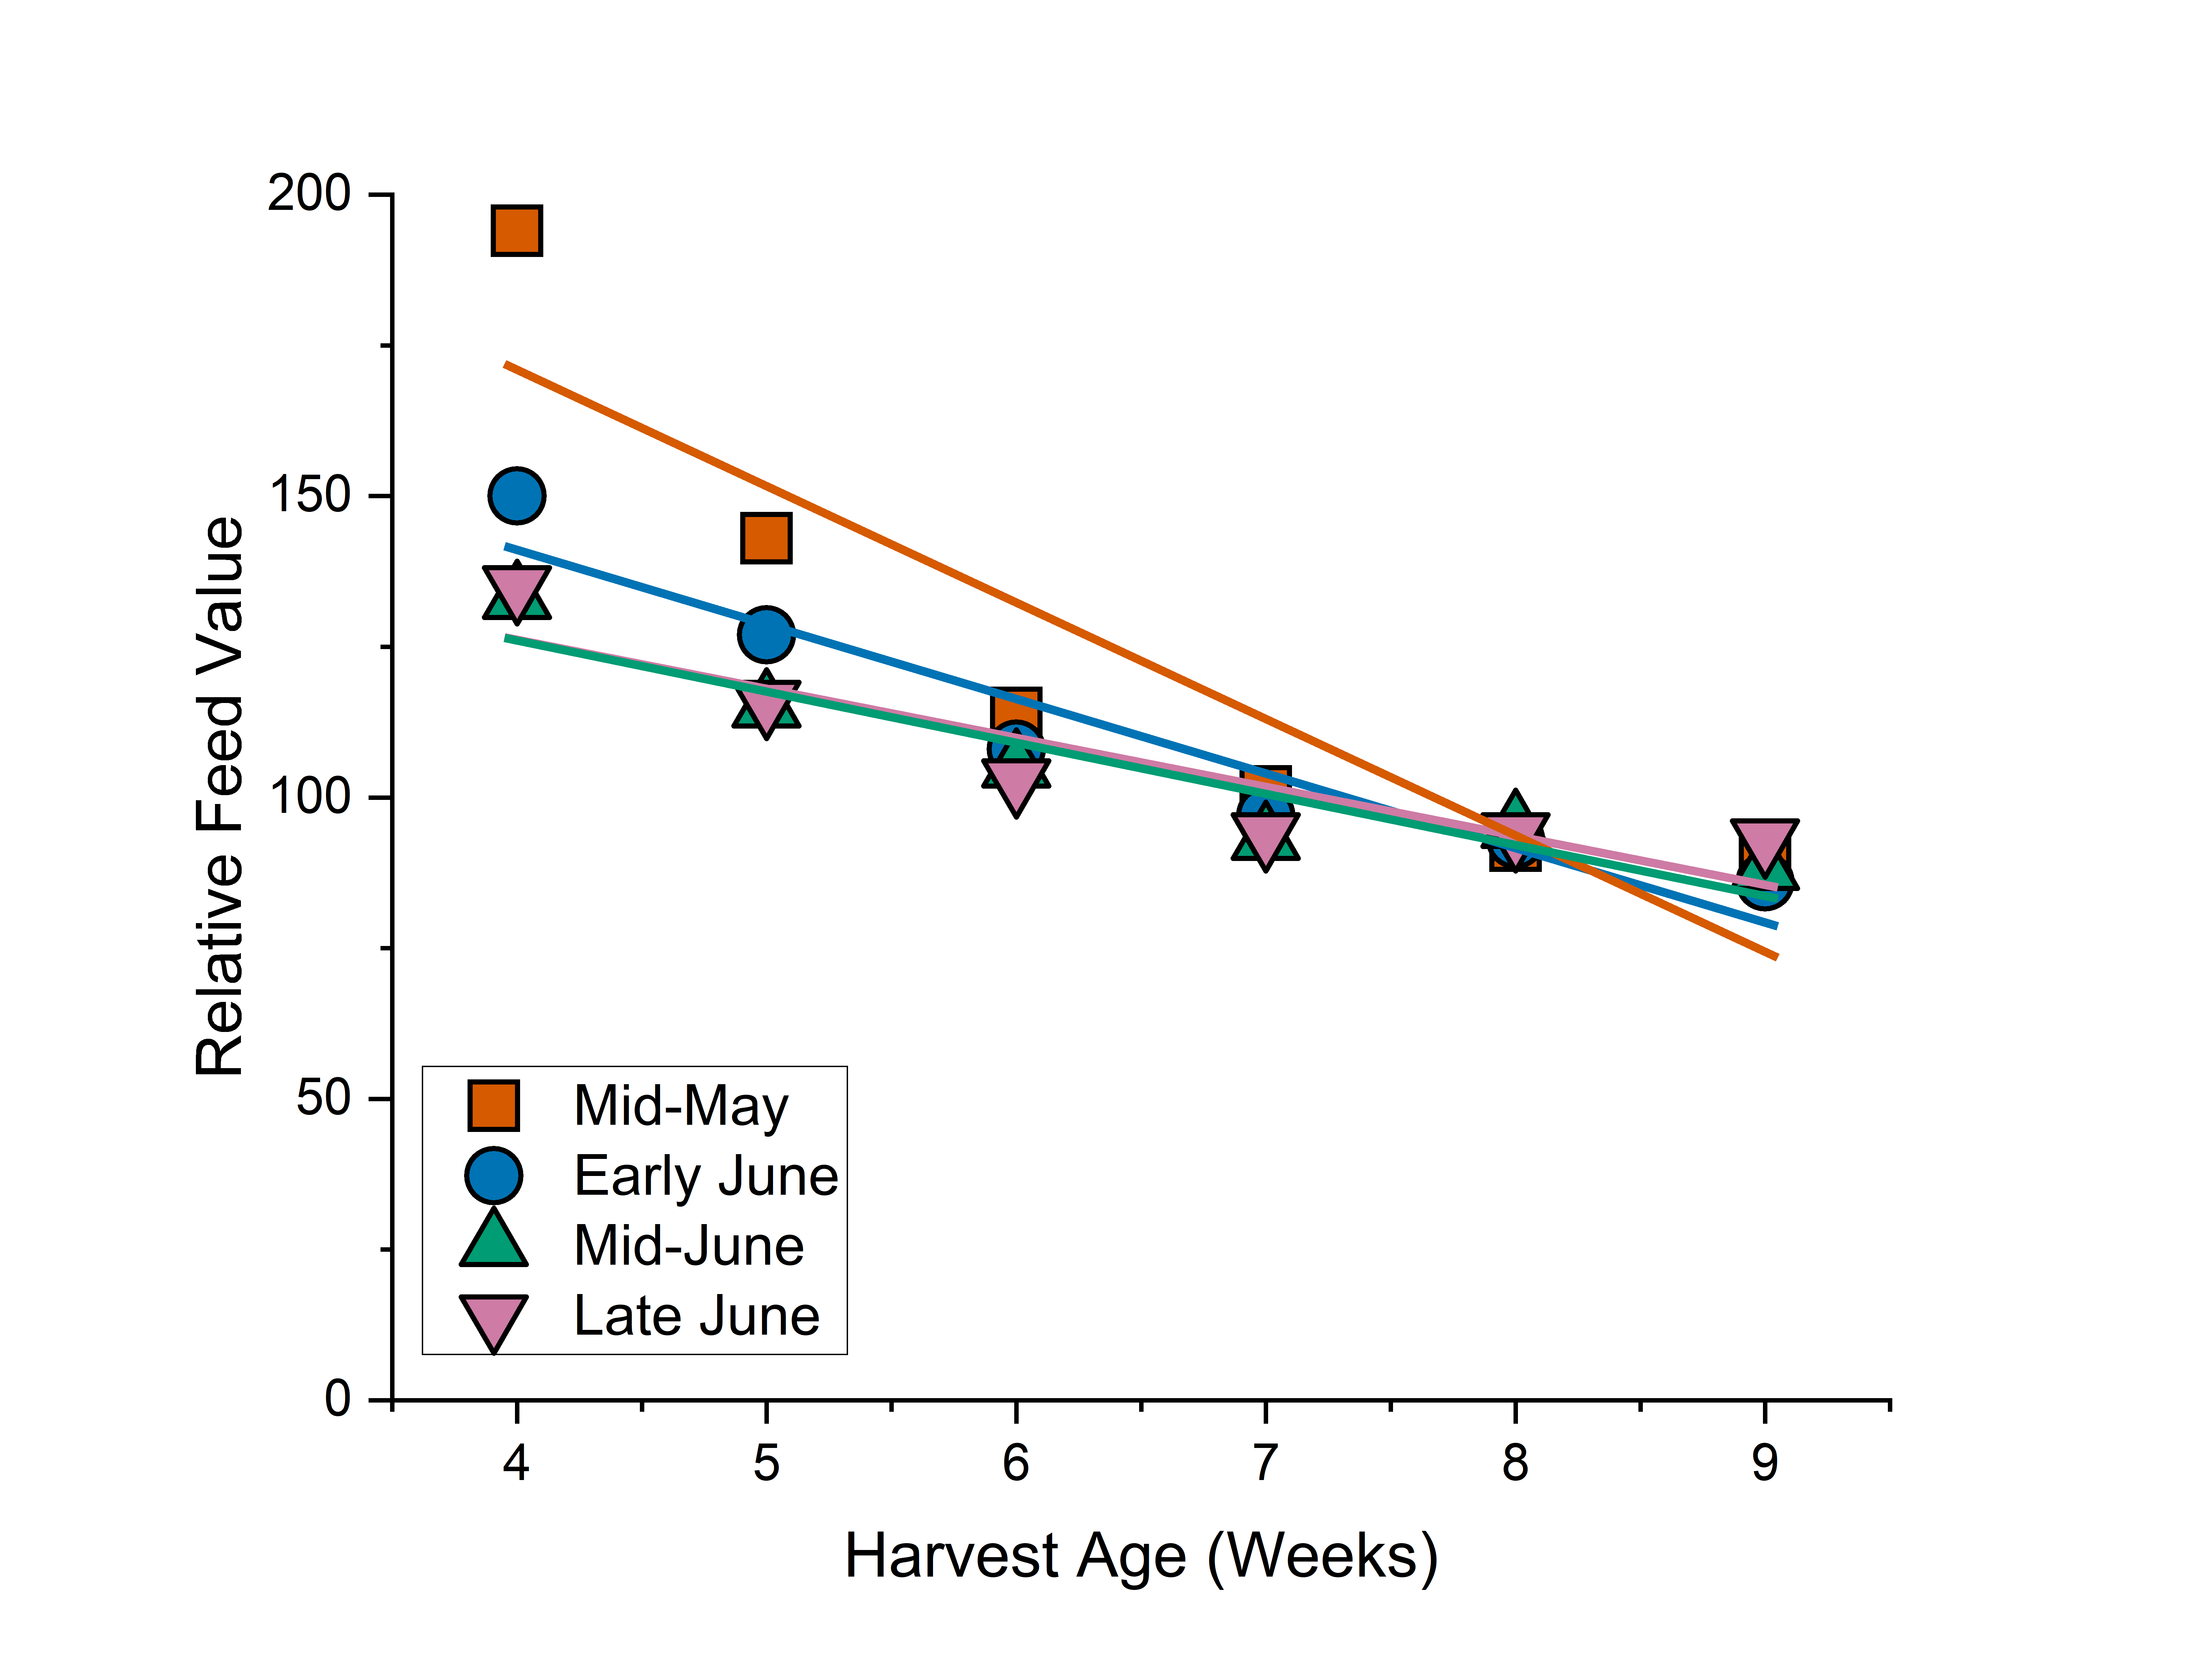
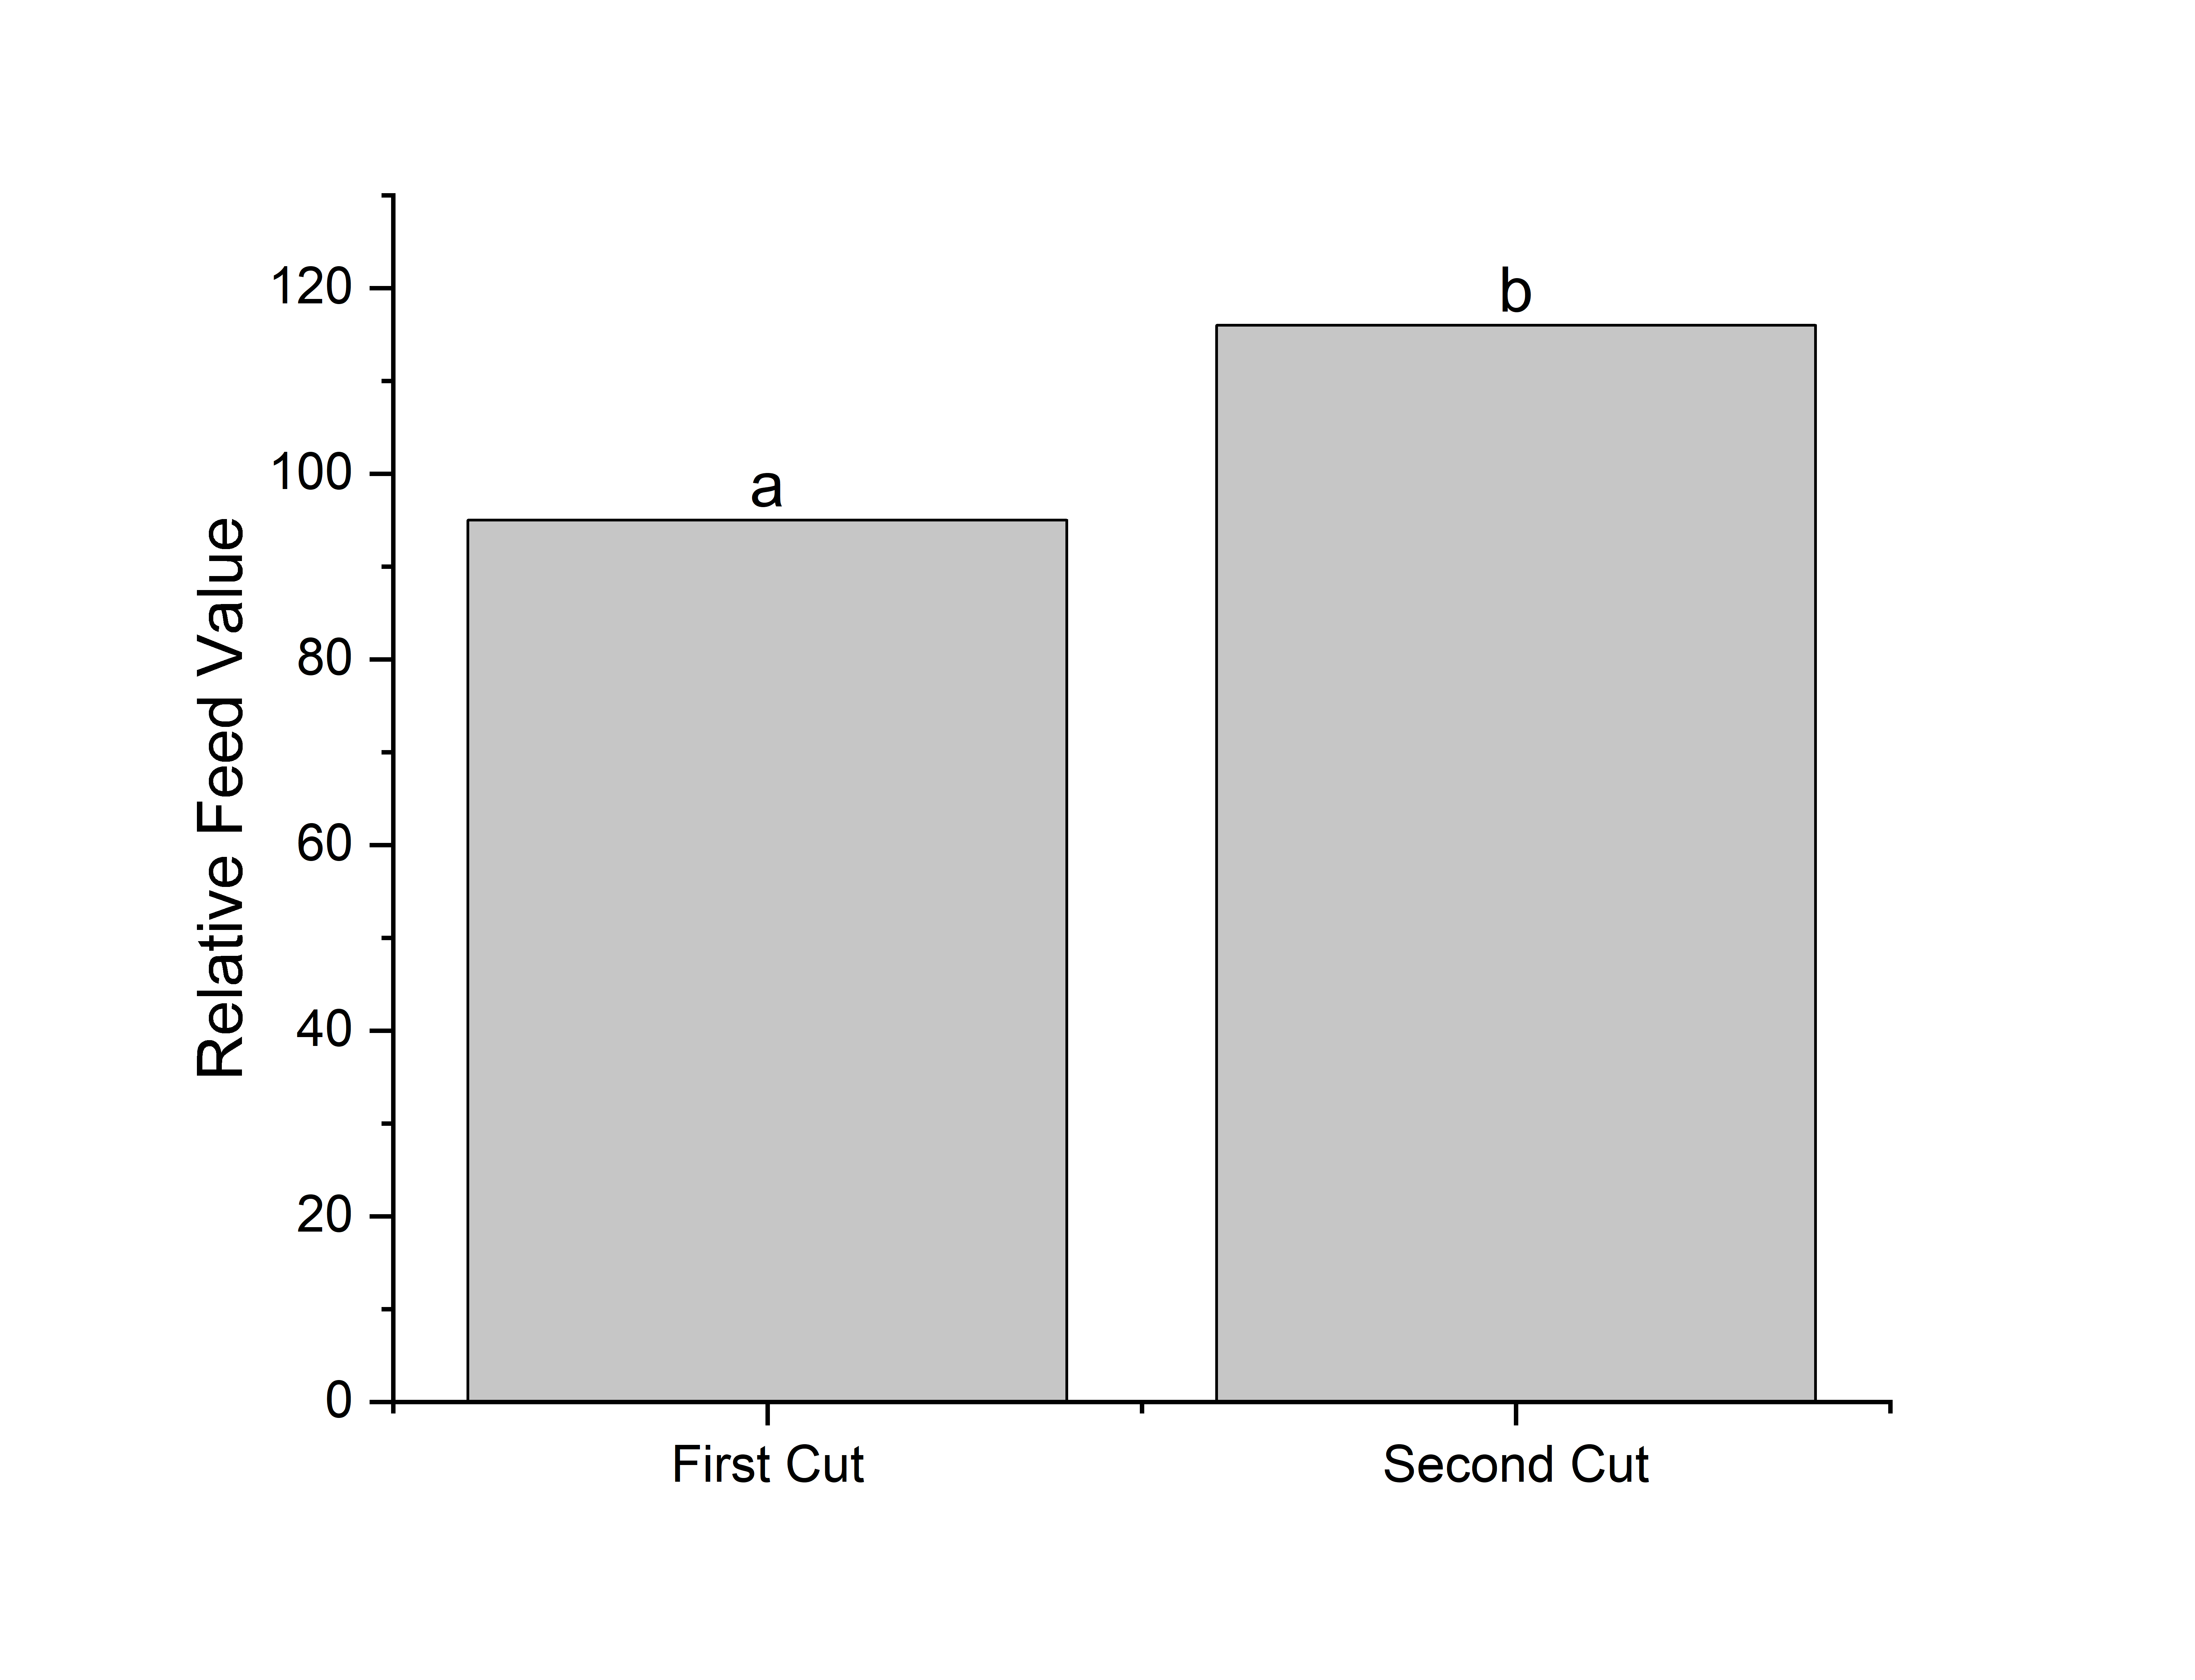
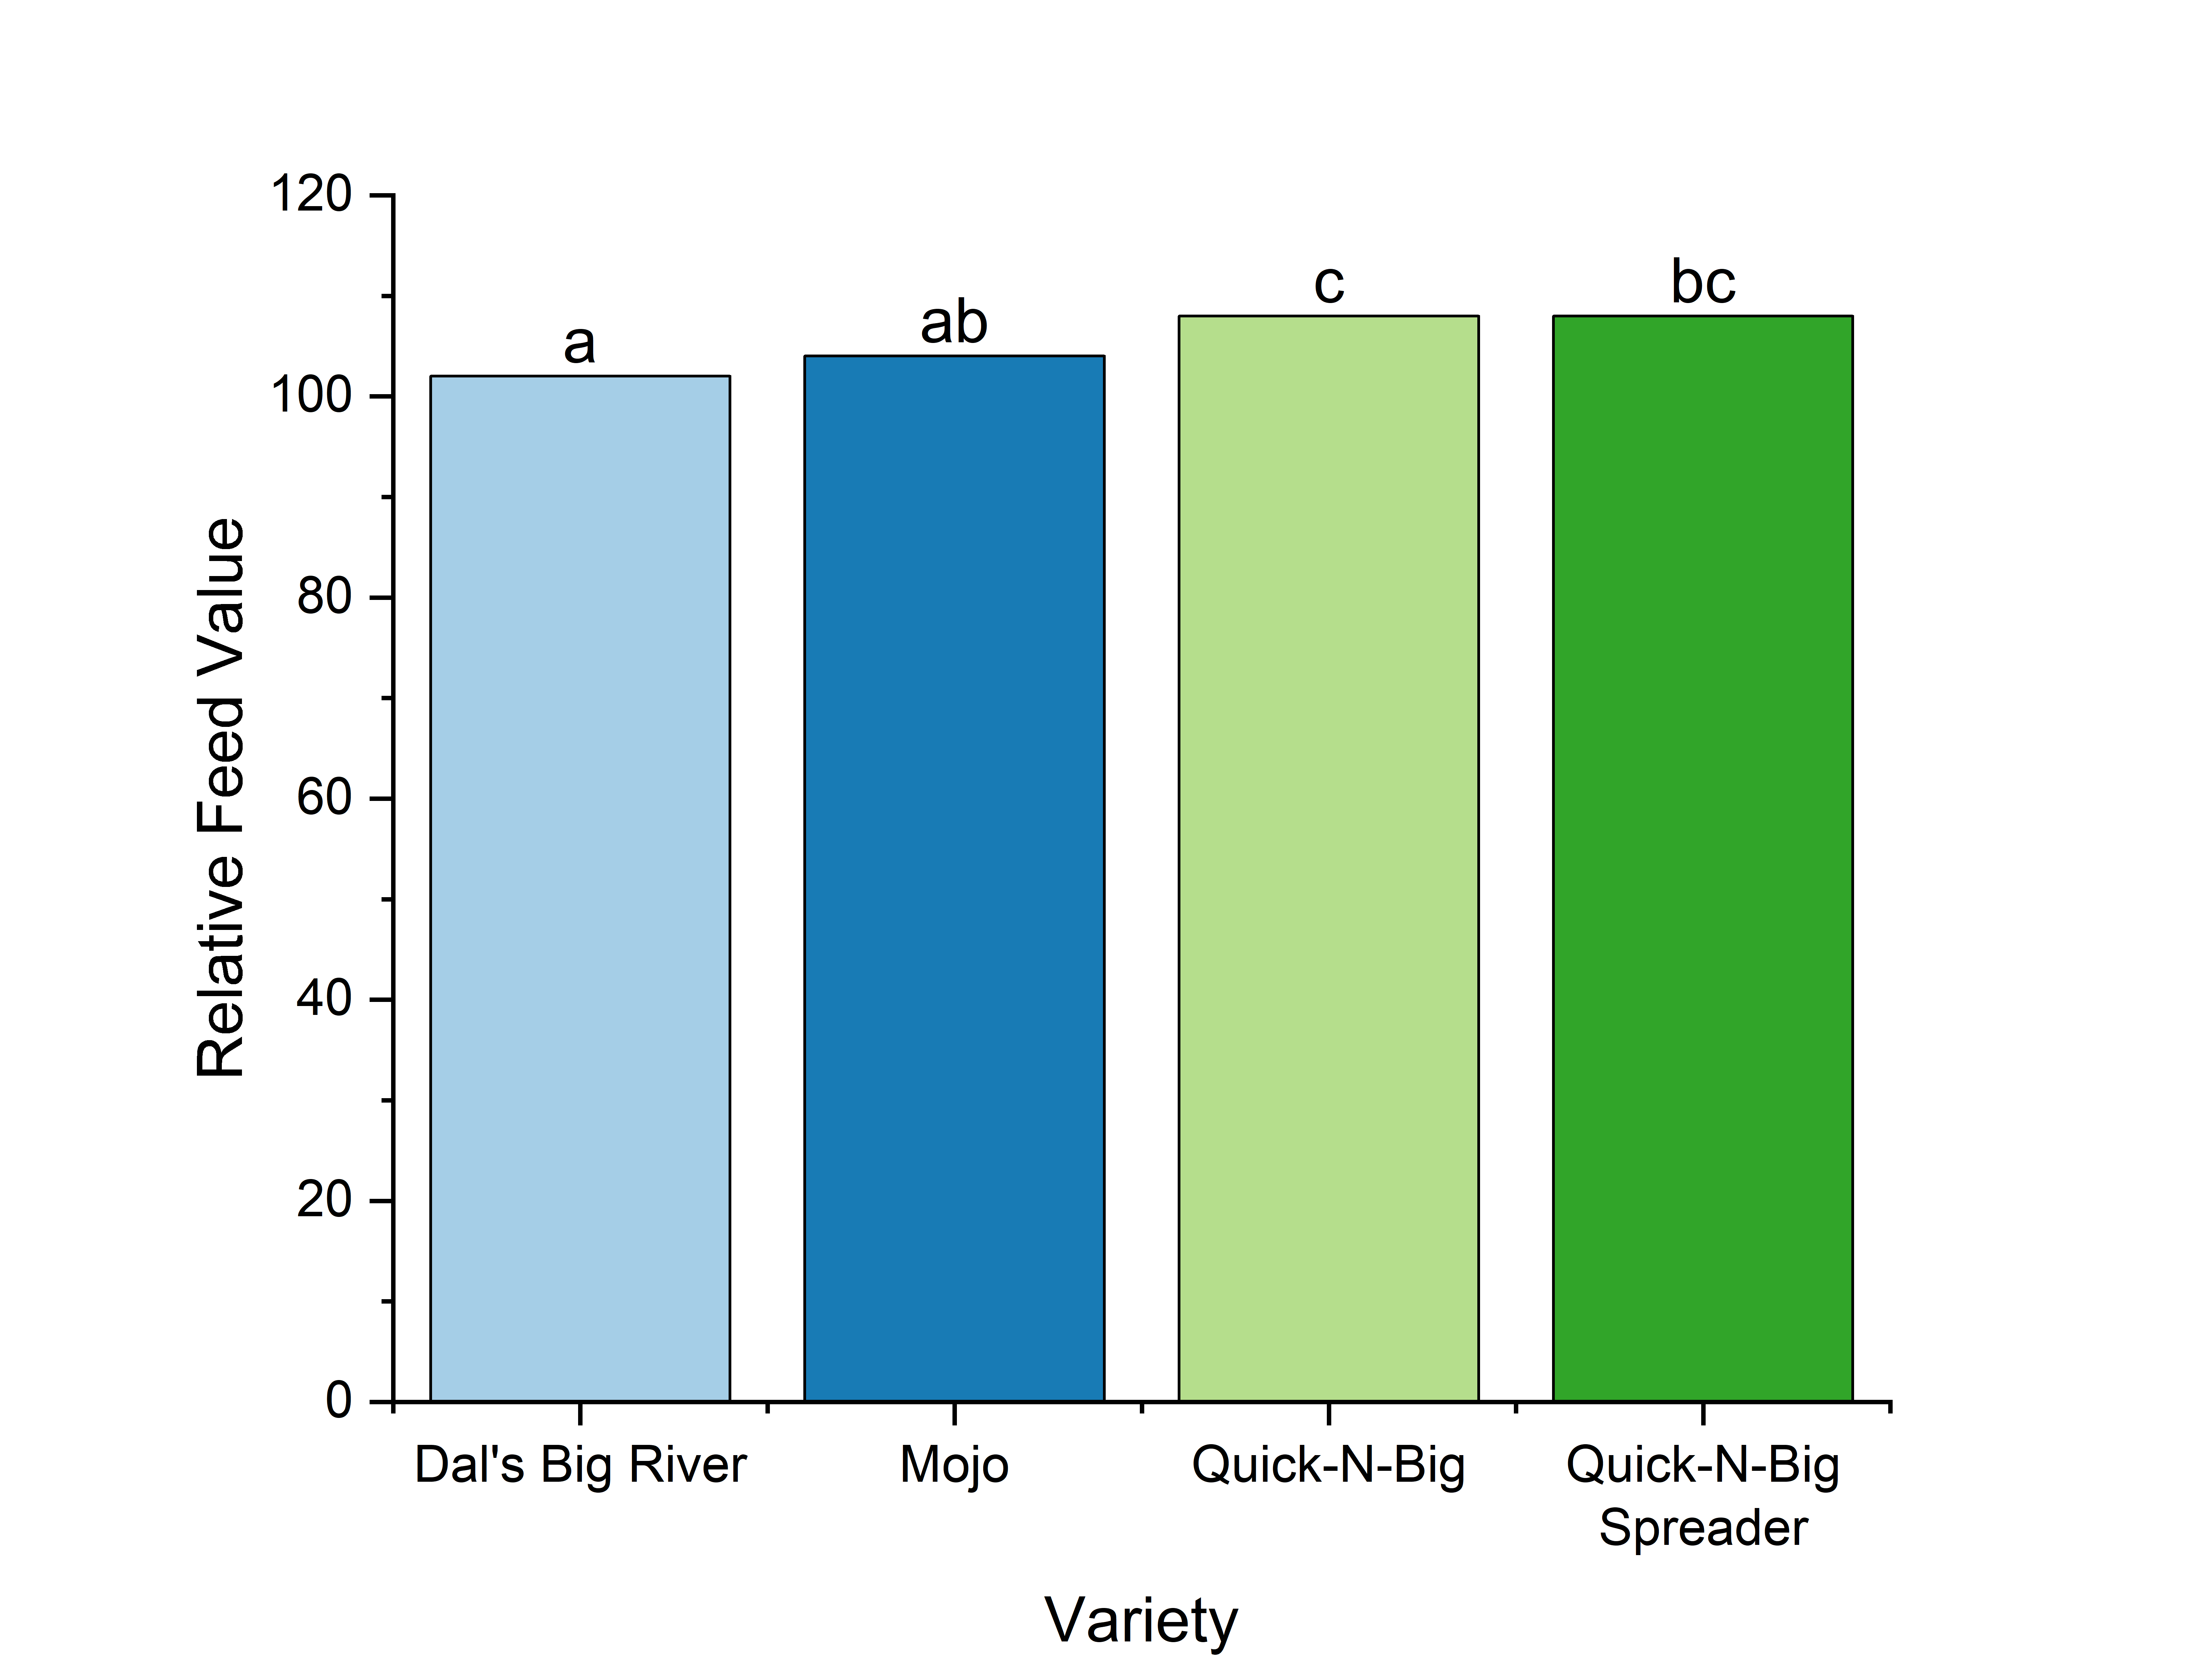
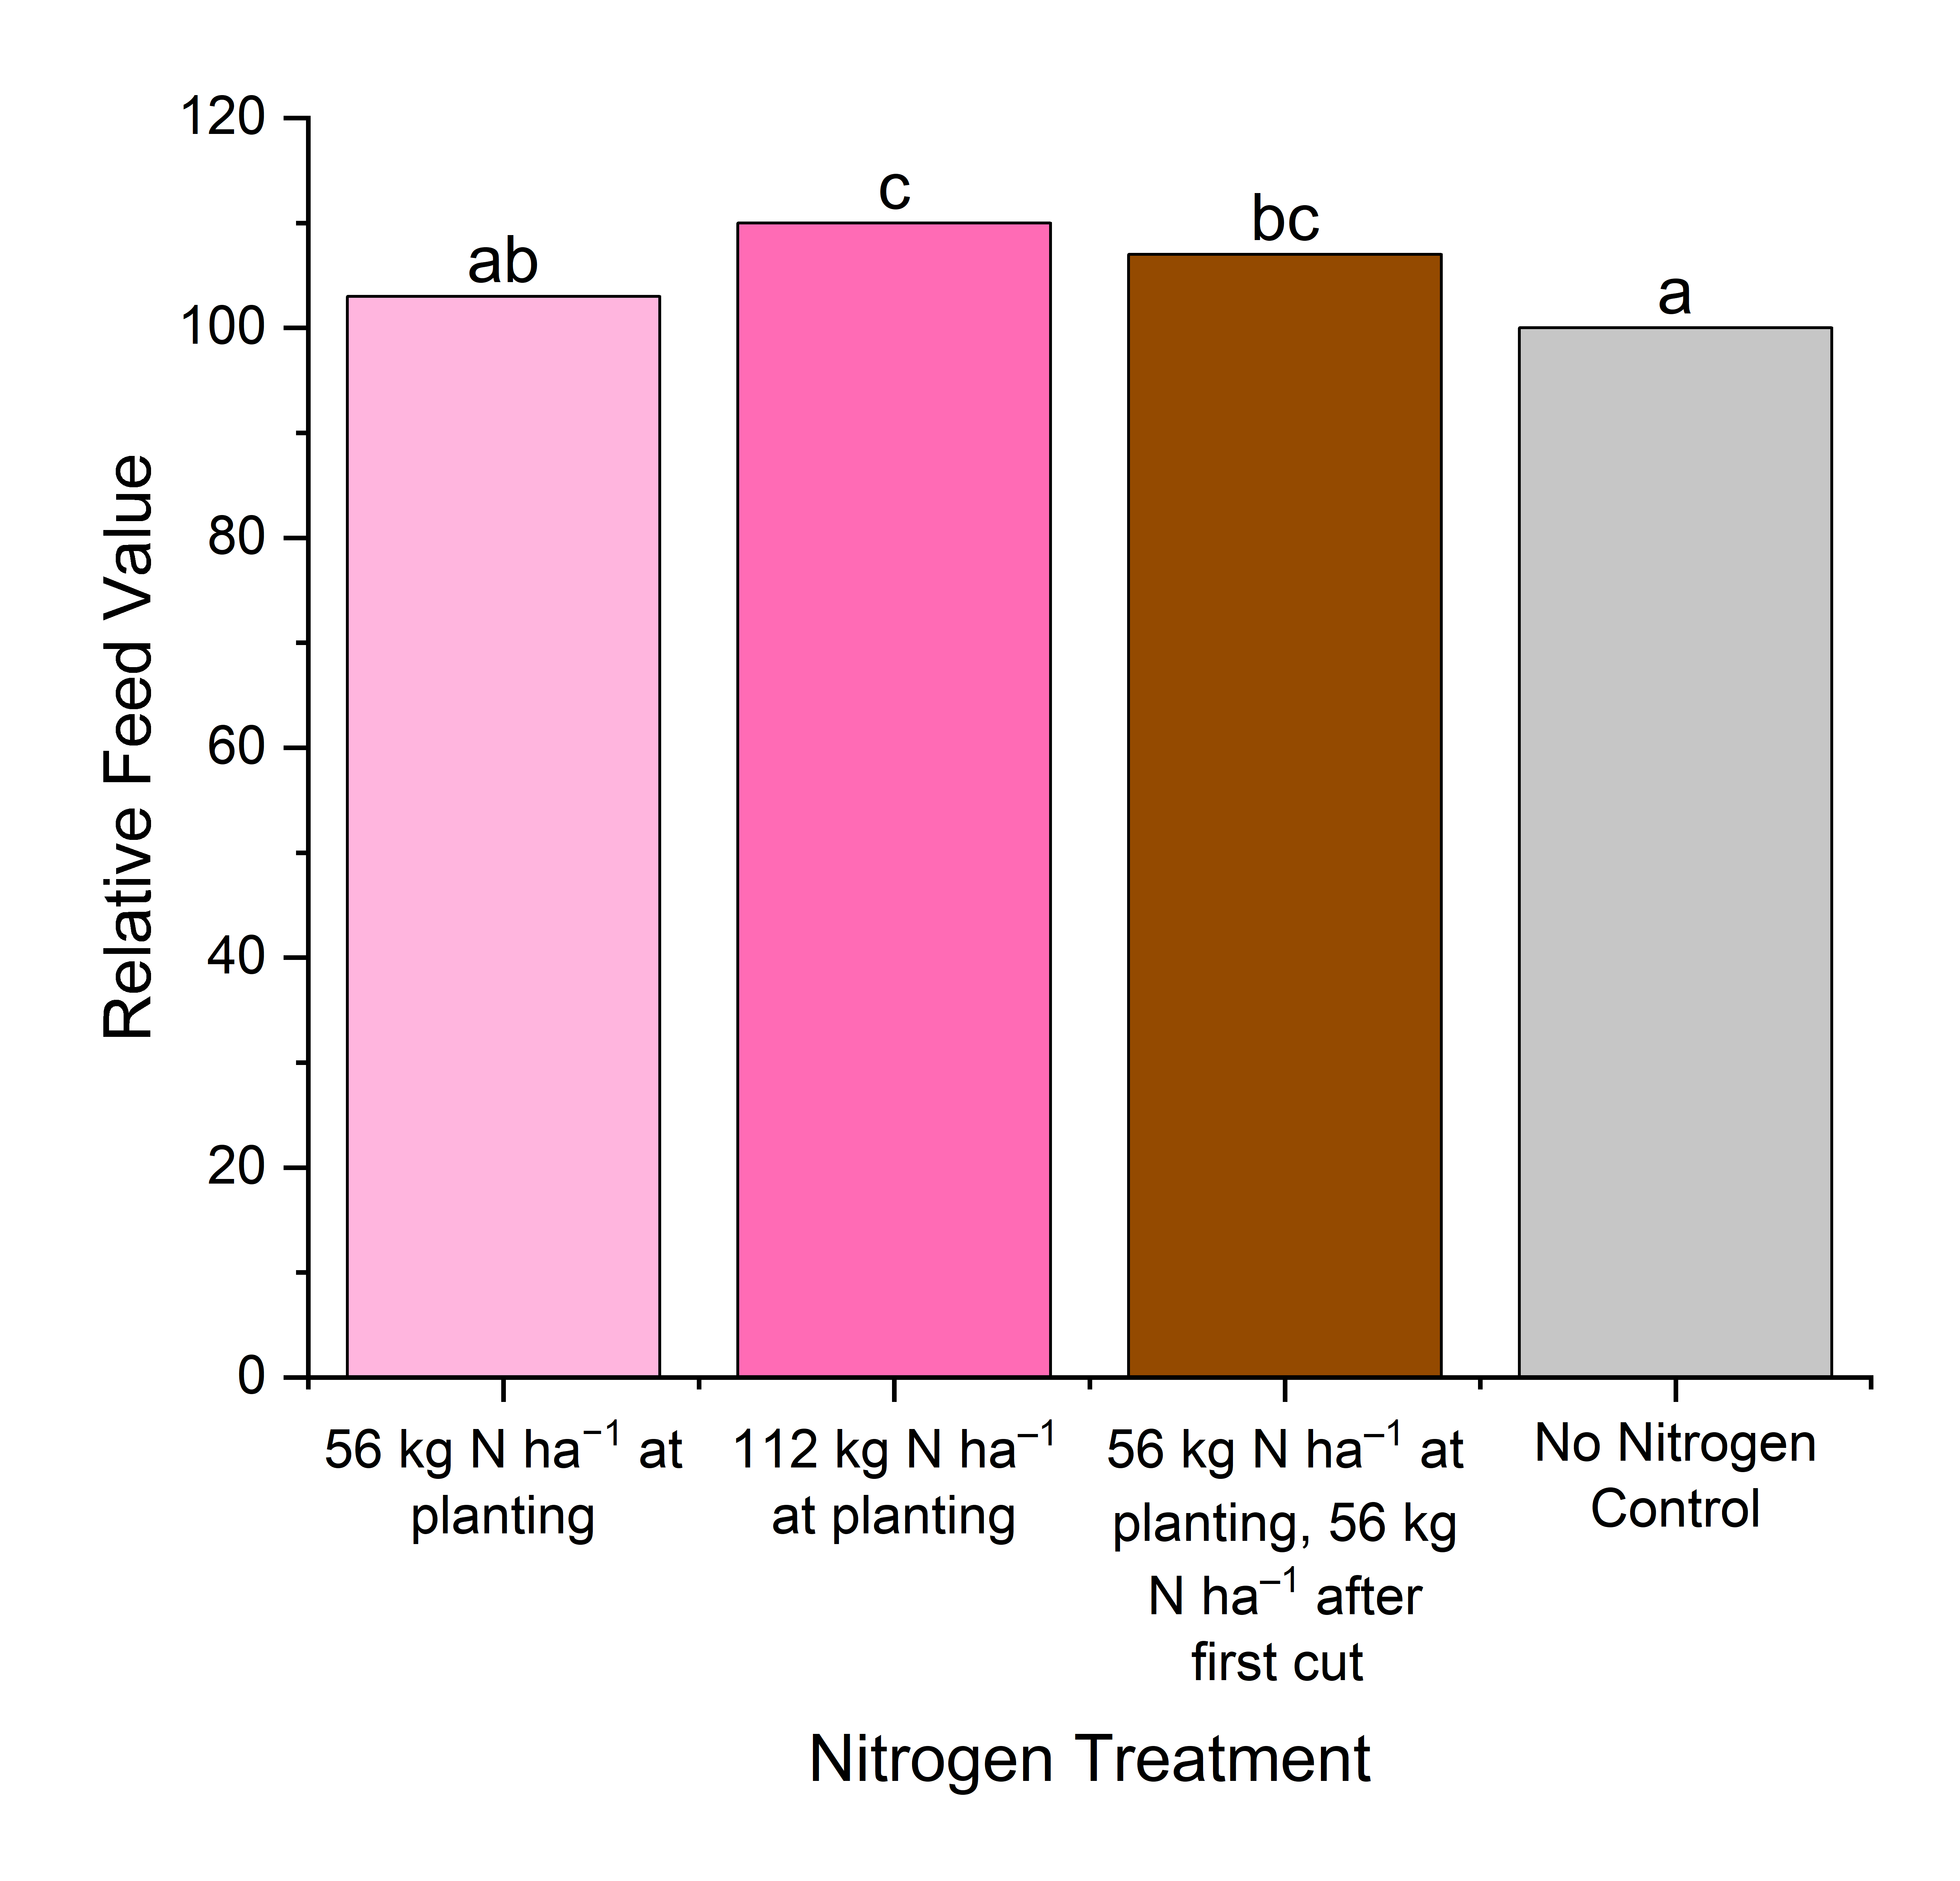
RFV fell as crabgrass matured into later growth stages (from 159 at tillering to 92 at flowering) and between four (153) and nine weeks (90) after planting (Table 3, Table 5, and Table 6; Figures 21 and 22). Mid-May planting had higher RFV overall, primarily driven by having much higher forage quality at four (194) and five weeks old (143) relative to other planting dates which averaged a RFV of 119 at five weeks old, although the difference was less notable between mid-May and early June (Table 3 and Table 6, Figure 22). The second cut had much higher RFV for all varieties (116 compared to 95 at the first cut) and QB and QS had a little bit higher RFV (108) than DR and MO at both cuts (103) but the difference between QS and MO was not significant (Table 4, Figures 23 and 24). 112 kg/ha N led to the highest RFV (110) followed by split N (107), 56 kg/ha N at planting (103), and finally no N control (100) but the differences between N treatments were often not significant and were small compared to the difference based on age (Table 3 and Table 4, Figures 25 and 22).
Comparison with other summer annual grasses
Hay Yield and Quality
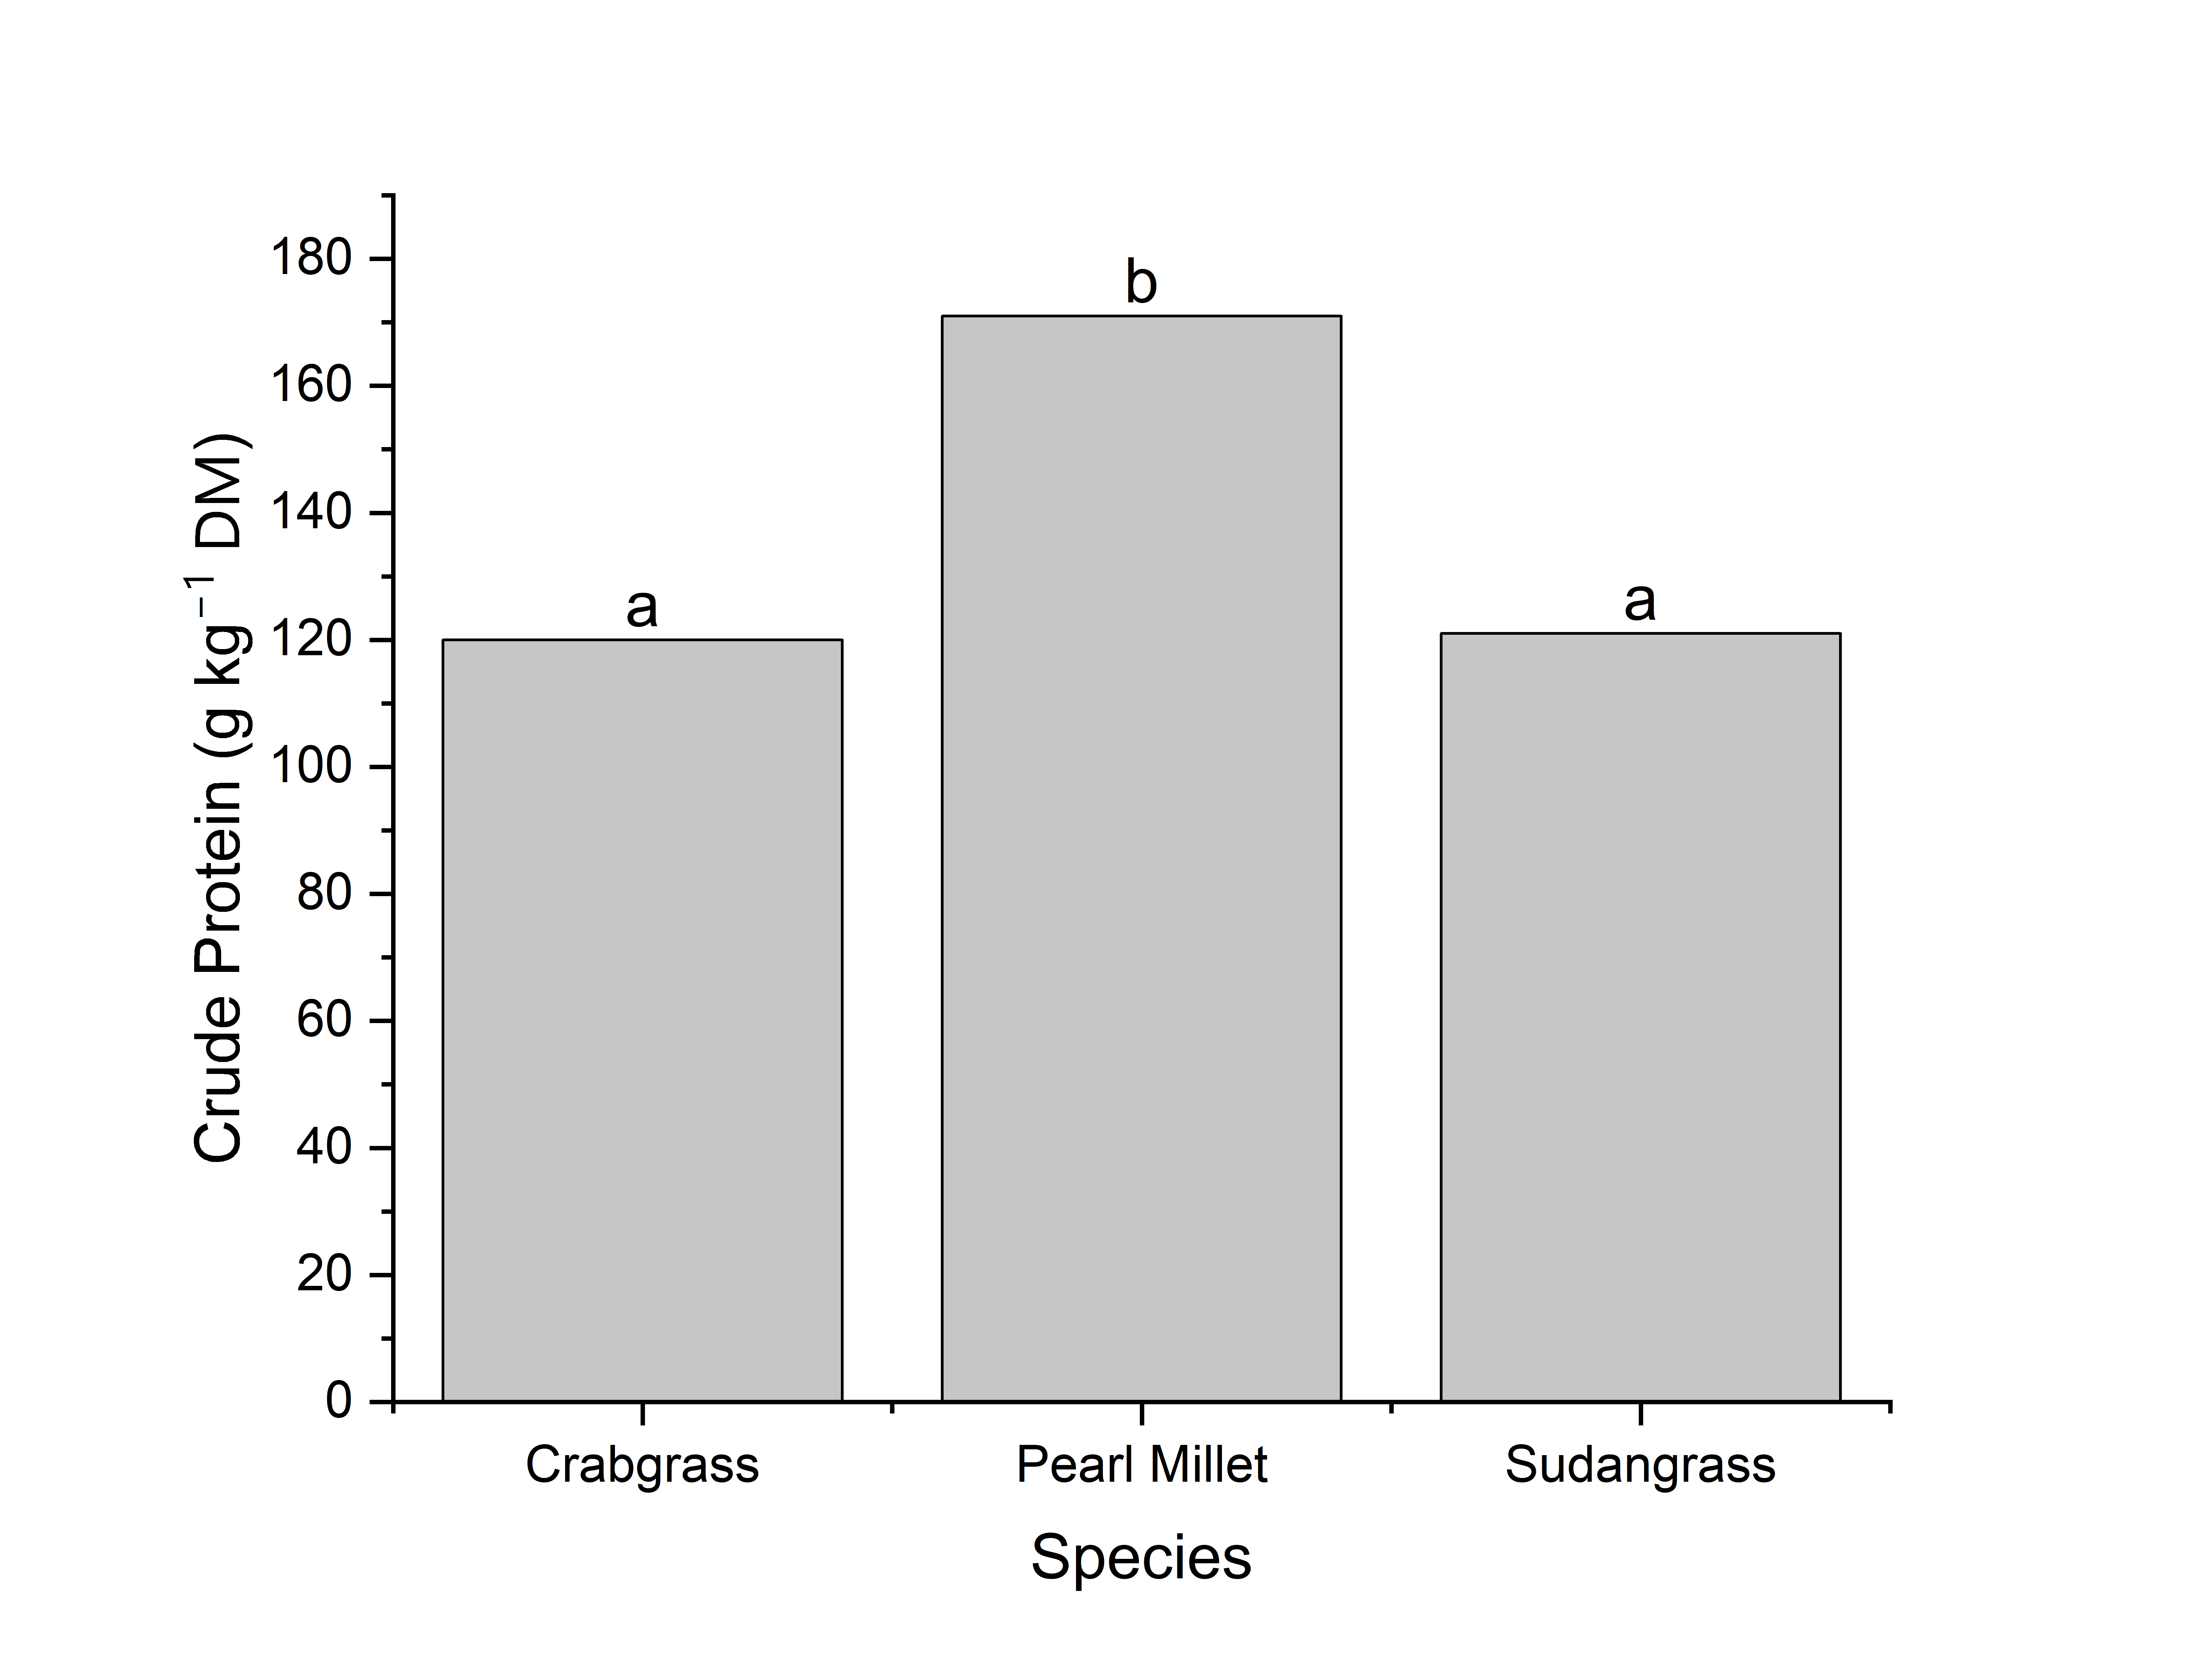
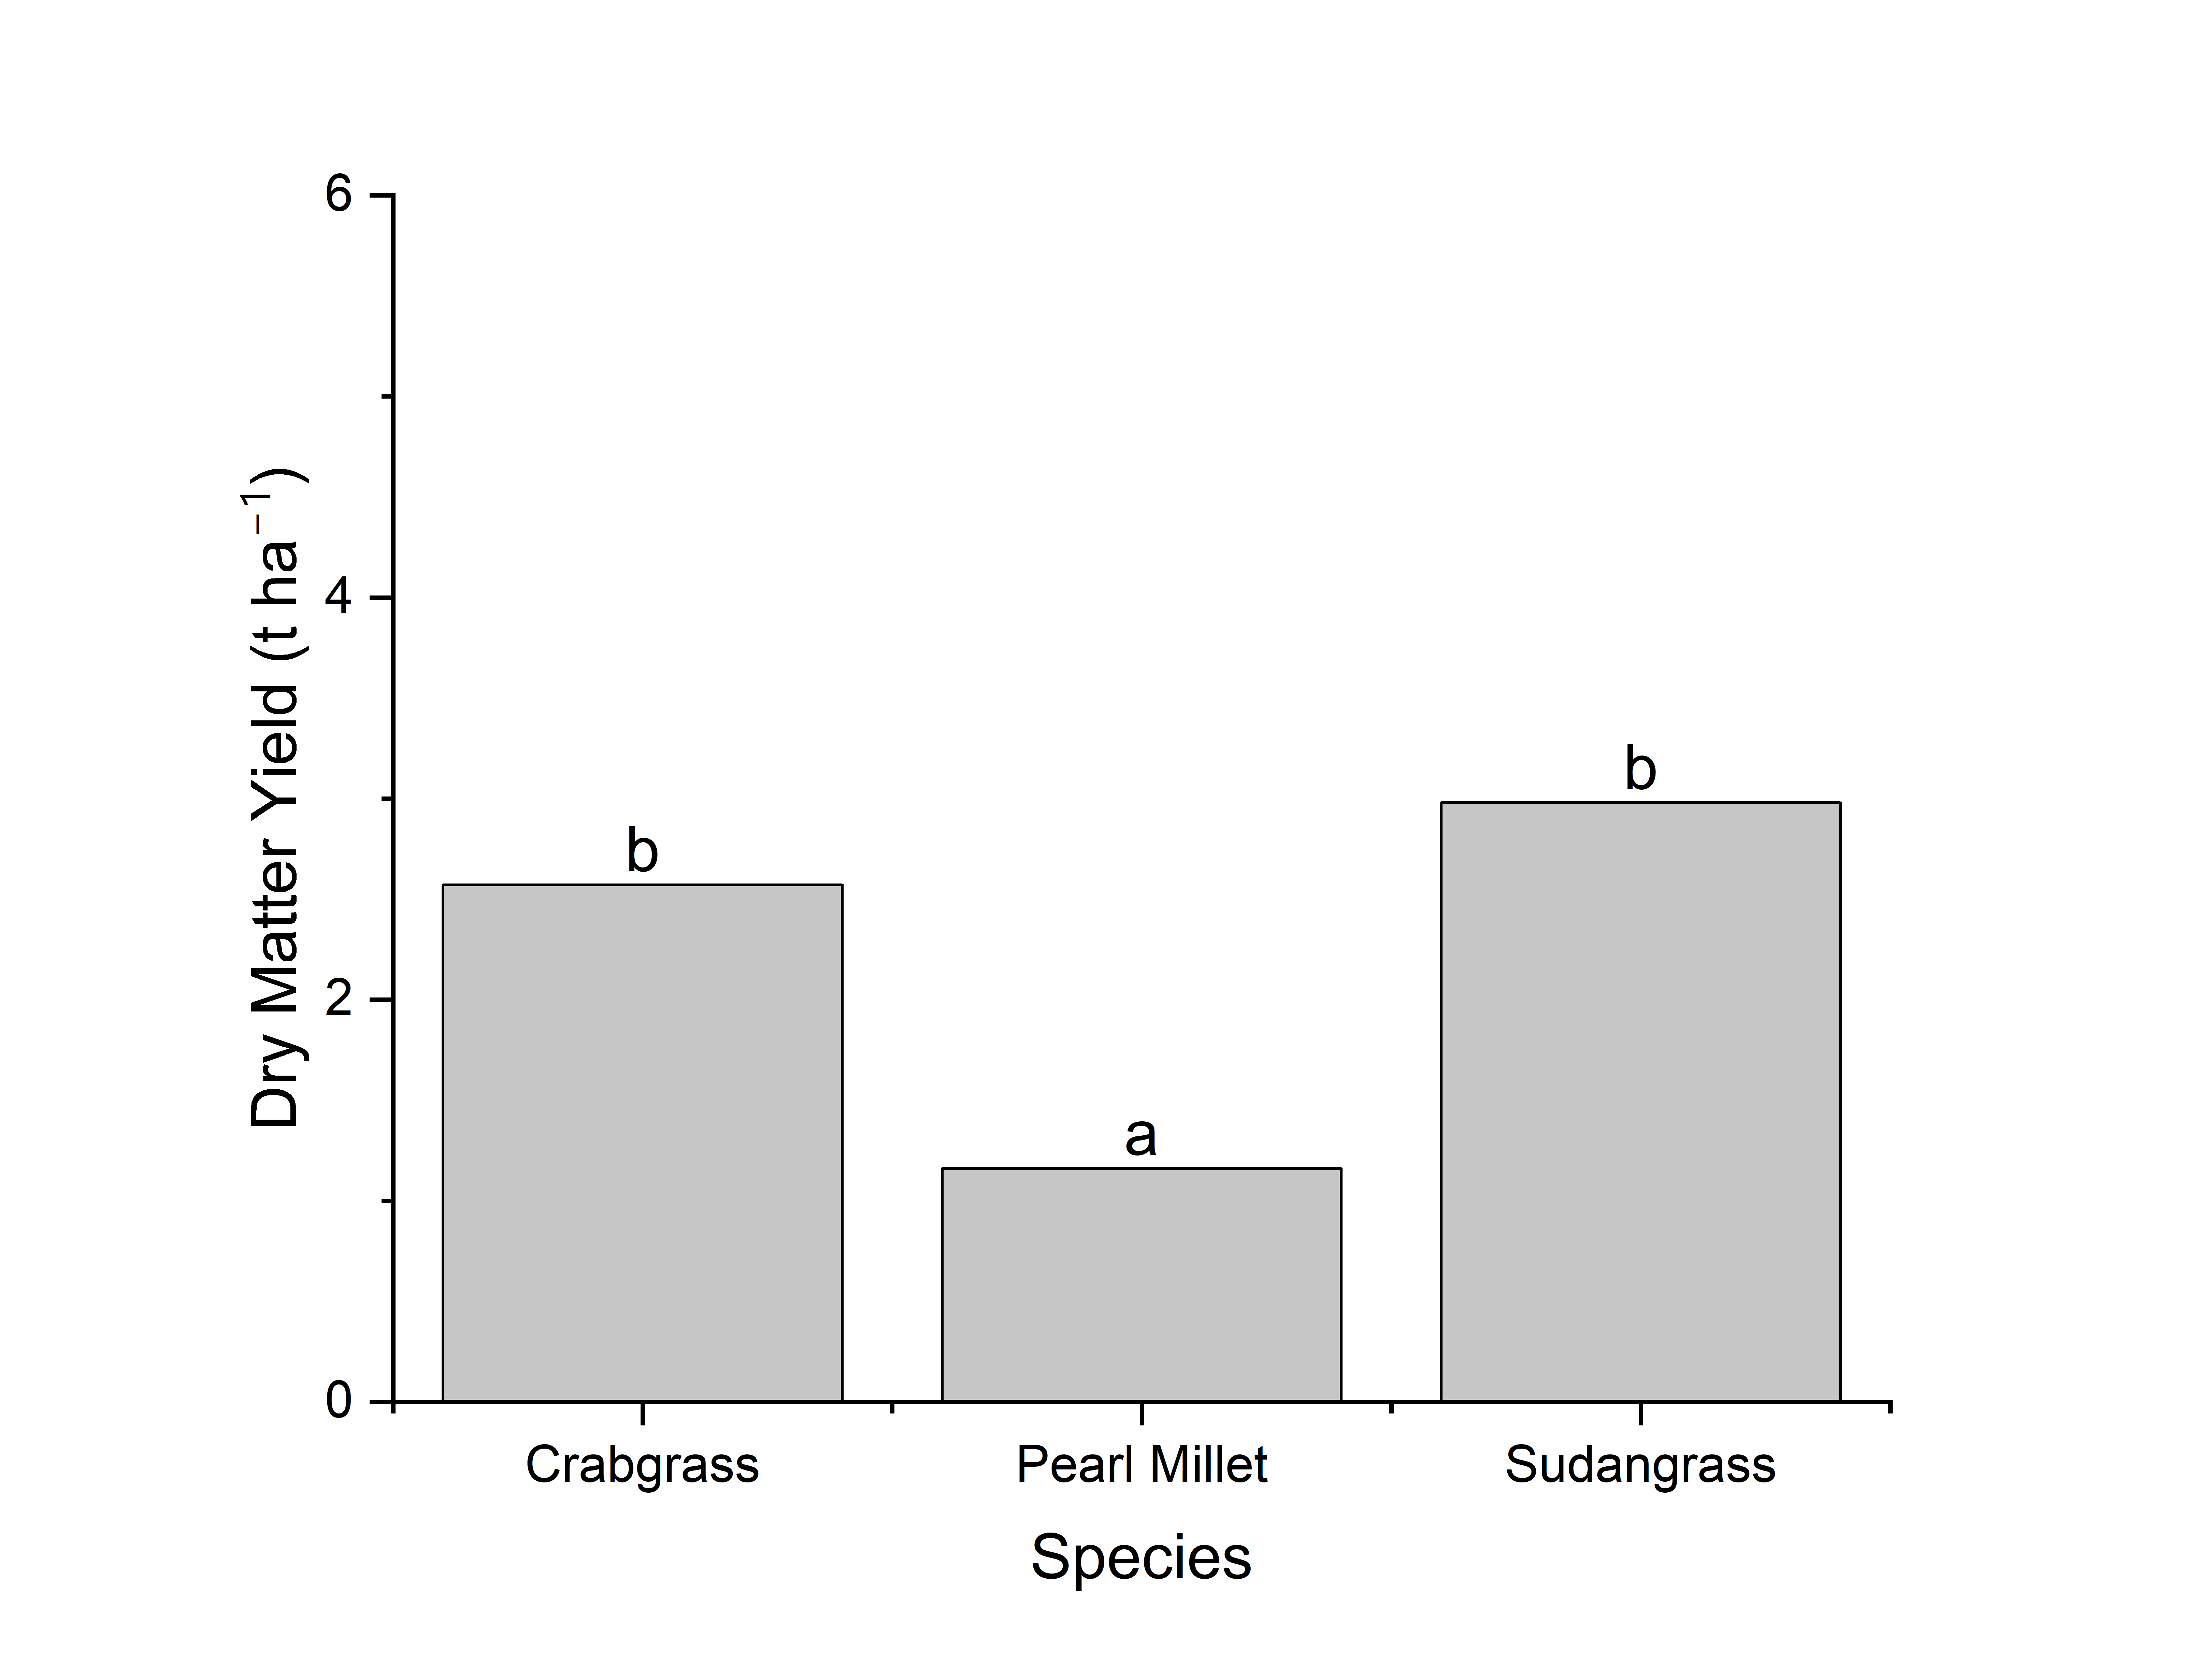
There were even fewer forage quality differences between the grass species with no significant differences in NDF, DMI, NFC, TDN, or RFV (Table 7). The largest differences among the grasses were that pearl millet had higher protein content (171 g kg–1) than either crabgrass (120 g kg–1) or sudangrass (121 g kg–1) (Figure 26) and lower yield (pearl millet: 1.16 t ha–1, crabgrass: 2.57 t ha–1, sudangrass: 2.98 t ha–1) (Figure 27). Pearl millet also had significantly lower ADF than either crabgrass or sudangrass and higher DDM than crabgrass (Table 7).
Silage Quality
Overall crabgrass produced silage that was not quite as high quality as either pearl millet or sudangrass. That said, all three summer annual grasses produced acceptable quality silage with mean VFA scores above 7.5 and few differences in forage quality or acid content (Table 8). Crabgrass had higher ADF (411 g kg–1), NFC (213 g kg–1), and TDN (577 g kg–1) than either pearl millet or sudangrass but there were no differences in protein, NDF, NEL, or RFV. Crabgrass did have lower lactic acid content (52 g kg–1) than either sudangrass (88 g kg–1) or pearl millet (66 g kg–1), although it was only significantly lower than sudangrass, while pearl millet had lower acetic acid content (12 g kg–1) than either crabgrass or sudangrass (27 g kg–1). There were no significant differences in propionic, butyric, or iso-butyric acid or overall pH (Table 8). Sudangrass silage had both lower ammonia content (74 g kg protein–1) and higher total acids (116 g kg–1) than crabgrass and pearl millet (ammonia: 119 g kg protein–1, total acids: 81 g kg–1) (Table 8).
Crabgrass growth and quality among analogous experimental treatments
Small differences in management and sampling and the lack of spatial randomization among the three experiments led to a few significant differences among the analogous treatments (Quick-N-Big crabgrass planted in early June at a seeding rate of 6.7 kg ha–1 with 56 kg N ha–1 at planting and harvested about 7 weeks after planting) of the different experiments (Table 9). Compared to the other experiments, dry matter yield was higher in Experiment 1 (planting date, seeding rate, harvest age) (3.73 compared to 2.62 t ha–1), protein content was lower in Experiment 3 (comparison to pearl millet and sudangrass) (120 compared to167 g kg DM–1), and NDF digestibility was lower in Experiment 2 (variety, nitrogen fertility, harvest timing) (439 compared to 485 g kg NDF–1) (Table 9). NFC varied among all three experiments (47 g kg DM–1 in Experiment 1, 93 g kg DM–1 in Experiment 2, and 149 g kg DM–1 in Experiment 3). The difference in yield was partly the result of differences in harvest height in the experiments since Experiment 1 was cut at ground level while Experiments 2 and 3 were cut at 10 cm. No other forage quality characteristics were significantly different among analogous treatments in the three experiments (Table 9).
As a whole the results of all three experiments show that crabgrass has high potential as a new summer forage crop in the US Northeast. Young crabgrass (six weeks or less after planting) had high forage quality but relatively low yields (Figures 1 and 22, Table 2 and Table 6). At the same time, yield increased with higher seeding rates (especially for earlier harvests) (Table 2). Thus, there is likely to be a benefit of a higher seeding rate (up to 10.1 kg ha–1) when grazing or harvesting within the first six weeks for animals with high forage quality needs while there is less consistent benefit to seeding rates above 6.7 kg ha–1 for mature stands suitable for animals with lower nutrition needs (Table 2). That said the RFV of crabgrass was only occasionally below 90 when already producing mature seeds (Table 3, Figure 22) and thus has a similar forage quality trajectory to other common forage grasses like orchardgrass (Mir et al., 2024) without committing to a perennial crop. Crabgrass plantings between mid-May and late June all followed the same trajectory but the crabgrass maturation was quicker with later plantings (Figures 1 and 22). Planting in early and mid-June seemed to best balance fast early growth with a wide harvest window.
The lower forage quality in older crabgrass was driven by declines in CP, DDM, and DMI while ADF and NDF increased (Table 2 and Table 6, Figures 7, 8, 16, 20). However, as the crabgrass matured, NDFD (Figure 11), TDN remained relatively stable while NFC increased and, although lower for older crabgrass, CP remained above 135 g kg–1 (Table 2). Thus, the lower RFV for older crabgrass likely overstates the forage quality decline since it does not account for either CP or NFC.
This research found that there were differences between the two species used as forage crabgrass and that it is important for producers to understand which species they are using but that this distinction is often not highlighted in research or seed catalogs. D. sanguinalis (QB and QS) has a little higher forage quality (Figures 5, 14, 18, and 24) compared to D. ciliaris (DR and MO) but needs to be managed differently in multi-cut forage systems since D. ciliaris regrowth matures much more slowly and yields more than D. sanguinalis after cutting (Figure 2). Furthermore, since there were no differences within each crabgrass species, it is likely that knowing the species of new varieties will be the best way for farmers and researchers to predict performance. For instance, since the research presented as Experiment 1 here (focused on planting date and harvest timing) was conducted using Quick-N-Big crabgrass we would expect the results to be more transferrable to other D. sanguinalis varieties.
Nitrogen fertilization at 56 kg ha–1 before each cut produced better quality forage and higher yield than either a single large nitrogen application after planting or a lower overall nitrogen rate (Table 4, Figures 3 and 25). While crabgrass fertilized with 112 kg ha–1 at planting did have higher CP at the first cut, treatments with only 56 kg ha–1 still had more than 150 g kg–1 CP and the additional protein is not needed for animal health (Figure 4).
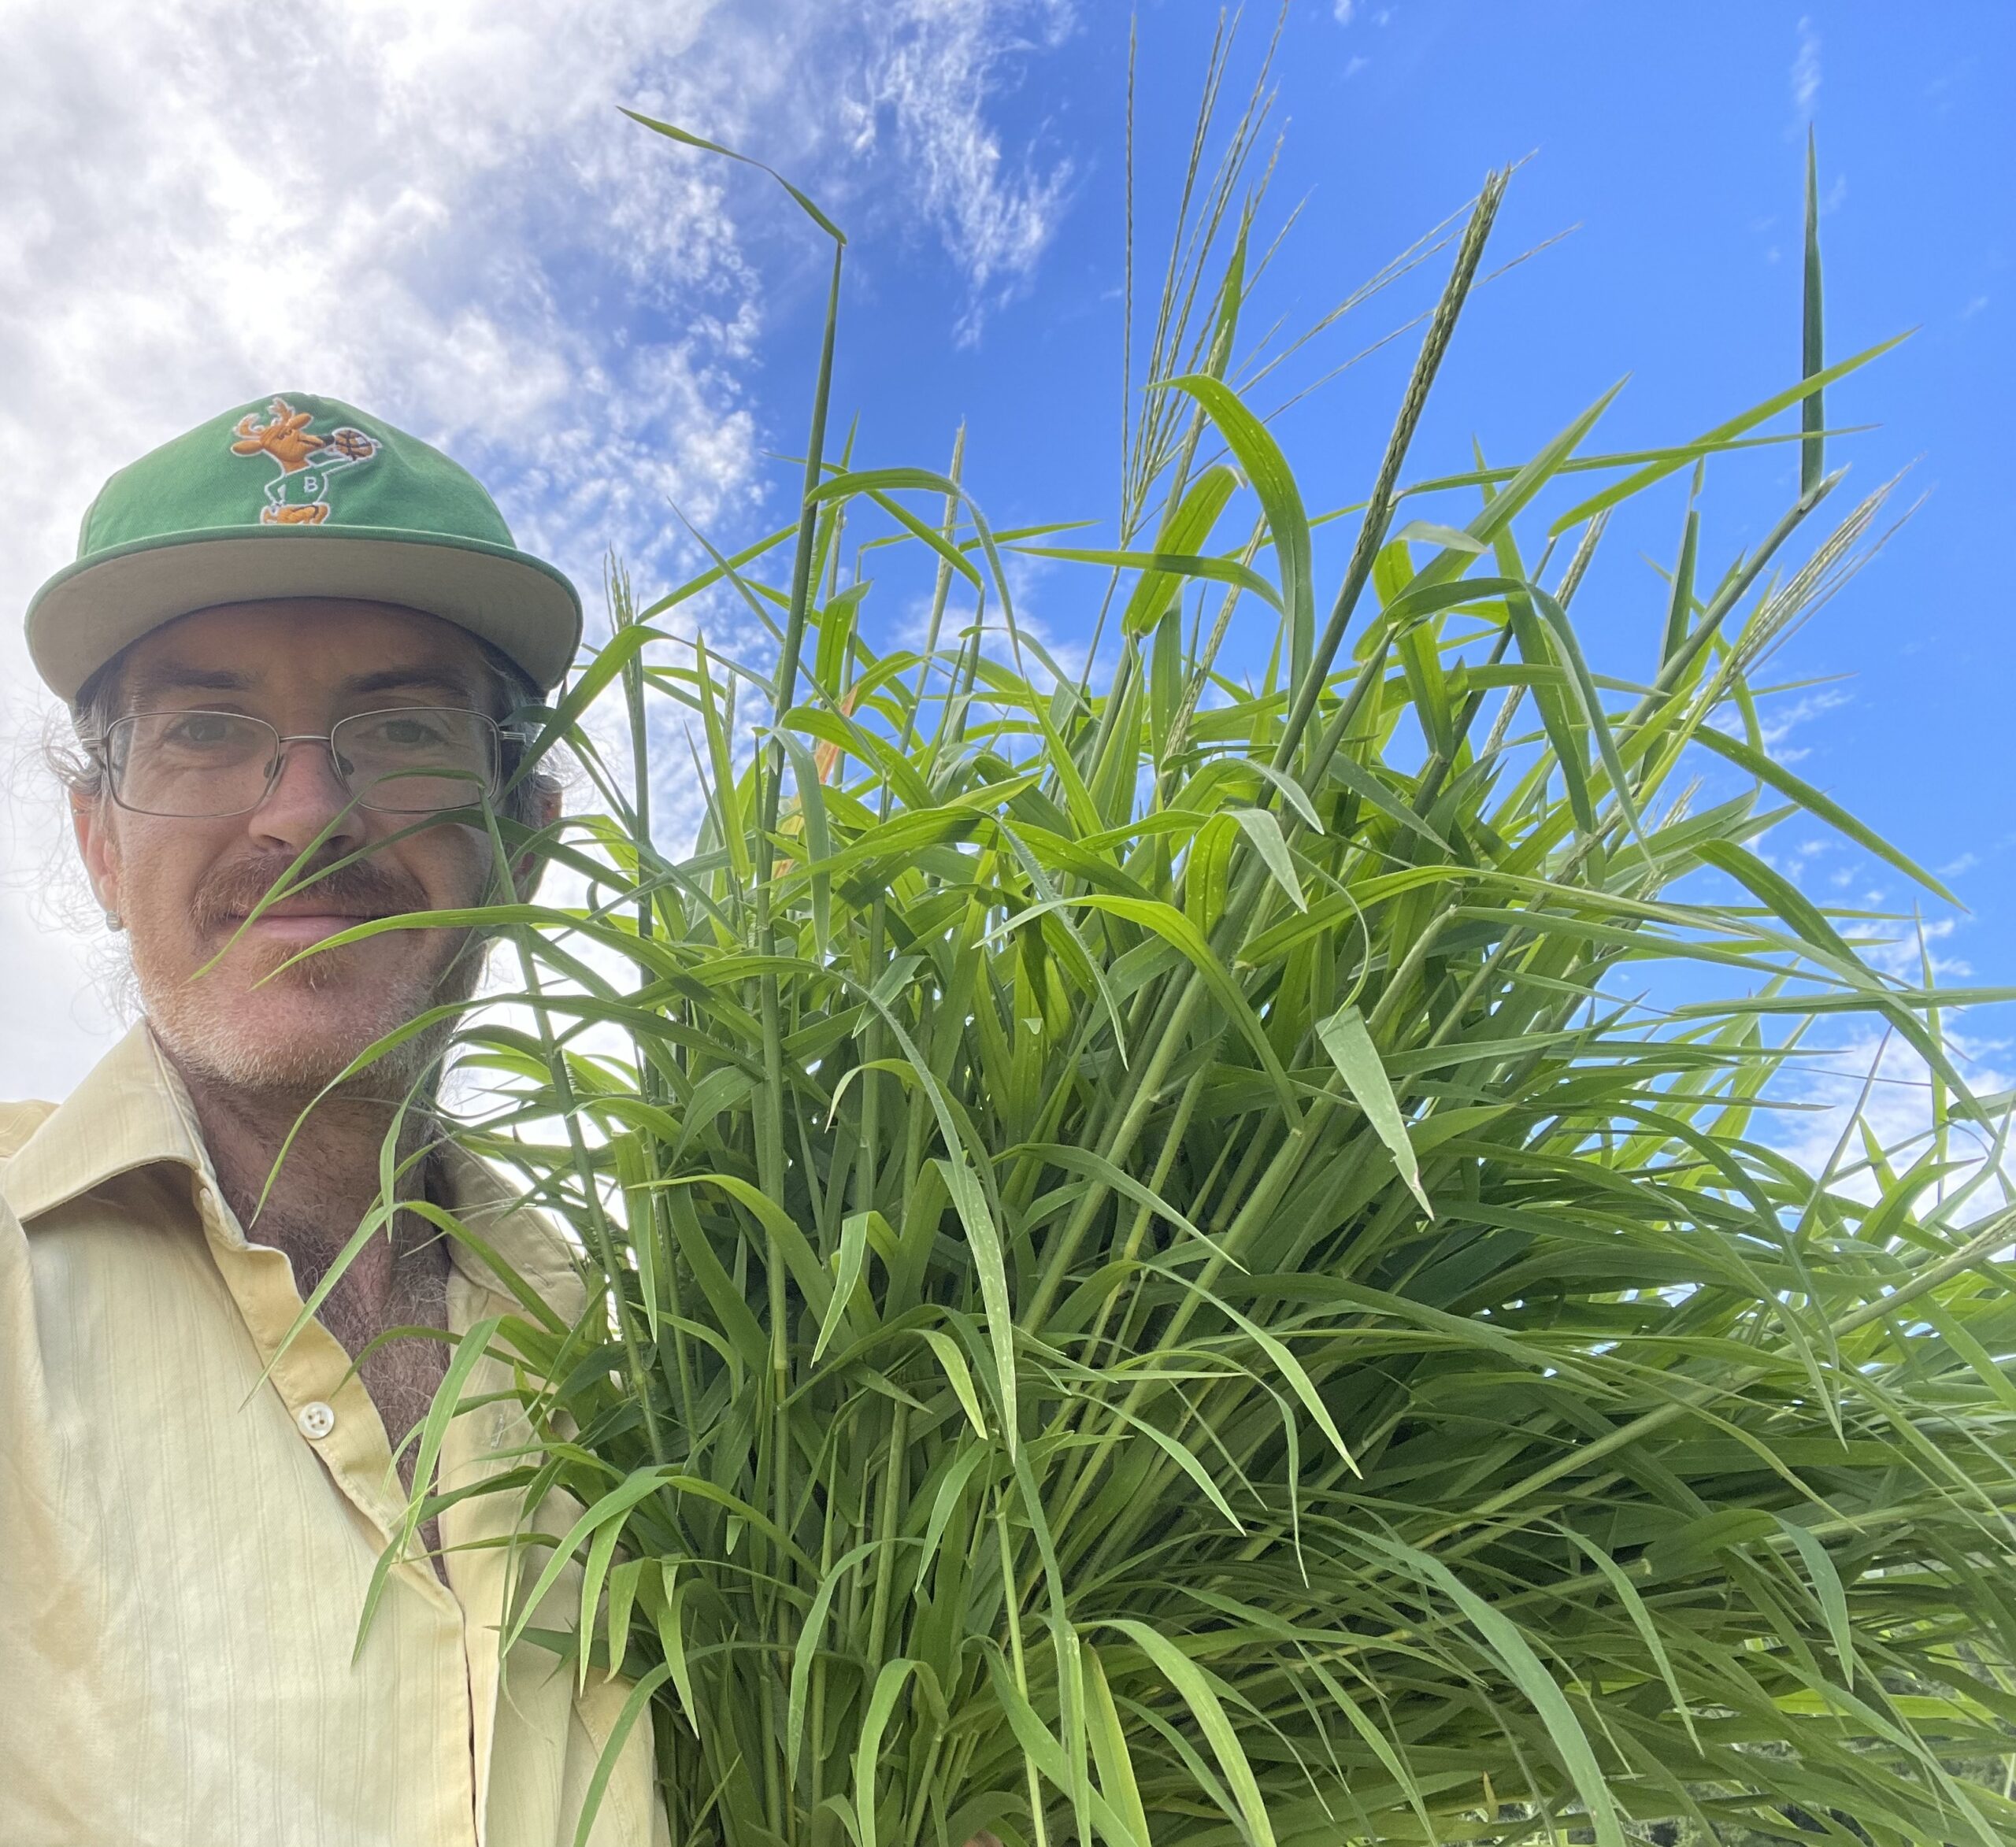
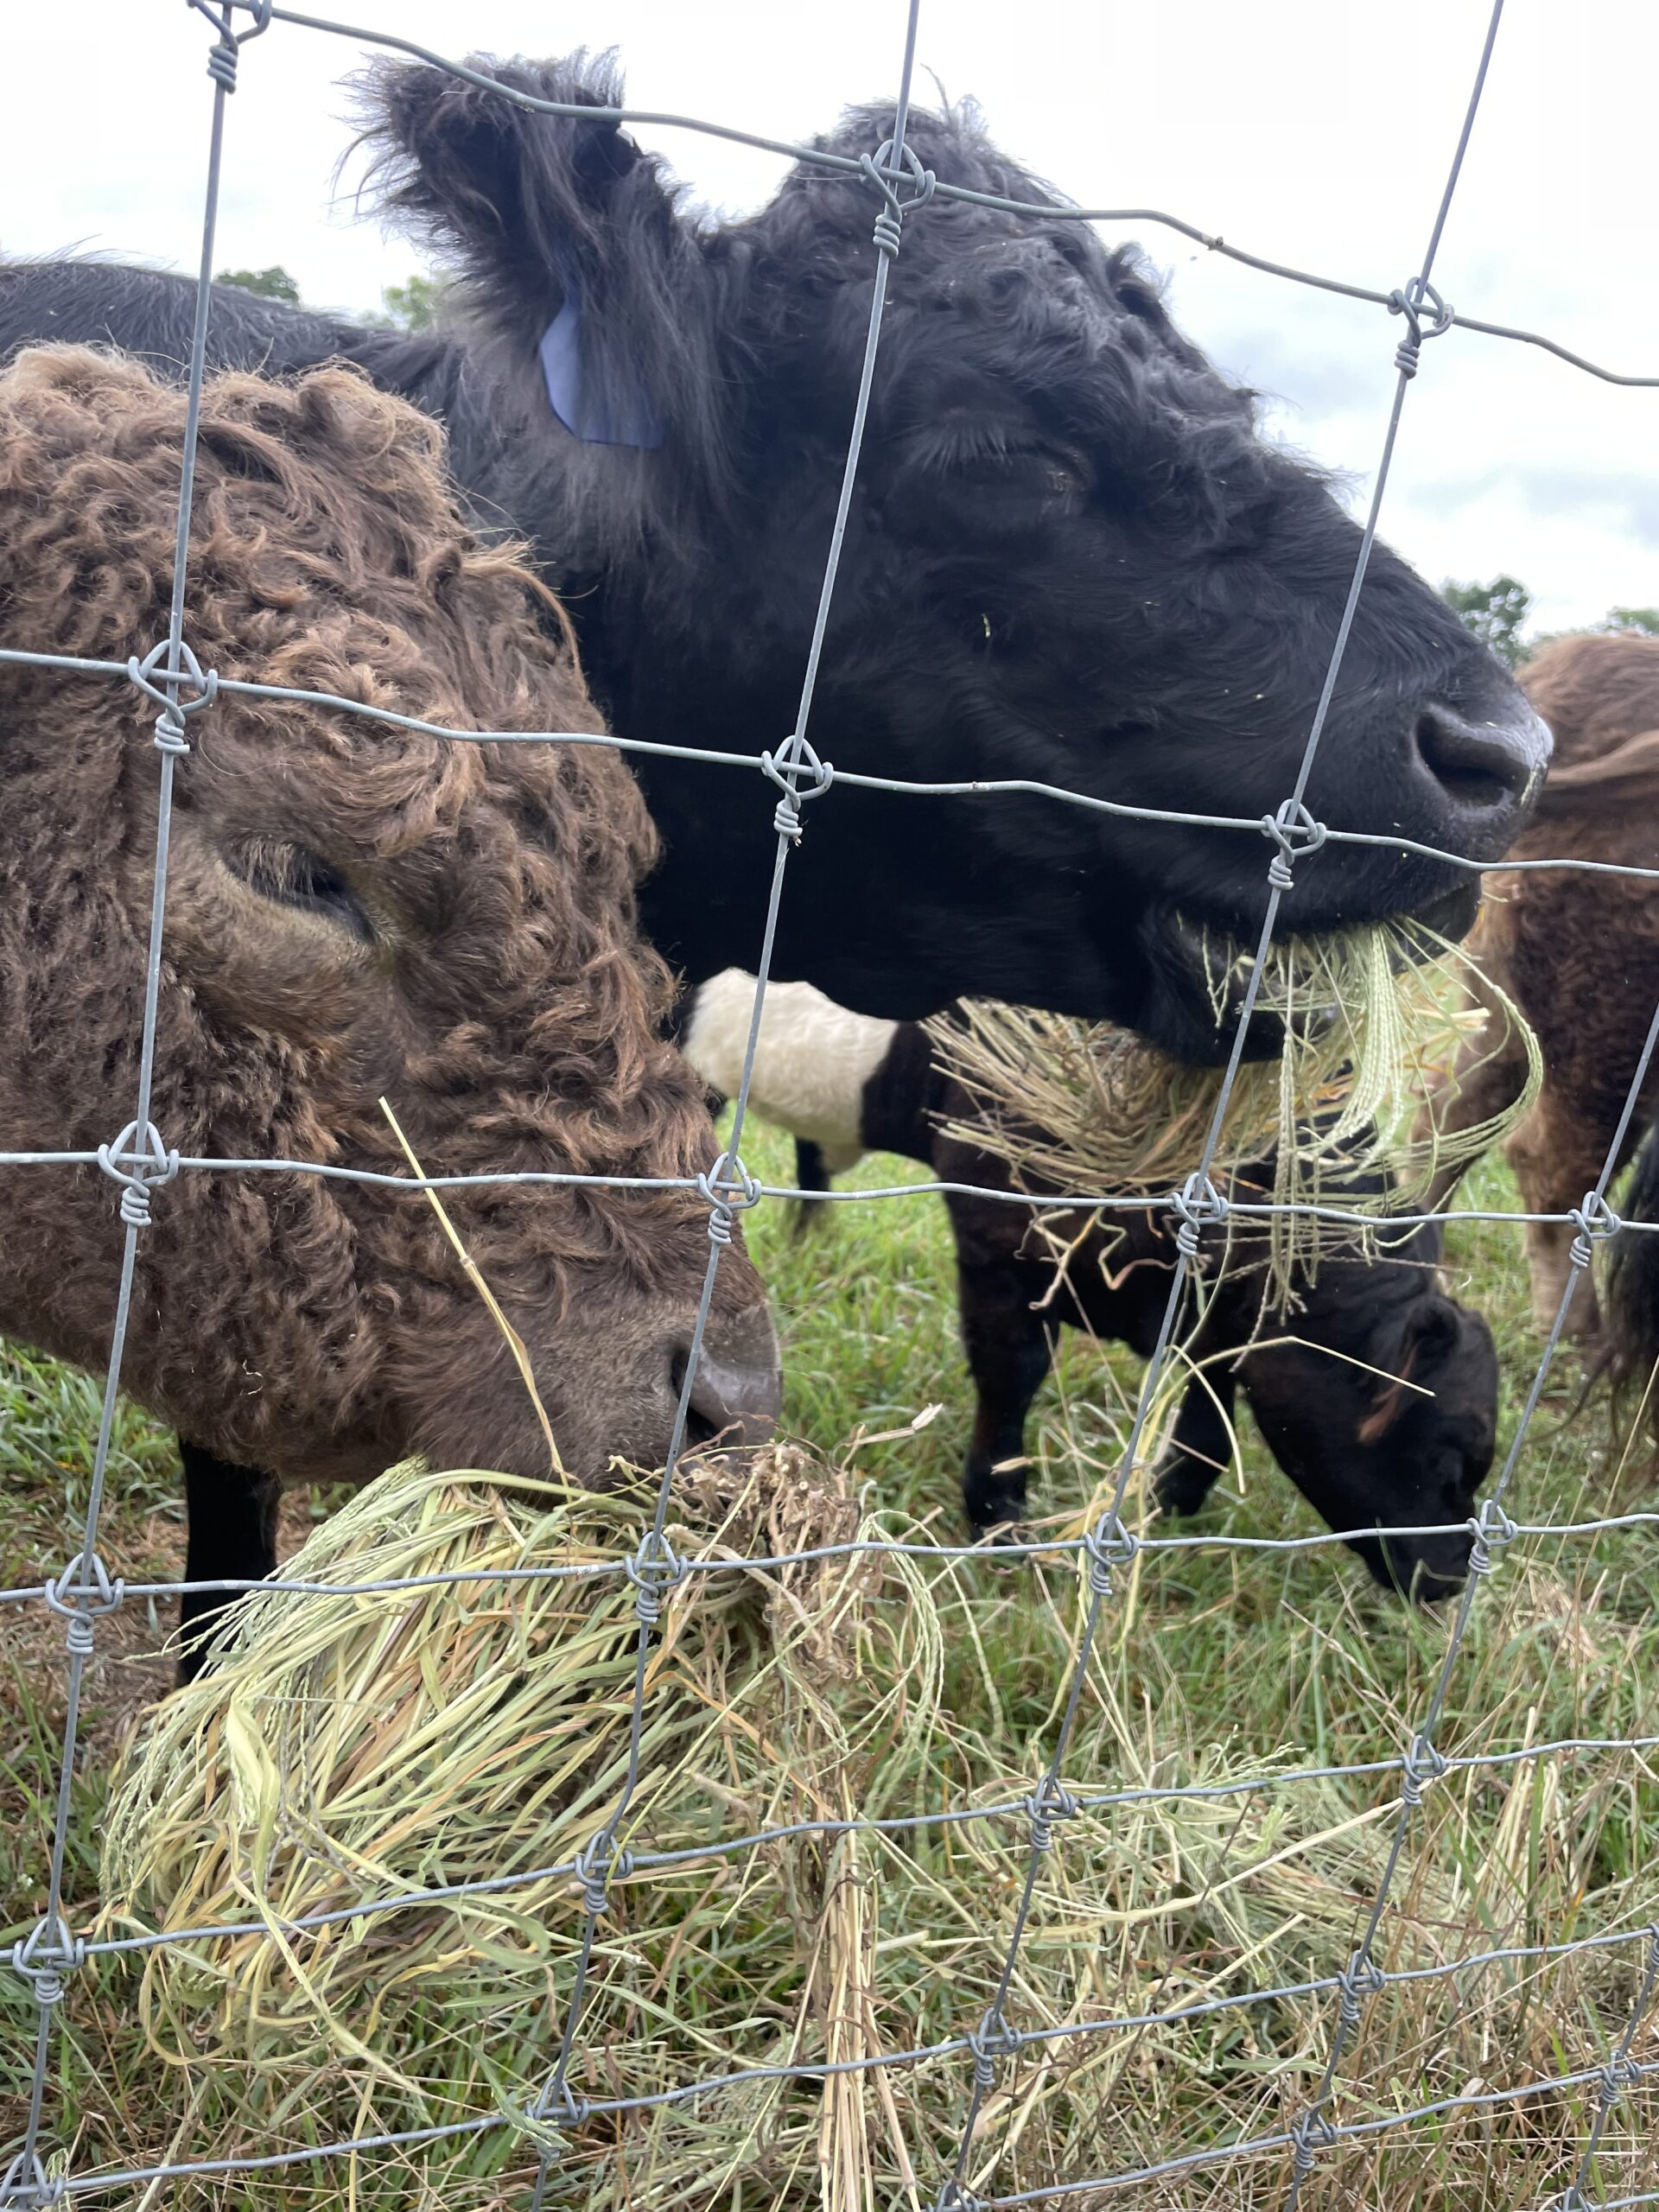
Crabgrass performed well when compared to other summer annual forages. Crabgrass grew more quickly than pearl millet and as quickly as sudangrass (Figure 27, Table 7). Similarly, crabgrass was suitable for silage production, although sudangrass produced better quality silage when chopped and packed into mini-silos (Table 8). However, the structure of crabgrass (fine stems) means that it can be harvested and fed using standard hay and haylage equipment which is not suitable for either sudangrass or pearl millet (Pictures 4 and 5).
Works Cited
Bartoń K (2024). _MuMIn: Multi-Model Inference_. R package version 1.48.4, <https://CRAN.R-project.org/package=MuMIn>.
Beck, P.A., S. Hutchinson, C.B. Stewart, J.D. Shockey, and S.A. Gunter. Effect of crabgrass (Digitaria ciliaris) hay harvest interval on forage quality and performance of growing calves fed mixed diets. Journal of Animal Science. 85(2):527-535.
Blount, A.R.S, D.M. Ball, R.K. Sprenkel, R.O. Myer, and T.D. Hewitt. 2003. Crabgrass as a forage and hay crop. IFAS Extension. University of Florida, Gainesville FL. SS-AGR-193. https://edis.ifas.ufl.edu/publication/AG195
Dalrymple, R.L., 1975. Crabgrass as a forage. CG-75. The Noble Foundation. Ardmore, OK.
Hall, M.H. 2000. Orchardgrass. Penn State Extension. University Park, PA. https://extension.psu.edu/orchardgrass
Harmon, D. 2021. Let crabgrass be your friend. Hay and Forage Grower. Fort Atkinson, WI. April/May 2021:30-31. https://hayandforage.com/article-3506-let-crabgrass-be-your-friend.html
Holm, S. (1979). "A simple sequentially rejective multiple test procedure". Scandinavian Journal of Statistics. 6 (2): 65–70. JSTOR 4615733. MR 0538597.
Hothorn T, Bretz F, Westfall P (2008). “Simultaneous Inference in General Parametric Models.” _Biometrical Journal_, *50*(3), 346-363.
Jennings, J. 2018. Crabgrass - turning a weed into a forage. Hay and Forage Grower. Fort Atkinson, WI. February 2018:6-7. https://www.hayandforage.com/article-1813-crabgrass-—-turning-a-weed-into-forage.html
Kichler, J. 2018. Crabgrass: friend or foe? UGA Cooperative Extension. https://site.extension.uga.edu/forageteam/2018/06/crabgrass-friend-or-foe/
Kim, T.J., J.C. Neal, J.M. Ditomaso, and F.S. Rossi. 2002. A survey of weed scientists' perceptions on the significance of crabgrasses (Digitaria spp.) in the United States. Weed Technology. 16(1):239-242.
KPM Analytics. (2022). SpectraStarTM XT series analyzer sample cup preparation instructions. Westborough, MA, USA. Available online: https://www.kpmanalytics.com/knowledge-center/spectrastar-tm-sample-preparation-instructions (accessed on 1 May 2024).
KPM Analytics. (2024). SpectraStar XT-R calibration library V2.0. Westborough, MA, USA. Available online: https://www.kpmanalytics.com/knowledge-center/spectrastar-xt-r-calibrations (accessed on 1 May 2024).
Kuznetsova A, Brockhoff PB, Christensen RHB (2017). “lmerTest Package: Tests in Linear Mixed Effects Models.” _Journal of Statistical Software_, *82*(13), 1-26. doi:10.18637/jss.v082.i13 <https://doi.org/10.18637/jss.v082.i13>.
Lenth R (2024). _emmeans: Estimated Marginal Means, aka Least-Squares Means_. R package version 1.10.3, <https://CRAN.R-project.org/package=emmeans>.
Mertens, D. R. (1987). Predicting intake and digestibility using mathematical models of ruminal function. Journal of Animal Science, 64, 1548–1558. https://doi.org/10.2527/jas1987.6451548x
Mir, N. H., Ahmad, S., & Bhat, S. S. (2024). Orchard grass (Dactylis glomerata L.) yield and nutritive characteristics in response to different cutting regimes in a temperate region. Range Management and Agroforestry, 45(01), 128–133. https://doi.org/10.59515/rma.2024.v45.i1.17
Moore, K. J., L. E. Moser, K.P. Vogel, S.S. Waller, B.E. Johnson, and J.F. Pedersen 1991. Describing and quantifying growth stages of perennial forage grasses. Agronomy Journal. 83:1073-1077.
Newman, Y. 2019. Forage crabgrass finds the road north. Hay and Forage Grower. Fort Atkinson, WI. November 2019:32-33. https://hayandforage.com/article-2770-forage-crabgrass-finds-the-road-north.html
Oba, M. & M. S. Allen. (1999). Evaluation of the importance of the digestibility of neutral detergent fiber from forage: effects on dry matter intake and milk yield of dairy cows. Journal of Dairy Science, 82, 589-596. https://doi.org/10.3168/jds.S0022-0302(99)75271-9
R Core Team (2024). _R: A Language and Environment for Statistical Computing_. R Foundation for Statistical Computing, Vienna, Austria. <https://www.R-project.org/>.
Robinson D, Seidel DP, Spinu V, Takahashi K, Vaughan D, Wilke C, Woo K, Yutani H (2019). “Welcome to the tidyverse.” _Journal of Open Source Software_, *4*(43), 1686. doi:10.21105/joss.01686 <https://doi.org/10.21105/joss.01686>.
Rocateli, A. and L.F. Abreu. 2020. Oklahoma crabgrass variety performance tests: 2018-2019 forage years. OSU Extension. Stillwater, OK. https://extension.okstate.edu/fact-sheets/oklahoma-crabgrass-variety-performance-tests-2018-2019-forage-years.html
Stalcup, L. 2007. Crabby returns. Beef Magazine, Irving, TX. https://www.beefmagazine.com/pasture-range/grazing-programs/crabby_returns
Teutsch, C. 2019. Warm-season annual grasses for summer forage. Virginia Cooperative Extension. Virginia Tech, Blacksburg, VA. 418-004 (SPES-88P). https://www.pubs.ext.vt.edu/418/418-004/418-004.html
Teutsch, C.D., J.H. Fike, and W.M. Rilson. 2005. Yield, digestibility, and nutritive value of crabgrass as impacted by nitrogen fertilization rate and source. Agronomy Journal. 97(6):1640-1646.
Undersander, Dan, & John E. Moore. (2002). "Relative forage quality (RFQ) indexing legumes and grasses for forage quality." Focus on Forage, 4. Available online: https://citeseerx.ist.psu.edu/document?repid=rep1&type=pdf&doi=8e8bb966d9a11746e4b98bcbae7d5b9f7abba6d1 (accessed 1 May 2024)
Weinart-Nelson, J.R., W.A. Meyer, and C.A. Willimas. 2021. Yield, nutrient composition, and horse condition in integrated crabgrass and cool-season grass rotational grazing pasture systems. Translational Animal Science. 5(4):1-18.
Wickham H, Averick M, Bryan J, Chang W, McGowan LD, François R, Grolemund G, Hayes A, Henry L, Hester J, Kuhn M, Pedersen TL, Miller E, Bache SM, Müller K, Ooms J,
Wickham H, Bryan J (2023). _readxl: Read Excel Files_. R package version 1.4.3, <https://CRAN.R-project.org/package=readxl>.
Wolfe, D.W., A.T. DeGaetano, G.M. Peck, M. Carey, L.H. Ziska, J. Lea-Cox, A.R. Kemanian, M.P. Hoffman, and D.Y. Hollinger. 2018. Unique challenges and opportunities for northeastern US crop production in a changing climate. Climatic Change 146:231–245.
- Both crabgrass species are viable summer annual forages in the Northeast US and could be used for grazing, baled hay, and wrapped haylage using widely available equipment.
- 3000 kg ha–1 of dry matter can be grown in six to seven weeks with relative forage quality over 100 and more than 15 percent protein.
- Largest high-quality yields are achieved by planting in the first half of June.
- 56 kg N ha–1 per forage harvest is sufficient for forage production.
- Digitaria Sanguinalis has moderately better forage quality than D. ciliaris, but D. ciliaris has higher (although slower) regrowth potential.
These research results show that upright forage crabgrass can be productively incorporated into Northeast cropping systems for all grazing animals, including cattle, horses, sheep, and goats. Crabgrass holds great promise as a heat and drought tolerant forage crop under climate change conditions and is thus likely to become even more valuable with increased summer droughts. While other short-season annual forages are available, forage crabgrass is more suitable for typical haying equipment than grasses like pearl millet or sudangrass. Since crabgrass production does not require new equipment, it may be a more economically viable hay crop for many animal operations. However, the quality of crabgrass for making haylage is not superior compared to some other summer forage species, such as forage sorghum and sudangrass, which may have more sugar content.
Education & outreach activities and participation summary
Participation summary:
Project outreach occurred during the course of of this research project. On-farm field days, conference presentations, and hands-on workshops were used to facilitate discussion between farmers, researchers, and agricultural service providers and communicate the experimental results.
During the 2022 and 2023 growing seasons, outreach focused on building interest in crabgrass as a summer annual forage. We also began communicating preliminary results after the 2022 season. These activities were performed in two ways.
1) Conversation with farmers and extension agents at the research farm during annual field days - The experimental rationale and potential outcomes were presented and qualitative differences between treatments was discussed. In 2023, we also presented preliminary data from the 2022 season during the field day.
2) Photo documentation of experimental activities and plant growth - This was used for the production of academic posters and for use in workshops presentations. Visual documentation is the ideal partner for accumulated data and these videos allowed for effective communication of our results, especially as permanent online resources.
After the completion of field work in August 2023, outreach activities shifted from building interest and discussion to the communication of results. This was done through conference and workshop presentations - Research results were presented at the 2023 ASA-CSSA-SSSA Annual Conference, the 2023 Certified Crop Advisors annual meeting, and a full day Managing Forage Crops workshop for farmers at UMass.
Finally, the results of this research are being prepared for publication in peer-reviewed scientific literature, but have not been published at the time of this report.
Overall, these outreach activities built interest at a regional level and allow us to share the results of these experiments, as well as economic analysis and management recommendations, with the large and diverse agricultural community of farmers, researchers, and agricultural service providers.
2022 education and outreach activities
In the spring of 2022, we published an extension article describing the goals of this research which was distributed to our newsletter listserv.
In September, a poster describing the yield differences seen in experiment 1 (planting date) was presented at the CAFE Summer Scholars undergraduate research forum.
On August 2nd, a research farm field day was held, and the crabgrass research plots were shown to farmer and ag service provider attendees.
On August 17th, a demonstration at the Hadley Horse farm of the University of Massachusetts was shown to a working group meeting of regional extension educators focused on horse pasture.
2023 education and outreach activities
In the winter of 2023, the first year of results were presented at the Certified Crop Advisers annual meeting in Portsmouth NH (January 25th) and at a full day Managing forage Crops Workshop at UMass Amherst (February 21st).
On August 16th, a research farm Field Day was held and the crabgrass research plots were shown to farmer and ag service provider attendees.
Research results were also presented at an undergraduate research symposium on September 11th and at the Agronomy, Crop Science, and Soil Science Societies annual meeting on November 1st.
Project Outcomes
This project promotes agricultural sustainability by providing agronomic information about a new crop for the Northeast US and adds to the limited knowledge of forage crabgrass generally. This crop holds great potential as a heat and drought tolerant forage crop under climate change conditions, and the information gathered in this research will help farmers and agricultural service providers to understand and use crabgrass effectively.
This research project allowed me (Arthur Siller) to grow as a researcher and build skills in research methods, team leadership, and educational communication. By managing a complex project from start to finish I was able to see how each part of the process affected others and gain a better holistic understanding of the agricultural research process. I am continuing to work in extension research and education and my experience on this grant will continue to inform my career as an extension agent at UMass.
There is a need for on-farm demonstrations of forage crabgrass as well as additional research on palatability and preference to different livestock species and animal performance using crabgrass pasture, hay, and haylage.