Progress report for GNE22-303
Project Information
I conducted a small pilot study in 2022 and a larger-scale, comprehensive field study that began in 2023. Here are the objectives for the larger field study:
- Determine how landscape variables—such as the percent of forest, corn, soybean, orchard, etc. in a 3-km radius, edge density, and landscape evenness—predict abundances of two stink bug species—the invasive brown marmorated stink bug (BMSB) and the native beneficial spined soldier bug (SSB)—on New Jersey peach orchards.
- Determine how landscape variables—such as the percent of forest, corn, soybean, orchard, etc. in a 3-km radius, edge density, and landscape evenness—predict egg mortality of stink bug eggs due to parasitoid wasps and arthropod predators.
- Determine which stink bug host has a higher species richness of associated parasitoid wasps by morphological identifying and barcoding successfully hatched out wasps and unsuccessfully parasitized eggs. Determine rates of parasitism by wasps in the genus Anastatus, family Scelionidae, and the specific non-native species Trissolcus japonicus.
- Monitor spread and establishment of Trissolcus japonicus, a non-native parasitoid wasp that has co-evolved with BMSB in their native range of Asia, on NJ peach orchards via deployment of BMSB and SSB eggs.
Landscape agricultural ecology, or the study of how landscapes surrounding farms influence abundances, diversity, and impact of arthropod pests and natural enemies, has emerged as its own subfield since the turn of the century. Many studies have measured greater control of agricultural pests by natural enemies in structurally complex landscapes, which are often defined as landscapes with a high proportion of natural or semi-natural land or by the diversity of different landscape types in a certain surrounding radius. Mechanistically, natural land may be preferred for natural enemies because of availability of nectar, alternative prey/hosts, and overwintering habitat, and the absence of insecticide sprays and other management. What follows is a the idea that conservation of natural land surrounding agriculturally managed land is a win-win for both agricultural producers and conservations (Karp et al., 2018).
To study the effects of natural enemies in a measurable way, studies have deployed sentinel eggs or prey in similar crop blocks surrounded by different landscapes and compared parasitism and predation across blocks. For example, in a study on 26 soybean farm sites in the Midwest, soybean aphid counts were monitored on plants in natural enemy exclusion cages and on unexcluded plants to measure the effect of parasitoids and predators on aphid population growth. In this study, greater landscape diversity predicted greater population control by natural enemies of soybean, and presence of lady beetle predators was correlated with the proportion of forest and grassland in the surrounding landscape (Gardiner et al., 2009). Greater proportion of natural lands in surrounding landscapes also predicted greater parasitism and hyper-parasitism rates of aphids in a study in 18 winter wheat fields in Germany surrounded by different landscapes (Gagic et al., 2011). Similarly, in six Michigan corn fields, parasitism rates of armyworm larvae were higher (13.1% vs. 2.4%) in complex landscapes characterized by smaller crop blocks and higher proportions of hedgerows and wooded habitat (Marino & Landis, 1996).
In addition to pest control by natural enemies, studies have investigated natural enemy abundances and diversity in response to landscape variables. Interestingly, enemy abundance and diversity are not necessarily correlated to pest control services. In the winter wheat field study, aphid-parasitoid food webs were less complex—measured by food web metrics, like mean number of associated host or parasitoid species for all species—in complex landscapes despite greater total parasitism in these systems. This was due to one particular parasitoid species dominating in complex landscapes (Gagic et al., 2011). In the Michigan study, the assemblage of parasitoid species associated with armyworm were similar (4 in simple and 5 in complex landscapes), and again, one parasitoid dominated in complex landscapes (Marino & Landis, 1996).
Clearly, greater landscape diversity and complexity can increase top-down ecological pressure by natural enemies on pests in some systems. However, this phenomenon is not entirely generalizable. In a quantitative synthesis of 46 landscape-level studies, both natural enemies and pests showed a positive response to landscape complexity, as measured by percent natural land in the surrounding landscape. The strength of this response was larger for natural enemies than pests, as natural enemy diversity, abundance, and predation/parasitism performance were all positively correlated with landscape complexity, while for pests, diversity increased, abundance decreased, and crop damage had no significant response with landscape complexity. Furthermore, generalist natural enemies responded to landscape complexity to a greater extent at larger spatial scales than specialists (Chaplin-Kramer et al., 2011). A more recent and comprehensive meta-analysis incorporating data from 143 studies around the world found no consistent trend of the effect of the proportion of natural nor agricultural land in the surrounding landscape on pest or enemy abundance, enemy activity (as measured by sentinel eggs or prey), crop damage, and crop yields (Karp et al., 2018). This study concluded that future landscape agricultural ecology studies should take temporal dynamics into account, include more measures of landscape diversity than just percent natural land, and include measures of local-farm management into models (Karp et al., 2018).
In this study, I investigate how landscape composition and configuration variables predict abundances of adult and nymphal Halyomorpha halys and Podisus maculiventris, egg mortality of H. halys and P. maculiventris sentinel egg masses, and diversity of the egg-parasitoid assemblages associated with each host species. H. halys is an invasive, generalist pest that feeds on over 150 different plants, including cultivated crops: peach, apple, peppers, tomatoes, grapes, corn, soybean, and hazelnut (Leskey & Nielsen, 2018). It is a particularly damaging pest for Mid-Atlantic tree fruit. For instance, during the first major outbreak in 2010, some peach growers saw >90% losses of their crop. Conversely, P. maculiventris is a native, generalist predatory that feeds on over 90 insects, including major pests, like corn earworm and H. halys at the nymphal stage (Marston et al., 1978). Both species are generalists, which poses a unique uncertainty in predicting which landscape variables these insects’ abundances will correlate with, as they both can find food in many habitats.
There are two published studies that have investigated the effect of landscape on H. halys abundance and damages, and none that have examined landscape effects and P. maculiventris. One study of 30 Mid-Atlantic tomato fields concluded that forest edges and number of forest patches correlate positively with H. halys damage, although this study was restricted to 250-m radius around blocks (Rice et al., 2017). Furthermore, an Italian study recorded abundances of H. halys adults and nymphs in pheromone-baited traps on 113 fruit orchards. No effect of landscape on the abundance of adult H. halys was detected, but there was a significant positive effect of percent semi-natural and percent vineyard habitats at a 3 km scale on abundances of nymphs (Tamburini et al., 2023). No studies have looked at landscape composition and configuration effects on sentinel egg mortality of either stink bug despite the high number of sentinel egg mass studies in this system. I predict that landscape variables will impact parasitism greatly, as closely parasitoids that are closely related with pentatomids show strong habitat associations. For example, Telenomus podisi (Hymenoptera: Scelionidae) is a major parasitoid of P. maculiventris and is highly associated with field/vegetable crop habitats, while parasitoids in the genus Trissolcus often parasitize both stink bugs and are associated with forested habitats (Abram et al., 2017).
An egg parasitoid of particular interest in this study is Trissolcus japonicus (Hymenoptera: Scelionidae). T. japonicus is a non-native parasitoid that is closely associated with H. halys in their shared native range in east Asia (Yang et al., 2009). It was first detected in the US in 2015 and has since colonized much of the invaded range of H. halys in North America and Europe (Talamas et al., 2015). Generally, T. japonicus persists in the Mid-Atlantic at low abundances and parasitizes low numbers of H. halys sentinel eggs, so detections of this parasitoid and insights into its landscape ecology is of particular concern (Bergh et al., 2023; Herlihy et al., 2016; Kaser et al., 2018). Furthermore, instances of T. japonicus parasitism of the native beneficial P. maculiventris was of particular interest in this study, as a field study in the Pacific Northwest detected high rates of both successful (24.0%) and unsuccessful parasitism (37.6%) of this host by T. japonicus (Hepler et al., 2020).
In this study, both successful parasitism—when a parasitoid wasp oviposits in a host egg and, ultimately, an adult parasitoid successfully hatches—and unsuccessful parasitism—when a developing stink bug dies after a parasitoid oviposits into the egg but no adult parasitoid hatches out—was monitored through the sentinel egg masses. Nonreproductive parasitism is historically understudied because it is difficult to detect, but studies have shown that it happens often in Pentatomid-parasitoid relationships, especially when the species are not co-evolved (Abram et al., 2014, 2016, 2017; Haye et al., 2015). The development of molecular tools has made it possible to detect unsuccessful parasitism by the most common egg-parasitoids associated with Pentatomids in the family Scelionidae and genus Anastatus (Gariepy et al., 2019; Hepler et al., 2020; Stahl et al., 2019). This study system is unique, as there are both native and non-native players at both trophic level readily in the environment.
Cooperators
- (Researcher)
- (Researcher)
Research
2022 Pilot Field Study
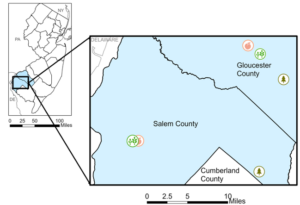
I collected data over two weeks in August 2022 from two peach, two soybean, and two forested habitats in southern New Jersey (Fig 1). There, I trapped for three stink bugs, Halyomorpha halys, Podisus maculiventris, and Euschistus servus, a native pest, using pheromone-baited traps. I also deployed colony-laid egg masses of these three stink bugs. I collected these egg masses after 3 days in the field.
Figure 1. Map of study sites for 2022 field study.
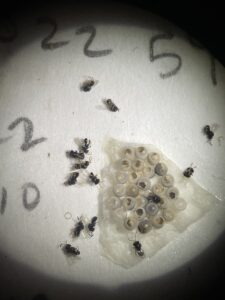
Egg masses were then placed in tight-fitting petri dishes and placed in 25°C incubators. Stink bug nymphs and parasitoids emerged and died in the dishes, and after 6 weeks, the petri dishes were frozen at -20 for later egg dissection and egg fate determination (Figure 2).
Figure 2. Trissolcus japonicus wasps that have hatched from a BMSB egg mass.
Egg fates included stink bug nymph emergence, parasitoid emergence, predation (chewing or sucking), unemerged parasitiod, unemerged nymph, and unemerged unknown. These fates were further classified into egg mortality due to natural enemies (parasitized/predated) and other. I compared egg fate by habitat and species using binomial GLMMs.
2023-current Landscape Study
Farm selection and study dates
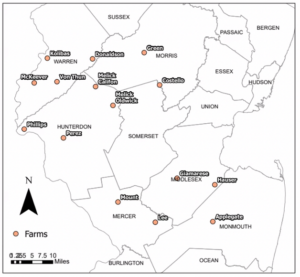
Field data was collected from June 11-August 25, 2023 in peach orchard blocks on 15 operational farms in central and northern New Jersey (Figure 3). The closest two sites are ~9 km apart, and the furthest two are ~90 km apart. Peach blocks were between 0.6-3.2 hectares and had at least one wooded or residential edge. Sites were blocked into three groups of five that were sampled on the same schedule. Two groups of farms were visited each week, so data from each farm was recorded on 7 out of 11 experimental weeks. Growers from 13 out of 15 farms activity participated in the Rutgers Fruit Integrated Pest Management Program—which provides management suggestions based on trap count and fruit injury data—in 2023, and the other two farms had previously participated in the program. It follows that the farms follow similar management practices.
Figure 3. Map of farm sites in New Jersey.
Stink bug abundance data
The abundances of H. halys and P. maculiventris were surveyed with four different methods: pheromone-baited traps, visual sampling, beat sheets, and sweep nets. Pheromone traps were deployed as 1.3m wooden stakes with a clear sticky trap panel (Peelable Pherocon BMSB STKY trap, Trece Inc) attached at the top with a large binder clip. Traps were bated with pheromone lures. H. halys pheromone lures were purchased from Tréce Inc. and contain a two-component aggregation pheromone produced by H. halys males plus the pheromone of a different stink bug, Plautia stali. These chemicals synergistically attract adults and nymphal H. halys (Weber et al., 2014). P. maculiventris pheromones were prepared using semiochemicals following methods of Kelly et al., 2014. These pheromones attract adult P. maculiventris. H. halys lures were not replaced over the course of the experiment as per manufacturer recommendations, while P. maculiventris lures were replaced every 2 weeks. Traps were placed approximately 50 meters apart from each other on a wooded, meadow, or suburban edge peach orchard blocks. Traps were checked every 3-11 days, but trap count numbers were standardized as individuals per 3-day interval for analysis. Traps were checked 13-15 times at each farm over the season.
Visual, beat sheet, and sweep net sampling for adult and nymphal stink bugs occurred on each farm 7 times. On each sampling event, three twenty-sweep samples were taken with sweep nets in the grassy margins between peach rows. Additionally, ten pairs of trees—five edge and five internal pairs—were sampled visually and with a beat sheet. One tree in each pair was visually surveyed for 30 seconds and one tree received 3 canopy beats with a foam bat where bugs would fall from the canopy into a 0.7 x 0.7 canvas beat sheet.
Egg mass preparation and deployment
Colonies of H. halys and P. maculiventris were maintained at Rutgers University Cook Campus in New Brunswick, New Jersey. The H. halys colony originated from egg masses and adults purchased from the New Jersey Department of Agriculture Phillip Alampi Beneficial Insect Rearing Laboratory. The P. maculiventris colony was a mixture of egg masses and adult insects provided by two USDA-ARS centers, the Beltsville Agricultural Research Center in Maryland and the Beneficial Insects Introduction Research Unit in Delaware. Insects were maintained in W60 x D60 x H60 cm ‘BugDorms’ (BioQuip) at ~25dC, 60-80% RH, and 16:8 L:D. The H. halys colony was reared following modified methods from Abrams et al., 2021. Bugs were provided with cowpea and sunflower plants, water wicks, organic carrots, sweet corn, pumpkin seeds and sesame seeds, and drawer liner and paper towels as oviposition substrates. The P. maculiventris were provided cowpea and sunflower plants, the same oviposition substrates, and wax worm and mealworm pupae.
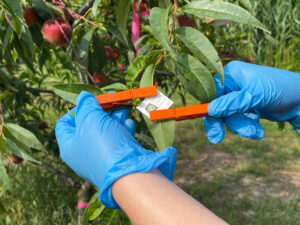
Fresh (<24 hr old) egg masses from each host were collected from colony tents with a dime-size area of the oviposition substrate and attached with double-sided tape to 3.5 x 3.5 cm cardstock paper. Egg masses were photographed. In the field, they were attached to the underside of peach tree leaves with clothespins to a tree at the edge of the peach block (Figure4). Bordering habitats included apple blocks (8 farms), woods (6 farms), suburban (6 farms), mixed annual (4 farms), and corn (3 farms). Egg masses were collected after 3 days and placed in a sterile tight-fitting petri dish. Stink bug nymphs and parasitoids were reared out for 6 weeks after deployment in the same conditions as the colonies before being frozen at -20ºC. Egg masses were deployed on each farm during 7 of the 11 weeks. Number of egg masses deployed per farm per week depended on colony outputs and was between 1-5 H. halys egg masses and 1-7 Podisus maculiventris egg masses. There were totals of 14-15 H. halys egg masses deployed per farm and 19-21 P. maculiventris egg masses deployed per farm per week for a total of 211 H. halys and 293 P. maculiventris egg masses.
Figure 4. Deploying an egg mass in the field.
Egg fate assessments and molecular analyses
Egg masses were dissected under a microscope using sterilized dissecting needles and tweezers. The fate of each egg will be classified as H. halys hatch, parasitoid hatch, predated, and unknown. Predation will be recognized following Morrison et al., 2016. Emerged parasitoids were moved to individual wells of PCR plates filled with 20 μl of molecular grade ethanol with sterilized paint brushes. They will be sent to a specialist on taxonomy and systematics of Platygastroidae, for identification. Unemerged eggs, like parasitoids, will be moved to individual wells of PCR plates with 20 μl of molecular grade ethanol. An egg parasitized with T. japonicus will be included in each 96-well plate as a positive control, along with an empty well as a negative control. All samples will be stored at -20ºC between handling.
To identify unsuccessful parasitism, the unemerged eggs will be molecularly analyzed. We will follow a modified protocol from Gariepy et al., 2014. To extract DNA from eggs, each egg will be macerated in 2 μl of Proteinase K (20 mg/ ml) and 100 μl of 5% Chelex 100 Molecular Grade Resin (Bio‐Rad Laboratories) using a sterilized micropestle. Plates will be incubated overnight at 55°C followed by 10 min at 99°C. Then, plates will be centrifuged at 5800 g for 5 min to pellet the Chelex solution. 50 μl of supernatant will be transferred to wells in a new plate and the samples will be stored at -20°C until further analysis.
We will perform a multiplex polymerase chain reaction (PCR) with Scelionid- and Anastatus-specific forward primers (Scel-F1 and Ana-361F) that are both paired with the reverse primer HCO2198 of the universal COI primer set (Folmer et al., 1994; Gariepy et al., 2014; Stahl et al., 2019). Twenty-five μl reaction volumes will include 2 μl of DNA, 0.125 μl Platinum Taq DNA Polymerase (Thermo-Fischer Scientific), 2.5 µl 10X Buffer, 1.25 µl 50mM MgCl2, 0.5 μl of 10uM HCO-2198 and 0.25 μl each of 10uM Scel-F1 and 10uM Ana-361F. Thermal cycling conditions are as follows: 40s of initial denaturation at 94dC followed by 35 cycles of 40s of denaturing at 94ºC, 40 s of annealing at 51ºC, and 1 minute of elongation at 72ºC, and a final elongation for 5 minutes at 72ºC.
We will use an automated capillary electrophoresis machine (Qiagen Qiaxcel Advanced) to visualize PCR product to score positives for Scelionid and Anastatus parasitism. Dr. Gariepy has confirmed that the reaction runs smoothly with 2 plates of my H. halys samples. For samples positive for Scelionid DNA, we will run another PCR with similar conditions but with T. japonicus species-specific primers (Hepler et al., 2020).
Landscape classification
Non-agricultural or pastoral land surrounding each of the 15 study sites was classified by referencing the publicly available Land Use/ Land Cover of New Jersey 2020 polygon dataset published by the NJ Department of Environmental Protection in ArcGIS Pro (NJ Dept. of Environmental Protection Bureau of GIS; ESRI). The 66 NJDEP specific land-use and land cover classifications were converted into 5 classifications to better suit this project: 1) agricultural (crops, orchards, nurseries, pasture/hay), 2) natural land (forests, shrublands, and wooded wetlands), 3) mowed grass dominant (parks, cemeteries, low-density suburban, etc.), 4) highly developed (high-density suburban, urban, facility sites), 5) barren/water (Table 1). Proportion of land in these categories surrounding the study sites at 1km and 3 km radii can be viewed in Table 2. Land classified as agricultural will be removed from the polygon layer, and the resulting polygon layer will be joined with a layer detailed below.
Agricultural and pastoral land in 3 km radii of the 15 farm sites was ground-truthed to ensure classification of agricultural land was to-date and fine-scale. This is an area of about 142 km2. From August 10- September 31, 2023, all agricultural and pastoral land in a 3 km radius of the 15 farm sites was classified on foot, when possible, to the following categories: 1) orchards, 2) small fruit (brambles, grape, strawberry), 3) corn, 4) soybean, 6) other annual crops, 6) pasture, and 7) hay. Data was compiled in a point vector file in Google Earth that was imported into ArcGIS Pro. Additionally, high resolution (0.597 m/pixel) satellite imagery was obtained from NearMap to inform classification. The 2,000+ point layer will be converted to a polygon layer and then joined with the non-agricultural land use/ land cover NJDEP layer. The new layer will have 1 land use/ land cover categories. The percentage of land in each category surrounding the 15 farms to certain radii (0.5-3.0 by 0.5 increments) will be calculated. Land use/ land cover categories may be altered if they are represented in fewer than 5 farms.
Statistical analyses
To address research question 1, a binomial GLMM will be utilized in RStudio to model two response variables based on egg mass fates: number of eggs killed by natural enemies (eggs successfully parasitized + eggs unsuccessfully parasitized + eggs predated) and number of eggs not killed by natural enemies. The model will include species as a fixed effect and month and farm as random effects. I will also consider including month and the interaction of month and species as fixed effects and compare models by AIC. The emmeans and plogis R functions will yield probabilities with 95% confidence intervals that an egg from each host will experience mortality due to natural enemies as predicted by the best-fit model. A Tukey test will test if these probabilities are significantly different.
To address research question 2, models with the same fixed and random effects as outlined above will predict the response variables number of eggs parasitized (successfully or unsuccessfully) by T. japonicus and number of eggs not. The same post-hoc analyses will be conducted. For research question 3, I will report the total number of parasitoid species that successfully emerged from both host species. I will also compare the parasitoid complex species richness at each farm between host species with a paired t-test or Wilcoxon depending on the distribution of the data.
To address research questions about landscape ecology, I will first perform a principal component analysis to condense the twelve land use/ land cover variables into 1-3 uncorrelated variables (Gardiner et al., 2009; Tamburini et al., 2023). I will model H. halys and P. maculiventris data separately. For research question 4, I will model four response variables with negative binomial GLMMs: H. halys trap captures, P. maculiventris trap captures, summed H. halys counts from active traps (beats, visual, and sweep nets), and summed P. maculiventris counts from active traps. For research questions 5 and 6, I will use binomial GLMMs to predict the same response variables as for research question 1 and 2, respectively. The best-fit model for each of the models described will be determined by AICc. Possible fixed effects for all models include: each principal component, Simpson’s diversity applied to land use/ land cover categories, month, and interactions of month and landscape variables. I will include farm as a random effect. Models will be selected for each spatial scale and compared with AICc to determine which landscape variables best predict the response variables and at what scale.
2022 Pilot filed study
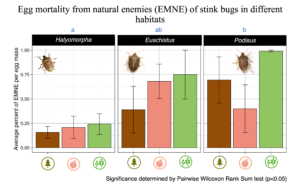
Egg mortality due to parasitoids and predators was highest in soybean for all three species of stink bug (Fig 2). Parasitism and predation was highest for SSB and lowest for BMSB, which is unfortunate given the role that these two insects play in agricultural production. However, it must be noted that the sample size for the egg masses of each host species in each habitat was quite small (3-6), as this was a pilot study.
Fig 2. Percent of egg masses with egg mortality due to parasitism or egg predation across species and habitats. =
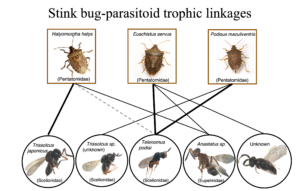
Fig 3. Parasitoid species associated with eggs of the three different stink bugs. Thickness of line shows strength of association. Dotted line indicates that only non-successful parasitism was observed with a particular parasitoid-stink bug pairing.
2023-2024 Landscape Study
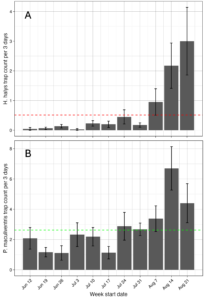
The average trap count of H. halys adults and nymphs per 3-day trapping interval was 0.5 bugs/trap. This was greatest toward the end of the season. For P. maculiventris, the average trap capture was 2.6 adult bugs/trap/3-day trapping interval. The greatest numbers were at the end fo the season (Figure 6).
Figure 6. Average trap counts of stink bugs over NJ farm sites.
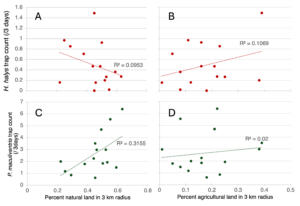
Preliminary linear regressions of percent natural land (all forests, meadows, and wetlands) and agricultural land (all cropland, vineyards, orchards, nurseries, and pasture/hay) in 3 km radii predicting trap counts of H. halys adults and nymphs illustrate a negative correlation between percent natural land and a positive correlation between percent agricultural land with H. halys (Figure 6A, B). P. maculiventris trap count is positively correlated with percent natural land and percent agricultural land (Figure 3C, D). However, the R2 values are low. The strongest correlation is between natural land and P. maculiventris.
Figure 7. Linear regressions of how percent natural land (A, C) and percent agricultural land (B, D) in 3 km radii predicts average trap count of H. halys adults (A, B) and nymphs and P. maculiventris adults (C, D) over 3 days.
Education & outreach activities and participation summary
Participation summary:
Results from my 2022 pilot study was shared with research scientists at the Entomological Society of American Eastern Branch conference in March 2023. My talk was titled ‘Trophic interactions of native and invasive stink bug and their parasitoids depend on habitat context.’ Additionally, I shared these results and my 2023 fieldwork plans at an Ecology & Evolution Graduate Program student seminar in April 2023.
I plan to share eventual results of the 2023 with growers electronically as a blog post on Rutgers Plant & Pest Advisory Bulletin. Additionally, results of this project will be published in a peer-reviewed research article that I aim to submit fall 2024.
I have planned an outreach project, as well. I am in the early stages of designing an educational poster and brochure about integrated pest management and conservation biological control. I will ask the participating growers of my study to hang the poster in their farm store, and I will distribute the brochures at farmers markets to consumers and to patrons of pick-your-own operations in summer 2024.
