Final report for GNE24-309
Project Information
Changes in winter weather reported in the northeast has resulted in earlier instances of sap flow during the maple season. Larger maple operations responsible for installing many taps may adapt to this pressure by tapping earlier in winter dormancy, ensuring they capture sap when it begins to flow. We know that the tree’s wound response is temperature dependent and diminished during dormancy. Trees respond to tap holes, and other wounds, by compartmentalizing the affected tissue and surrounding area. This results in the cessation of sap flow thus the name Non-Conductive Wood (NCW). It is vitally important to the tree that this portion be minimized in volume by generating a rapid and robust wound margin. In the context of maple sugaring, not all tapping practices generate the same volume of NCW yet the sustainability model is fundamentally tied to the relationship between the trees annual increment and the volume of NCW generated. This project quantifies the non-conductive portion of sapwood generated in response to tap holes installed at 6 different points throughout the dormant season to better understand this relationship.
Objective 1. Establish relationships between tap hole wounding and timing of installation as they apply to the maple sugaring industry. The response variable is the volume of NCW generated by tap holes installed at 6 different time points within dormancy. These data determine the difference in NCW formation across the 6 treatments and between which groups the greatest differences are.
This project assesses whether the time of year when installing a tap hole in the stem of a maple tree impacts the sustainability of the tapping practice. Collecting maple sap requires the annual introduction of a relatively small wound into the stem vessels of a maple tree. The tree responds by compartmentalizing an area around the wound to permanently restrict the flow of water transport through this area, creating non-conductive wood (NCW) and forming a barrier to pathogens from entering the tree’s healthy vessels [1, 2]. Theoretically, annual tapping and sap extraction can be sustainable if the tree is able to compensate for the loss of conductive wood through the annual increment accumulated during the following growing season [3]. In the hierarchy of metabolic demands, radial growth is the last process a tree will expend resources on [4]. This means that if a tree can accumulate sufficient radial growth to compensate for the NCW generated during sap extraction, one can assume the quantity of carbohydrate extracted, and tapping practice did not diminish the trees health enough to consider it unsustainable [5]. Additionally, the working model of sustainable tapping states the proportion of functional sapwood in the tapping zone should be greater than 90%. Practices that minimize the accumulation of NCW are more likely to be considered sustainable and conversely practices that generate more NCW are more likely to be considered unsustainable or unfavorable. Choosing practices that limit the accumulation of NCW and maximize yield sustainably will help to optimize a sugar makers long term production. As stewards of their working forests, sugar makers need to have information available to them that informs management, ensuring their practices maximize the health of their trees and forests for their lifetime and future generations.
As soon as a tap hole wound is introduced, it becomes vitally important to the tree that it limits the spread of infectious pathogens, which in turn needs to colonize as much tissue as possible at the cost of viable sapwood. One of the first lines of tree defense comes through the formation of phenol's, antimicrobial defense compounds [2, 6]. These compounds gather at the margin of infection known as the reaction zone and work to limit the spread of pathogen [6]. The reaction zone is not always immediately successful which can lead to a larger column of NCW above and below the tap hole wound if penetrated [2, 7]. Among other factors, the success of forming a stable reaction zone is likely dependent on the time of year and pathogenic potential of the microorganisms present at the time of infection [2, 8, 9]. Unfortunately, wound response and accumulation of phenolic defense compounds is a temperature dependent process, requiring periods of warm temperature brought by the following growing season [2, 8] potentially leaving tap holes defenseless against pathogen for an extended period.
Table 1
|
Year |
Number of taps |
Number of farms |
|
2022 |
5,828,040 |
223 |
|
2017 |
3,614,782 |
147 |
A combination of shorter winters and the growing number of large maple farms requires some sugar makers to install taps earlier in winter dormancy [3]. The National Agriculture Statistics Service (NASS) reported an increase of 2.2 million taps installed on operations that have 10,000 taps or more from 2017 to 2022 (Table 1.) Producers of this size represent almost 6 million trees tapped in the state of Vermont (Table 1.) showing that these practices, if restricted to this class of producer, have the potential to impact a substantial portion of Vermont’s maple resource.
One tapper can reasonably expect to install between 300 and 400 taps in a day, so tapping 10,000 or more trees on a sugar bush is no short task, forcing producers to begin tapping earlier in the year. Historically, town meeting day has been the target date to have taps installed by. However, recent climate trends have made this target unreliable. Early installation maximizes sap yields [3], though it introduces a wound in crop trees during a potentially vulnerable time of year. There are key information gaps on the changes in NCW formation that occur when tapping early in winter dormancy. Paired data comparing the volume of NCW in response to tap holes introduced throughout each month in dormancy prior to sap flow do not exist. This project generates and analyzes these data to better understand the relationship between timing of tap hole installation and sustainable yield from our sugar woods.
Research
20 Sugar maple trees were selected from a larger inventory taken from two properties in Underhill, VT during the late summer of 2023, resulting in 10 trees on each property. All trees included in the inventory were selected under the conditions they were healthy, mature, dominant or co-dominant trees with vigor rating 1 as defined by the Vermont Forest Ecosystem Monitoring Cooperative forest health field methods to limit variation in NCW volume due to health or canopy status. The original inventory included trees of diameter between 10”-14”. Once inventoried, the final selection limited the variation in tree diameter in the population. Average diameter was 10.84” on site 1 and 10.9” on site 2. On each tree 6 positions were oriented around the north aspect and identified as 1-6. Position 1 was on the north aspect and subsequent positions were equally distributed clockwise around the trunk as a function of tree diameter. Each study unit received one control treatment, a tap hole installed on February 15th, and 5 treatments, one tap hole each installed in the middle of October, November, December, January, and March resulting in 6 paired groups. Variability between individuals can be high. Pairing the data limits the effect of tree to tree variability on the final analyses. Tap hole depth was controlled using a drill bit marked at 1.5”. There is not a universal standard for tap hole depth and 1.5” was chosen instead of using other commonly used depths like 2” to decrease the likelihood of wounds merging with existing stem defects, thus rendering that data point unusable. To accommodate for variation in tap hole size, results were also analyzed as a proportion of NCW area to tap hole area. Because many tap holes were fully occluded at the time of sectioning, specific tap hole depth measurements were not taken for each data point. Treatment and control tap holes were randomly assigned to one of the 6 positions identified prior (Image 2). Given that wound response is a temperature dependent process, care was taken to not subject certain treatments to an aspect that would result in different temperature conditions due to solar warming. The south facing aspect of a tree stem will typically be warmer due to a longer exposure to sunlight than other aspects during the winter months. Local weather conditions are obtained from a database recorded at UVM's Proctor Maple Research Center. Both sites are within a 3.5 mile radius of the weather station recording temperature data which allowed for comparison to time of year and temperature conditions during each treatment period. Following the 2024 growing season, after giving the study units an opportunity to form the boundary layer, trees were harvested via felling with a chainsaw. Care was taken to maintain a continuous 3’ of tissue above and below the whorl of treatment tap holes on the stem. An initial cross section was made through the whorl of treatments to initiate the bottom plane of two sections representing “Above” and “Below” the tap hole. From this initial plane, cross sections were taken to reveal the surface plane every 2” from the treatments until the extent of the boundary was reached. Sections were made by securing the log across two sawhorses, built for this purpose, and cutting cookies using a chainsaw jig to maintain accuracy (Image 1.) Each cross section was scanned (Image 3.), and using ImageJ image analysis software, the volume of the compartmented section was quantified for each treatment. Data was reported as a volume of compartmented area and as a proportion of taphole area.
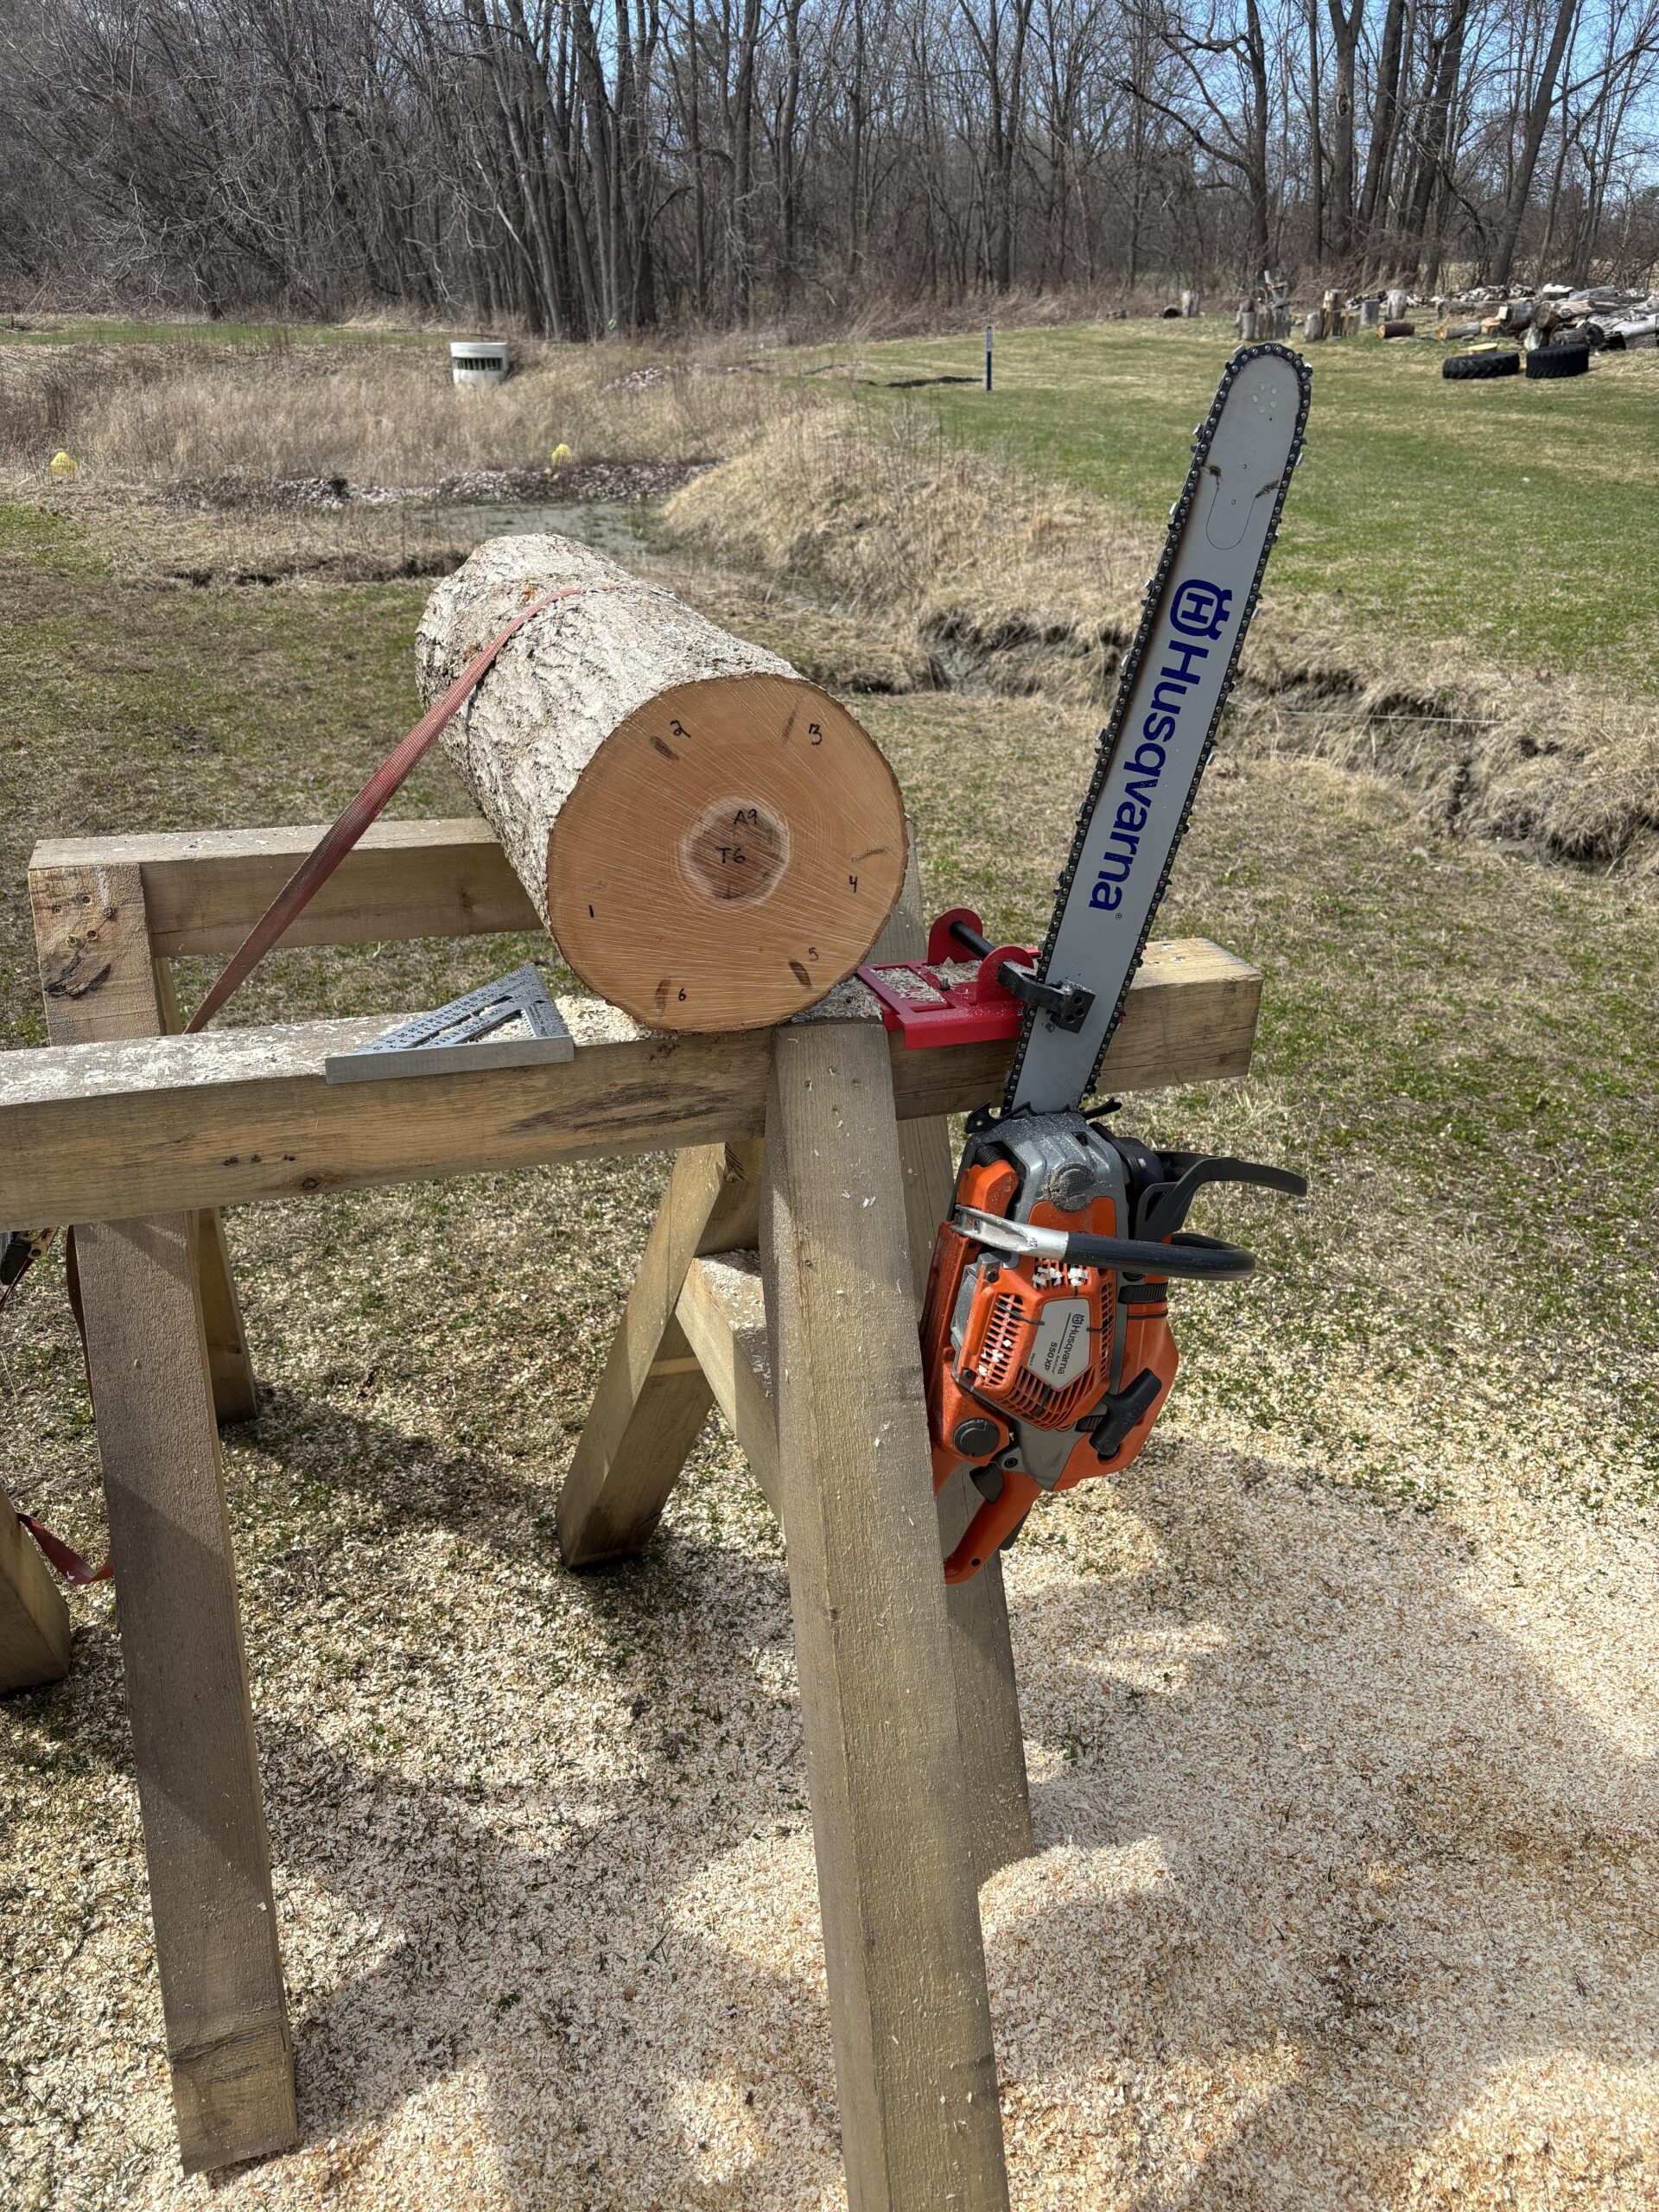
Image 1. Chainsaw Jig
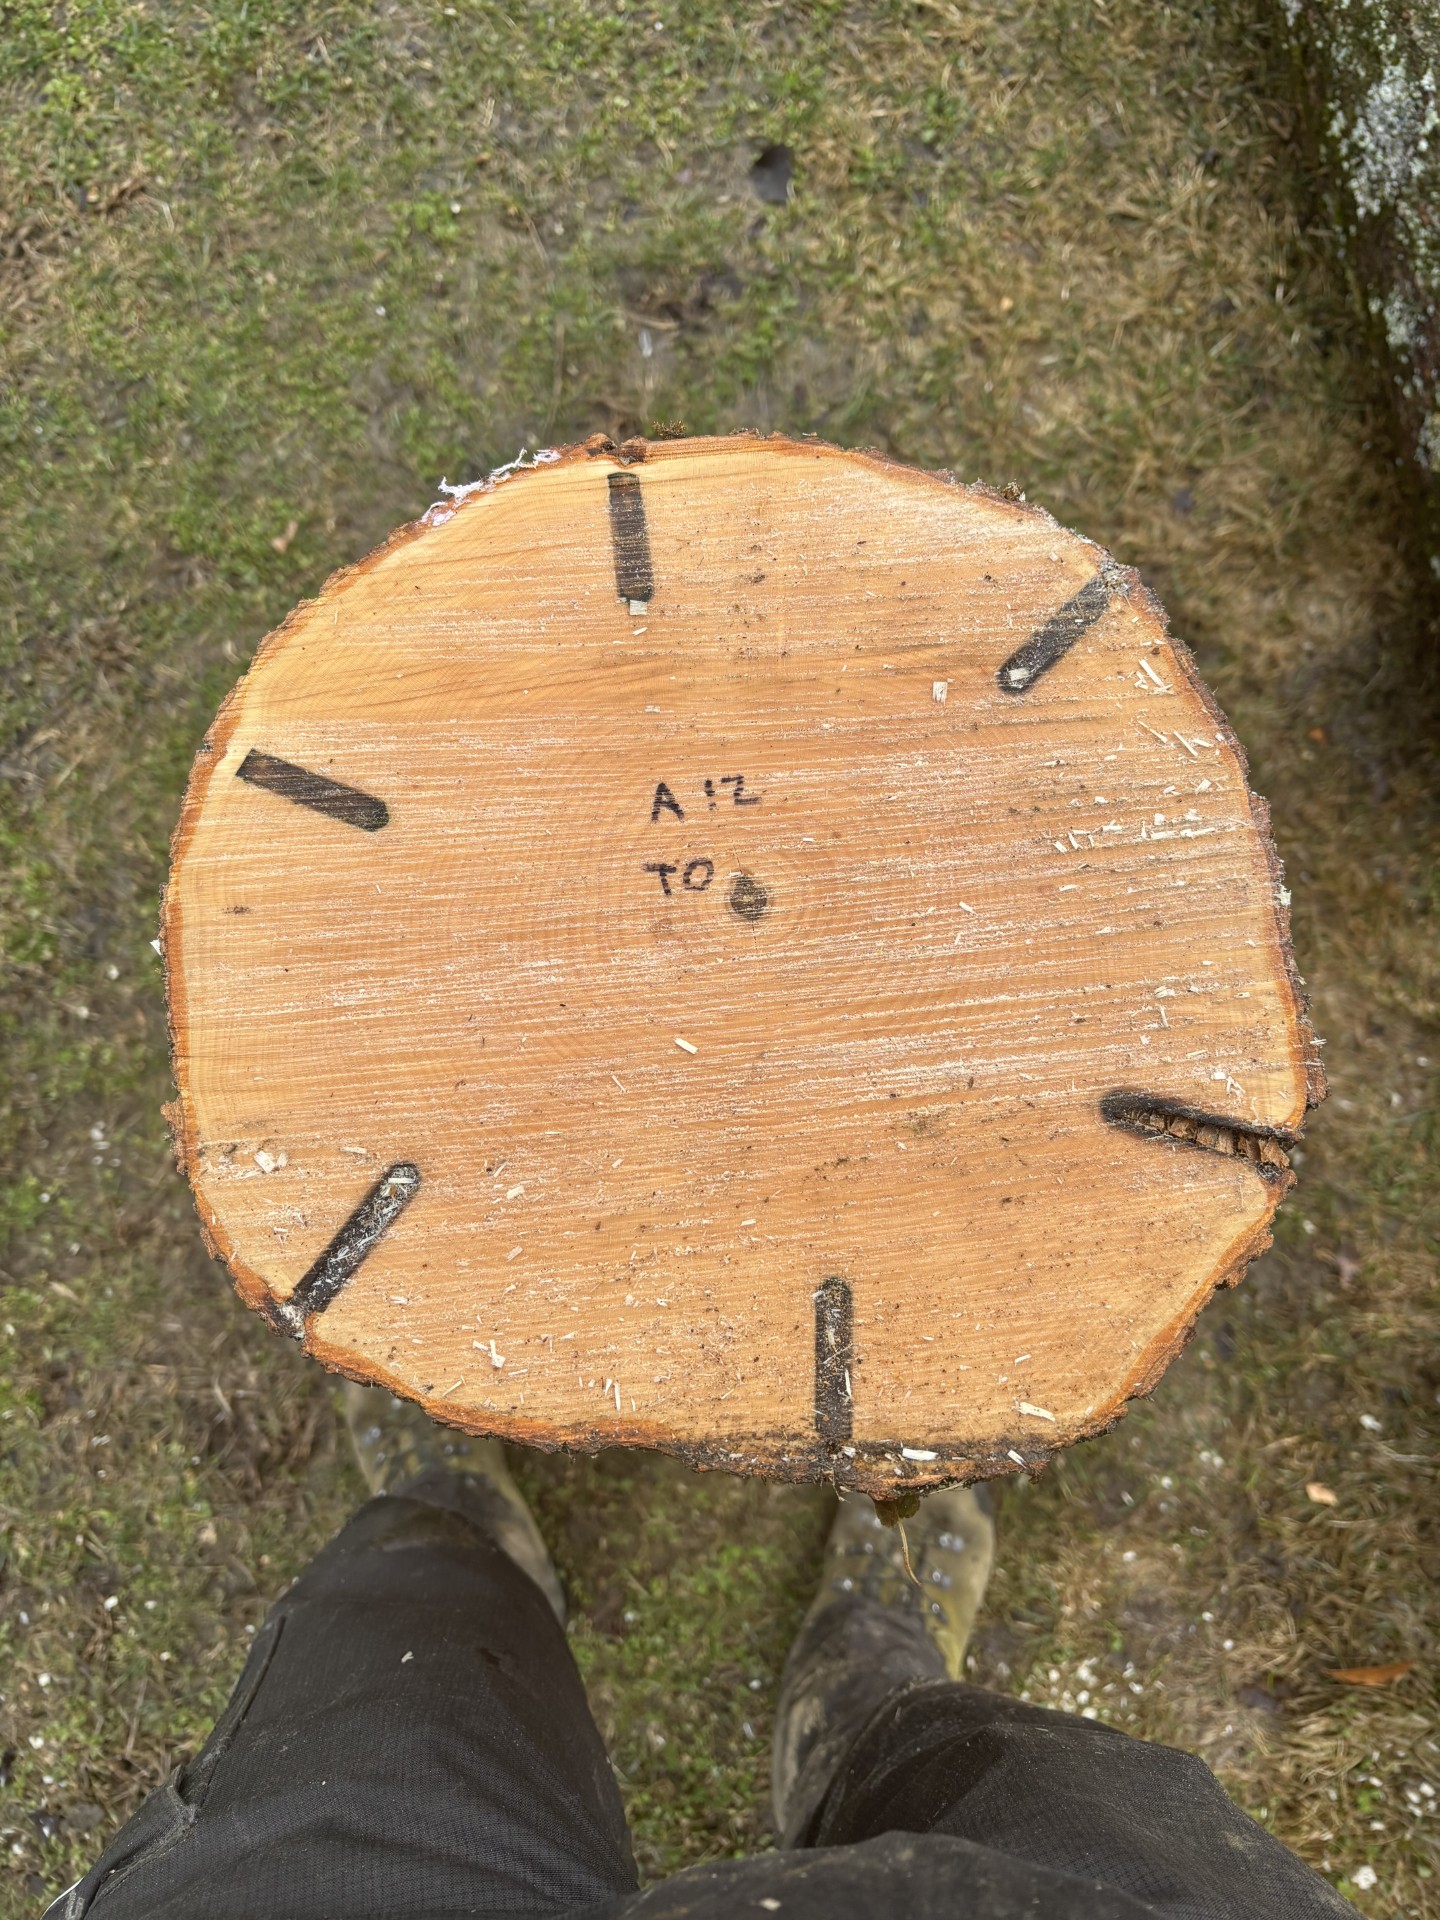
Image 2. Taphole distribution
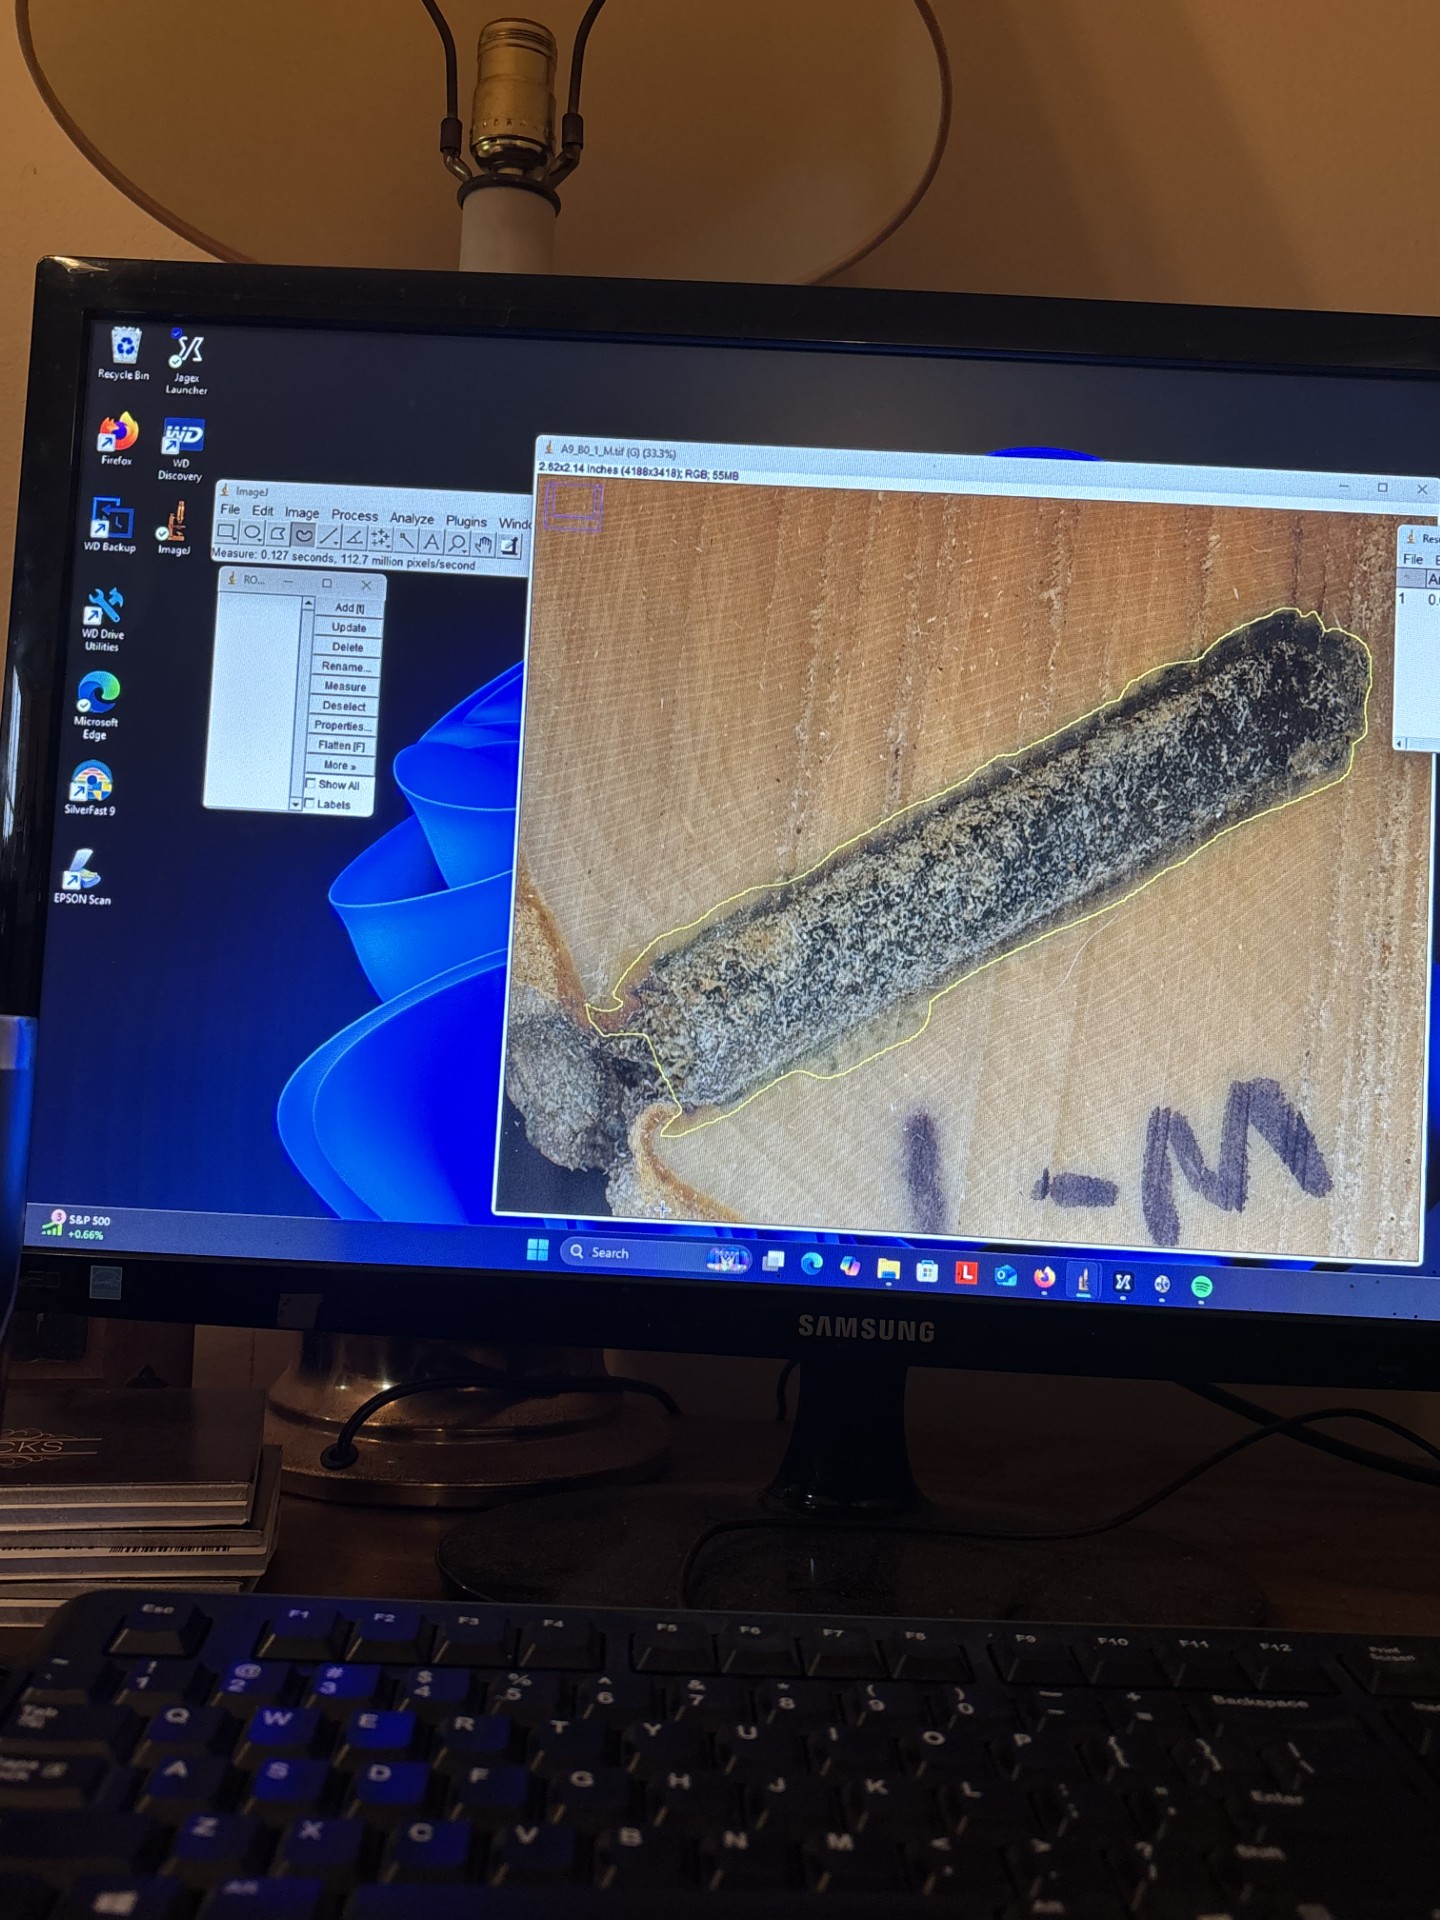
Image 3. Section scan in Image J
ImageJ is open source image analysis software that can, among other functions, measure the area of features on an image. Images of cross sections were scaled in the software using built in resolution scaling from silverfast scanning software and the area of NCW corresponding to each treatment was measured from each 2” cross section (Figure 2). Using these measurements, a final volume of NCW was calculated for each treatment.
Analysis of the resulting data was done using a mixed effects model with the lmer function in R to compare the mean volume of each treatment. A sample size of 20 was sufficient for inference using this method.
In 2021 these same methods were used to determine the NCW area generated by various taphole refreshing that were developed to delay tap holes from “drying up” in the spring when tapped earlier in the season [10]. Similar methods have also been used in in determining NCW generated by different size tap holes and tapping depth [5].
Results:
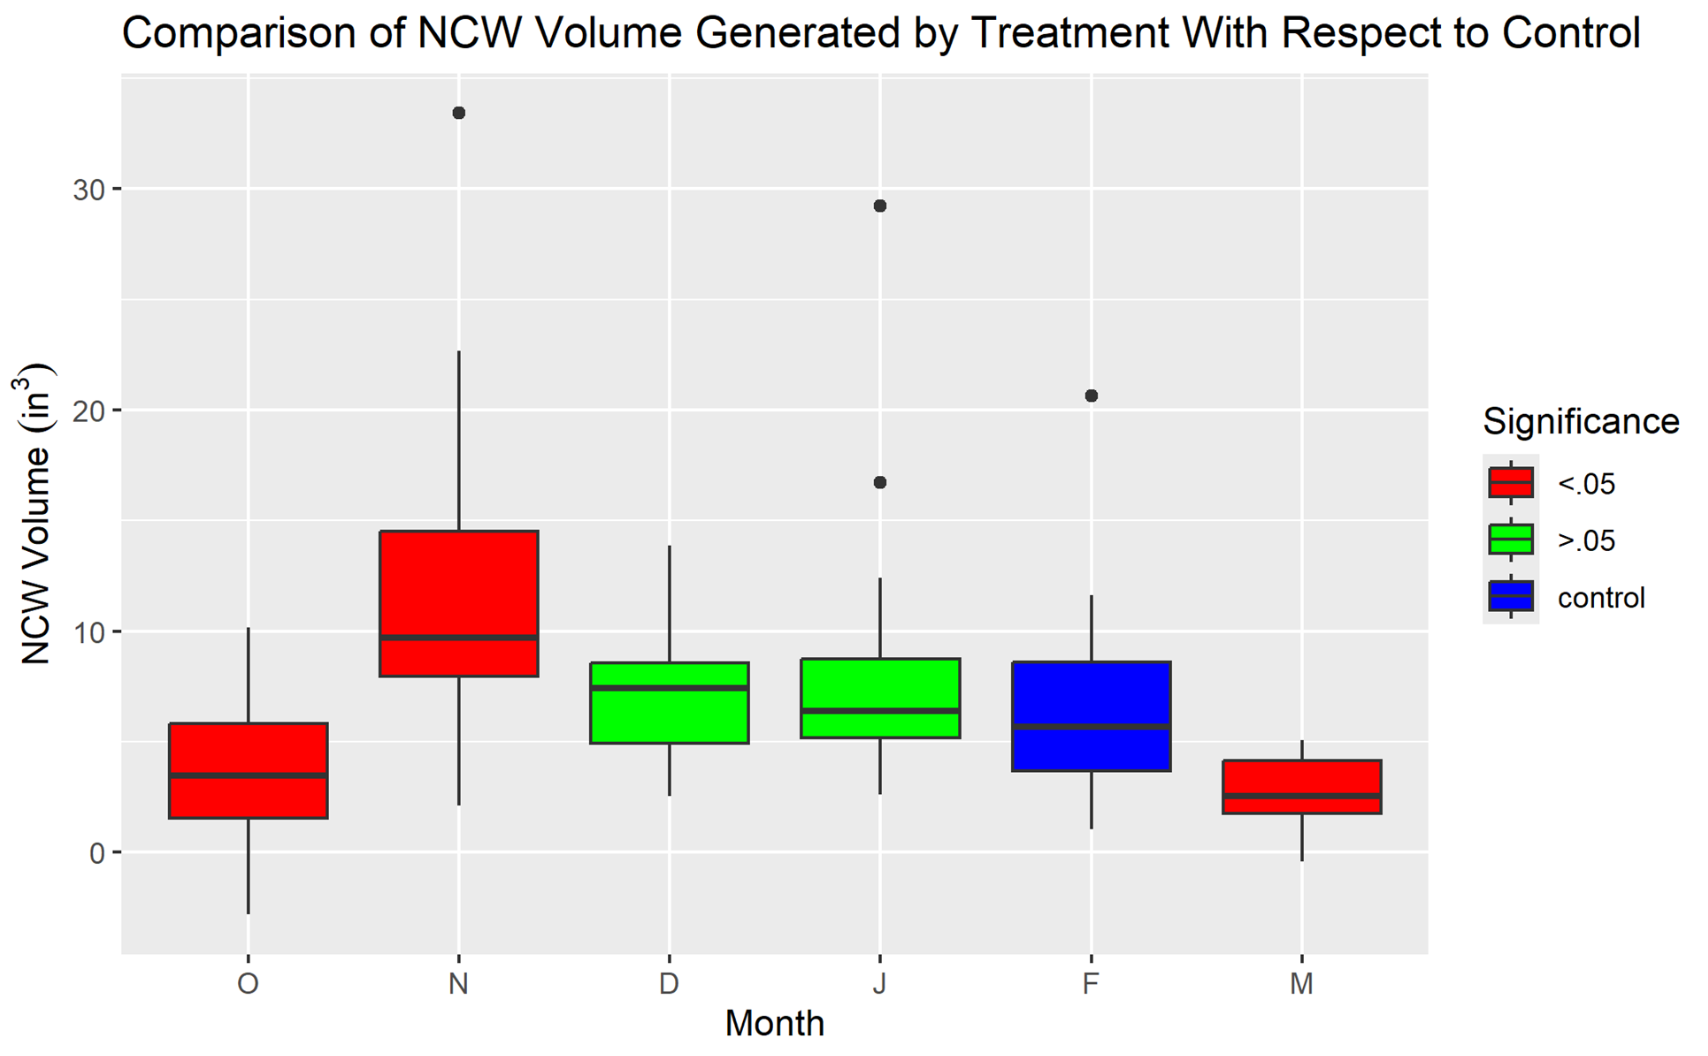
Characterization of NCW volumes generated by each treatment showed a significant difference between some but not all groups. When considering our February treatment the control group, December and January were both within 10% of the control volume and showed no significance through linear modeling (Figure 1.). The November treatment showed the greatest increase (70%) in NCW accumulation across all groups (Table 2.). October and March both showed significantly less NCW accumulation than the control with a reduction of 27% and 44% respectively. These patterns were virtually identical to data reported as proportional area to tap hole size, assuming all tap holes were 1.5" in depth.
Figure 1. NCW volume, in cubic inches, generated by treatment groups representing each month from October to March. Coloration indicates statistical significance relative to February control group.
|
Treatment |
Percent NCW Volume of Control (%) |
|
October |
73.7 |
|
November |
170 |
|
December |
110.3 |
|
January |
108.7 |
|
February |
100 |
|
March |
55.8 |
Table 2.
interpretation:
These results were generally consistent with previous research which showed a steadily diminishing volume of NCW throughout the dormant period. The October treatment was significantly lower than anticipated. This could be attributed to it’s installation during a different phenological phase than the remaining treatments. Shortly after its application the October treatment was exposed to warm temperatures followed by the seasons first frost, indicating tree signaling to enter dormancy (Figure 2.). The November treatment showed the highest average wound volume and was also the treatment with the longest period of exposure before wound healing could occur during the growing season. While speculation can be made comparing wound data to temperature, more robust sampling and repetition of this study are needed before making informed conclusions on relationships with temperature.
Tap hole shape was characterized to show the mean length and area of the stains produced by each treatment group (Figure 3). The most notable patterns from these data are the tight cluster of data points representing the December January and February treatment groups, the short and small volumes characterized by the March and October groups and the volumes of the November treatment being greater than all other treatment groups. While December January and February groups are technically accumulating NCW at a higher rate than March and October, they are the most important months for tapping maple trees on large operations. Recognizing that the treatment affect was not significant between these three groups is the largest takeaway from this research. March and October appear to be more sustainable when considering the accumulation of NCW alone. However, the viability of large productions would be at stake if restricting tapping activities to these time periods. In the lens of the sustainability model, the November treatment with a NCW column 170% the size of the control, is considered much less sustainable than the other groups. Practices that are considered less sustainable should generally be avoided and replaced with practices that are known to have more sustainable impacts.
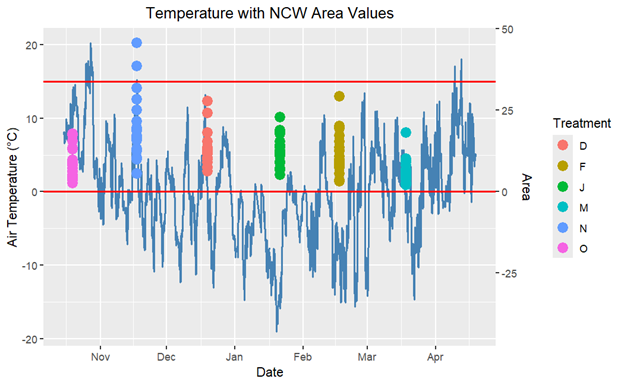
Figure 2. Temperature data relative to NCW volumes generated by each group. Red lines indicate thresholds for freezing temps (0˚C) and temps required for Boundary layer formation (15˚C).
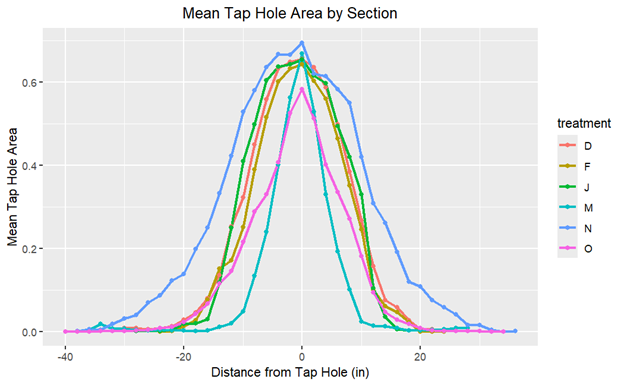
Figure 3. Average surface area of NCW at increasing vertical distance from tap hole by treatment.
This project aimed to reveal how sugar Maple trees accumulated NCW in response to tap holes installed in different time-points in winter dormancy and the data acquired succeeded in accomplishing this objective. We identified the differences in NCW accumulation between groups and are able to use these data to include the date of tapping Sugar maple trees when assessing sustainability for maple production. These results allow us insight into the patterns we’re confronted with. However, more depth of research explaining the inter-annual temperature conditions and relationships with tree phenology, and extension to the red maple species would be required before implementing refined management recommendations to producers.
Education & outreach activities and participation summary
Participation summary:
Outreach Plan:
This project is intended to be viewed as a pilot project. Nuanced guidance leading to meaningful policy requires more in-depth studies investigating the processes involved which are beyond the scope of this project and require additional years of data. While the results of this project may not be appropriate to inform policy or tapping guidelines yet, they will provide needed guidance to producers as they are making management decisions. Outreach came in 2 primary forms, publishing in 2 primary newsletters distributed across the maple producing region and presentations at the Vermont Maple Sugar Makers Association Vermont Maple Conferences (https://vermontmaple.org/for-producers/the-producer-hub/maple-education-resources) attended by industry professionals and maple producers alike. The annual Vermont Maple Conferences hosts maple producers and professionals for a day to distribute information to the maple community. From forest managers and researchers to manufacturing and packer representatives, these conferences engage the maple community with current research topics strategically scheduled immediately prior to that year’s production season. These meetings will be an opportunity to present research results and hold open discussions with the maple community. https://vimeo.com/1158964299?fl=tl&fe=ec
Articles will be submitted to both the Maple news and Maple Syrup Digest for publication. The Maple News is an industry publication widely distributed to producers and other members of the industry, containing stories, events, classifieds, and research reports (https://www.themaplenews.com/). The Maple Digest is the quarterly publication of the North American Maple Syrup Council and has served as a valuable method of distributing research reports to the maple community since its origins in the 1960’s (http://northamericanmaple.org/index.php/maple-syrup-digest/). Because of the applied nature of the work, other publications wouldn’t be expected to reach the target audience. Though it’s generally the goal of research to be published in journals recognized by the scientific community, there is no cost of publication with the outlets were pursuing and it is one of the most effective ways of reaching maple producers, the community this study is designed to help. These articles have not been submitted to publishers at the time of reporting though they are expected to be submitted in anticipation of the 2027 sugaring season.
Project Outcomes
Maple production is a unique agricultural practice in that the product is harvested from a naturally established forest ecosystem. Crop trees are not planted and to ensure sustainable viability from production areas, the health and productivity of each crop tree must be prioritized. Using the model for sustainability and continuously developing parameters that improve its accuracy will be necessary for providing meaningful guidance for practices that maintain viable operations throughout the lifespan of crop trees and the ecosystems they constitute. The relationship within the tapping zone that this model addresses is an indicator of both production and tree health. NCW is detrimental to both sap yield and tree health and the unsustainable accumulation of which can result in decreased tree vigor and the restriction of sap flow for maple production. When tapping into NCW the loss in sap yield is proportional to the amount of the tap hole encountering that non-conductive column. This could result in up to 100% loss in sap yield from taps installed directly into NCW. Estimating loss in sap yields using this sustainability model involves taking the proportion of NCW in the tapping zone and assuming that proportion as the rate of tapping into brown wood. Also assuming the reduction in sap yields is on average 50% across all taps installed into NCW allows us to calculate the yield loss in an operation when using certain practices. Given these assumptions a producer could experience 5% or less in reduced yields due to tapping into NCW using methods considered sustainable in this model. Making efforts to reduce the proportion of NCW will reduce the economic loss resulting from tapping into NCW.
This research was originally intended as a pilot project that began to answer this question, with the understanding that future research will be needed to create a fuller resolution to the knowledge we gained. The patterns we revealed in this research provided us with a clear roadmap to effectively expand this body of knowledge. My understanding of tree ecophysiology was advanced in a way that will allow me to design future research in this area that would result in more comprehensive explanations to the questions we asked in this research. It is apparent that not only understanding the influence interannual temperature has on this process but also hormonal profiling to mark the specific phenophase shifts for each treatment group, will provide more targeted and actionable management recommendations.