Final report for GNE24-326
Project Information
Project Summary: Improving Cold-Season Performance in Cereal Rye and Winter Pea
Project Summary
Reliable winter cover crop and grain legume establishment is a persistent challenge for northeastern U.S. farmers. Late planting windows, cold soils, and harsh winters cause frequent stand failures in winter cereal and legume crops, limiting their adoption and the ecosystem benefits — weed suppression, erosion control, nitrogen fixation, and soil health — they provide. This grant supported two complementary breeding projects targeting these barriers: one focused on improving cold-temperature germination in cereal rye, the other on improving freezing tolerance in winter pea.
Research Approach. In winter pea, 295 diverse accessions from the USDA germplasm collection were screened under controlled freezing at −12°C and analyzed using genome-wide association methods to identify genetic markers linked to freezing survival, post-freezing regrowth, and cell membrane damage. In cereal rye, populations derived from crosses between allelopathic lines and northern-adapted cultivars were evaluated through one cycle of field-based selection and two cycles of thermogradient table selection — a controlled-environment method that exposes plants to precise cold temperatures. Selected populations were compared against the unselected base population and leading commercial cultivars including ND Gardener in replicated field trials at two New York sites (Freeville and Willsboro).
Research Conclusions. In winter pea, eight genetic markers associated with freezing tolerance were identified, two of which explained roughly 29% of variation in plant survival each — unusually large effects for a complex trait. Several accessions outperformed all three current commercial cultivars (WyoWinter, Blaze, and Survivor) across every trait measured, identifying superior breeding material that does not yet exist in the commercial marketplace.In cereal rye, thermogradient table selection substantially outperformed field-based selection. After just one thermogradient selection cycle, the resulting population produced 201% more biomass than the unselected base material and matched ND Gardener in cold germination rate — while one cycle of field selection produced little measurable gain. This confirms thermogradient selection as a rapid, efficient breeding tool. A significant genotype × environment interaction was observed: gains observed at the moderate-winter Freeville site were higher than in the harsher Willsboro site, highlighting the need for region based selection and multi-environment testing before cultivar release.
Impacts and Potential Impact. These projects deliver two types of value to the agricultural community. First, they establish thermogradient table selection as a validated, efficient method for improving cold-season performance in cereal crops — a tool other breeding programs can adopt. Second, they identify specific germplasm and genetic markers in both crops that bring improved cultivars meaningfully closer to farm use. For northeastern farmers, improved cereal rye cultivars would mean more reliable late-planting establishment, and improved winter pea would expand access to a high-value, nitrogen-fixing crop currently frost-sensitive for consistent production. Continued selection cycles and multi-environment trials are underway in both crops, with cultivar release as the ultimate goal.
- Discover pea germplasm with freezing tolerance for breeding winter annual cover crop varieties.
- Locate genetic markers for freezing tolerance in winter pea to accelerate breeding of winter hardy pea cultivars.
- Identify efficient methods to breed cereal rye for cold temperature germination rate and vigor and develop rye cultivars with improved growth at late fall planting dates in the Northeast US.
The purpose of this project was to improve the winter hardiness in two popular winter cover crops, winter peas, and cereal rye. Winter pea (Pisum sativum L.) is one of the widely planted annual legume cover crops because of its potential to fix nitrogen (N) and effective weed suppression (Clark, 2007). Peas can return approximately 25 lb/acre of N to the soil, thus reducing soil nutrient depletion and N application in the following crop (Oelke, et al., 2022). However, the Northeast US has very harsh winter conditions leading to very low and inconsistent winter survival of most cover crops including winter peas. Cold temperature stress reduces nodulation and nitrogen fixation in winter annual legume cover crops (Thurston et al., 2022). Moreover, winter killed cover crops produce less biomass (Florence et al., 2019), suppress weed less (Ranaldo et al., 2020), lead to high N leaching (Gollner et al., 2020), and provide a lower total amount of ecosystem services due to their shorter lifespan compared to winter hardy cover crops (Kaye et al., 2019; White et al., 2016). Despite efforts to breed winter hardy peas and identify genomic regions associated with winter hardiness across the globe, consistent winter survival has not yet been achieved. In addition, frequent freeze-thaw cycles caused by climate change have further reduced the cold tolerance of peas. Therefore, more efforts are necessary to improve the winter hardiness of peas.
Genome wide association studies on the cold tolerance of winter peas in a new population will help to identify new sources of winter hardiness and genetic markers associated with winter hardiness (Liu et al., 2017). The personnel in this project are part of the Cover Crop Breeding (CCB) Network, a group of plant breeders, agronomists, and farmers that have been breeding winter peas and other cover crops for adaptation to the northern US. Winter hardy material and markers/genomic regions identified through this project can be used by CCB network collaborators and other researchers in the marker-assisted selection and breeding of winter hardy peas. Marker assisted breeding shortens the breeding cycle, allowing for the earlier release of new regionally adapted varieties. Development and adoption of winter hardy peas can reduce the N cost for the following cash crop, increasing the profitability of Northeast farmers. Planting winter peas before corn or a non-legume cash crop can mitigate the risk of transferring pests and pathogens from rye (the most widely used winter hardy cover crop) to corn or other cash crops in the Poaceae family (Dawadi et al., 2019; Ha & Hart, 2020; Snapp et al., 2005). It will ensure sustainability and resilience, and foster conditions where farmers have high profit, high quality of life, and communities can thrive.
Cereal rye is a commonly used winter annual cover crop because of its ability to withstand cold temperatures and can be planted late in the fall (Wayman et al., 2017). It offers many benefits over other cover crops, such as rapid production of ground cover, prevention of soil compaction, high biomass production, and the highest level of winter hardiness (Li et al., 2011). It has become a staple winter cover crop in corn-soybeans production systems. Cereal rye can germinate in temperatures as low as 1oC (Clark, 2007) and can tolerate temperatures as low as -30°F once it is well established (Grubinger, 2021).
However, most cereal rye cultivars are open-pollinated and there is a large variation in performance within and among cultivars (Gailans, 2021). In the Northeast US, corn is harvested between October 20 and November 20 (USDA, 1997). When farmers plant rye after corn harvest, cereal rye would experience below freezing temperatures most of the nights during germination and early growth stages, which can limit its establishment, ground cover, biomass production, and nitrogen scavenging (Farsad et al., 2011; Mirsky et al., 2009; Szuleta et al., 2022). Selecting cereal rye for cold temperature germination and vigor can lead to the development of a cereal rye cultivar with a higher level of winter hardiness than current cultivars. Such cultivar can be planted later in the fall without reducing its benefits. This will increase the profitability of farms in the Northeast in the long term by contributing to soil health and protection, ensuring sustainability and resilience, and fostering conditions where farmers have high profit, high quality of life and communities can thrive. The development of cereal rye cultivar with high cold germination and vigor allows farmers to fit cereal rye into common crop rotations.
Research
Project I: Genome Wide Association of Cold Tolerance in Peas
1. Plant Material
A total of 295 pea (P. sativum L.) accessions from the USDA Pea Single Plant Plus Collection (PSPPC) were used in this study. This collection represents a geographically diverse set of germplasm sourced from around the world (Holdsworth et al., 2017). Seeds were obtained from the USDA Germplasm Resources Information Network (GRIN) and subsequently increased under field and greenhouse conditions prior to phenotyping.
2. Phenotyping for Freezing Tolerance
2.1 Experimental Setup
Accessions were divided into two groups based on germination timing in order to standardize developmental stage at the time of freezing treatment. Each group was phenotyped across four cycles in a Percival LT-50 growth chamber, yielding four biological replicates per accession (Figure 1). A cycle is defined here as the period from germination to final freezing treatment.
Within each cycle, the chamber was divided into two spatial subblocks per chamber to minimize positional effects. Each accession was randomly assigned to one cell per subblock, and flats were rotated at every watering event to further reduce positional bias. Each cycle contained 8.5 flats (425 cells total; 50 cells per full flat, 25 cells in the half flat), sown in Cornell seed-starting mix at a target density of four plants per cell, though actual density ranged from two to nine plants per cell. Tolerant (Survivor, WyoWinter, Blaze) and susceptible (Cascadia, Avalanche) check genotypes were included in every cycle to enable cross-cycle comparisons. No supplemental fertilizer was applied.
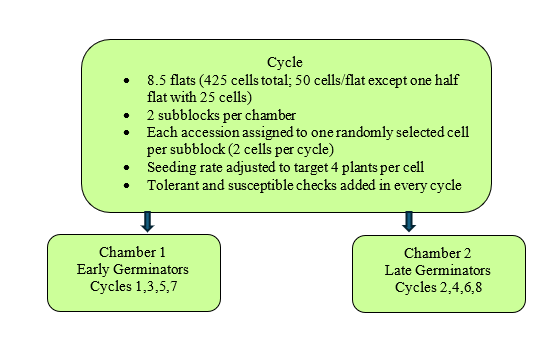
Figure 1. Experimental setup for freezing tolerance phenotyping in controlled-environment growth chambers
2.2 Freezing Treatment Protocol
Controlled environment screening protocol was developed using commercial pea cultivars. Based on the protocol, plants were grown at 19/12°C (day/night) until reaching the two- to three-leaf stage (approximately five days after germination), after which they were subjected to a cold acclimation period of 7.25 days at 6/0°C (day/night). Following acclimation, temperature was then reduced from 0°C to −12°C at a rate of 2°C per hour over six hours, followed by a 16-hour holding period at −12°C. To ensure consistency across cycles, the final freezing treatment was always conducted in the same chamber regardless of which chamber was used during earlier growth phases. Following freezing, leaf tissues were extracted for ion leakage and then plants were transferred to a walk-in recovery chamber maintained at 22°C and allowed to recover for two weeks. Relative humidity was maintained at 60% throughout, except during phases below 6°C where chamber could not control humidity. Detailed chamber settings for each experimental phase are summarized in Table 1.
|
Table 1. Temperature settings and exposure periods during each experimental phase of the freezing tolerance phenotyping protocol for pea (Pisum sativum L.). Plants were grown in controlled-environment growth chambers (Percival LT50) across eight experimental cycles, with relative humidity maintained at 60% throughout all phases except during sub-zero temperatures where humidity control was not feasible. |
||
|
Phase |
Temperature |
Duration |
|
Early growth |
19°C/12°C (day/night) |
Germination to 2–3-leaf stage (~5 days) |
|
Cold acclimation |
6°C/0°C (day/night) |
7.25 days |
|
Temperature reduction |
0°C to −12°C (2°C/hr) |
6 hours |
|
Freezing treatment |
−12°C |
16 hours |
|
Recovery |
22°C |
2 weeks |
2.3 Trait measurement
Ion leakage was measured as an indicator of membrane integrity using a relative electrolyte leakage assay adapted from Hatsugai & Katagiri (2018). Immediately following the freezing treatment and prior to the recovery period, three leaf tissues were harvested per cell. Leaf discs were prepared using a paper puncher and immersed in 2 ml of deionized water at room temperature for 24 hours. Initial conductivity (C1) was measured using a Horiba LAQUAtwin EC-33 compact conductivity meter (Horiba, Woodland, TX, USA). Samples were then boiled for 30 minutes, cooled to room temperature, and total conductivity (C2) was recorded. Relative ion leakage was calculated as (C1/C2) × 100%. After the recovery period, total number of plants present and number of plants alive were counted and the percentage survival was calculated. Growth score was assessed using a 0–9 ordinal scale reflecting the degree of post-freezing recovery and regrowth (Table 2). A score of 0 indicated complete plant death, while a score of 9 represented vigorous regrowth with multiple shoots exceeding 30 cm in height.
Regrowth score for each cell was then calculated as the average growth score for all plants in the cell.
|
Table 2. Ordinal growth score scale (0–9) used to assess post-freezing plant recovery in pea (Pisum sativum L.) following two weeks of recovery at 22°C after freezing treatment at −12°C. A score of 0 indicates complete plant death and a score of 9 represents vigorous regrowth with multiple shoots exceeding 30 cm in height. |
|
|
Score |
Description |
|
0 |
Complete death |
|
1 |
New shoots beginning to emerge |
|
2 |
Two new open leaves on new or old shoot |
|
3 |
New shoot height of 5 cm |
|
4 |
New shoot height of 10 cm |
|
5 |
New shoot height of 15 cm, or old stems showing no signs of damage |
|
6 |
New shoot height of 15 cm with a second small shoot present; total plant height 15–30 cm |
|
7 |
Whole plant well-recovered; shoot height approximately 30 cm |
|
8 |
Two shoots exceeding 30 cm, or a single shoot reaching 60 cm |
|
9 |
Three or more shoots exceeding 30 cm, or a single shoot reaching 90 cm |
3. Data analysis
3.1 Best Linear Unbiased Predictions (BLUPs) calculation
To obtain reliable phenotypic estimates adjusted for experimental variation, Best Linear Unbiased Predictions (BLUPs) were derived for each trait using mixed models fitted in R. Cycle was modeled as independent random effects to account for variation attributable to repeated testing across chamber cycles. The model was:
yijk = μ + Gi + Rj + εijk
where μ is the overall mean, Gi ~ N(0, σ²g) is the fixed effect of the i-th genotype, Cj ~ N(0, σ²c) is the random effect of the j-th cycle, and εijk ~ N(0, σ²) is the residual error. Skewed BLUPs were normalized using INT-transformation.
3.2. Genome-Wide Association Study
Genotyped data was processed, aligned with the reference genome and then filtered for minor allele frequency (MAF) (retaining alleles with >0.05 frequency) and heterozygosity (retaining lines with lower than 20% heterozygosity) using the software TASSEL (Bradbury et al. 2007). Genotypic data comprised 54,315 SNPs after quality filtering (minor allele frequency, MAF ≥ 0.05).
Genome-wide association analysis was performed using GAPIT3 (Genome Association and Prediction Integrated Tool; Wang & Zhang, 2021) in R. Four statistical models were evaluated for each trait: Bayesian-information and Linkage-disequilibrium Iteratively Nested Keyway (BLINK; Huang et al., 2019), Mixed Linear Model (MLM; Yu et al., 2006), Compressed Mixed Linear Model (CMLM; Zhang et al., 2010), and Multiple Locus Mixed Model (MLMM; Segura et al., 2012). SNPs with MAF below 0.05 were excluded from all analyses. Significance thresholds were determined using Bonferroni correction (p < 0.05/54,315 = 9.21 × 10⁻⁷). The optimal number of principal components (PCs) for MLM based models (MLM, MLMM, and CLMM) were selected using the Bayesian Information Criterion (BIC) as implemented in GAPIT3.
For BLINK, which does not contain K (Kinship) relies solely on PCs for structure correction. So the genomic inflation factor (λ) was calculated across 0-5 PCs as the median observed chi-squared statistic divided by the expected median under the null hypothesis (0.4549), with values closest to 1.0 indicating optimal correction.
For survival, BLINK λ values were 1.151, 1.158, and 0.996 at 0, 1, and 2 PCs, respectively. Although 2 PCs produced the λ closest to 1.0, inclusion of 2 PCs resulted in complete loss of significant associations, indicating overcorrection. Accordingly, BLINK with 0 PCs was retained for survival, with mild inflation (λ = 1.151) acknowledged as a limitation and results treated as suggestive pending RNA-seq validation. For growth, λ values were 1.056, 1.052, and 1.006 at 0, 1, and 2 PCs respectively; BLINK with 2 PCs was selected based on the optimal λ and cleanest QQ plot while retaining significant associations. For ion leakage, BIC selected 0 PCs for all MLM-based models, which was corroborated by BLINK λ analysis (0 PCs: 1.048; 1 PC: 1.102; 2 PCs: 1.062; 3 PCs: 1.279), where inflation worsened with increasing PCs, confirming that the kinship matrix was adequately controlling population structure without additional PC covariates.
3.3. Linkage Disequilibrium Analysis
Linkage disequilibrium (LD) decay was assessed using PopLDdecay (Zhang et al., 2019) across all seven pea chromosomes (chr1LG6, chr2LG1, chr3LG5, chr4LG4, chr5LG3, chr6LG2, and chr7LG7). The squared correlation coefficient (r²) was computed for all SNP pairs within a sliding window and plotted against physical distance in kilobases (Kb). A locally weighted regression (LOESS) smoothing curve was fitted to each chromosome-specific decay profile to identify the distance at which r² declined to background levels.
Across chromosomes, background LD (r² ≈ 0.08–0.09) was reached at approximately 75–100 Kb. Half-decay — the distance at which r² dropped to half its initial value — was observed at approximately 30–50 Kb. Based on these empirically derived decay patterns, a ±100 Kb window (r² ≥ 0.2 threshold) was used as the primary criterion for defining LD blocks surrounding significant SNPs for candidate gene identification. An r² = 0.1 threshold was applied as a secondary, exploratory window where no candidates were identified at the primary threshold.
3.4 Candidate Gene Identification
Candidate genes were identified within LD blocks surrounding each significant lead SNP using a primary ±100 Kb window (r² ≥ 0.2 threshold), consistent with the empirically determined LD decay distance for this population. Where no candidate genes were identified at the primary threshold, a secondary exploratory window using r² ≥ 0.1 was applied. Gene annotations were extracted from the pea reference genome (Kreplak et al., 2019) using the defined LD block coordinates via bedtools intersect.
Project II: Evaluating cereal rye population and methods of selection for cold temperature germination and vigor
1. Material
The original material for the study was obtained from CCB collaborators at NC State University. At NC State University, 10 bulked full-sibling families from 10 different crosses (Table 3) were open pollinated in a field to obtain 10 half-sibling families (C0). Highly allelopathic lines were included as male parents and northern region adapted commercial rye cultivars were included as females (Table 1). These families were grown in both a field and controlled environments from Fall 2023 to May 2025 to select the best 5% of plants for cold germination and vigor. The selection process involved one cycle in the field and two cycles in a controlled environment. The field selection (C1F) was done at Willsboro Farm in Willsboro Point, NY, and was completed in May 2024. The controlled environment selection was done using a gusseted thermogradient table. The first cycle (C1C) of controlled environment selection took place from fall 2023 to late spring 2024, and the second cycle (C2C) ran from late spring to early fall 2024.
The evaluation study funded by this grant used bulked seeds from the original NC state population, the common cultivar ND Gardener as a control, and bulked seeds from selected populations from each selection cycle, totaling four genotypes (C0, C1F, C1C, C2C).
|
Table 3. Cereal rye population obtained from NC State University |
|||
|
SN |
Female |
Male |
|
|
1 |
NDGardner |
X |
NC20-A122-2 |
|
2 |
NDGardner |
X |
NC20-R103-2 |
|
3 |
NDGardner |
X |
NC20-A117-1 |
|
4 |
NDGardner |
X |
NC20-A133 |
|
5 |
NDGardner |
X |
NC20-R114 |
|
6 |
NDGardner |
X |
NC20-A129-2 |
|
7 |
NDGardner |
X |
NC20-R101-3 |
|
8 |
NDGardner |
X |
NC20-A130-2 |
|
9 |
Aroostook |
X |
NC20-R114 |
|
10 |
Aroostook |
X |
NC20-A122-3 |
2. Methods
This study was conducted in both field and controlled environment settings. It started in November 2024 and ended in May 2025.
2.1 Field evaluation
The study was planted in November 2024 at two field locations: Cornell Willsboro Research Station, Willsboro, NY, and Homer C. Thompson Vegetable Research Farm, Ithaca, NY (Figure 1). Willsboro, NY is located further north compared to Ithaca, NY, and experiences more severe winter temperatures. The above-mentioned material was planted in a RCBD with four replications at each location. Each plot consisted of one row of treatment planted at a seeding rate of 60 lbs/acre, bordered by a common rye cultivar. Plant biomass was harvested on first week of May, and the samples wiere oven-dried to obtain the dry biomass weight.
2.2 Controlled environment evaluation
The controlled environment evaluation was conducted in a gusseted thermogradient table from Jan 10 to Feb 10 in 2025. A randomized complete block design was used with four replications. The seeding rate matched field conditions (60 lbs/acre). The table was equipped with two circulating baths to regulate the temperature, creating a gradient ranging from -1°C to 3°C across the gussets. Data collected included day of first emergence for each entry and total number of plants germinated within the first three days (a measure of germination rate and early vigor under cold stress).
3. Data analysis
Statistical analyses were performed using R Studio (version 4.6). All response variables (biomass, germination count, vigor, and stand count) were analyzed using linear mixed models fitted with the lme4 package. Variety (genotype/population) and location were treated as fixed effects, and replication nested within location was included as a random effect. Pairwise comparisons among variety means were conducted using estimated marginal means (emmeans package) with Tukey’s adjustment for multiple comparisons (α = 0.05), and compact letter displays were generated using reverse=TRUE so that higher-performing groups receive the letter ‘A’.
Response to selection (R) was calculated for each cycle relative to the base population (C0) as: R = μ(selected cycle) − μ(C0), where μ denotes the estimated marginal mean of the trait of interest.
Project I: Genome wide association Study
3.1. Phenotypic Variation and BLUPs
Substantial phenotypic variation was observed among the pea accessions for all three freezing tolerance traits (Figure 2, 3, 4). Survival ranged from complete mortality to near-complete survival across accessions (Figure 2), reflecting broad genetic diversity for this trait within the USDA PSPPC. Growth score and ion leakage similarly showed wide distributions (Figure 3, 4). Some accessions had higher survival, regrowth potential, and lower ion leakage than our checks. BLUPs derived from the mixed model accounted for cycle effects, providing adjusted phenotypic estimates for downstream GWAS analyses. Percent survival and regrowth score were highly skewed and BLUPs for them were normalized using inverse normal transformation (INT) to satisfy the distributional assumptions of the association models (Figure 2, 3). Distribution of ion leakage was normal and did not require transformation (Figure 4).
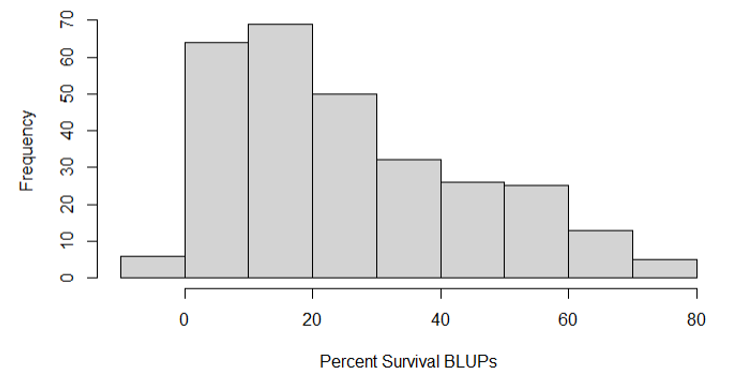
Figure 2. Frequency distribution of Best Linear Unbiased Predictions (BLUPs) for post-freezingpercent survival across 295 pea (Pisum sativum L.) accessions from the USDA Pea Single Plant Plus Collection (PSPPC). Survival was calculated as the percentage of plants surviving freezing treatment at −12°C relative to the total number of plants prior to treatment.
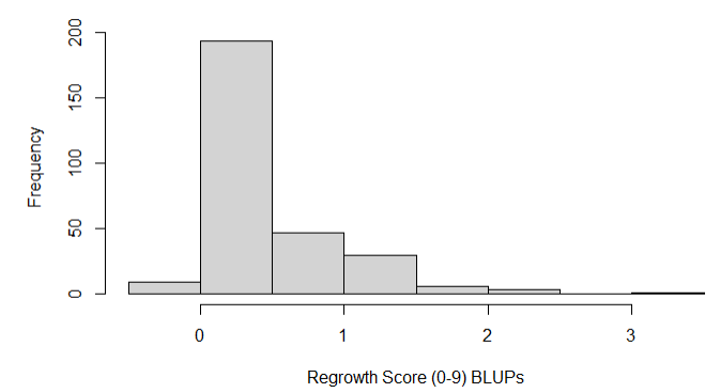
Figure 3. Frequency distribution of Best Linear Unbiased Predictions (BLUPs) for post-freezing regrowth score across 295 pea (Pisum sativum L.) accessions from the USDA Pea Single Plant Plus Collection (PSPPC). Regrowth score was assessed on a 0–9 ordinal scale reflecting the degree of plant recovery following freezing treatment at −12°C.
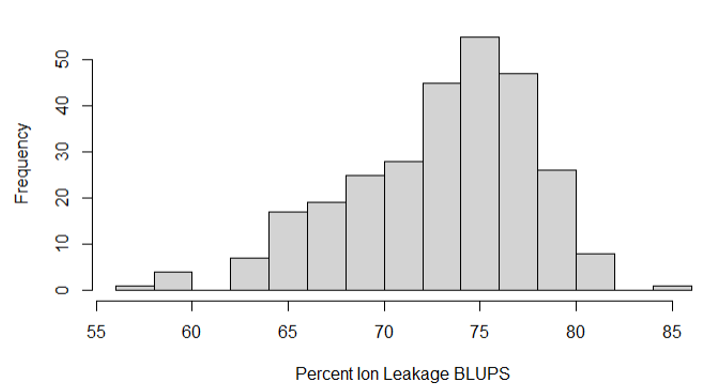
Figure 4. Frequency distribution of Best Linear Unbiased Predictions (BLUPs) for post-freezing ion leakage across 295 pea (Pisum sativum L.) accessions from the USDA Pea Single Plant Plus Collection (PSPPC). Ion leakage was measured as relative electrolyte leakage (%) using a conductivity assay, where higher values indicate greater membrane damage following freezing treatment at −12°C.
3.2. GWAS Results and Model Diagnostics
For each trait, the optimal number of principal components (PCs) was determined. Zero PCs was selected as optimal for MLM, CMLM, and MLMM across all traits, as the kinship matrix adequately controlled for population structure without additional covariates. For BLINK, 0 PCs was optimal for survival and ion leakage, while 2 PCs was optimal for growth score.
For survival, BLINK with 0 PCs (λ = 1.15) identified four significant SNPs (p < 9.21 × 10⁻⁷, Bonferroni correction) distributed across chromosomes 1LG6, 6LG2, and 7LG7 (Figure 6; Table 3). The two SNPs on chromosome 1LG6 explained 10.18% and 29.46% of phenotypic variance with positive allele effects (+7.90 and +13.23, respectively; Table 4), indicating that the minor allele at these loci increases survival. The SNP on 7LG7 explained 29.12% of variance (+15.38 effect), while the SNP on 6LG2 explained a more modest proportion (R² = 4.28%; effect = +3.99). Including 2 PCs produced a λ closer to 1.0 but resulted in complete loss of significant associations, indicating overcorrection. Given the mild genomic inflation at 0 PCs, survival associations are considered suggestive and will require functional validation through planned RNA-seq analysis. MLM, CMLM, and MLMM detected no significant SNPs for this trait.
For growth score, BLINK with 2 PCs (λ = 1.006) identified one significant SNP (S6LG2_90910213; p = 3 × 10⁻⁷; MAF = 0.281) on chromosome 6LG2, explaining 3.36% of phenotypic variance with a negative allele effect (−0.09), indicating that the minor allele is associated with reduced growth (Figure 6; Table 4). This modest effect size is consistent with expectations for a single locus underlying a complex quantitative trait. MLM, CMLM, and MLMM detected no significant SNPs for this trait.
For ion leakage, BLINK with 0 PCs (λ = 1.048) identified three significant SNPs across chromosomes 5LG3 and 7LG7 (Significant SNP in 2LG1 removed due to MAF less than 0.05; Figure 9, Table 4). MLM, CMLM, and MLMM each independently identified one significant SNP (S5LG3_215946744) overlapping with the BLINK results, providing cross-model validation for that association (Figure 9). The SNP on chromosome 5LG3 (S5LG3_215946744) explained the largest proportion of variance (R² = 17.41%; effect = −2.59), and the SNP S7LG7_144955735 explained 13.34% (effect = −4.42), with negative allele effects indicating that the minor allele at both loci reduces ion leakage — consistent with improved membrane integrity under freezing stress (Table 4). The third SNP on 7LG7 (S7LG7_98964498) showed a minimal individual effect (R² = 0.14%; effect = +0.19).
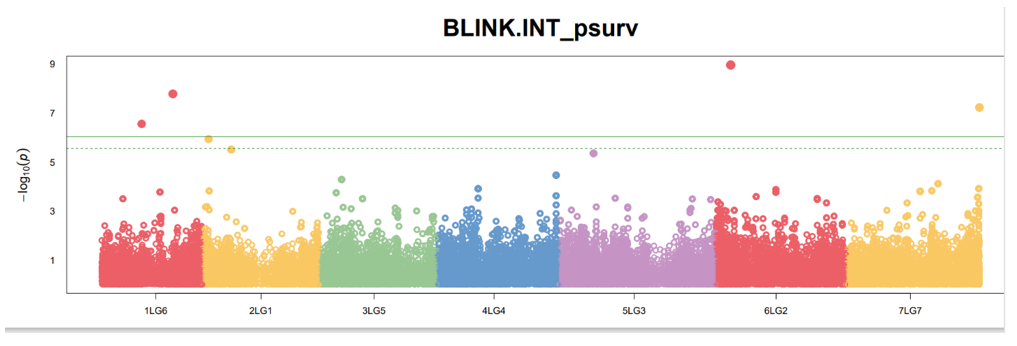
Figure 5. Manhattan plot for INT-transformed survival from genome-wide association analysis using the BLINK model (0 PCs; λ = 1.151). The horizontal lines indicate the Bonferroni significance threshold (solid; p < 9.21 × 10⁻⁷) and suggestive threshold (dashed; p < 1.84 × 10⁻⁵). Significant SNPs are highlighted above the threshold across chromosomes 1LG6, 6LG2, and 7LG7.
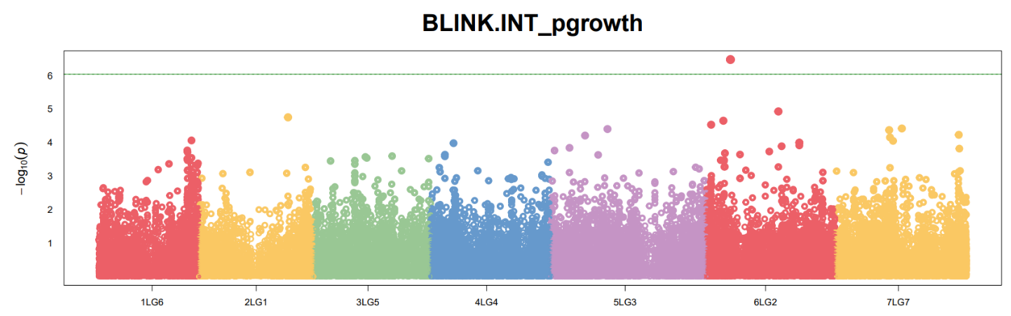
Figure 6. Manhattan plot of genome-wide association results for INT-transformed growth score (BLINK, 2 PCs; λ = 1.006). The solid horizontal line indicates the Bonferroni-corrected significance threshold (p < 9.21 × 10⁻⁷). One significant SNP was identified on chromosome 6LG2.
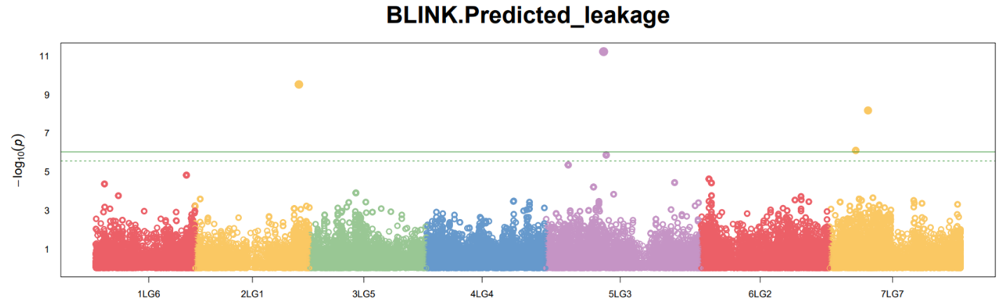
Figure 7. Manhattan plot of genome-wide association results for predicted ion leakage (BLINK, 0 PCs; λ = 1.048). The solid horizontal line indicates the Bonferroni-corrected significance threshold (p < 9.21 × 10⁻⁷). Three significant SNPs were identified across chromosomes 5LG3 and 7LG7.
|
Table 4. Significant SNP associations identified by genome-wide association analysis for freezing tolerance traits in pea (Pisum sativum L.). Associations were detected using BLINK (0 PCs for survival and ion leakage; 2 PCs for growth score) with Bonferroni-corrected significance threshold (p < 9.21 × 10⁻⁷). SNP, single nucleotide polymorphism; Chr, chromosome; Pos, physical position (bp); P-value, association p-value; MAF, minor allele frequency; R², proportion of phenotypic variance explained (%); Allele Effect, estimated effect of the minor allele on the trait; Traits, INT-transformed phenotypic values derived from BLUPs. |
||||||||
|
PC |
SNP |
Chr |
Pos |
P.value |
MAF |
R2 |
Allele Effect |
traits |
|
2 |
S6LG2_90910213 |
6LG2 |
90910213 |
3E-07 |
0.28 |
3.36 |
-0.09 |
INT transformed growth |
|
0 |
S5LG3_215946744 |
5LG3 |
2.16E+08 |
6E-12 |
0.19 |
17.41 |
-2.59 |
Predicted leakage |
|
0 |
S7LG7_98964498 |
7LG7 |
98964498 |
8E-07 |
0.37 |
0.14 |
0.18 |
Predicted leakage |
|
0 |
S7LG7_144955735 |
7LG7 |
1.45E+08 |
7E-09 |
0.09 |
13.34 |
-4.42 |
Predicted leakage |
|
0 |
S1LG6_147015836 |
1LG6 |
1.47E+08 |
3E-07 |
0.18 |
10.18 |
7.90 |
INT transformed survival |
|
0 |
S1LG6_261934321 |
1LG6 |
2.62E+08 |
2E-08 |
0.19 |
29.46 |
13.23 |
INT transformed survival |
|
0 |
S6LG2_54562362 |
6LG2 |
54562362 |
1E-09 |
0.47 |
4.28 |
3.99 |
INT transformed survival |
|
0 |
S7LG7_491005020 |
7LG7 |
4.91E+08 |
6E-08 |
0.13 |
29.12 |
15.38 |
INT transformed survival |
3.3. Linkage Disequilibrium Decay
Linkage disequilibrium decay was assessed across all seven pea chromosomes using PopLDdecay with a minor allele frequency threshold of 0.05. Across chromosomes, r² declined rapidly over short physical distances. Initial r² values at short distances ranged from approximately 0.27 to 0.32 across chromosomes, and background LD levels of r² ≈ 0.07–0.10 were reached at approximately 75–100 Kb in all chromosomes (Figure 18). The overall consistency of LD decay patterns across chromosomes suggested that a uniform ±100 Kb window would be appropriate for candidate gene identification surrounding significant GWAS loci.

Figure 8. Linkage disequilibrium (LD) decay curves for two pea (Pisum sativum L.) chromosomes estimated using PopLDdecay (MAF ≥ 0.05). The blue line represents pairwise r² values between SNPs plotted against physical distance (Kb), and the red line represents a LOESS-smoothed decay curve. Background LD levels (r² ≈ 0.07–0.10) were reached at approximately 75–100 Kb across all chromosomes.
3.4. Candidate Genes
A total of 39 candidate genes were identified within LD blocks surrounding the eight significant SNPs across six chromosomes, using a ±100 Kb window (200 kb total) and r² ≥ 0.2 threshold (Table 5). Candidate genes span a range of putative functional categories relevant to the freezing stress response, including membrane stability, cold-responsive signaling, transcriptional regulation, and stress metabolism — biological processes consistent with the freezing tolerance phenotypes assayed in this study. These candidate genes will be cross-referenced with differentially expressed genes from planned RNA-seq experiments to prioritize high-confidence causal loci underlying freezing tolerance in pea.
|
Table 5. Candidate genes identified within ±100 Kb windows surrounding significant GWAS SNPs in pea (Pisum sativum L.). Putative functions were assigned based on BLASTp alignment against Medicago truncatula and Glycine soja/max protein databases. NA indicates no significant BLAST hit was identified. |
|||||
|
Chromosme Linkage group |
SNP |
Trait |
Gene ID |
Gene information |
Reference organism |
|
1 LG6 |
147015836 |
Survival |
Psat1g088720 |
transcription factor MYB54 |
M. truncatula |
|
1LG6 |
261934321 |
Survival |
Psat1g131640 |
uncharacterized zinc finger CCHC domain-containing protein At4g19190 isoform X1 |
M. truncatula |
|
|
|
|
Psat1g131680 |
disease resistance protein (TIR-NBS-LRR class), putative |
M. truncatula |
|
|
|
|
Psat1g131720 |
serine/threonine-protein kinase tricornered isoform X1 |
M. truncatula |
|
|
|
|
Psat1g131760 |
— |
— |
|
|
|
|
Psat1g131800 |
— |
— |
|
|
|
|
Psat1g131840 |
— |
— |
|
|
|
|
Psat1g131880 |
— |
— |
|
5LG3 |
215946744 |
Ion leakage |
Psat5g121480 |
F-box/LRR protein |
M. truncatula |
|
|
— |
— |
Psat5g121520 |
— |
— |
|
|
— |
— |
Psat5g121560 |
F-box/LRR protein |
M. truncatula |
|
|
— |
— |
Psat5g121600 |
F-box/LRR protein |
M. truncatula |
|
|
— |
— |
Psat5g121640 |
uncharacterized protein |
M. truncatula |
|
|
— |
— |
Psat5g121680 |
— |
— |
|
6LG2 |
54562362 |
Survival |
Psat6g054000 |
— |
— |
|
|
— |
— |
Psat6g054040 |
serine/threonine-protein kinase 19 |
M. truncatula |
|
|
— |
— |
Psat6g054080 |
dolichyl-diphosphooligosaccharide--protein glycosyltransferase subunit 2 |
M. truncatula |
|
|
— |
— |
Psat6g054120 |
sulfite reductase [ferredoxin], chloroplastic |
M. truncatula |
|
6LG2 |
90910213 |
Growth |
Psat6g071720 |
29 kDa ribonucleoprotein A, chloroplastic |
M. truncatula |
|
|
— |
— |
Psat6g071760 |
protein CNGC15a (cyclic nucleotide-gated ion channel) |
M. truncatula |
|
7LG7 |
144955735 |
Ion leakage |
Psat7g086600 |
putative tetratricopeptide-like helical domain-containing protein |
M. truncatula |
|
|
— |
— |
Psat7g086640 |
V-type proton ATPase subunit F |
M. truncatula |
|
|
— |
— |
Psat7g086680 |
uncharacterized protein / zinc finger C2HC domain-containing |
M. truncatula |
|
|
— |
— |
Psat7g086720 |
RING-finger ubiquitin ligase |
M. truncatula |
|
7LG7 |
491005020 |
Survival |
Psat7g264640 |
protein HIGH CHLOROPHYLL FLUORESCENCE PHENOTYPE 173, chloroplastic |
M. truncatula |
|
|
— |
— |
Psat7g264680 |
organic cation/carnitine transporter 7 |
M. truncatula |
|
|
— |
— |
Psat7g264720 |
YTH domain-containing protein ECT1 isoform X1 |
M. truncatula |
|
|
— |
— |
Psat7g264760 |
protein STRUBBELIG-RECEPTOR FAMILY 5 / LRR-V family kinase |
M. truncatula |
|
|
— |
— |
Psat7g264840 |
— |
— |
|
|
— |
— |
Psat7g264880 |
beta-amyrin synthase |
M. truncatula |
|
7LG7 |
98964498 |
Ion leakage |
Psat7g058720 |
60S acidic ribosomal protein P3-like |
G. soja |
|
|
— |
— |
Psat7g058760 |
pentatricopeptide repeat-containing protein At1g13040, mitochondrial |
M. truncatula |
|
|
— |
— |
Psat7g058800 |
NDR1/HIN1-like protein 6 / LEA-14 |
M. truncatula |
|
|
— |
— |
Psat7g058840 |
paramyosin |
M. truncatula |
|
|
— |
— |
Psat7g058880 |
uncharacterized protein |
G. max |
|
|
— |
— |
Psat7g058920 |
E3 ubiquitin-protein ligase RGLG5 |
M. truncatula |
|
|
— |
— |
Psat7g058960 |
uncharacterized protein |
G. max |
|
|
— |
— |
Psat7g059000 |
protein SIEVE ELEMENT OCCLUSION B |
M. truncatula |
|
|
— |
— |
Psat7g059040 |
transmembrane protein |
M. truncatula |
late embryogenesis abundant; CNGC, cyclic nucleotide-gated channel; LRR, leucine-rich repeat; PPR, pentatricopeptide repeat.
4. Discussion
This study presents a comprehensive GWAS for three freezing tolerance-related traits in a diverse panel of 295 pea accessions, employing rigorous model selection, LD-informed candidate gene identification, and cross-model validation. The findings contribute new insights into the genetic architecture of freezing tolerance in pea and provide a prioritized list of candidate loci for functional follow-up. The accessions had a wide distribution of the phenotype and some accessions superior to the top checks (supplemental table 2) suggesting that current cultivar can be improved using the genes and the superior accessions identified in this study.
Functional annotation of candidate genes within LD blocks surrounding the eight significant SNPs revealed several genes with putative roles in stress response, signal transduction, and cellular maintenance relevant to freezing tolerance. Among the most biologically compelling candidates is a cyclic nucleotide-gated ion channel gene (CNGC15a; Psat6g071760) identified in the LD block surrounding the ion leakage-associated SNP on chromosome 6LG2. CNGC family members are known to be involved in the uptake of cations such as Na⁺, K⁺ and Ca²⁺ and regulate plant growth and development, with their role implicated in providing tolerance to biotic and abiotic stresses including cold (Jha et al., 2016). CNGC genes play an important function in calcium-mediated development and cold response in plants, with multiple CNGC family members showing significant upregulation under low-temperature stress (Y. Zhang et al., 2023). The identification of CNGC15a here is particularly noteworthy given that ion leakage directly measures membrane integrity under freezing stress, suggesting a mechanistic link between this locus and the observed phenotypic variation.
Also in the chromosome 6LG2 ion leakage locus, a glutathione S-transferase DHAR3 gene (Psat5g121240) was identified in the LD block of the ion leakage SNP on chromosome 5LG3. Dehydroascorbate reductase (DHAR) and monodehydroascorbate reductase play crucial roles in regenerating ascorbate for maintenance of ROS scavenging ability, and transgenic plants co-overexpressing both genes showed activated expression of antioxidant enzymes and enhanced freezing tolerance (Shin et al., 2013). Overexpression of DHAR in chloroplasts enhanced both salt and cold tolerance, demonstrating the importance of the ascorbate-glutathione antioxidant cycle in protecting plants against freezing-induced oxidative damage (Martret et al., 2011).
Additionally, two genes encoding Late Embryogenesis Abundant (LEA)-like proteins (NDR1/HIN1-like protein 6; Psat7g058800 and Psat6g054480) were identified in LD blocks on chromosomes 7LG7 and 6LG2. Abiotic stresses such as cold and freezing temperatures produce cellular water deficit, leading to the accumulation of LEA proteins in vegetative tissues, with this response reported in legumes including Medicago truncatula seedlings (Battaglia & Covarrubias, 2013). Several LEA proteins interact with biological membranes and stabilize them during water stress in vivo, with membrane protection demonstrated under freezing conditions (Hernández-sánchez et al., 2022). Furthermore, a 29 kDa chloroplastic ribonucleoprotein gene (Psat6g071720) was identified in the LD block of the growth score-associated SNP on chromosome 6LG2. The Arabidopsis chloroplast RNA-binding proteins CP29A and CP31A, corresponding to 29 kDa and 31 kDa chloroplast proteins respectively, associate with large sets of chloroplast transcripts and are essential for resistance of chloroplast development to cold stress, being required to guarantee transcript stability of numerous mRNAs at low temperatures (Kupsch et al., 2012).
Several additional candidate genes implicate stress signaling, energy sensing, and antioxidant defense pathways in the freezing tolerance response. Two protein phosphatase 2C genes (PP2C56; Psat1g131520 and Psat1g131560) and a mitogen-activated protein kinase gene (MKK2; Psat1g131480) were co-located in the LD block of the survival-associated SNP on chromosome 1LG6, suggesting a convergent signaling hub at this locus. PP2C proteins serve as key regulators across multiple signaling pathways, influencing plant stress responses through interactions with SnRK2s, ABA receptors, transcription factors, and ion channels, thereby fine-tuning signaling cascades and physiological adaptations under stress(Ghanizadeh et al., 2025). MKK2 is specifically activated by cold and salt stress in Arabidopsis, with MKK2-overexpressing plants exhibiting increased freezing tolerance while mkk2 null mutants are hypersensitive to cold stress (Teige et al., 2004). Notably, the co-occurrence of PP2C and MKK2 candidate genes at the same locus is biologically coherent, as PP2C-SnRK-MKK signaling modules are known to interact in coordinating ABA and stress responses. A SNF1-related protein kinase regulatory subunit gene (Psat7g265320) was identified in the LD block of the survival-associated SNP on chromosome 7LG7. The evolutionarily conserved SnRK1 kinase complex is a key regulator adjusting cellular metabolism during starvation and stress conditions, acting as a central integrator of energy signaling between different organelles (Wurzinger et al., 2018). SNF1-related protein kinases play a vivid role in regulating plant metabolism and stress response, providing a pathway for regulation between metabolism and stress signals, with cold stress-induced expression profiles documented across plant species (Li et al., 2022). Multiple F-box/LRR proteins in the chromosome 5LG3 ion leakage locus suggest involvement of the ubiquitin-proteasome pathway in protein quality control under stress. Beta-amyrin synthase and beta-amyrin 11- oxidase genes at the chromosome 7LG7 survival locus point to a potential role for triterpenoid biosynthesis in membrane lipid composition and stress protection. Collectively, these candidate genes span biologically coherent functional categories, ion homeostasis, ROS detoxification, membrane protection, ABA-MAPK signaling, energy sensing, and protein quality control, providing a plausible and comprehensive mechanistic picture of the molecular basis of freezing tolerance variation in pea. Validation through planned RNA-seq experiments will be essential to prioritize causal genes from this candidate list.
Future work should prioritize: (1) RNA-seq validation of candidate genes identified in this study; (2) fine-mapping of the most robust loci, particularly the multi-model ion leakage locus, using denser genotyping or targeted resequencing; (3) haplotype analysis to identify favorable allele combinations for genomic selection or marker-assisted breeding; and (4) functional characterization of top candidate genes through approaches such as gene expression analysis, protein interaction studies, or genome editing in model systems. Together, these efforts will advance the understanding of freezing tolerance mechanisms in pea and support the development of winter-hardy varieties.
Project II
Field Biomass Production
A significant genotype × location interaction affected dry biomass yield (Variety × Location; Table 6), indicating that the relative performance of entries was not consistent across the two field environments. Consequently, results were interpreted separately by location.
At Freeville, C1C produced the highest biomass (1,773 kg/ha), which was significantly greater than all other entries (Tukey’s HSD, P < 0.05; Table 7). C2C, ND Gardener, formed a shared group with intermediate means (1,030–1,100 kg/ha), followed by Arostook, C1F, 24NYCRL, and C0, which were not significantly different from each other. Notably, C1C represented a 201% increase in biomass over the base population C0 (587.9 kg/ha), demonstrating a strong response to one cycle of controlled-environment selection.
At Willsboro, overall biomass was substantially reduced across all entries, reflecting the harsher winter conditions at this northern site. C1C again produced the numerically highest mean (161.2 kg/ha), though confidence intervals overlapped considerably with those of other entries. C0 had the lowest estimated mean (21.0 kg/ha). All Willsboro entries shared overlapping groupings (groups CDE through E), and no entry was statistically distinguishable from the others at this location, likely reflecting increased variability associated with winterkill under extreme conditions.
These results suggest that selection for cold germination and vigor in controlled environments (C1C) translated into improved field performance, at least under moderate winter stress. The divergent responses across locations underscore the importance of multi-environment testing when evaluating winter-hardiness traits.
Table 6. ANOVA results for dry biomass yield (kg/ha) using Type III Analysis of Variance with Satterthwaite’s method.
|
Source |
Sum Sq |
Mean Sq |
NumDF |
DenDF |
F value |
P (>F) |
|
Variety |
2,524,566 |
360,652 |
7 |
42 |
5.903 |
0.0001 *** |
|
Location |
10,261,965 |
10,261,965 |
1 |
42 |
167.973 |
< 0.0001 *** |
|
Variety × Location |
1,497,789 |
299,558 |
5 |
42 |
4.903 |
0.001 ** |
Table 7. Estimated marginal means for dry biomass (kg/ha) by variety and location with Tukey-adjusted pairwise groupings (alpha = 0.05). Entries sharing a letter are not significantly different.
|
Variety |
Location |
Emmean (kg/ha) |
SE |
Lower CL |
Upper CL |
Group |
|
C1C |
Freeville |
1773.0 |
124 |
1523.6 |
2022 |
A |
|
C2C |
Freeville |
1099.7 |
124 |
850.3 |
1349 |
B |
|
ND Gardener |
Freeville |
1091.9 |
124 |
842.5 |
1341 |
B |
|
24NYCRE |
Freeville |
1030.2 |
124 |
780.8 |
1280 |
B |
|
Arostook |
Freeville |
779.5 |
124 |
530.1 |
1029 |
BC |
|
C1F |
Freeville |
723.1 |
124 |
473.7 |
973 |
BCD |
|
24NYCRL |
Freeville |
704.7 |
124 |
455.3 |
954 |
BCD |
|
C0 |
Freeville |
587.9 |
124 |
338.5 |
837 |
BCDE |
|
C1C |
Willsboro |
161.2 |
124 |
-88.2 |
411 |
CDE |
|
Arostook |
Willsboro |
115.4 |
124 |
-134.0 |
365 |
DE |
|
ND Gardener |
Willsboro |
79.2 |
124 |
-170.2 |
329 |
E |
|
C2C |
Willsboro |
78.6 |
124 |
-170.8 |
328 |
E |
|
C1F |
Willsboro |
51.2 |
124 |
-198.2 |
301 |
E |
|
C0 |
Willsboro |
21.0 |
124 |
-228.4 |
270 |
E |
4.2 Cold Germination Under Controlled Environment Conditions
Total germination in the first three days (a proxy for cold germination rate) differed significantly among varieties in the thermogradient table experiment (Table 8). ND Gardener, C1C, and Arostook exhibited the highest germination counts (17.8–18.5 plants), which were statistically equivalent and grouped together (group A). C2C followed with a mean of 13.0 plants and was not significantly different from the group A entries. In contrast, C0 and C1F showed substantially lower germination (7.0 and 6.5 plants, respectively) and were grouped together as group B, performing significantly worse than ND Gardener, C1C, and Arostook.
The superior cold germination of C1C relative to C0 is consistent with its strong field biomass performance and reflects a meaningful response to controlled-environment selection. Interestingly, C1F (field-selected) showed no improvement over C0 and was among the lowest performers in the germination test, suggesting that one cycle of field selection at a single site may not have been sufficient to shift germination under cold stress.
The strong performance of C2C in both germination and biomass (particularly at Freeville) suggests that multiple cycles of controlled-environment selection may progressively improve cold tolerance. The high cold germination rate of the commercial check ND Gardener confirms its reputation as a cold-adapted cultivar and provides a relevant benchmark for evaluating selection progress. The fact that C1C matched or approached ND Gardener in both germination and Freeville biomass after only one cycle of controlled-environment selection is encouraging and supports the viability of thermogradient-based recurrent selection as a breeding strategy for cold germination improvement.
Table 8. Estimated marginal means for total plants germinated in the first 3 days under cold-stress conditions (thermogradient table), with Tukey-adjusted pairwise groupings (alpha = 0.05).
|
Variety |
Emmean |
SE |
df |
Lower CL |
Upper CL |
Group |
|
ND Gardener |
18.5 |
2.12 |
5.59 |
13.22 |
23.8 |
A |
|
C1C |
17.8 |
2.12 |
5.59 |
12.47 |
23.0 |
A |
|
Arostook |
17.8 |
2.12 |
5.59 |
12.47 |
23.0 |
A |
|
C2C |
13.0 |
2.12 |
5.59 |
7.72 |
18.3 |
A |
|
C0 |
7.0 |
2.12 |
5.59 |
1.72 |
12.3 |
B |
|
C1F |
6.5 |
2.12 |
5.59 |
1.22 |
11.8 |
B |
4.3 Response to Selection
Comparing estimated marginal means to the base population (C0), the response to selection was most pronounced for C1C across both field biomass and cold germination. At Freeville, C1C yielded 1,185 kg/ha more biomass than C0 (R = +1,185 kg/ha), while C2C yielded 512 kg/ha more (R = +512 kg/ha) and C1F yielded 135 kg/ha more (R = +135 kg/ha). For cold germination, C1C and C2C showed gains of approximately +10.8 and +6.0 plants over C0 in the first three days, respectively, while C1F showed minimal gain (+0.5 plants).
These patterns collectively indicate that controlled-environment selection using a thermogradient table was more effective than a single cycle of field selection for improving cold germination and cold-season biomass production. The thermogradient approach offers tighter control over temperature stress and allows for high selection intensity in a short timeframe, which likely contributed to its efficiency. Future work should evaluate whether the gains observed after two controlled-environment cycles (C2C) are retained across additional locations and years, and whether further selection cycles continue to yield genetic gains without sacrificing other agronomic traits.
This grant supported two projects with a shared goal: improving the cold-season reliability of winter cover crops and grain legumes for northeastern U.S. farmers, where poor germination and freezing injury routinely cause stand failures and limit adoption.
Winter pea offers northeastern farmers a high-value, nitrogen-fixing grain and cover crop option, but freezing injury has prevented reliable production. We sought to identify which accessions in the USDA germplasm collection survive freezing better than current commercial cultivars, and to find genetic markers that breeders can use to select for freezing tolerance more efficiently. We screened 295 diverse accessions under controlled freezing at −12°C, measuring survival, regrowth, and cell membrane damage. We identified eight genetic markers associated with these traits — two of which each explained roughly 29% of variation in plant survival, which is notably large for a complex trait. More practically, several accessions from the germplasm collection outperformed current commercially available winterhardy cultivars (WyoWinter, Blaze, and Survivor) across every trait measured. These markers and superior accessions now give breeders the tools to develop improved winter pea varieties through marker-assisted selection — a faster, more precise approach than field trialing alone.
Late planting of cereal rye is common in northeastern rotations, yet poor cold-temperature germination and growth makes rye establishment unreliable. We asked two questions: can thermogradient table selection achieve a stronger response than field-based selection for cold germination traits, and is the existing germplasm — crosses between allelopathic and northern-adapted lines — promising enough to continue toward cultivar release? The answer to both appears to be yes. After one cycle of thermogradient selection, the resulting population (C1C) produced 201% more biomass than the base population at Freeville and matched ND Gardener — a leading cold-adapted commercial cultivar — in cold germination rate. By contrast, one cycle of field selection produced little measurable gain, confirming that thermogradient-based selection is the more efficient method. The germplasm itself also showed clear potential: C1C and the second-cycle population (C2C) both outperformed the unselected base material meaningfully, suggesting the crosses carry sufficient genetic variation to support continued selection cycles and, ultimately, cultivar release. One important caveat is that gains at the harsher Willsboro site were relatively lower than moderate-winter Freeville site, underscoring that multi-environment testing will be essential before any release. These populations will continue through additional thermogradient selection cycles and broader field evaluation as cultivar candidates, with the end goal of releasing varieties that give northeastern farmers more reliable establishment under late planting and cold conditions.
Overall, both projects met their core objectives. In cereal rye, we confirmed that thermogradient selection outperforms field selection and that the germplasm supports continued improvement toward cultivars with more reliable late-planting establishment. In winter pea, we identified accessions outperforming all current commercial cultivars and provided breeders with genetic markers to accelerate variety development. Continued selection and multi-environment testing in both crops represent the clearest path to translating these results into cultivars that northeastern farmers can plant with confidence.
Education & outreach activities and participation summary
Participation summary:
The preliminary findings from this study were shared in American Society of Agronomy, Crop Science Society of America, Soil Science Society of America (Tri-Societies) Annual Meeting, National Association of Plant Breeders Annual Meeting 2026, Cornell University Cover Crop Field Day, and Cornell Willsboro Research Farm Field Day in 2025.
Cornell experimental stations host an annual ‘Cornell Seed Growers Field Day’ and ‘Field Crops Field Day’. We will conduct a similar demonstration, handouts, and brief oral presentations for these events in 2026. To ensure that the research insights reach the farming community, the study will be presented at various farmer meetings, including the New York Certified Organic Field Crops (NYCO) Annual Meeting, and Northeast Cover Crop Council (NECCC) Annual Meeting. These platforms will allow the project team to directly engage with farmers, share the findings, and gather valuable feedback to further refine the research and its practical applications. In addition to the outreach efforts targeting the farming community, the research findings will also be shared with the broader scientific community, such as Cover Crop Breeding Network Annual Meeting.
The findings of both studies will be submitted to relevant and high-impact journals such as Crop Science, which will ensure that the research findings are widely disseminated and accessible to the crop science and genetics community. By leveraging this diverse set of dissemination channels, the research team can effectively reach a broad audience, including researchers, industry professionals, and farmers. This comprehensive outreach plan will ensure that the findings from this study have a significant impact on the advancement of cover crop research and adoption, ultimately contributing to the development of more resilient and sustainable agricultural systems.
Project Outcomes
This project addresses cold germination and freezing tolerance in cereal rye and field pea — traits that limit how reliably these cover crops establish and survive winter in the Northeast. Improving these traits allows growers to plant cereal rye later in the fall while still establishing sufficient cover, extending the window for cash crop harvest without sacrificing cover crop benefits.
We screened 295 pea accessions for freezing tolerance at -12°C, identifying ~30 superior cold-tolerant accessions and 8 associated molecular markers. These give breeding programs selectable targets to develop winter-hardy pea cultivars more efficiently than phenotypic selection alone. Because pea fixes nitrogen, a hardier pea that survives winter and produces more biomass will fix more nitrogen, directly reducing the synthetic nitrogen needed by the following cash crop — the basis of the economic benefit to farmers.
For cereal rye, two cycles of controlled-environment selection plus one field cycle produced a population (C1C) with significantly higher cold-season biomass than the unselected base — a 201% increase at our Freeville site, though gains were not statistically distinguishable at our harsher Willsboro site (see Results). This shows selection for cold germination and vigor can translate into real field gains in moderate winter conditions, even under a shortened, later-planted establishment window — while highlighting that extreme-winter performance needs further work.
Together, a more vigorous, later-plantable cereal rye and a more winter-hardy, nitrogen-fixing pea offer farmers:
- Economic: lower N fertilizer costs, more flexible harvest-to-planting timing, more reliable stand establishment (less reseeding).
- Environmental: sufficient ground cover even with later planting, reduced erosion and nutrient runoff, increased soil organic matter, lower N-related carbon footprint.
- Social: publicly available germplasm and markers that support more resilient cropping systems for growers in cold climates.
We found that growth stage has a major impact on freezing tolerance, and that freezing duration matters more than the temperature itself in determining survival and damage. This reframed how we think about designing a controlled-environment assay — rather than treating it as a fixed protocol, the growth stage and the length of cold exposure need to be deliberately matched to field conditions for the results to be more precise predictors of field performance. We now see value in testing across growth stages, wide range of genotypes and exposure durations to identify the conditions that best correlate with field cold response — which directly motivates the next phase of this research.
Future direction: I plan to study how growth stage and freezing duration (alongside light intensity) affect freezing tolerance, to identify the exposure conditions that best predict field cold performance across a wide of management practices, genotypes, and plant developmental phases. I'm also interested in developing a protocol that effectively mimics field freeze/thaw cycles and selecting for this trait in a controlled environment. Longer-term, I intend to keep working at the intersection of cold-tolerance breeding and cover crop agronomy to make winter-hardy cover cropping more reliable for Northeast growers.
Research generated: A study comparing the performance of controlled-environment-selected superior genotypes against their field performance, to determine how strongly the two are correlated.