Progress report for GNE24-335
Project Information
Drought events in the Northeastern United States are projected to become more frequent putting crops at greater risk of yield loss and increased mycotoxin contamination. Drought stress can directly affect maize (Zea mays) production, reducing kernel set and ear size. An increase in maize susceptibility to disease that involves hot and dry conditions, favor pathogenic and mycotoxigenic fungi from the genus Fusarium, the causal agents of stalk and ear rots (F. verticillioides and F. subglutinans). These fungi also produce mycotoxins which put human and livestock health at risk. To reduce disease and mycotoxin contamination from Fusarium pathogens, transgenic Bt-maize is used, which reduces pest pressure and opportunities for infection of ears and stalks. However, previous studies have demonstrated that Fusarium pathogens and mycotoxin producers can colonize maize leaves asymptomatically and produce mycotoxins even when no disease is visually present and therefore can potentially contribute to the contamination of silage for feed. Silage is a fermented feed product made from chopped ground stalk, ear, and leaf tissue and is at high risk of mycotoxin contamination from Fusarium when infection is high in harvested plant material. It is unclear how drought stress shapes Fusarium spp. in maize leaves, especially pathogenic and mycotoxigenic species. This is critically important for regional maize silage producers who may be disproportionately affected throughout the Northeast by changes in foliar Fusarium spp. communities. This research aims to determine how drought stress shapes foliar pathogenic and mycotoxigenic Fusarium spp. in maize.
1. To determine the interaction between host development, drought stress events, and
Fusarium spp. fungal communities of maize.
a. Assess how the Fusarium spp. community of maize leaves changes across drought exposure events pre- and post-flowering.
b. Assess the effect of drought exposure pre- and post-flowering on the functional composition of Fusarium spp. communities.
c. Assess the effect of drought exposure pre- and post-flowering on Fusarium spp. communities at harvest for silage.
2. To reveal the interaction between drought stress events and pathogenic and mycotoxigenic Fusarium spp. in maize at harvest for silage.
3. To quantify the effect of host genotype and drought on the foliar Fusarium spp. community.
The purpose of this project is to understand the ability of pre- and post-flowering drought stress events to shape the Fusarium spp. community of maize leaves, with a focus on maize pathogens and mycotoxin-producing species. Drought is a serious concern for maize (Zea mays) production in the Northeast50. Climate projections suggest regional drought events will become more frequent which is a problem for maize farmers, but also the regional economy7,53,57. When a maize plant experiences drought stress through various growth stages, it results in significant yield loss20,40, increased disease severity24, and mycotoxin contamination in silage and grain27,35. Silage is a critical feed source in the dairy industry, which plays a vital role in Northeast agriculture and economy. Northeastern states like New York and Pennsylvania, are top dairy producers in the US, where 70% of feed comes from on-farm or regional maize production9,54. Management for disease and mycotoxin contamination largely focusses on conventional growers with the use of Bt-maize varieties (transgenic maize that produces a protein toxic to arthropod pests originally found in the soil bacterium Bacillus thuringiensis16) against pests, and the application of pesticides and fungicides. However, these approaches are not viable for organic producers and increased tolerance of pests to Bt-maize and fungicide resistance development concerns mean that long term sustainable management requires new tools and an understanding of how environmental factors, like drought, shape pathogen communities3,5,15,51.
Drought events are known to increase pathogen colonization and mycotoxin levels in seed and silage27,28. Mycotoxins are metabolites produced by some fungi that are toxic to humans and other animals when ingested35. For example, of regional importance are the mycotoxins deoxynivalenol (DON) and the fumonisins, produced by the stalk and ear rot pathogens Fusarium graminearum and F. verticillioides respectively. Ingestion of DON causes vomiting, immune dysfunction, and organ damage, which can lead to death, poor development, and reduced meat quality in livestock11,17. Fumonisins are also associated with esophageal and liver cancers in humans14,29. Increased seasonal drought events and potential impacts on yield and mycotoxin contamination require a greater understanding of how drought stress events across host development shape the Fusarium spp. community in maize.
Drought events and their effects on maize are characterized by their timing in maize development, duration, and intensity, where timing can have the greatest negative effect on grain and silage quality. For example, drought exposure is considered the most dangerous to production two weeks before and after pollination, when water deficit can cause poor fertilization, leading to reduced kernel count and improper kernel development4. Drought events can also shape the quality of silage. Silage fermentation relies on a balance of fiber, water, starch, and protein in maize biomass, which drive the growth of aerobic bacteria responsible for fermentation26,59. Drought stress at vegetative development has been shown to decrease shoot biomass and water content, and increase simple sugars of pre-fermented silage, and decrease protein and fiber post ferment, resulting in a lower nutrient dense feed31,59.
Drought stress also increases plant susceptibility to disease at a chemical and physiological level, favoring pathogens that thrive under dry and hot conditions, such as F. verticillioides32,36,47. In maize, drought increases stalk and ear rot severity and incidence by Fusarium spp. pathogens and mycotoxin contamination of seed and silage33,41,48. Drought shapes the pathogenic and mycotoxigenic taxa in maize stalks and ears during periods of drought pre- and post-flowering42,45. However, research has yet to address how drought shapes colonization of maize leaves by these important taxa. This is especially critical because leaf tissue contributes biomass to silage, and subsequent pathogenic and mycotoxigenic Fusarium spp. colonization18,25,55,56. It is known that drought directly effects leaf physiology, increasing stomatal density creating greater opportunity for fungal colonization suggesting that drought timing in host development may contribute to establishment of Fusarium spp.47. Previous work in sorghum leaf fungal communities has demonstrated that drought pre-flowering increases Fusarium taxa and pathogen abundance more than drought post flowering, suggesting that drought timing may shape foliar maize colonization by Fusarium spp.12. Extreme weather events, such as drought have increased across maize producing regions of the Northeast and are projected to continue to increase into the future50,53. It is critical to the success of sustainable maize and livestock production that we learn, test, and inform growers on how these drought events will shape the pathogenic and mycotoxigenic Fusarium spp. of maize. I hypothesize that drought stress pre- and post-flowering will have differing effects on pathogenic and mycotoxigenic Fusarium spp. colonization of maize leaves effects because of drought on leaf physiology.
Research
Financial support was needed from this grant to hire an undergraduate student to assist in the field. The student assisted Chelsea with travel to the field, drought stress assessments, and leaf sample collection, from June through August 2025.
Field Site and Treatments
To address objectives 1, 2, and 3 a high tunnel drought study was conducted from May to September 2025 at the Russell E. Larson Agricultural Research Center at Rock Springs in Centre County, Pennsylvania, United States. Annual precipitation at Rock Springs in 2025 between May and September was 0.16 inches, with an average seasonal temperature of 18.9°C, and humidity of 89.6% (USDA-NRCS-NWCC, network = SCAN, station = 2036).
Plant material was gathered from 4 high-tunnels, each 30ft x 90ft, fitted with permanent plastic sheeting on the sides, and plastic covers on the roof that could be closed and opened for rain exclusion (greenhouse roll up sides, Advancing Alternatives, Lancaster, PA). Seed was sewn on May 25, 2025 in 10 rows per tunnel with 30-inch row spacing of alternating varieties; Organic Blue River 24-01P and 42C87 (Albert Lea Seed, Albert Lea, MN) dual-purpose (grain and silage) hybrids.
The project originally proposed to use 3 high tunnels, for which the third was intended to be split across the middle for drought controls. A fourth tunnel was made available by research farm renovations in 2024 of an older set of high tunnels that were inoperable at the time the proposal was written. Additionally, the previously proposed tunnels, 36ft x 25ft, were ultimately too small to adequately accommodate the project. The use of larger runnels and the additional 4th tunnel allowed for greater sampling randomization and flexibility across the season. Costs incurred for the additional tunnel and costs for seed were covered by Dr. Gretchen A. Kuldau.
Sampling was conducted in a completely randomized block design, blocked by distance to the opening of each tunnel face, with three 30ft x 30ft blocks per tunnel. Tunnels prior to this study were fallow for >5 years. Before planting, weeds were killed by herbicide burndown.
Drought treatments were assigned to tunnels at random: pre-flowering, post-flowering, and 0% and 100% drought controls. All plants were allowed to reach the V4 growth stage (4th fully emerged leaf) before treatment initiation. Treatments were initiated by covering the top of the tunnels with plastic sheeting continuously for the duration of each treatment time. The 100% drought control was covered for the total duration of the study, the 0% drought control was left open, the pre-flowering drought tunnel was covered from V4 to phenological stage VT (tasseling), and the post-flowering drought tunnel was covered from stage R1/R2 (kernel milk) to the end of the study.
Drought Stress and Soil Moisture
Drought stress was measured weekly starting at V4 and soil moisture content (SMC) weekly starting at 3 weeks post planting, then continuously until plants reached harvestability for silage (average 45% kernel moisture September 16, 2025), and twice post-sampling in the post-flowering drought and control treatments.
Drought was assessed using chlorophyll, nitrogen, and leaf relative water content (LRWC). Paired t-tests (α=0.05) were applied to determine significant differences between stress measurements of the 0% drought control and respective drought treatments. A significant decrease in at least one drought stress metric signaled that drought had been reached in the treatment tunnel.
A SPAD meter (GOYOJO Chlorophyll Analyzer, Hong Kong) was used to estimate chlorophyll and nitrogen leaf content. Measurements were taken at each row in every block from two randomly selected plants, for a total of 20 measurements per block and time point. From each plant, SPAD readings were collected at the midpoint of the youngest fully expanded leaf (before VT) or the ear leaf (after VT), between the midrib and the leaf margin (Earl and Tollenaar, 1997; Rostami et al., 2008).
A protocol adapted from Zhan and Lynch (2015) was used to calculate LRWC, in which a leaf disc, collected with a hole punch (25-inch diameter) was taken from each SPAD measurement point. Leaf discs were pooled by variety, block, and treatment in 2 mL centrifuge tubes that were pre-weighed in the lab. Whole tubes with leaf discs were first weighed in the field, and average tube weights subtracted from field weights during data analysis (leaf fresh weight; FW). Discs were then submerged in water for 24 hours, patted dry, and weighed again (turgid weight; TW), and dried for 72 hours at 75°C and weighed (dry weight; DW). These weights were used to calculate LRWC for each variety per block.
LRWC = (FW – DW) / (TW-DW)
Drought determination in treatment plots was previously written in the proposal to arise from a significant decline in SMC relative to control plots. However, drought is defined as a deficit in available moisture relative to plant water needs and thus drought status should be determined by plant response (Glickman, 2011). For this reason, plant stress as determined by a significant decline in leaf chlorophyll, nitrogen, or LRWC in treatment tunnels compared to controls was used to determine drought status.
For SMC, a soil probe was used to sample the top 15 cm of soil in a “W” pattern in each tunnel. Soil was weighed in the field (fresh weight; FW), then brought back to the lab and dried for 72 hours at 75°C and weighed again (dry weight; DW). The difference in FW to DW was the total water content, which was then converted into a percent SMC for each block. A handheld sensor (#YK-S02, YINMIK, Shandong Province, China) was also used to gather soil temperature readings from the top 5 cm of soil at three equidistant points across each block.
Leaf Sample Collection
Leaf sampling was conducted at six time points: at V4 and when drought was reached for the pre-flowering drought treatment and controls, at R1/R2 and when drought was reached for the post-flowering drought treatment and controls, and for all treatments when plants reached optimal water content for silage harvest.
Leaf samples were collected from two randomly selected rows per block and variety. Within each row, five plants were randomly selected at each time of sampling. From each of the five plants, the topmost, middle, and bottom-most leaves, showing no or minimal disease symptoms (i.e., streaking, discoloration, damage, or pathogen signs such as sporulation) were identified for sampling. For all leaves, six-hole punches were collected using a standard hole punch in a staggered equidistant manner along the left and right side of the midvein, for a total of 360 discs per block and variety per sampling time. Discs were stored in resealable plastic bags on ice in the field, then at 4°C in the lab for later processing.
Kernel Water Content – Silage Determination
Starting at week 13 (R1/R2) one ear was selected arbitrarily near the middle of each block, then cut in half to observe the movement of the starch line for relative water content (qualitative, Nielsen, 2021). When the starch line was visibly near but below the middle of the kernel for 90% of ears (~60% water content, week 15), kernel samples were gathered and dried to quantify percent of water content. This was used to determine the time of leaf sampling for silage. To quantify percent water content one representative ear per block and treatment tunnel was collected, shucked, and a 50 mL subsample was gathered in a pre-weighed screw cap tube. The 50 mL volume was weighed in the field, then brought back to the lab, transferred to paper envelopes, dried in an oven, at 75oC for 72 hours, then weighed again. Percent kernel water content was quantified in the same manner as soil moisture. Measurements were taken continuously until the end of the experiment.
Leaf Surface Disinfestation
Leaf discs were surface disinfested via a modified protocol from Schulz et al. (1993) in which discs were rinsed in sterile water, soaked in 70% ethanol for 1 minute, 50% bleach (6% hypochlorite, Clorox, Oakland, CA, USA) for 2 minutes, 1 minute in 70% ethanol, rinsed in sterile water between each wash, then finally rinsed in three washes of sterile water, ~ 30 seconds each. The discs were then patted dry with an autoclaved paper towel and stored at -20oC.
DNA Extraction
Leaf discs were cryogenically frozen in liquid nitrogen, ground with a mortar and pestle, then stored at -20oC. Approximately 50 mg of tissue from each sample was then used in DNA extraction.
Extraction of whole DNA was performed using the DNeasy Plant Pro Kit (Qiagen, Valencia, CA, USA). Manufacturer instructions were optimized with a tissue disruption time of 15 minutes using a Vortex Adapter (Qiagen, Valencia, CA, USA), and a final elution volume of 50µl allowed to elute 5 minutes before centrifugation and DNA product collection. Nucleic acid concentration and purity were then assessed via nanodrop (NanoDrop 2000c Spectrophotometer, Thermo Fisher, Waltham, MA, USA).
Illumina MiSeq Sequencing
Samples were sent to MR DNA (Molecular Research, Shallowater, TX, USA) for library preparation and sequencing of the EF-alpha and ITS regions on November 5, 2025.
The internal transcribed spacer (ITS) region was added to this study following challenges with TEF 1-α sequencing in two other projects in 2024 and 2025. These challenges included non-visible primary PCR amplification using gel electrophoresis and quantitative PCR, possibly due to low abundance of TEF 1-α amplicon targets. These challenges required additional project specific optimization, e.g., bead cleanup, and DNA dilution. The ITS region is widely used for total fungal community classification in microbiome studies, because it is both highly conserved and varied enough for a fungal genus-level taxonomic assignment (White et al., 1990; Blaalid et al., 2013; Heeger et al., 2019). While we cannot use ITS to characterize Fusarium species due to the high level of ITS variation within Fusarium (Datta et al., 2011), we can use ITS to assess the abundance of Fusarium amplicons expected in leaf samples as a tool for problem-solving TEF 1-α sequencing in this project. Additionally, ITS will allow us to identify possible fungal antagonists of Fusarium pathogens and mycotoxin producers and further enrich the broader impacts of this project for growers interested in the effects of drought on other fungal pathogens or silage fermentation associated fungi. The addition of ITS sequencing is financially supported by Dr. Gretchen A. Kuldau. The ITS region will be amplified with primers ITS1f (5’ - CTTGGTCATTTAGAGGAAGTAA -3’) and ITS2 (5’- GCTGCGTTCTTCATCGATGC -3’, White et al., 1990).
Before the primary PCR for EF1-α, MR DNA ran a subset of six samples, including a positive Fusarium control (F. commune), to optimize the use of the fefF (5′-GTCATCGGCCACGTCGACTCTGG-3′) and fefR (5′-CCTTDCCGAGCTCRGCGGCTTCC-3′) primer pair with their polymerase chemistry (Henry et al., 2022). The originally proposed TEF1-α primers Fa_150 and Ra-2 (Cobo-Díaz et al., 2019) were replaced with fefF and fefR because, in previous sequencing projects, Fa_150 and Ra-2 demonstrated low PCR amplification and required repeated annealing optimization. While these are not novel challenges with new primers, the literature further proposed that Fa_150 and Ra-2 may include a high level of exon content with less phylogenetically informative regions, which may limit species identification (Henry et al., 2022).
To date, primary PCR for the six subsamples and Fusarium control have been run by MR DNA with annealing temperature optimization to 68oC as and through their standard PCR pipeline. While the Fusarium control demonstrates an expected band size of 400 to 450 bp under both temperatures, the field samples show a band size of 550 bp. PCR optimization was conducted by spiking samples with s serial dilution of the positive control to determine if the expected band size could be detected. The expected 450 bp and unexpected 550 bp bands were observed after Fusarium control DNA spike-in, and both bands decreased in intensity with decreasing spiked DNA concentration, and only the 550 bp band was visible at a 1:100 dilution. The double band may indicate that EF1-α is at low concentration in the samples, and that primers have non-target amplification.
Additionally, an en silico PCR was conducted with TEF 1-α sequences subset from the Fusarium-ID database (2025-8-1, Crous et al., 2021) and the “TN_FusComp_2025” database (described below), and the new primer pair (Henry et al. 2022) to determine expected amplificon size variation. The en silico PCR and assessment of target amplicon size was conducted in R (R statistical software, v. 4.4.1 (2024-6-15), R Core Team) through the “AmplifyDNA” function in the DECIPHER v. 2.0.2. package (Wright, 2024) with annealingTemp = 68, maxProductSize = 700, and P = 2x10⁻⁴. The final amplicon product size was between 443 bp and 481 bp, smaller than the 550 band observed by MR DNA’s team.
Next steps include the addition of DMSO to increase primer binding specificity, increasing DNA concentration, and may include further annealing temperature optimization. However, since our lab has successfully employed the Cobo-Díaz et al. (2019) primers in the past, even with the struggles described above, and previously successfully optimized their use, we may go back to Fa_150 and Ra-2 if we cannot cost effectively optimize the Henry et al. (2021) primers. Costs associated with optimization will be covered by Dr. Gretchen A. Kuldau.
Sequences will be processed and filtered through the publicly available bioinformatics pipeline DADA2 v.1.26.0, optimized specifically for fungi (Callahan et al., 2016; Rolling et al., 2022). In brief, primers will be removed, sequences trimmed and filtered, dereplicated, forward and reverse reads merged, chimeric sequences removed, and taxonomy assigned using the curated database described below.
Fusarium Database Curation
To characterize the Fusarium taxa from my samples an amplicon metabarcoding approach will be used with the Illumina MiSeq platform. The TEF 1-α (translation elongation factor 1-alpha) region will be sequenced. The application of Illumina MiSeq technology for TEF 1-α was previously described by Cobo-Diaz et al. (2019) and Boutigny et al. (2019) to be effective for characterizing mock and naturally occurring Fusarium communities in cereal tissues and bulk soil, which demonstrate the effectiveness of this approach for my system. Library preparation and sequencing will be performed by MR DNA (Molecular Research, Shallowater, TX, USA), via modified protocols from Cobo-Diaz et al. (2019) and Torres-Cruz et al. (in preparation) with primers Fa_150 (5’-CCGGTCACTTGATCTACCAG-3’) and Ra-2 (5’-ATGACGGTGACATAGTAGCG-3’)10.
Sequences will be processed and filtered through the publicly available bioinformatics pipeline DADA2 v.1.26.09, adapted specifically for fungi43. In brief, primers will be removed, sequences trimmed and filtered, dereplicated, forward and reverse reads merged, chimeric sequences removed, and taxonomy assigned using a generated database of TEF 1-α sequences collected from NCBI (National Center for Biotechnology Information) and FUSARIUM-ID52 based on Fusarium species observed regularly in maize in the literature.
To build the comprehensive database of Fusarium targeted TEF 1-α sequences for use in characterizing Fusarium communities a literature search was conducted, and a preliminary Fusarium-specific TEF 1-α database was developed (~178 sequences). The database was then run against a sample dataset, identifying fourteen unique common Fusarium endophyte species, but could not characterize 90% of reads beyond the genus level. To address this issue, an existing database from the literature (Cobo-Díaz et al., 2019) was then applied to the same sample dataset; both databases were then compared for their ability to capture known Fusarium endophyte diversity and characterize mycotoxigenic and pathogenic Fusarium species of maize. A phylogenetic tree and accompanying analyses will then be used to characterize unidentified reads using alignments of the data and the two databases. Testing two databases will help determine the optimal database for use during the species assignment and analysis portions of this study, and the development of code for phylogenetic tree creation and analysis will provide a pipeline for future tree creation and species assignment in this project.
Literature Search
The literature search used two sources for literature gathering: Google Scholar” and “Web of Science.” The terms used for Web of Science were “Fusarium spp. from corn leaves” (19 results), “Fusarium spp. from corn” (365 results), “Fusarium endophytes of corn” (72 results), and “Fusarium of maize” (4,916 results). Web of Science was searched on August 20th, September 4th, and December 9th, 2024. The same terms were used in Google Scholar; “Fusarium spp. from corn leaves” (44,500 results), “Fusarium spp. from corn” (91,900 results), “Fusarium endophytes of corn” (19,700 results), and “Fusarium of maize” (343,000 results). Google Scholar was searched July (dates unrecorded), August 19th, 20th, September 2nd, 3rd, 4th, and December 2nd, 5th, and 9th, 2024. The top 100 citations from Google Scholar and Web of Science were reviewed using abstracts and titles, and papers relevant to the key terms were examined in more detail (e.g., methods, results, and figures). The names of Fusarium species were gathered manually from 11 papers ranging in publication date from the 1970s to the 2020s. Papers included lists or figures of Fusarium characterized through morphology in culture and/or amplicon sequencing. Species names as published in their referenced literature, current names from Mycobank (Mycobank.com, SimpleSearch tool), Fusarium species complex, source citations, host type, and geographic origin of the reference study were recorded in an Excel spreadsheet (Table 2).
The resulting reference list of potential Fusarium spp. colonizers included 33 unique species, 5 species complexes, 4 hosts (corn/ sweet corn, sorghum, millet, barley), and 5 countries (United States, Mexico, Nigeria, Japan, and Germany).
Database Development
To develop the initial database five reference isolate sequences of the partial or whole translation elongation factor 1-alpha region (EF 1-α) were collected per species identified in the literature search (Table 2) using Fusarium-ID (FUSARIUM-ID: http://isolate.fusariummdb.org/) and the National Center for Biotechnology Information’s nucleotide database (NCBI: http://www.ncbi.nlm.nhi.gov/). Sequences were pooled in a text document in the format >Kingdom;Phylum;Class;Order;Family,Genus,Species,TEF 1-α sequence 5’ to 3’ and saved as an .sa shared archive) formatted file, for use in the R ( R statistical software, v. 4.2.3 (2023-10-11), R Core Team) package Phyloseq (McMurdie and Holmes, 2013). The initial database included ~165 sequences.
The database was further expanded to include 13 additional TEF 1-α sequences gathered by a previous student in the Kuldau lab (Hussein Karemera et al., 2022, unpublished). These sequences represented thirteen Fusarium species isolated from various maize leaf parts (midrib, base, and blade). Sequences were previously generated using Sanger sequencing of the EF1-alpha region (EF1 5’-ATGGGTAAGGAGGACAAGAC-3’ and EF2 5’-GGAAGTACCAGTGATCATGTT-3’), and species assignment made using the Basic Local Alignment Search Tool (BLAST) network service of NCBI and Fusarium-ID with 98% sequence identity (O'Donnell et al., 1998). This resulted in a final database of ~178 TEF 1-α sequences.
Database Testing
A dataset of TEF 1-α sequences from a previous fungal endophyte study conducted by the authors of this project was used to test the database (unpublished dataset). This dataset consisted of sequences gathered through amplicon metabarcoding of whole DNA extracted from 83 maize leaf samples, targeting the internal transcribed spacer (ITS1, universal fungal identifier) and TEF 1-α (Fusarium species target) regions. The use of ITS1 was applied for whole community analysis in the previous study and preliminarily for identification of Fusarium in the samples; F. solani, F. sambucinum, F. oxysporum, F. merismoides, F. graminearum, F. fujikuroi, and F. equisiti. Amplicon sequencing of TEF 1-α was conducted using primers Fa_150 (5’-ACACTGACGACATGGTTCTACA CCGGTCACTTGATCTACCAG-3’) and Ra-2 (5’-TACGGTAGCAGAGACTTGGTCT ATGACGGTGACATAGTAGCG-3’) and resulted in 5,872,973 reads, 34,547 per sample, which were processed, and taxa assigned through the DADA2 pipeline (Callahan et al., 2016; Cobo-Díaz et al., 2019; Rolling et al., 2022), resulting in 827 unique amplicon sequence variants (ASVs), 726 Fusarium-specific ASVs, and 14 species.
A second database from Cobo-Díaz et al. (2019) containing 109 Fusarium spp. and closely related genera including Geejayessia, Rectifusarium, Neocosmospora and Bisifusarium) and closely associated taxa to the Nectriaceae family, such as Fusicolla and Ilyonectria, composed of 273 unique TEF 1-α sequences was then applied to the sample dataset. This database was not available as a direct download for use in the R package Phyloseq, so the database was generated manually using NCBI nucleotide database reference codes. The reference codes for each 273 species were manually searched, and sequences were compiled along with amplicon length and taxonomic information into an Excel spreadsheet and then transferred into a .sa (shared archive) formatted file for use in Phyloseq. Taxa were again assigned through the DADA2 pipeline. Which resulted in 978 unique amplicon sequence variants (ASVs), 81 Fusarium-specific ASVs, and 7 species.
Characterization of ITS amplicons will be conducted with the UNITE fungal database (Abarenkov et al., 2024) which consists of 200,828 Dikarya ITS sequences including 58% Ascomycota and 42% Basidiomycota specific sequences.
To address Objective 1A (Assess how the Fusarium spp. community of maize leaves changes across drought exposure events pre- and post-flowering) Fusarium community α-diversity and β-diversity will be compared for the two drought treatments and the controls for each sampling event. For α-diversity three metrics will be applied; Shannon’s diversity, observed diversity, and Simpson’s diversity to account for both unique taxa and their richness across treatments. A Wilcox Rank sum will be applied in R with a significance level of 0.05 to compare treatment diversity metrics to the negative and positive controls at each sampling point. For β-diversity taxa abundance will be transformed into a distance matrix and normalized, then a PERMANOVA used to assess the community similarity of treatments and controls across sampling. The PERMANOVA will be conducted in R with a significance level of 0.05.
To address Objective 1B (Assess the effect of drought exposure pre- and post-flowering on the functional composition of Fusarium spp. communities) taxa will be manually assigned functional groups through literature review of maize and other cereal crops. Functional assignment will be modified from Nguyen et al. (2016) with categories; commensal (no described positive or negative relationship), saprophyte (described as saprophytic or found only in stover or litter), pathogen (known parasite with disease-causing capacity), and multifunction (multiple functions described in the literature). Functional α-diversity will be quantified via Shannon’s diversity, observed diversity, and Simpson’s diversity. And diversity between the drought treatment and control compared in R with Wilcox Rank sum and a significance level of 0.05. For β-diversity functional groups will be transformed into a distance matrix and normalized, then a PERMANOVA used to assess the community functional similarity between treatments and controls across sampling. The PERMANOVA will be conducted in R with a significance level of 0.05.
To address Objective 1C (Assess the effect of drought exposure pre- and post-flowering on Fusarium spp. communities at harvest for silage), as in methods for objective 1a Fusarium community a-diversity and b-diversity will be compared for the two drought treatments, however only for the final sampling time, between one another as well as the between treatments and controls. Community α-diversity will be quantified as before, diversity compared between the two drought treatments and the controls. And β-diversity performed as previously described.
To address Objective 2 (To reveal the interaction between drought stress events and pathogenic and mycotoxigenic Fusarium spp. in maize at harvest for silage), the parasite functional assignment generated in objective 1b will be subset from the bulk dataset. Mycotoxigenic species will get a new designation as mycotoxin producers, regardless of whether they were collected in the parasite functional group or not. These two new datasets will be used to assess both α-diversity and β-diversity as previously discussed in objective 1c, between treatments and controls at the final sampling point.
To address Objective 3 (To quantify the effect of host genotype and drought on the foliar Fusarium spp. community) the dataset will be subset by variety for both drought treatments and controls, and methods used for α-diversity and β-diversity described in objective 1a applied to assess differences in Fusarium communities between varieties for pre-flowering drought and controls and between post-flowering drought and controls across sampling.
With the addition of the ITS region for total fungal community characterization all diversity metrics and statistical analyses will include the total fungal community in parallel with the Fusarium spp. community.
Between May and September 2025 120-leaf samples were collected for sequencing, 185 soil samples for soil moisture, 558 soil temperature readings were taken, 3,071 leaf SPAD and nitrogen readings were taken, 324 leaf samples were collected for LRWC, and 42 kernel samples were taken for kernel water content.
The pre-flowering drought treatment reached drought conditions at week 9 as determined by significantly lower chlorophyll and nitrogen content of the treatment compared to the 0% drought control tunnel; 50.5 vs 59.3 (T-test, p = 0.011) and 18.5 vs 21.9 mg/g (T-test, p = 0.016) respectively. Drought in the post-flowering drought treatment was never statistically lower compared to the 0% drought control. Instead, SPAD and nitrogen measurements were significantly greater in the treatment tunnel by week 17 compared to the control, 41 and 36.9 (T-test, p = 0.003) and 15.6 and 14.3 (T-test, p = 0.004) and did not decline at week 18. The decision to sample at week 18 as the post-flowering drought timepoint was based on the decline of green leaf tissue in all treatment tunnels.
Drought Stress and Soil Moisture
Leaf SPAD measurements included leaf chlorophyll (SPAD) and nitrogen (mg/g), as well as leaf humidity (%) and temperature (oC), summarized at sampling time points in Table 1 and cumulatively in Figure 1. In summary for the pre-flowering drought treatment, average chlorophyll, nitrogen, leaf humidity, and temperature were 51.9, 19.1 mg/g, 76.7%, and 28.4oC pre-VT and 44.3, 66.7 mg/g, 66.7% and 21oC post-VT, respectively. In the post-flowering drought treatment average readings were 55.3, 20.2 mg/g, 80.2%, and 29.7oC pre-VT, and 48.7, 18.5 mg/g, 72.3%, and 23.9oC post-VT respectively. In the 0% drought control average readings were 52, 19.2 mg/g, 75%, and 28.6oC, and 44.5, 17 mg/g, 65%, 24.3oC post-VT. And in the 100% drought control the average readings were 49.6, 18.4 mg/g, 73%, and 27.7oC at pre-VT, and 36.5, 14.2 mg/g, 56.7%, and 25.1oC post-VT.
Leaf relative water content (LRWC) measurements across the season are shown in figure 2A. In summary, the average LRWC in the pre-flowering drought treatment was 1.1 pre-VT and 0.55 post-VT, in post-flowering it was 1.1 pre-VT and 0.8 post-VT, in the 0% drought it was 1.1 pre-VT and 0.69 post-VT, and in the 100% drought control it was 0.96 pre-VT and 0.89 post-VT.
Because LRWC frequently exceeded 1 (interpreted as >100% of possible turgid weight) across the season and did not show behavior consistent with the literature (e.g., decline with water deficit; Zhou et al., 2021) a methods review was performed to identify where error may have occurred. It was determined that the weight of microcentrifuge tubes used for the collection and weighing of leaf discs in the field was highly varied between tubes, even of the same batch number and brand. An averaging approach was taken at the time of field preparation in which tubes were cumulatively weighed and averaged by the number of tubes. The FW used LRWC quantification was thus the tube + leaf disc weight minus the average tube weight; this resulted in weights that were sometimes greater than the TW of the soaked leaf disks, cumulatively skewing the overall LRWC data. To account for the cumulative effects of this averaging error, FW and DW were instead used to quantify leaf water content (LWC) as the relationship of FW minus DW over FW, as a percent (figure 2B; Song et al., 2021).
The average LWC in the pre-flowering drought treatment was 0.045mg pre-VT and 0.027 mg post-VT, in post-flowering it was 0.037 mg pre-VT and 0.039 post-VT, in the 0% drought it was 0.039 mg pre-VT and 0.028 mg post-VT, and in the 100% drought control it was 0.032 mg pre-VT and post-VT. There was a significant decline in LWC in the pre-flowering treatment compared to the 0% drought control in week 10 (T-test, p = 0.01), but no significant decline in the post-flowering drought treatment. Instead, LWC was significantly greater in the post-flowering treatment compared to the 0% drought control at week 18 (T-test, p = 0.05).
Soil moisture content (SMC) and temperature across the season are shown in figure 3. The average soil moisture in the pre-flowering drought treatment was 18.9% pre-VT, 23.1% when water exclusion started and 15% on week 9 when drought was reached. At VT moisture had risen to 18.4% and dropped to 8.8% by silage harvest time. In the post-flowering drought treatment, soil moisture was at 20% pre-VT, at 16% when water exclusion was initiated on week 13 (R1/R2 stage), at 11.7% at week 18, and at 11.5% at silage harvest time. The 0% drought control had an average soil moisture of 21.6% pre-VT, 16.4% post VT, and 12.6% at silage harvest. The 100% drought control had an average soil moisture of 17.1% pre-VT, 7.9% post VT, and 6.1% at silage harvest. Soil temperatures averaged across the season were 21.1oC, 20.1oC, 21.1oC, and 23.1oC in the pre-flowering, post-flowering, 0%, and 100% drought treatment tunnels, respectively.
Kernel Water Content
Kernel water content from week 15 to week 18 is shown in figure 4. Kernel water content averaged 48.9% across all tunnels on week 15 with the highest water content in the 0% drought control at 51.8%. Leaves were sampled from the tunnels on week 16 for the silage harvest time point when average water content was 42.4% across the tunnels, and the highest water content measurement was 45.4% in the 0% drought control tunnel. Kernel water content was 42.7 for the pre-flowering treatment, 44.1% in post-flowering, and 37.4% in the 100% drought control at time of sampling for silage harvest (week 16). At the final sampling time point for post-flowering drought (week 18), the average kernel water content was 32.2%.
Leaf sampling for silage harvest time was done when kernel water content was lower than recommended for Central Pennsylvania ensiling practices. Silage harvest for Central Pennsylvania is recommended when kernels are at ~60% moisture (Curtis, 2025). Corn harvest for silage is also dependent on the type of silo used, with a recommended minimum moisture of 50 to 55% for upright oxygen-limiting silos like those used widely in Central Pennsylvania (Bayer, 2023; Curtis, 2025). Kernel moisture can be assessed visually by observing the movement of the starch line, as described by Nielsen (2021), at which ~60% water content is determined by a starch line halfway up the kernel. This approach was the initial first step used to assess water content. Sampling starting at week 15 was performed when the line was visible but below halfway up the kernel. It was assumed that water content would likely be closed to 60%. Hower, as observed, water content of kernels was ~45%. Sampling for silage harvest time occurred at 5% below the expected water content for silage stored in upright oxygen-limiting silos like those in our region. Thus, we believe that although we sampled below the recommended 60% mark, our data still applies to growers in our region.
Curated Database
The curated database of 33 species and 178 partial or complete TEF 1-α sequences was used to characterize Fusarium spp. in a sample dataset representing 46 maize leaf samples and 5,872,973 reads. The resulting assignment identified 726 Fusarium-specific ASVs, and 14 unique species (90% ASVs unidentified); F. fujikuroi (average percent of sequences per sample, 0.06%), F. graminearum (0.21%), F. acumunatum (avg. 0.75%), F. armeniacum (0.9%), F. avenaceum (0.39%), F. graminearum (0.21%), F. ipomoea (1.32%). F. commune (0.98%), F. sporotrichioides (1.76%), F. equiseti (1.42%), F. compactum (1.46%), F. venenatum (2.45%), F. subglutinans (avg. 1.54%), and F. culmorum (2.26%).
The Cobo-Díaz et al. (2019) database of 109 Fusarium spp. and closely related genera to Fusarium and the Nectriaceae family, included 273 unique TEF 1-α sequences, was then used to characterize Fusarium spp. in the sample dataset. The resulting assignment identified 81 Fusarium-specific ASVs, and 7 unique species (90% ASVs unidentified); F. graminearum (average percent of sequences per sample, 2.41%), F. acumunatum (avg. 1.66%), F. lacertarum (0.58%), F. avenaceum (0.73%), F. proliferatum (0.76%), F. sporotrichioides (2.46%), and Neonectria lugdunensis (1.42%).
The curated Fusarium TEF 1-α database captured common Fusarium endophytes but was unable to identify most Fusarium TEF 1-α ASVs beyond the genus level (Figure 5A). This is especially important since the database was unable to capture F. verticillioides, a common endophyte and one of the economically important mycotoxin producing pathogens of interest to this project. To address this limitation, an existing database developed by Cobo-Díaz et al. (2019) was then applied to the sample dataset, and results between the two databases were compared. Applying the Cobo-Díaz et al. (2019) database was intended to provide an alternative database that captured a greater variety of Fusarium species, not specific to maize, unassigned members of Fusarium species complexesand closely related taxa in the Nectriaceae family.
The Cobo-Díaz et al. and curated database resulted in the identification of 7 species: 6 Fusarium and 1 Neonectria, and 14 Fusarium species, respectively (Figure 5). The Cobo-Díaz et al. database produced significantly fewer Fusarium assigned ASVs (n = 81, T-test, p < 0.05) than the curated database (n=726) and had an overall reduction in unidentified ASVs (unidentified =20%, Figure 5B) from the curated database (unidentified =90%, Figure 5A). The fewer number ofASVs found with the Cobo-Díaz et al. database may suggest improved Fusarium assignment due to the increase in TEF 1-α diversity within the database. The curated database may have lacked enough diversity of Fusarium and Nectriaceae TEF 1-α sequences for accurate Fusarium assignment, resulting in an over-representation of Fusarium ASVs. However, the Cobo-Díaz et al. database was still unable to capture F. verticillioides. It may be that F. verticillioides was at very low abundance in the assessed samples and associated amplicons were lost through the various steps of sample grinding, DNA extraction, and amplicon processing.
Both the curated and Cobo-Díaz et al. (2019) databases were then combined and duplicate sequences removed. The final database (“TN_FusComp_2025”) will be used to conduct Fusarium species assignment for analyses of objectives 1, 2 and 3.
Moving forward, the PCR optimization for the Henry et al. (2021) primers will either continue such that we are able to get clear 400 to 450 bp bands, or the use of the Cobo-Díaz et al. (2019) will be employed. Both ITS and TEF 1-α amplicon metabarcoding will be completed, sequences processed through the DADA2 pipeline, and resulting ASVs and taxonomic assignments will be statistically analyzed and results summarized and interpreted. A research review will be published with the Crop Protection Network (https://cropprotectionnetwork.org/), to summarize the main findings of my work for a wide extension and grower audience. Additionally, I will present my research findings in the form of a talk or poster at the national American Phytopathological Society's (APS) “Plant Health 2026” meeting, held in Providence, Rhode Island. By presenting my work at the national APS meeting held in the Northeast, as opposed to the Northeastern division meeting I planned in my proposal, I will have the opportunity to reach a wider plant pathology audience both regionally and within the greater United States. Further, the results of this work will be published as a research manuscript in either Phytopathology or Phytobiomes.
|
Treatment |
Sampling Time |
Week |
Chlorophyll (SPAD) |
Nitrogen (mg/g) |
Humidity (%) |
Temperature (oC) |
|
Pre-Flowering |
V4 |
5 |
46.2 |
17.27 |
69.1 |
20.6 |
|
|
Drought |
9 |
51.9 |
19 |
76.2 |
29.9 |
|
|
Silage |
16 |
42.1 |
16 |
64 |
24.8 |
|
Post Flowering |
R1/R2 |
13 |
54.3 |
23.2 |
79.5 |
24.8 |
|
|
Silage |
16 |
47.93 |
17.9 |
70.9 |
25.6 |
|
|
Drought |
18 |
40.8 |
15.6 |
62.3 |
24.7 |
|
0% Drought |
V4 |
5 |
44.5 |
16.8 |
66.64 |
19.8 |
|
|
Pre. F. Drought |
9 |
51.8 |
19 |
76.2 |
28.9 |
|
|
R1/R2 |
13 |
47.4 |
17.7 |
70.2 |
22.2 |
|
|
Silage |
16 |
44.9 |
16.9 |
67.1 |
27.4 |
|
|
Pst. F. Drought |
18 |
38 |
14.8 |
58.4 |
26.8 |
|
100% Drought |
V4 |
5 |
45.5 |
17.1 |
68.5 |
20 |
|
|
Pre. F. Drought |
9 |
49.8 |
18.4 |
73.5 |
28.2 |
|
|
R1/R2 |
13 |
40.9 |
15.8 |
62.8 |
22.7 |
|
|
Silage |
16 |
40.9 |
12.8 |
51.3 |
27.8 |
|
|
Pst. F. Drought |
18 |
32.4 |
11.5 |
45.3 |
27.7 |
Table 1. Summary of SPAD measurements: average leaf chlorophyll (SPAD), nitrogen (mg/g), humidity (%), and temperature (oC), grouped by treatment, sampling time, and week of collection.
|
Species Name at Time of Publication |
Revised name as of 2024 |
Species Complex |
Sourced Article |
Host |
Geography |
|
F. acuminatum |
F. acuminatum |
FTSC |
Leslie et al., 1990; Parikh et al., 2018 |
Corn |
United States |
|
F. chlamydosporum |
F. chlamydosporum |
FCSC |
Leslie et al., 1990 |
Corn |
United States |
|
F. compactum |
F. compactum |
FIESC/FCAMSC |
Leslie et al., 1990 |
Corn |
United States |
|
F. equiseti |
F. equiseti |
FIESC/FCAMSC |
Leslie et al., 1990; Goertz et al., 2010; Uegaki et al., 2012; Parikh et al., 2018 |
Corn |
United States, Japan |
|
F. graminearum |
F. graminearum |
FSAMSC/FGSC |
Abbas et al., 1988; Leslie et al., 1990; Goertz et al., 2010; Parikh et al., 2018; Luis et al., 2023 |
Corn |
United States, Mexico |
|
F. merismoides |
Fusicolla merismoides |
none |
Leslie et al., 1990 |
Corn |
United States |
|
F.moniliforme |
F. verticillioides |
FFSC |
Kommedahl et al., 1979; Abbas et al., 1988; Leslie et al., 1990; Nirenberg and O'Donnell, 1998; Jurjevic et al., 2005; Uegaki et al., 2012; Parikh et al., 2018 |
Corn |
United States, Japan |
|
F. oxysporum |
F. oxysporum |
FOSC |
Kommedahl et al., 1979; Abbas et al., 1988; Leslie et al., 1990; Goertz et al., 2010; Parikh et al., 2018 |
Corn |
United States, Germany |
|
F. proliferatum |
F. proliferatum |
FFSC |
Abbas et al., 1988; Leslie et al., 1990; Goertz et al., 2010; Uegaki et al., 2012; Vismer et al., 2019 |
Corn, Sorghum, Millet |
United States, Germany, Nigeria, Japan |
|
F. semitectum |
F. incarnatum |
FIESC/FCAMSC |
Leslie et al., 1990; Luis et al., 2023 |
Corn |
United States, Mexico |
|
F. solani |
Neocosmospora solani |
none |
Kommedahl et al., 1979; Leslie et al., 1990; Parikh et al., 2018 |
Corn |
United States |
|
F. subglutinans |
F.subglutinans |
FFSC |
Abbas et al., 1988; Nirenberg and O'Donnell, 1998; Leslie et al., 1990; Goertz et al., 2010 |
Corn |
United States, Germany |
|
F. temperatum |
F. temperatum |
FFSC |
Ridout et al., 2016 |
Swet Corn |
United States |
|
F. cerealis |
F. cerealis |
FSAMSC/FGSC |
Goertz et al., 2010; Cummings et al., 2017; |
Corn, Barley |
United States |
|
F. avenaceum |
F. avenaceum |
FCOSC |
Goertz et al., 2010; Parikh et al., 2018 |
Corn |
Germany, United States |
|
F. culmorum |
F. culmorum |
FSAMSC/FGSC |
Goertz et al., 2010; Parikh et al., 2018 |
Corn |
Germany, United States |
|
F. poae |
F. poae |
FSAMSC/FGSC |
Goertz et al., 2010 |
Corn |
Germany |
|
F. sporotrichioides |
F. sporotrichioides |
FSAMSC/FGSC |
Goertz et al., 2010; Parikh et al., 2018; Luis et al., 2023 |
Corn |
Germany, United States, Mexico |
|
F. tricinctum |
F. tricinctum |
FTSC |
Kommedahl et al., 1979; Goertz et al., 2010 |
Corn |
Germany, United States |
|
F. venenatum |
F. venenatum |
FSAMSC/FGSC |
Goertz et al., 2010 |
Corn |
Germany |
|
F. pseudonygamai |
F. pseudonygamai |
FFSC |
Nirenberg and O'Donnell, 1998; Jurjevic et al., 2005; Vismer et al., 2019 |
Corn, Sorghum, Millet |
Nigeria, Germany, United States |
|
F. redolens |
F. redolens |
FRSC |
Parikh et al., 2018 |
Corn |
United States |
|
F. fujikuroi |
F. fujikuroi |
FFSC |
Uegaki et al., 2012; Parikh et al., 2018; Luis et al., 2023 |
Corn |
United States, Japan, Mexico |
|
F. roseum |
F. sambucinum |
FSAMSC/FGSC |
Kommedahl et al., 1979 |
Corn |
United States |
|
F. asiaticum |
F. asiaticum |
FSAMSC/FGSC |
Uegaki et al., 2012 |
Corn |
Japan |
|
F. irregulare |
F. irregulare |
FIESC/FCAMSC |
Luis et al., 2023 |
Corn |
United States, Mexico |
|
F. sulawesiense |
F. sulawesiense |
FIESC/FCAMSC |
Luis et al., 2023 |
Corn |
United States, Mexico |
|
F. pernambucanum |
F. pernambucanum |
FIESC/FCAMSC |
Luis et al., 2023 |
Corn |
United States, Mexico |
|
F. nanum |
F. nanum |
FIESC/FCAMSC |
Luis et al., 2024 |
Corn |
United States, Mexico |
|
F. ipomoeae |
F. ipomoeae |
FIESC/FCAMSC |
Luis et al., 2025 |
Corn |
United States, Mexico |
|
F.acuminatum |
F. acuminatum |
FTSC |
Luis et al., 2025 |
Corn |
United States, Mexico |
|
F. luffae |
F. luffae |
FIESC/FCAMSC |
Luis et al., 2025 |
Corn |
United States, Mexico |
|
F. hainanense |
F. hainanense |
FIESC/FCAMSC |
Luis et al., 2025 |
Corn |
United States, Mexico |
Table 2. Fusarium spp. reference list created from a literature search of 100 top papers from Google Scholar and Web of Science on Fusarium colonization of maize. Name revisions are based on current species names listed on MycoBank, species complexes are based on those described in Fusarium-ID, and geography notes in what country the isolation or characterization of the species was made based on the cited literature in the sourced article column.
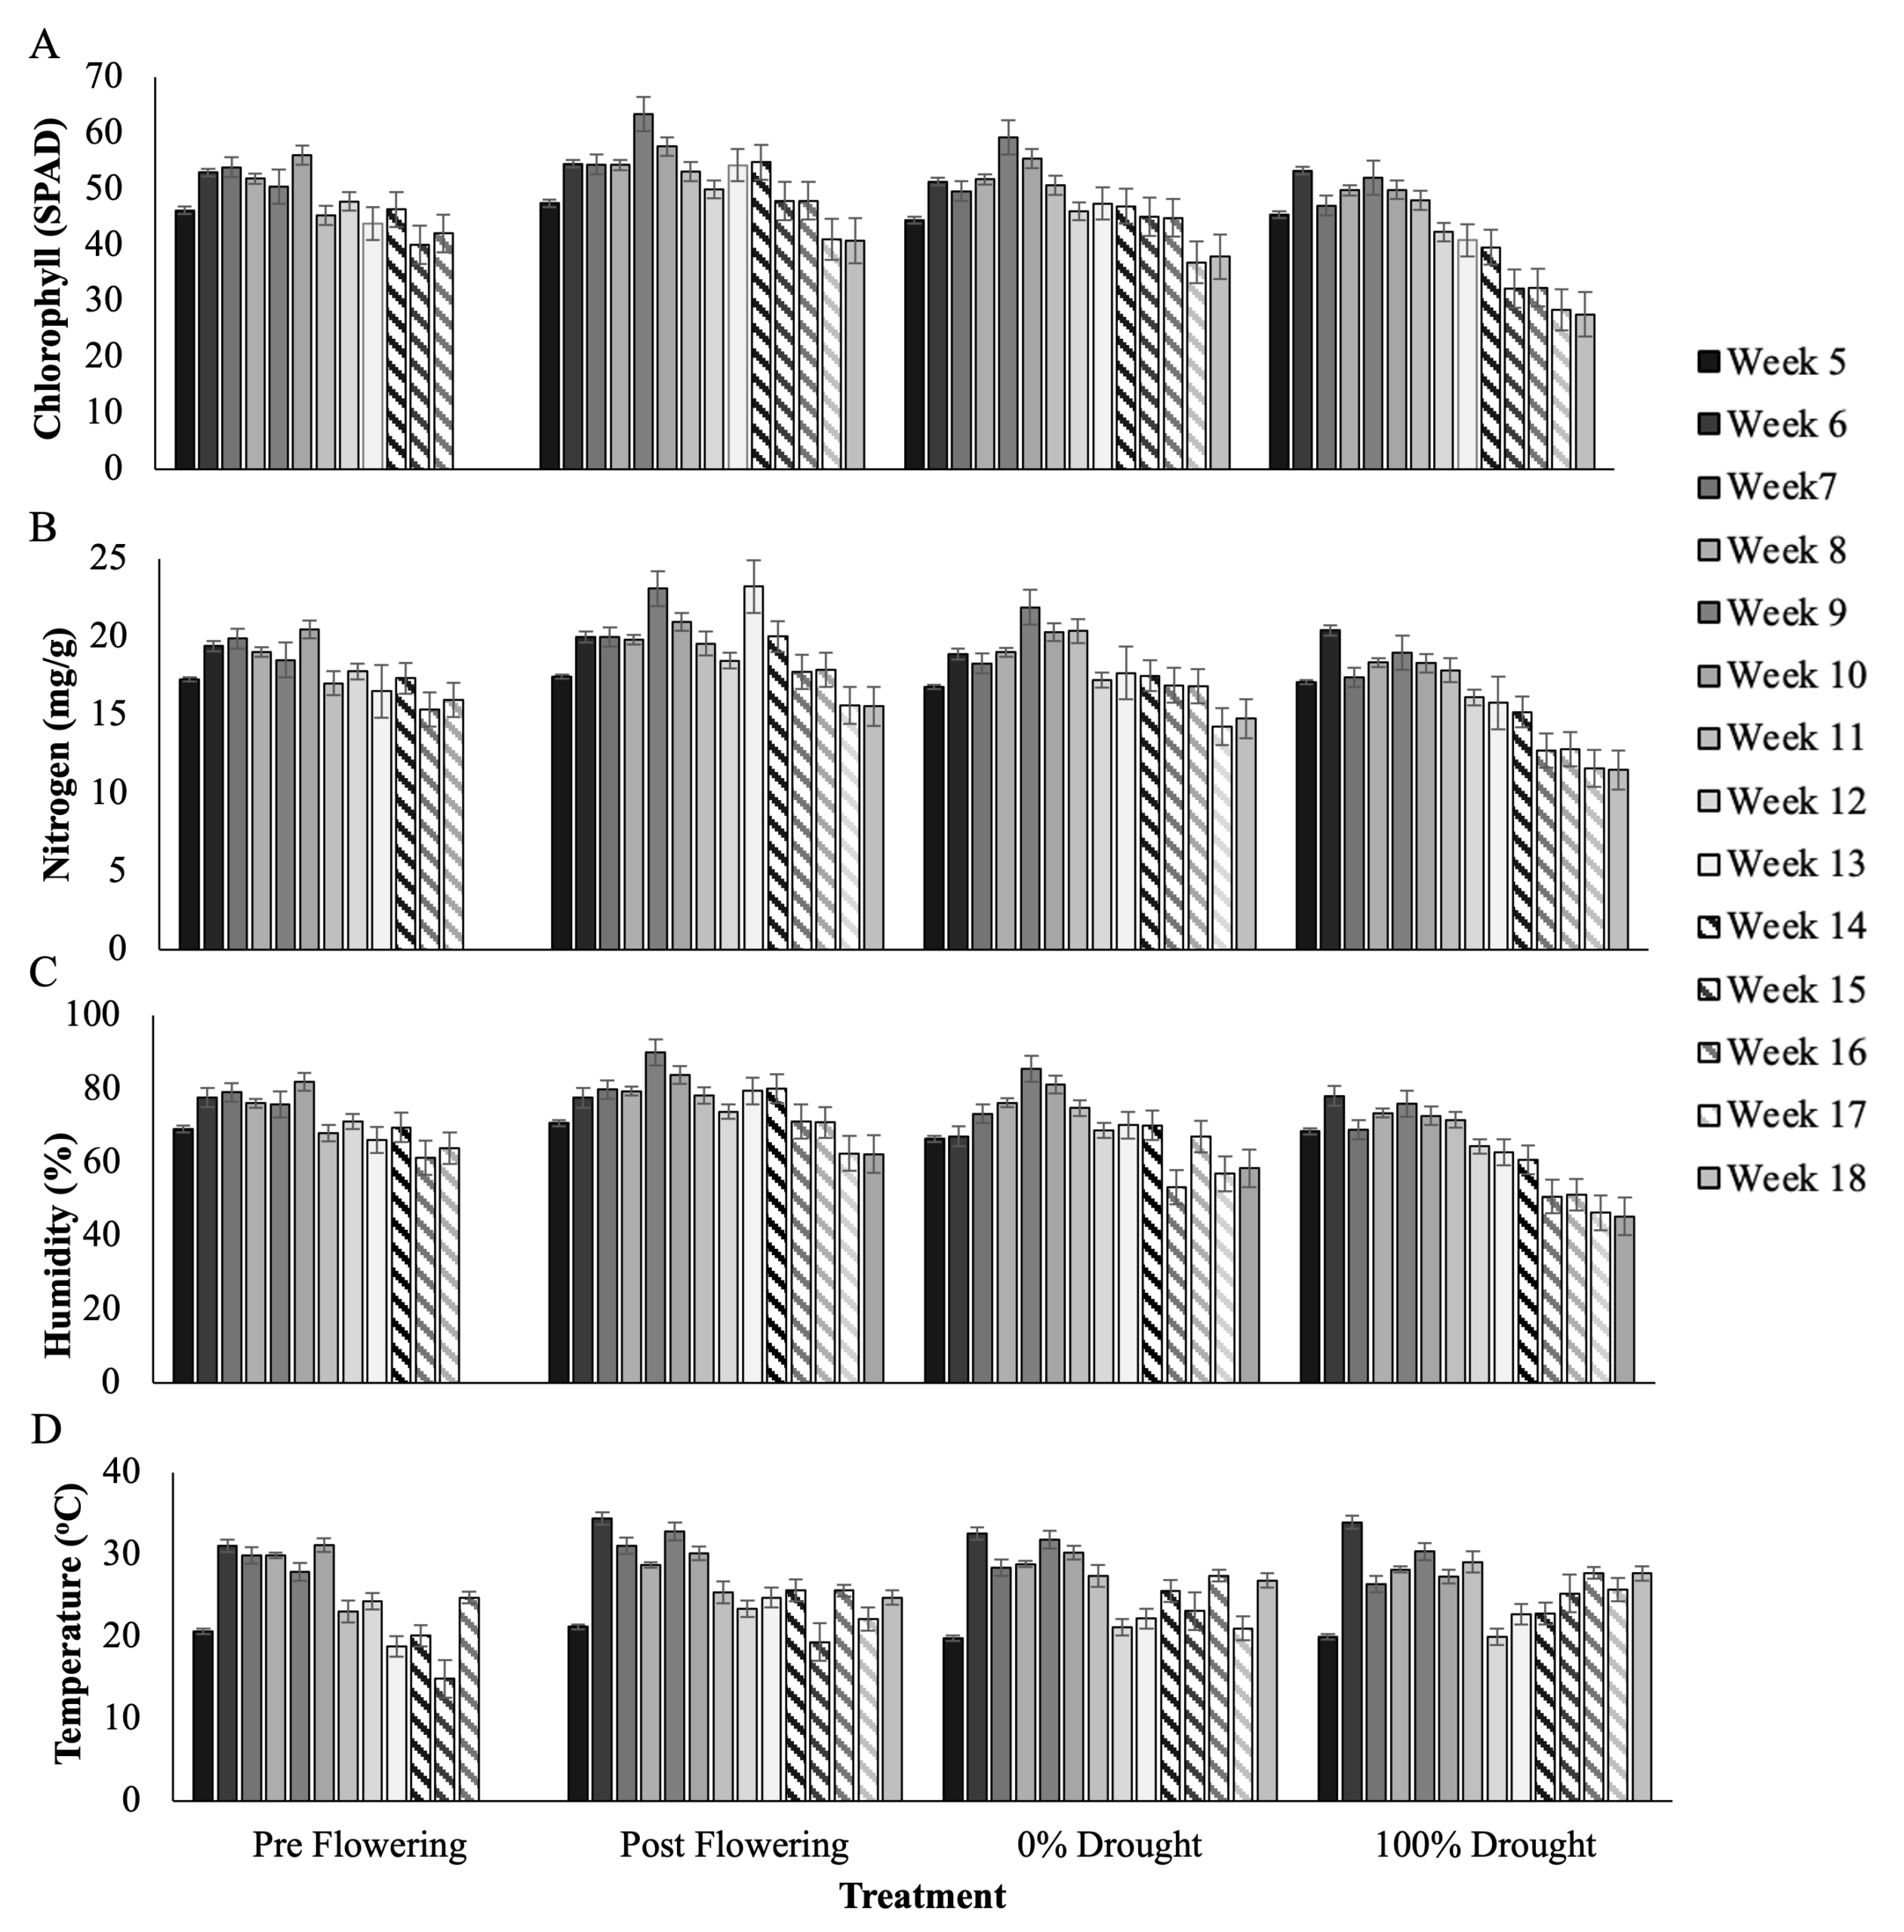
Figure 1. Average leaf chlorophyll (SPAD, A), nitrogen (mg/g, B), humidity (%, C), and temperature (oC) by treatment, for weeks after planting, from week 5 when the pre-flowering treatment was sampled at the start of water exclusion, to week 18 when the post-flowering treatment was sampled at drought. Error bars are the standard deviation of 60 measurements per variable across seed varieties and replicate blocks for each treatment and time point.
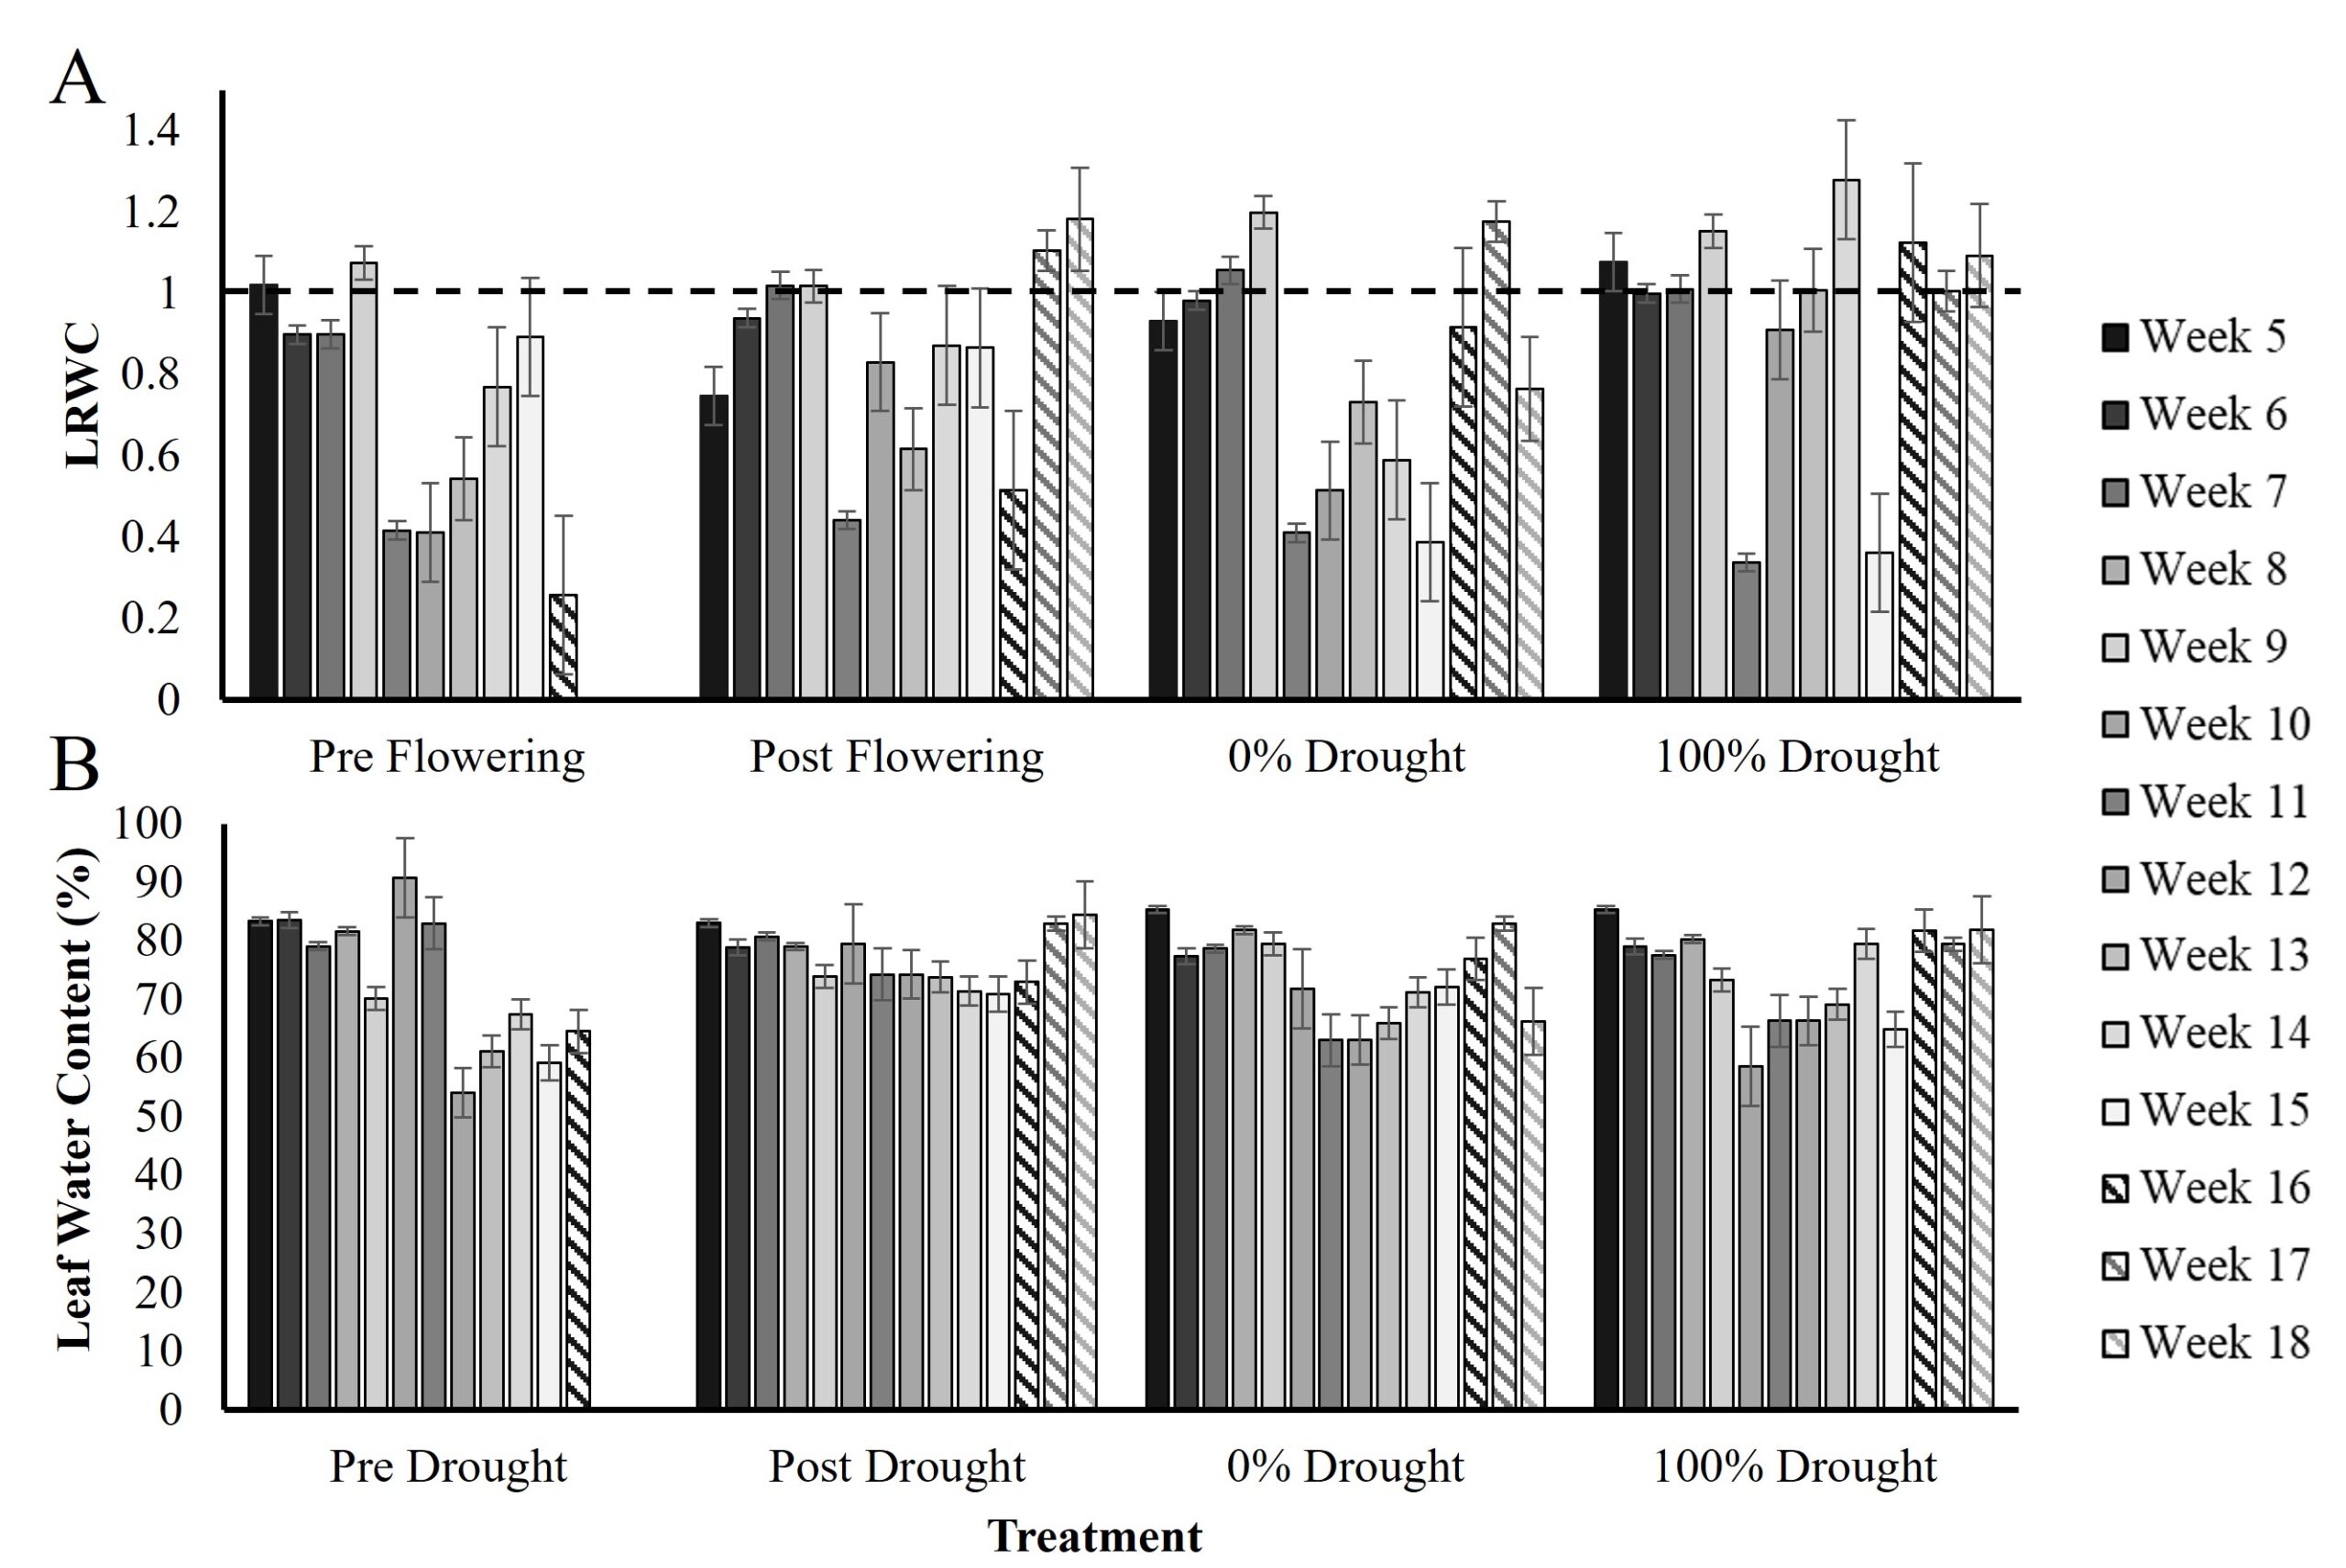
Figure 2. Leaf relative water content (LRWC, A) and leaf water content (LWC, B) from week 5 to week 18. Error bars are the standard deviation of 60-disc samples per measurement across seed varieties and replicate blocks for each treatment and time point. The dashed line indicates 100% LRWC at which it is impossible for leaves to hold more than 100% of their turgid weight.
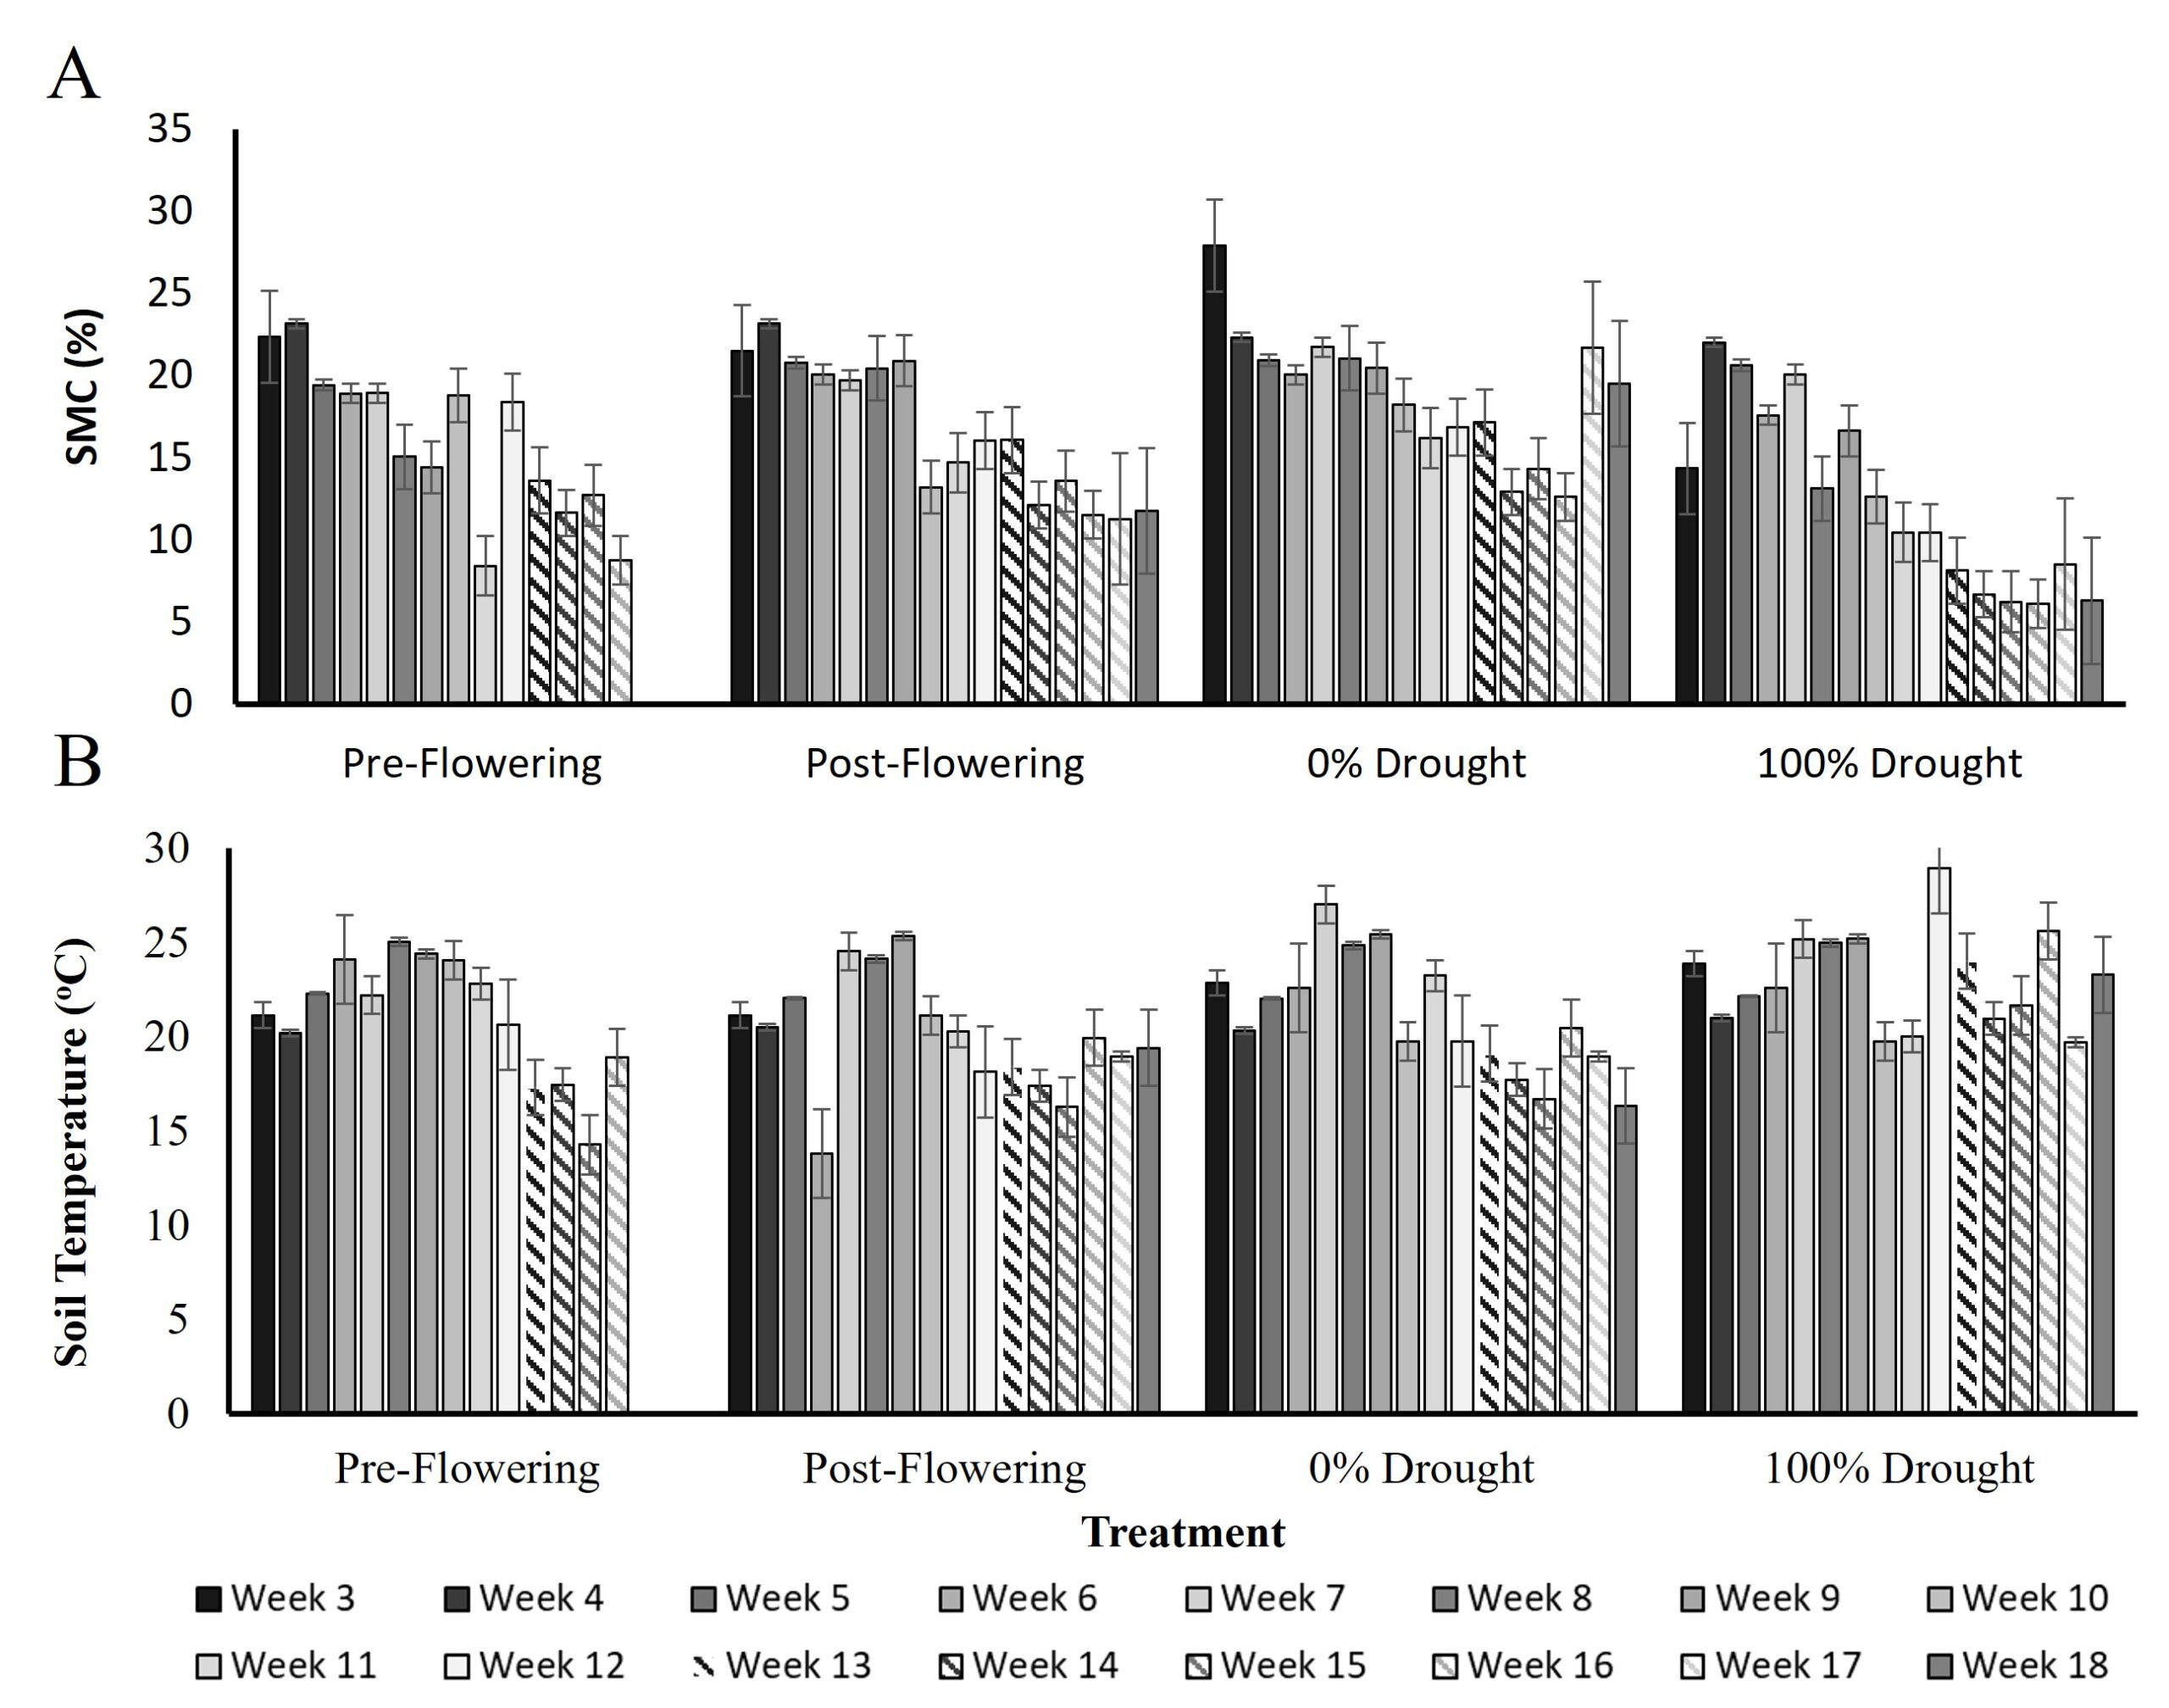
Figure 3. Soil moisture content (A) and temperature (B) from week 3 to week 18. Error bars are the standard deviation of 185 soil samples and 555 soil temperature measurements, across seed varieties and replicate blocks for each treatment and time point.
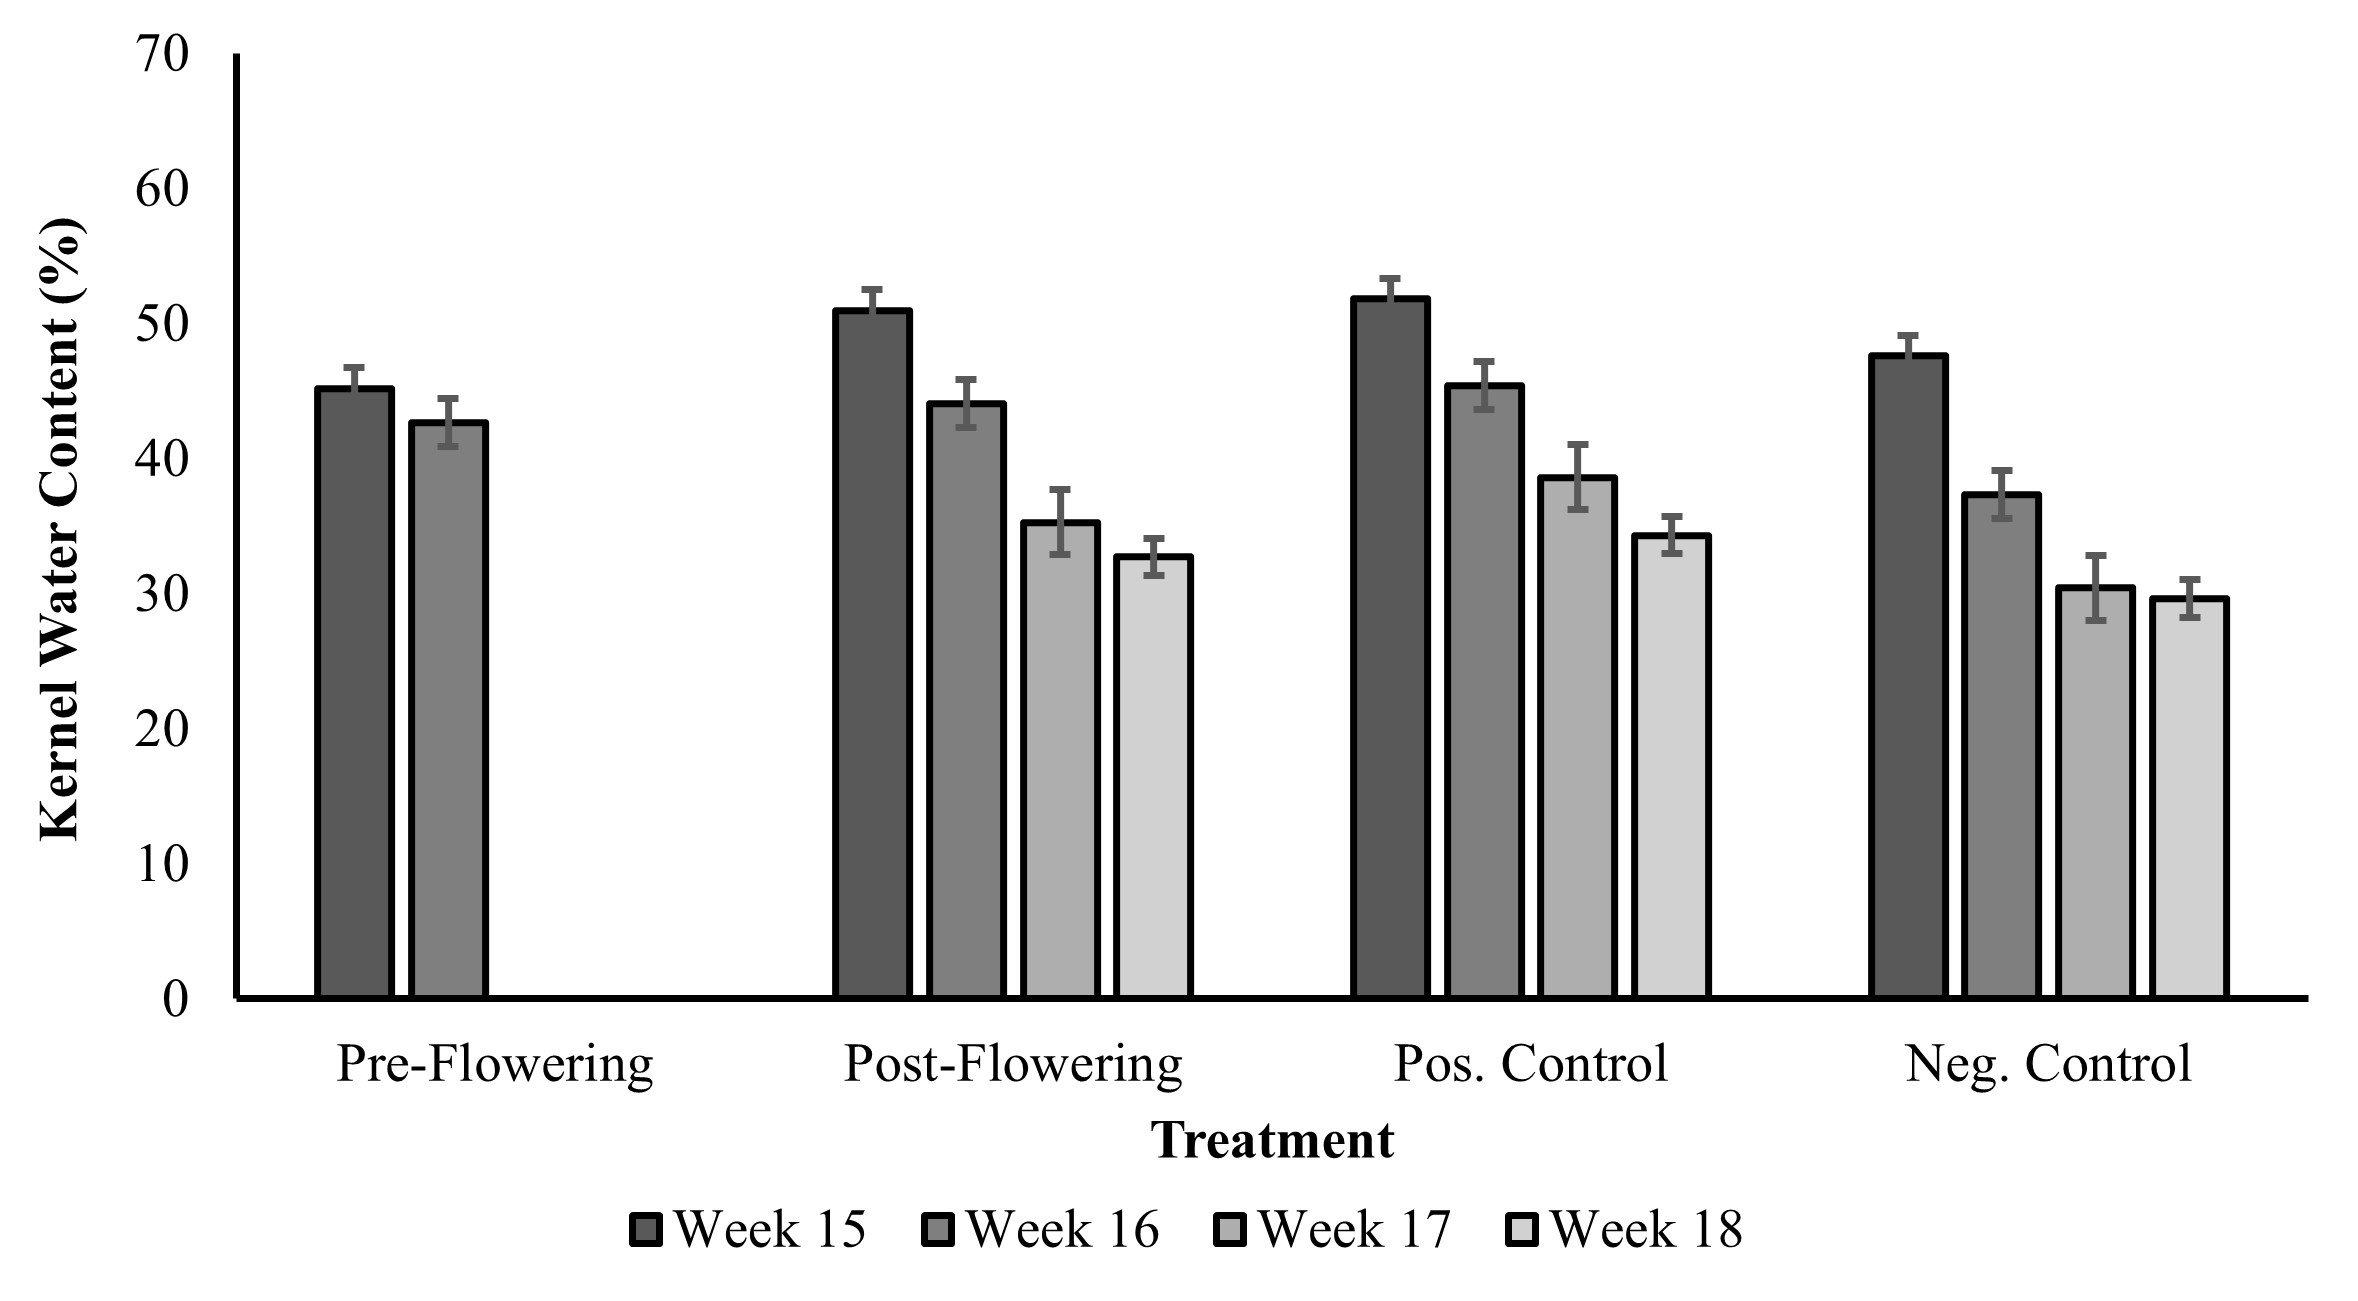
Figure 4. Kernel water content (%) and temperature (oC) from week 15 to week 18. Error bars are the standard deviation of 42 kernel samples, across replicate blocks for each treatment and time point.
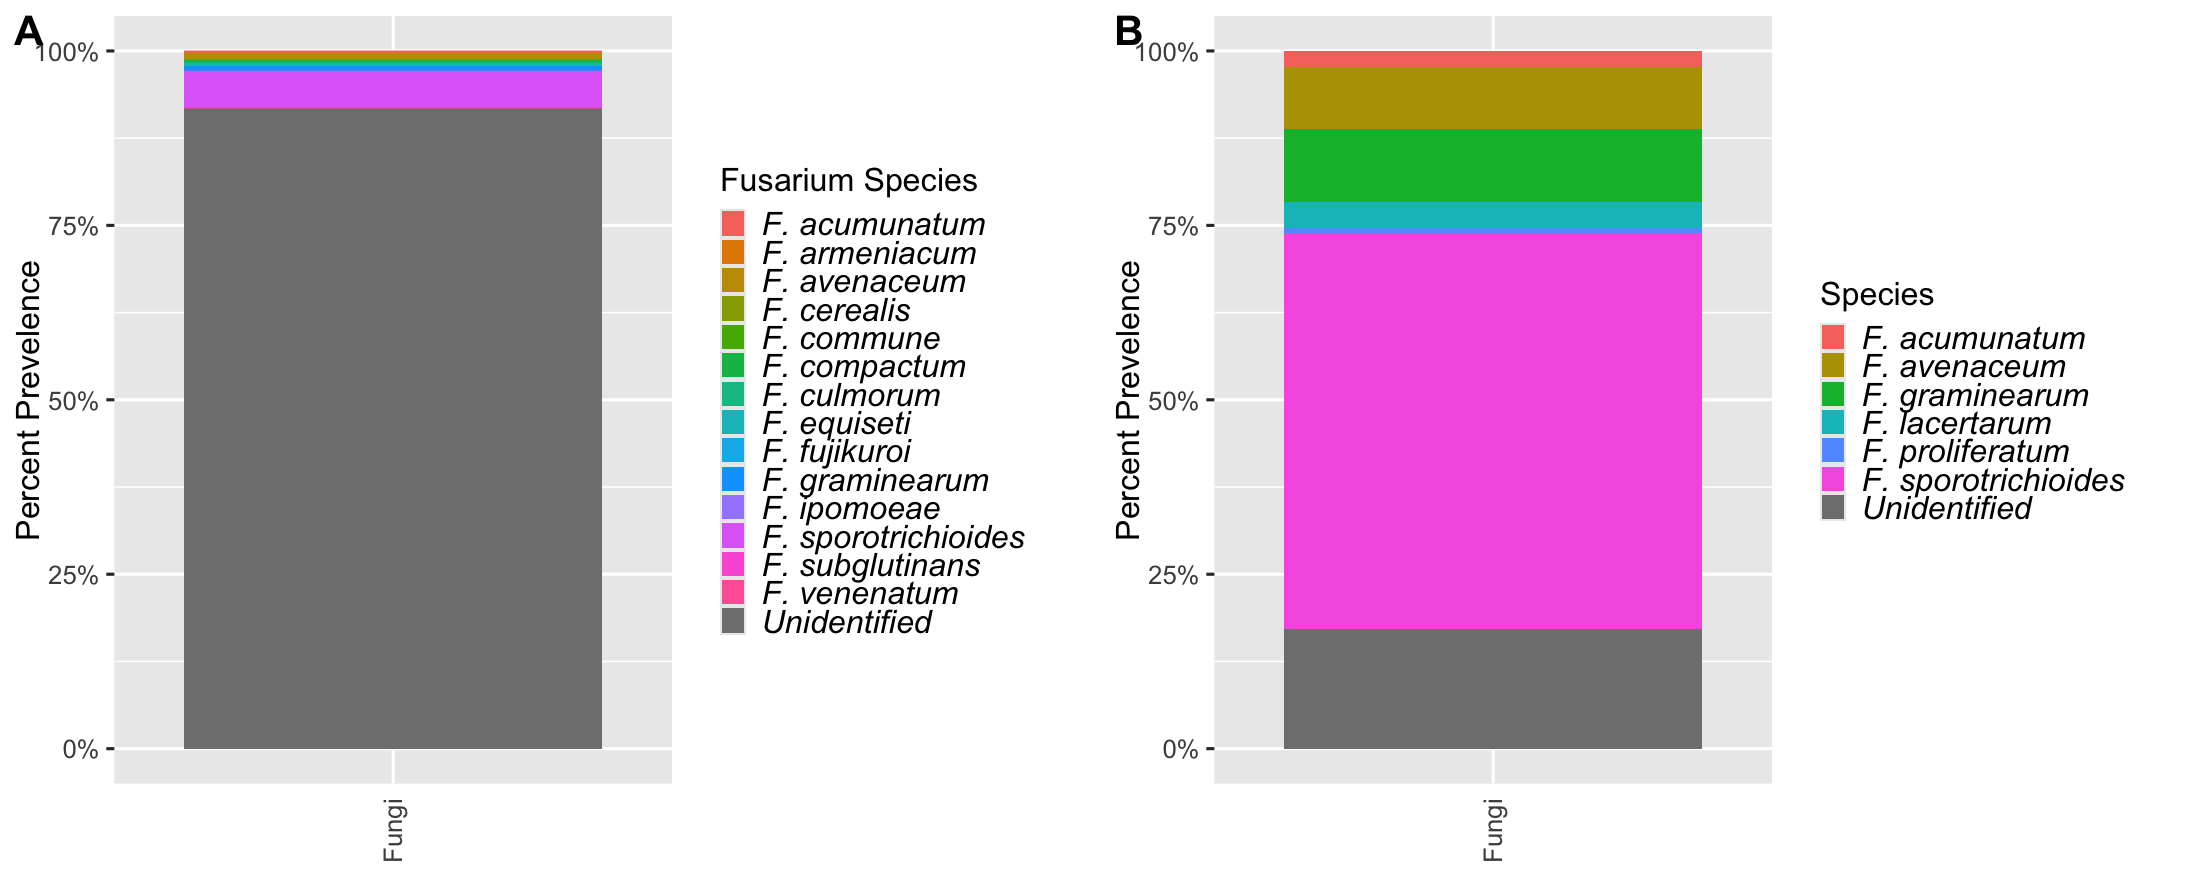
Figure 5. Percent prevalence of Fusarium spp. and like species assigned amplicon sequence variants (ASVs) across 46 maize leaf samples, colored by species, for both the (A) developed database and the (B) Cobo-Díaz et al. (2019) database.
Citation List
- Abarenkov, K., Nilsson, R. H., Larsson, K. H., Taylor, A. F., May, T. W., Frøslev, T. G., ... & Kõljalg, U. (2024). The UNITE database for molecular identification and taxonomic communication of fungi and other eukaryotes: sequences, taxa and classifications reconsidered. Nucleic Acids Research, 52(D1), D791-D797.
- Abbas, H. K., Mirocha, C. J., Meronuck, R. A., Pokorny, J. D., Gould, S. L., & Kommedahl, T. (1988). Mycotoxins and Fusarium spp. associated with infected ears of corn in Minnesota. Applied and Environmental Microbiology, 54(8), 1930-1933.
- Abbas, H. K., Williams, W. P., Windham, G. L., Pringle, H. C., Xie, W., & Shier, W. T. (2002). Aflatoxin and fumonisin contamination of commercial corn (Zea mays) hybrids in Mississippi. Journal of Agricultural and Food Chemistry, 50(18), 5246-5254.
- Adonzio, W., & Royales, S. (2012). Impact of the drought on corn exports: paying the price. Beyond the Numbers, Clobal Economy. U.S. Bureau of Labor Statistics. 1(17).
- Anjum, S. A., Xie, X., Wang, L., Saleem, M. F., Man, C., & Lei, W. (2011). Morphological, physiological and biochemical responses of plants to drought stress. African Journal of Agricultural Research, 6(9), 2026-2032.
- Aslam, M., Maqbool, M. A., & Cengiz, R. (2015). Chapter 1: Effects of Drought on Maize. Drought stress in maize (Zea mays), Effects, Resistance Mechanisms, Global Achievements and Biological Strategies for Improvement. Springer. 5 – 16.
- Avenot, H. F., & Michailides, T. J. (2010). Progress in understanding molecular mechanisms and evolution of resistance to succinate dehydrogenase inhibiting (SDHI) fungicides in phytopathogenic fungi. Crop Protection, 29(7), 643-651.
- Beyer, M., Pogoda, F., Pallez, M., Lazic, J., Hoffmann, L., & Pasquali, M. (2014). Evidence for a reversible drought induced shift in the species composition of mycotoxin producing Fusarium head blight pathogens isolated from symptomatic wheat heads. International Journal of Food Microbiology, 182, 51-56.
- Bayer. (29 August 2023). Corn Silage Harvest Timing. Bayer Crop Science. https://www.cropscience.bayer.us/articles/bayer/corn-silage-harvest-timing
- Blaalid, R., Kumar, S., Nilsson, R. H., Abarenkov, K., Kirk, P. M., & Kauserud, H. (2013). ITS 1 versus ITS 2 as DNA metabarcodes for fungi. Molecular ecology resources, 13(2), 218-224.
- Bolster, C.H., R. Mitchell, A. Kitts, A. Campbell, M. Cosh, T.L. Farrigan, A.J. Franzluebbers, D.L. Hoover, V.L. Jin, D.E. Peck, M.R. Schmer, & Smith, M.D. (2023) Ch. 11. Agriculture, food systems, and rural communities. In: Fifth National Climate Assessment. Crimmins, A.R., C.W. Avery, D.R. Easterling, K.E. Kunkel, B.C. Stewart, and T.K. Maycock, Eds. U.S. Global Change Research Program, Washington, DC, USA. https://doi.org/10.7930/NCA5.2023.CH11
- Boutigny, A. L., Gautier, A., Basler, R., Dauthieux, F., Leite, S., Valade, R., ... & Laval, V. (2019). Metabarcoding targeting the EF1 alpha region to assess Fusarium diversity on cereals. PLoS One, 14(1), e0207988.
- Callahan, B. J., McMurdie, P. J., Rosen, M. J., Han, A. W., Johnson, A. J. A., & Holmes, S. P. (2016). DADA2: High-resolution sample inference from Illumina amplicon data. Nature Methods, 13(7), 581-583.
- Cobo-Díaz, J. F., Baroncelli, R., Le Floch, G., & Picot, A. (2019). A novel metabarcoding approach to investigate Fusarium species composition in soil and plant samples. FEMS Microbiology Ecology, 95(7), fiz084.
- Cummings, J. A., Myers, K., Blachez, A. F., & Bergstrom, G. C. (2017). First report of Fusarium head blight caused by Fusarium cerealis in Barley in New York. Plant Disease, 101(11), 1955.
- Curtis, Z., (2025, September 2). Corn Silage Dry-Down: Week of September 1, 2025. PennState Extension. https://extension.psu.edu/corn-silage-dry-down-week-of-september-1-2025
- Datta, S., Choudhary, R. G., Shamim, M., & Dhar, V. (2011). Polymorphism in the internal transcribed spacer (ITS) region of the ribosomal DNA among different Fusarium species. Archives of Phytopathology and Plant Protection, 44(6), 558-566.
- Dong, J. N., Zhao, Z. K., Wang, Z. Q., Li, S. Z., Zhang, Y. P., Sun, Z., ... & Zhen, Y. G. (2024). Impact of deoxynivalenol on rumen function, production, and health of dairy cows: Insights from metabolomics and microbiota analysis. Journal of Hazardous Materials, 465, 133376.
- Earl, H. J., & Tollenaar, M. (1997). Maize leaf absorptance of photosynthetically active radiation and its estimation using a chlorophyll meter. Crop Science, 37(2), 436-440.
- Gao, C., Montoya, L., Xu, L., Madera, M., Hollingsworth, J., Purdom, E., ... & Taylor, J. W. (2020). Fungal community assembly in drought-stressed sorghum shows stochasticity, selection, and universal ecological dynamics. Nature Communications, 11(1), 34.
- Gardes, M., & Bruns, T. D. (1993). ITS primers with enhanced specificity for basidiomycetes‐application to the identification of mycorrhizae and rusts. Molecular ecology, 2(2), 113-118.
- Gassmann, A. J., Petzold-Maxwell, J. L., Keweshan, R. S., & Dunbar, M. W. (2011). Field-evolved resistance to Bt maize by western corn rootworm. PloS One, 6(7), e22629.
- Gelderblom, W. C., Jaskiewicz, K., Marasas, W. F., Thiel, P. G., Horak, R. M., Vleggaar, R., & Kriek, N. (1988). Fumonisins--novel mycotoxins with cancer-promoting activity produced by Fusarium moniliforme. Applied and Environmental Microbiology, 54(7), 1806-1811.
- Gisi, U., Sierotzki, H., Cook, A., & McCaffery, A. (2002). Mechanisms influencing the evolution of resistance to Qo inhibitor fungicides. Pest Management Science, 58(9), 859-867.
- Glickman (2011) Glossary of Meteorology. American Meteorological Society, 1:3624–3648.
- Goertz, A., Zuehlke, S., Spiteller, M., Steiner, U., Dehne, H. W., Waalwijk, C., ... & Oerke, E. C. (2010). Fusarium species and mycotoxin profiles on commercial maize hybrids in Germany. European journal of plant pathology, 128, 101-111.
- Heeger, F., Wurzbacher, C., Bourne, E. C., Mazzoni, C. J., & Monaghan, M. T. (2019). Combining the 5.8 S and ITS2 to improve classification of fungi. Methods in Ecology and Evolution, 10(10), 1702-1711.
- Hellmich, R. L. & Hellmich, K. A. (2012). Use and impact of Bt maize. Nature, 3(5), 4.
- Henry, P. M., Koehler, S. I., Kaur, S., Epstein, L., Mitchell, J. P., Gordon, T. R., & Leveau, J. H. (2022). Amplicon Sequencing of Fusarium Translation Elongation Factor 1α Reveals that Soil Communities of Fusarium Species Are Resilient to Disturbances Caused by Crop and Tillage Practices. Phytobiomes Journal, 6(3), 261-274.
- Jia, B., Lin, H., Yu, S., Liu, N., Yu, D., & Wu, A. (2023). Mycotoxin deoxynivalenol-induced intestinal flora disorders, dysfunction and organ damage in broilers and pigs. Journal of Hazardous Materials, 451, 131172.
- Johnston-Monje, D., Gutiérrez, J. P., & Lopez-Lavalle, L. A. B. (2021). Seed-transmitted bacteria and fungi dominate juvenile plant microbiomes. Frontiers in Microbiology, 12, 737616.
- Kommedahl, T., Windels, C. E., & Stucker, R. E. (1979). Occurrence of Fusarium species in roots and stalks of symptomless corn plants during the growing season. Phytopathology, 69(9), 961-966.
- Laughton, C. (2022). Northeastern Dairy Farm Summary 2021. Farm Credit Union.
- Lauer, J. (2006). Concerns about drought as corn pollination begins. Field Crop, 28, 493-542.
- Lauren, D. R., & Di Menna, M. E. (1999). Fusaria and Fusarium mycotoxins in leaves and ears of maize plants 2. A time course study made in the Waikato region, New Zealand, in 1997. New Zealand Journal of Crop and Horticultural Science, 27(3), 215-223.
- Lawlor, D. W., & Tezara, W. (2009). Causes of decreased photosynthetic rate and metabolic capacity in water-deficient leaf cells: a critical evaluation of mechanisms and integration of processes. Annals of Botany, 103(4), 561-579.
- Leslie, J. F., Pearson, C. A., Nelson, P. E., & Toussoun, T. (1990). Fusarium spp. from corn, sorghum, and soybean fields in the central and eastern United States. Ecol. Stud, 44, 66.
- Li, B., Liu, R., Liu, J., Zhang, H., Tian, Y., Chen, T., ... & Song, C. P. (2024). ZmMYB56 regulates stomatal closure and drought tolerance in maize seedlings through the transcriptional regulation of ZmTOM7. New Crops, 1, 100012.
- Li, Y., Guan, K., Schnitkey, G. D., DeLucia, E., & Peng, B. (2019). Excessive rainfall leads to maize yield loss of a comparable magnitude to extreme drought in the United States. Global Change Biology, 25(7), 2325-2337.
- Luis, J. M., Mehl, H. L., Plewa, D., & Kleczewski, N. M. (2023). Is Microdochium maydis associated with necrotic lesions in the tar spot disease complex? A culture-based survey of Maize in Mexico and the Midwestern United States. Phytopathology®, 113(10), 1890-1897.
- Luo, K., Zhao, G., Chen, M., & Tian, X. (2023). Effects of maize resistance and leaf chemical substances on the structure of phyllosphere fungal communities. Frontiers in Plant Science, 14, 1241055.
- Ma, B. L., & Dwyer, L. M. (2012). Changes in kernel characteristics during grain filling in silage-specific and dual-purpose corn hybrids. Canadian Journal of Plant Science, 92(3), 427-439.
- Mansfield, M. A., De Wolf, E. D., & Kuldau, G. A. (2005). Relationships between weather conditions, agronomic practices, and fermentation characteristics with deoxynivalenol content in fresh and ensiled maize. Plant Disease, 89(11), 1151-1157.
- Mansfield, M. A., Archibald, D. D., Jones, A. D., & Kuldau, G. A. (2007). Relationship of sphinganine analog mycotoxin contamination in maize silage to seasonal weather conditions and to agronomic and ensiling practices. Phytopathology, 97(4), 504-511.
- Marasas, W. F. O., Miller, J. D., Riley, R. T., & Visconti, A. (2000). Fumonisin B1 (No. 219). World Health Organization.
- Marasas, W. F. O., Naude, T. W., Pienaar, J. G., & Kellerman, T. S. (1976). Leukoencephalomacia: A mycotoxicosis of Equidae caused by Fusarium moniliforme Sheldon.
- McMurdie, P.J., Holmes, S. (2013). Phyloseq: An R package for reproducible interactive 680 analysis and graphics of microbiome census data. PLoS One 8:e61217.
- Meibaum, B., Riede, S., Schröder, B., Manderscheid, R., Weigel, H. J., & Breves, G. (2012). Elevated CO2 and drought stress effects on the chemical composition of maize plants, their ruminal fermentation and microbial diversity in vitro. Archives of Animal Nutrition, 66(6), 473-489.
- Miller, J. D. (2001). Factors that affect the occurrence of fumonisin. Environmental Health Perspectives, 109(suppl 2), 321-324.
- Miller, J. D., Savard, M. E., Schaafsma, A. W., Seifert, K. A., & Reid, L. M. (1995). Mycotoxin production by Fusarium moniliforme and Fusarium proliferatum from Ontario and occurrence of fumonisin in the 1993 corn crop. Canadian Journal of Plant Pathology, 17, 233-239.
- Mueller, D. S., Wise, K. A., Sisson, A. J., Allen, T. W., Bergstrom, G. C., Bissonnette, K. M., ... & Wiebold, W. J. (2020). Corn yield loss estimates due to diseases in the United States and Ontario, Canada, from 2016 to 2019. Plant Health Progress, 21(4), 238-247.
- Munkvold, G. P., Arias, S., Taschl, I., & Gruber-Dorninger, C. (2019). Mycotoxins in corn: Occurrence, impacts, and management. In Corn. AACC International Press, 235-287.
- Mittler, R., & Blumwald, E. (2010). Genetic engineering for modern agriculture: challenges and perspectives. Annual Review of Plant Biology, 61, 443-462.
- Nielsen, R.L. (2021 August). Grain Fill Stages in Corn. The Kernel, Perdue University. https://www.agry.purdue.edu/ext/corn/news/timeless/grainfill.html
- Nguyen, N. H., Song, Z., Bates, S. T., Branco, S., Tedersoo, L., Menke, J., ... & Kennedy, P. G. (2016). FUNGuild: an open annotation tool for parsing fungal community datasets by ecological guild. Fungal Ecology, 20, 241-248.
- Nguyen, H., Thompson, A., & Costello, C. (2023). Impacts of historical droughts on maize and soybean production in the southeastern United States. Agricultural Water Management, 281, 108237.
- Nirenberg, H. I., & O'Donnell, K. (1998). New Fusarium species and combinations within the Gibberella fujikuroi species complex. Mycologia, 90(3), 434-458.
- Nielsen, B., & Colville, D. (1986). Stalk lodging in corn: guidelines for preventive management. AY-Purdue University Cooperative Extension Service (USA), (262).
- O'Donnell, K., Kistler, H. C., & Cigelnik, E. .(1998). Multiple evolutionary origins of the fungus causing Panama disease of banana: concordant evidence from nuclear and mitochondrial gene genealogies. Proceedings of the National Academy of Sciences of the United States of America, 95, 2044-2049.
- Ortez, O. A., Lindsey, A. J., Thomison, P. R., Coulter, J. A., Singh, M. P., Carrijo, D. R., ... & Bastos, L. (2023). Corn response to long‐term seasonal weather stressors: A review. Crop Science, 63(6), 3210-3235.
- Parikh, L., Kodati, S., Eskelson, M. J., & Adesemoye, A. O. (2018). Identification and pathogenicity of Fusarium spp. in row crops in Nebraska. Crop Protection, 108, 120-127.
- Parsons, M. W., & Munkvold, G. P. (2012). Effects of planting date and environmental factors on Fusarium ear rot symptoms and fumonisin B1 accumulation in maize grown in six North American locations. Plant Pathology, 61(6), 1130-1142.
- Pfordt, A., Ramos Romero, L., Schiwek, S., Karlovsky, P., & von Tiedemann, A. (2020). Impact of environmental conditions and agronomic practices on the prevalence of Fusarium species associated with ear-and stalk rot in maize. Pathogens, 9(3), 236.
- R Core Team (2024). R: A Language and Environment for Statistical Computing. R Foundation for Statistical Computing, Vienna, Austria. <https://www.R-project.org/
- Ridout, M. E., Newcombe, G., & Godfrey, B. (2016). First report of Fusarium temperatum in diseased sweet corn ears in the Western United States. Plant Disease, 100(12), 2527-2527.
- Rolling, T., Zhai, B., Frame, J., Hohl, T. M., & Taur, Y. (2022). Customization of a DADA2-based pipeline for fungal internal transcribed spacer 1 (ITS1) amplicon data sets. JCI Insight, 7(1).
- Rostami, M., Koocheki, A. R., Mahallati, M. N., & Kafi, M. (2008). Evaluation of chlorophyll meter (SPAD) data for prediction of nitrogen status in corn (Zea mays L.). American-Eurasian Journal Agriculture Science, 3(1), 79-85.
- Sah, R. P., Chakraborty, M., Prasad, K., Pandit, M., Tudu, V. K., Chakravarty, M. K., ... & Moharana, D. (2020). Impact of water deficit stress in maize: Phenology and yield components. Scientific Reports, 10(1), 2944.
- Scauflaire, J., Mahieu, O., Louvieaux, J., Foucart, G., Renard, F., & Munaut, F. (2011). Biodiversity of Fusarium species in ears and stalks of maize plants in Belgium. European Journal of Plant Pathology, 131, 59-66.
- Schulz, B., Wanke, U., Draeger, S., & Aust, H.J. (1993). Endophytes from herbaceous plants and shrubs: effectiveness of surface sterilization methods. Mycological Research 97:1447–1450.
- Serna, L. (2022). Maize stomatal responses against the climate change. Frontiers in Plant Science, 13, 952146.
- Shelby, R. A., White, D. G., & Bauske, E. M. (1994). Differential fumonisin production in maize hybrids. Plant Disease, 78(6), 582-584.
- Song, X., Zhou, G., & He, Q. (2021). Critical leaf water content for maize photosynthesis under drought stress and its response to rewatering. Sustainability, 13(13), 7218.
- Stack, J. P. (1999). Common stalk rot diseases of corn. Cooperative Extension, Institute of Agriculture and Natural Resources, University of Nebraska--Lincoln.
- Su, P., Li, S., Wang, J. A., & Liu, F. (2021). Vulnerability assessment of maize yield affected by precipitation fluctuations: a northeastern united states case study. Land, 10(11), 1190.
- Tabashnik, B. E., Brévault, T., & Carrière, Y. (2013). Insect resistance to Bt crops: lessons from the first billion acres. Nature Biotechnology, 31(6), 510-521.
- Torres-Cruz, T. J., Whitaker, B. K., Proctor, R. H., Broders, K., Laraba, I., Kim, H. S., ... & Geiser, D. M. (2022). FUSARIUM-ID v. 3.0: an updated, downloadable resource for Fusarium species identification. Plant Disease, 106(6), 1610-1616.
- Uegaki, R., Kobayashi, H., Tohno, M., & Tsukiboshi, T. (2012). Identification of mycotoxin‐producing Fusarium spp. isolated from corn and the changes in concentration of fumonisin during the cultivation period. Grassland science, 58(3), 121-126.
- United States, US Department of Agriculture, Natural Resource Conservation Service, National Water and Climate Center. (2025, November 15). Air and Water Database. Water and Climate Information System. https://nwcc-apps.sc.egov.usda.gov/
- White, T. J., Bruns, T., Lee, S. J. W. T., & Taylor, J. (1990). Amplification and direct sequencing of fungal ribosomal RNA genes for phylogenetics. PCR protocols: a guide to methods and applications, 18(1), 315-322.
- Whitehead, J.C., E.L. Mecray, E.D. Lane, L. Kerr, M.L. Finucane, D.R. Reidmiller, M.C. Bove, F.A. Montalto, S. O’Rourke, D.A. Zarrilli, P. Chigbu, C.C. Thornbrugh, E.N. Curchitser, J.G. Hunter, & Law, K. (2023) Ch. 21. Northeast. In: Fifth National Climate Assessment. Crimmins, A.R., C.W. Avery, D.R. Easterling, K.E. Kunkel, B.C. Stewart, and T.K. Maycock, Eds. U.S. Global Change Research Program, Washington, DC, USA. https://doi.org/10.7930/NCA5.2023.CH21
- Winsten, J. R., Kerchner, C. D., Richardson, A., Lichau, A., & Hyman, J. M. (2010). Trends in the Northeast dairy industry: Large-scale modern confinement feeding and management-intensive grazing. Journal of Dairy Science, 93(4), 1759-1769.
- Wright, E. S. (2024). Fast and Flexible Search for Homologous Biological Sequences with DECIPHER v3. R Journal, 16(2).
- Vismer, H. F., Shephard, G. S., Van der Westhuizen, L., Mngqawa, P., Bushula-Njah, V., & Leslie, J. F. (2019). Mycotoxins produced by Fusarium proliferatum and F. pseudonygamai on maize, sorghum and pearl millet grains in vitro. International journal of food microbiology, 296, 31-36.
- Xia, Y., Sahib, M. R., Amna, A., Opiyo, S. O., Zhao, Z., & Gao, Y. G. (2019). Culturable endophytic fungal communities associated with plants in organic and conventional farming systems and their effects on plant growth. Scientific Reports, 9(1), 1669.
- Xiong, C., Singh, B. K., He, J. Z., Han, Y. L., Li, P. P., Wan, L. H., ... & Zhang, L. M. (2021). Plant developmental stage drives the differentiation in ecological role of the maize microbiome. Microbiome, 9, 1-15.
- Xue, Z., & Ullrich, P. A. (2022). Changing trends in drought patterns over the northeastern United States using multiple large ensemble datasets. Journal of Climate, 35(22), 7413-7433.
- Zhan, A., & Lynch, J. P. (2015). Reduced frequency of lateral root branching improves N capture from low-N soils in maize. Journal of Experimental Botany, 66(7), 2055-2065.
- Zhou, H., Zhou, G., He, Q., Zhou, L., Ji, Y., & Lv, X. (2021). Capability of leaf water content and its threshold values in reflection of soil–plant water status in maize during prolonged drought. Ecological Indicators, 124, 107395.
- Zi, X., Wang, W., Zhou, S., Zhou, F., Rao, D., Shen, P., ... & Wu, B. (2022). Prolonged drought regulates the silage quality of maize (Zea mays L.): Alterations in fermentation microecology. Frontiers in Plant Science, 13, 1075407.
Education & outreach activities and participation summary
Participation summary:
The results of this project will be shared with a wide range of stakeholders, including fellow researchers, PSU extension educators, producers, non-profits such as Pasa – PA sustainable agriculture and industry representatives. Sharing contributes greatly to foundational pathogen ecology, informs risk models for mycotoxin contamination of silage, and helps elucidate the impacts of seasonal uncertainty and drought stress in maize. With these results, I hope to contribute a greater understanding of the interactions between maize, Fusarium, and the environment. This work can be translated directly toward recommendations used by extension educators and to producer decisions regarding mycotoxin risk in silage and the implementation of pathogen and mycotoxin management approaches. Therefore, communicating the findings of this project with extension educators and producers is important to the impact of this project’s findings.
It is my goal to make the findings, data, and methods of this work easily accessible and approachable to fellow students and researchers across scientific fields. By doing so this work can directly contribute to future studies and continue to build on our understanding of maize, Fusarium spp., and climate. As such I will make the raw and filtered data, research methods, data analysis, and results interpretation available through the open access data sharing platform GitHub. And submit sequences generated from this work to the National Center for Biological Technology Information (NCBI) database.
Specific outreach goals: It is also my goal to communicate project results in a succinct and approachable manner that reaches the greatest number of stakeholders in the Northeast, especially producers. Therefore, I will publish a research review with Crop Protection Network (https://cropprotectionnetwork.org/), a summary that describes the main findings of my work. The Crop Protection Network is a multi-state and international partnership of university and provincial extension specialists, and public and private agents that provide critical information related to the protection of row crops including maize across the United States. Their website and publication network will allow me to connect with Pennsylvania and other Northeastern maize growers through a trusted and non-biased source and are optimal for the broad distribution of my research findings.
To communicate my work further with researchers, extension educators, and industry representatives in the Northeast the results of my project will be presented to audiences at the APS (American Phytopathological Society) Northeastern division meeting in 2026. The attendees of this regional meeting specialize in plant pathology and have an interest in understanding how environmental stress shapes pathogen ecology. Therefore, my work will contribute novel information on the interaction of drought stress timing, the Fusarium spp. community and pathogenic and mycotoxigenic Fusarium species in maize. I will also present at the Pasa – PA Sustainable Agriculture meeting where there are many growers and livestock producers who are interested in learning more about the implications of drought-stress on crops and willing to discuss sustainable solutions which will be useful for extending the impact of these results into the future.