Progress report for GNE24-338
Project Information
Agaricus bisporus, commonly known as button mushroom, should be harvested selectively by hand to preserve its high quality and delivered to the fresh market owing to its delicate skin, prone to bruise and drop in quality. However, the mushroom industry has confronted high costs and a shortage of skilled workers due to the labor-intensive environment of picking mushrooms. Studies have shown that harvesting mushrooms by bending and twisting individual mushrooms is effective in picking motions, as is the human harvesting approach. In the meantime, the pose and vicinity of each mushroom play crucial roles in picking them. This study aims to develop an autonomous robot to pick mushrooms using a vacuum cup-type end-effector with bending and twisting motion. Meanwhile, a machine vision system with a stereo camera will be developed for mushroom detection and decision-making on individual mushroom picking. Finally, a harvesting robot will be tested and evaluated by integrating the picking end-effector and the machine vision system. The outreach strategy includes the field demonstration of the developed robot to Pennsylvania growers and carrying out surveys, workshops, webinars, etc., to evaluate the current satisfaction and knowledge of the growers and educate them regarding the benefits of applying developed technology. The target of this proposal is to alleviate the labor shortage issue, which imposes high costs on the mushroom industry, and increase the quality and productivity of mushrooms.
The primary goal of this project is to develop a robotic harvesting system for picking button mushrooms in greenhouses. This research project will be focused on three objectives listed below:
- Develop image processing and deep learning algorithms using YOLOv CNN methods to identify the location, maturity, and estimate of mushrooms’ pose.
The coupled image processing and deep learning algorithms provide a robust system to detect and segment mushrooms from their background in real-time. Of different deep learning algorithms, we will be using YOLOv convolutional neural networks to accomplish this objective accurately. In the meantime, the system could find the individual mushroom’s pose in 2D and 3D, maturity, center point, and circle. This information will be sent to the
decision-making section to determine the next step.
- Develop a decision-making algorithm to assign the picking sequence and the bending direction of mushrooms for the picking process.
By acquiring information from the last stage to carry on the decision-making process, our developed algorithm will be able to identify the sequence of picking mushrooms using image processing techniques such as morphology characteristics. In addition, as the targeted mushrooms will be picked by bending and twisting, and because they grow in clusters, we will identify the bending direction so as not to injure nearby mushrooms.
- Develop an electrical and control system to move the robot's manipulator and a soft end-effector and pick mushrooms by bending and twisting mechanisms.
The collected information from the last objectives is fed to the control system to set the robot joints' rotation degrees, approaching orientation, plan to pick mushrooms, etc. As a result, the manipulation occurs, and a vacuum cup picks each mushroom, transfers it to the stem trimmer, and puts it in the
specified location.
The purpose of this project is to develop robotic harvesting to alleviate the labor shortage problem in the mushroom industry and pave the way for sustainable mushroom production. Pennsylvania produces around two-thirds of the Agaricus mushroom of the USA, about 408 out of 645 million pounds produced button mushrooms, a 945-million-dollar business, in 2022-23; of which 85% delivered to the fresh market and the remaining to processed production (USDA, 2023). However, historically, this industry produced approximately 827 million pounds (557 in Pennsylvania), of which 92% went to the fresh market in the 2018-19 season (USDA, 2019). Therefore, the stats show that mushroom production and fresh market supply experienced about 20% and 7% falls within the past four years, respectively. Also, the National Agricultural Statistics Service (NASS) reported that from 2008-09 to 2017-18, the number of growers in the US fell by about 20% (USDA, 2019). However, it gave up reporting as of the 2019-20 report (USDA, 2020). Other than that, the provided mushrooms for the fresh market are harvested selectively by hand due to the sensitivity of the mushrooms’ skin, longer shelf-life, appearance, and multiple harvesting flushes because of the different growing speeds of mushrooms. Therefore, high costs in the mushroom industry for skillful workers who work intensively are imposed because of the nature of picking mushrooms. In addition, there are problems with picking by workers, including the substantial skill of pickers to distinguish mature mushrooms appropriately, variation among pickers for harvesting mushrooms, health safety of workers, and constraints on laborers’ working hours, which generally comprise about 30% of mushroom production costs (Cunha Zied & Pardo-Giménez, 2017). In addition, based on the information provided by the USDA's Economic Research Service (ERS), the farm wage was substantially less than that of nonfarm in 2022, 40% lower, and farm growers report that finding workers was more difficult than usual (ERS, 2023). Hence, labor shortages are a significant issue in the mushroom industry. To address this, mechanical and robotic systems come into play.
Since the late 1970s, the introduction of mechanical mushroom harvesters resulted in higher efficiency, harvesting massively within minutes compared to manual harvesters taking days at the same crop area (Azoyam, 2004). Van den Top, a Dutch company, is an excellent example of a mechanical harvester cutting mushroom stems and transferring them with a conveyor roll (Vandentop, 2024). However, these types of harvesting require a specific mushroom growing shelf. Also, they pick mushrooms regardless of size and maturity; most are damaged and have low-quality products. To that end, the produced mushrooms are primarily suitable for processed consumption (Cunha Zied & Pardo-Giménez, 2017). For this reason, an accurate robotic system that can harvest mushrooms selectively is a better option to reduce production costs and maintain the high quality of mushrooms.
The first attempts to evaluate the viability of automatic picking mushrooms have been reported since the 1990s. The result showed that robotic harvesting for high-quality fresh market mushrooms is economically feasible and deducts between 15% and 30% of mushroom production costs (Cunha Zied & Pardo-Giménez, 2017). Lack of damage, contamination of casing soil, uniformity of size, and state of development define the high-quality mushrooms required by the fresh market. To meet these criteria, a robotic harvesting system should address some challenges, including identifying an appropriate size, location, grading, selecting, mechanism of picking so as not to damage or contaminate the mushroom or its neighbors, trimming the stem, and gently putting mushrooms into a container (Reed et al., 2001).
Tillett and Batchelor (1991) intended to characterize mushrooms visually and conducted the first image processing algorithms for mushroom detection and location identification (Tillett & Batchelor, 1991). However, Reed and Tillett conducted a preliminary robotic mushroom harvesting test in 1994. After localizing the mushrooms, they used their developed end-effector, a vacuum cup, to pick mushrooms. They discovered that bending as a detachment may enhance the picking performance compared to twisting (Reed, 1994). In 1997, Noble et al. built a more robust robot. They devised a sequence of bending, twisting, and picking mushrooms as a proper harvesting strategy, causing lower damage to mushrooms and increasing the picking success by over 80% (Noble et al., 1997). However, automatic mushroom harvesting systems have not gained popularity in the mushroom industry, and innovations have been released slowly (Cunha Zied & Pardo-Giménez, 2017).
Research
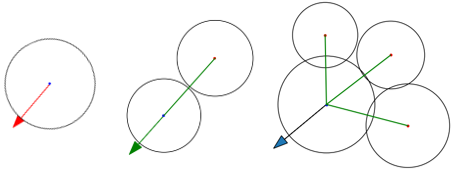
As mentioned in the introduction, the mushroom industry has a labor shortage. To tackle this challenge, an autonomous mushroom robot is proposed to increase not only the efficiency of production but also the quality of harvested mushrooms. Figure 1, indicating the different states of the project and depicting the approach to picking mushrooms.
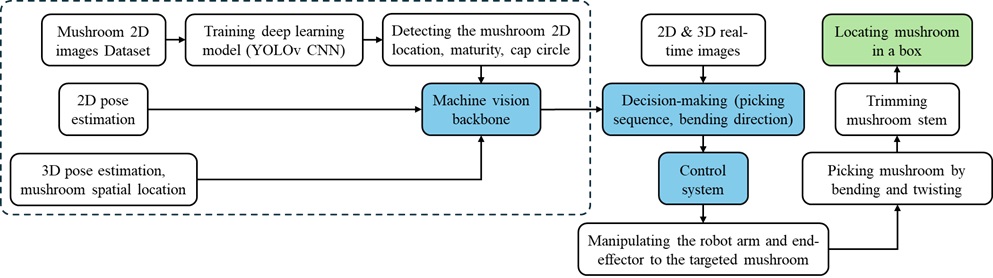
Figure 1. The illustration of picking mushrooms automatically.
Approach and Methods 1: Prepare a mushroom dataset and develop deep learning algorithms utilizing CNN models to detect mushrooms, assess their maturity through RGB-D imagery, and analyze their spatial arrangements.
To accomplish this objective, several interrelated tasks were undertaken, including mushroom dataset preparation; training convolutional neural network (CNN) models using RGB-D data; extraction of 2D and 3D features; and mushroom maturity assessment based on 2D pixel information and 3D geometric features, including cap diameter and surface curvature. These tasks are outlined as follows:
Task 1.1: The dataset preparation and image processing techniques utilized for 2D applications.
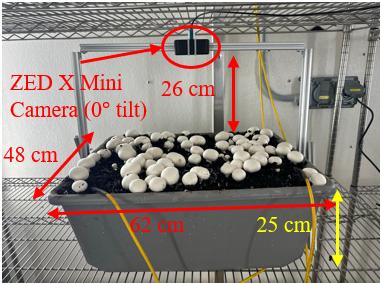
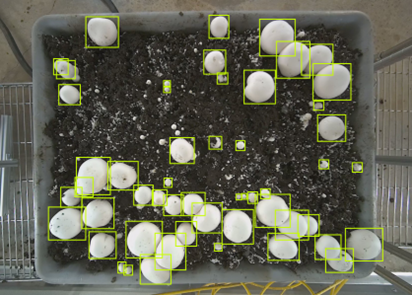
Button mushrooms were spawned and grown in tubs at the Mushroom Research Center (MRC) at Pennsylvania State University (University Park, PA). From May 15 to 25, 2024, images were automatically captured every two hours using two ZED X Mini Stereo cameras (StereoLabs, San Francisco, USA), each with a horizontal field of view (HFOV) of up to 110o, a vertical field of view (VFOV) of up to 80o, and a 2.2 mm focal length lens. The cameras were securely mounted 26 cm above two mushroom-growing tubs, facing directly downward (Figure 2-A) under uniform lighting conditions. The images were then uploaded to OneDrive cloud storage after each capture. An aggregate of 165 RGB-D images was obtained with a resolution of 1920×1200 and resized for training and testing to 640×640. Images were uploaded to the Roboflow website (Des Moines, Iowa) and annotated around 23,000 mushrooms using bounding boxes (Figure 2-B) for YOLOv5s format.
The dataset was randomly split into training, validation, and test datasets with a 70/20/10 ratio. The training set consisted of 115 images. However, by applying the Roboflow augmentation feature to the original images, such as horizontal flipping and noise addition, the number of images increased to 365.
 |
 |
| (A) | (B) |
Figure 2. (A) Imaging setup for dataset collection. The ZED X Mini stereo camera is mounted above the mushroom growing tubs in a top-down orientation., (B) Annotated button mushroom (Agaricus bisporus) mushroom image.
The training and testing were conducted using the YOLOv5s model with Python on a computing platform equipped with an NVIDIA RTX A2000 12 GB graphics card, a 12th Gen Intel(R) Core ™ i9-12900K CPU, and 128 GB of RAM, running a 64-bit Windows 10 OS and the PyTorch deep learning framework. The hyperparameters specified are 300 epochs and a batch size of 16. The training was initiated using COCO-pretrained weights (YOLOv5s.pt). The optimizer used was stochastic gradient descent (SGD) with a learning rate of 0.01 and a weight decay of 0.0005. Data augmentation techniques included HSV adjustments (hsv_h = 0.015, hsv_s = 0.7, hsv_v = 0.4), geometric transformations such as translation (0.1), scaling (0.5), and horizontal flipping (fliplr = 0.5), as well as mosaic augmentation. The evaluation metrics for this training are precision (P), recall (R), and mean average precision (mAP) with the following equations:
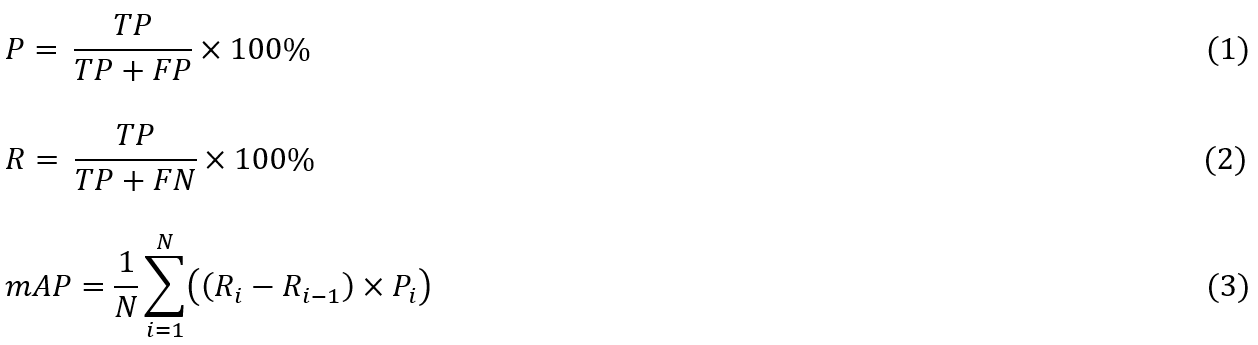
Where TP, FP, and FN are the number of true positives, false positives, and false negatives.
Task 1.2: Maturity assessment using the cap size in 2D images.
The mushroom cap curvature can indicate the mushroom maturity stage (Lee et al., 2020). However, this study utilized mushroom cap size as a proxy for maturity, with a possibility of picking slightly early or marginally late. Normally, a mature button mushroom has a 2-5 cm cap diameter (Zied & Arturo, 2017). To identify maturity, the mushroom cap size was estimated using a printed checkerboard with a 2×2 cm grid cell size. Images were captured at 11 cm to 35 cm camera height to the checkerboard with a 3 cm increment, and the pixels in multiple grid cells were counted. Therefore, a mushroom size can be estimated by calculating the number of pixels at the mushroom cap diameter and the camera’s height. A pixel threshold was set to differentiate mature and immature mushrooms. Figure 3 illustrates the checkerboard imaging setup.
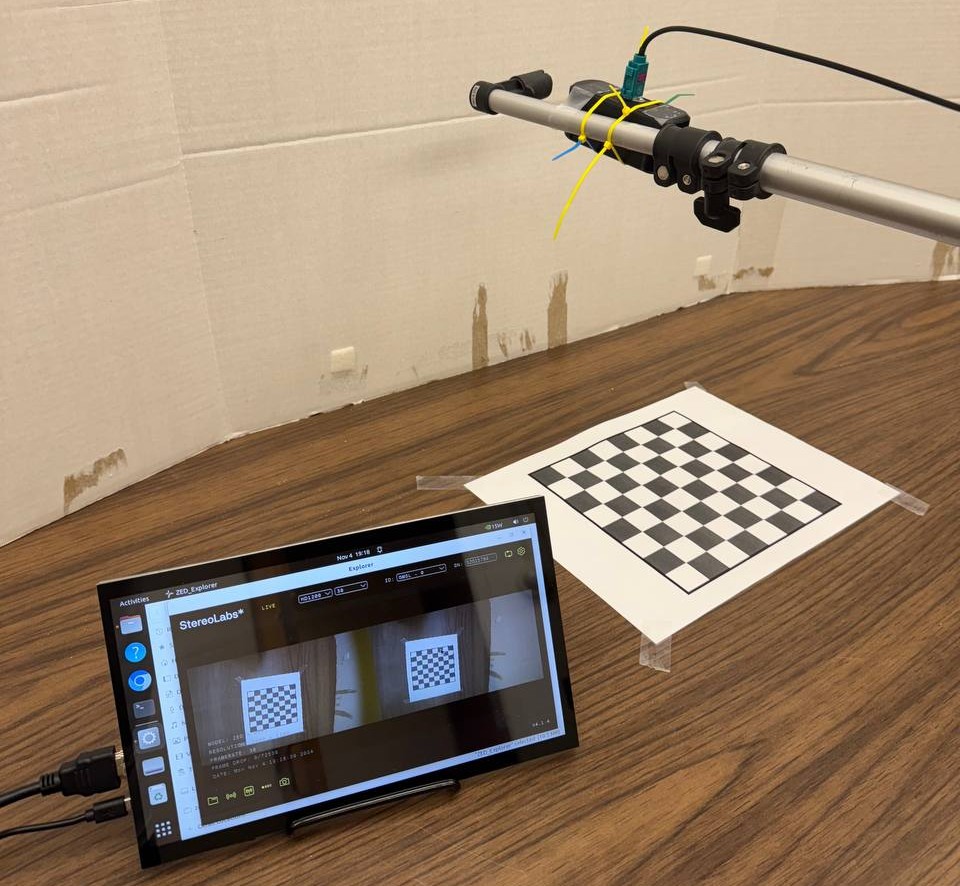
Figure 3. Checkerboard set up to count the number of 2×2 cm grid cell pixels in different camera heights to identify the pixel-based maturity threshold.
Task 1.3: Experiment samples for the bending distance in 2D
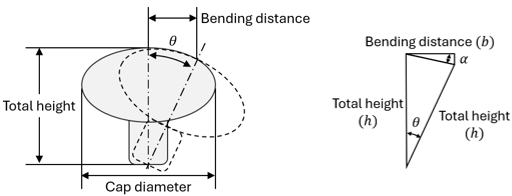
According to Huang et al. (2021a), the mushroom detachment angle for bending motion is 13.6 ± 6.7o. To achieve the bending distance (i.e., the shifted distance when a mushroom is bent to detach), a series of mushrooms with a variety of cap sizes and total heights were picked and measured (Figure 4-A). In addition, Figure 4-B presents the geometric schematic used to estimate the bending distance. Mushrooms were modeled as rigid during bending, where bending occurs about a fixed pivot at the stem-casing interface. The mushroom caps were approximated as circular, and the stems were straight. The following equation illustrates the bending distance based on the mushroom height and detachment angle:

where b is the bending distance, h is the mushroom total height, θ is the detachment angle, and α is the internal angle formed in the bending triangle. However, since measuring the cap diameter (d) is more practical than estimating mushroom height from 2D image analysis, a proportional relationship, referred to as the bending coefficient, between bending distance and cap diameter was established. The bending coefficient is defined as:

Therefore, the bending distance can be estimated by multiplying the bending coefficient and the cap diameter:
![]()
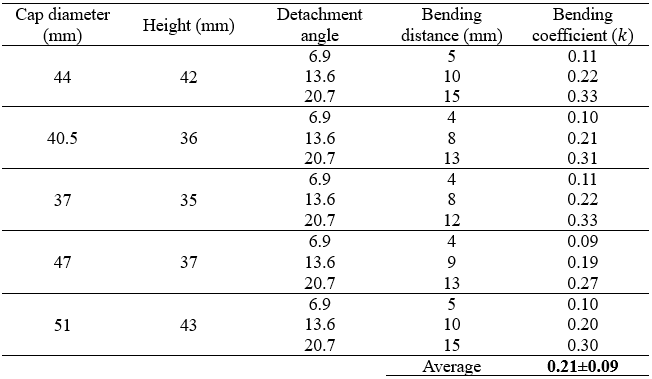
where d is the mushroom cap diameter and k is the bending coefficient. Table 1 shows the basic parameters of the test, which were taken into consideration for geometric calculations of the bending distance.
 |
|
| (A) | (B) |
Figure 4. (A) Cap diameter, total height, and bending distance measurements of the mushroom, (B) Geometric schematic of the bending distance
Table 1. Basic information about tested mushrooms. Values are mean ± standard deviation.
|
Total counts |
Cap diameter (mm) |
Total height (mm) |
|
39 |
43.2±4.8 |
38.3±3.4 |
Task 1.4: Spatial arrangement of mature mushrooms
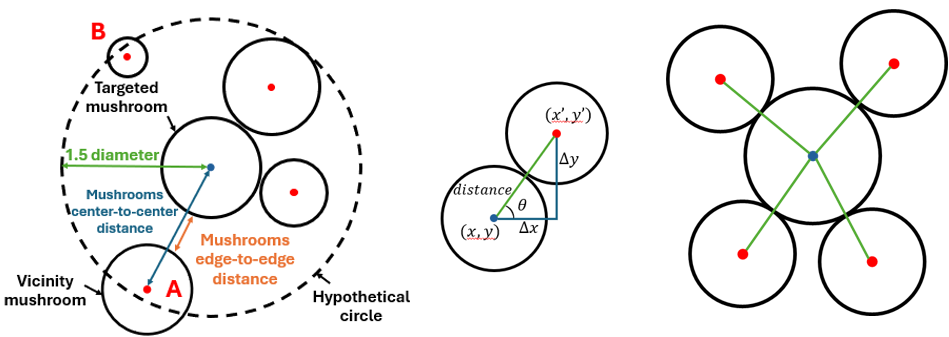
The YOLOv5s model not only detected the mushrooms but also provided a text file for each image, consisting of the location of the bounding boxes and their dimensions. This information corresponded to each mushroom image; the x and y locations of the center of each individual mushroom and their diameter (minimum value between width and height) were extracted. However, some small mushrooms were detected by the YOLOv5s model and formed noise. This noise increased the algorithm computation time. Therefore, a pixel-based diameter threshold was set to filter out irrelevant small mushrooms, and another pixel-based maturity threshold was applied to single out mature mushrooms. Subsequently, for each mature mushroom, the algorithm considered a hypothetical circle with a radius of 1.5 multiply the mushroom diameter to identify all possible neighboring mushrooms (Figure 5-A). The choice of a 1.5 radius stems from the fact that identifying neighboring mushrooms is based on the coordination of their points. If the radius of the hypothetical circle is too small and the neighboring mushrooms have large caps, the algorithm may fail to recognize them as vicinity. Nevertheless, their caps are still present and can lead to errors in the bending process (Mushroom A). However, some small distant mushrooms were also detected as vicinity mushrooms under this circumstance. To address this problem, the center-to-center distance between the targeted mushroom and each vicinity mushroom was calculated and subtracted from the radii of both mushrooms. As a result, the mushrooms edge-to-edge distance was measured and compared with the bending distance threshold. When the edge-to-edge distance was less than the specified value, the mushroom was considered as vicinity. Otherwise, it was excluded from the vicinity mushrooms (Mushroom B). The angular arrangement of the vicinity mushrooms was conducted concerning the targeted mushroom. The angles were identified through the tangent inverse of the angle (Figure 5-B).
where (x,y) is the center point of the targeted mushroom, (x',y') is the center point of the vicinity mushroom, and θ is the angle of the vicinity mushroom regarding the x-axis. Figure 5-C indicates the angular locations of the vicinity mushrooms positioned around the targeted mushroom. The information on all mushrooms in the vicinity was then added to a list for each targeted mushroom.
 |
||
| (A) | (B) | (C) |
Figure 5. Vicinity mushrooms detection and angular arrangement, (A) targeted mushroom with a hypothetical circle with a radius of 1.5 multiply its diameter to determine the neighboring mushrooms with less than edge-to-edge distance threshold (mushroom A), (B) to calculate the angle of vicinity mushroom in respect to the targeted mushroom and x-axis, (C) the angular arrangement of vicinity mushrooms regarding the targeted mushroom.
Task 1.5: The dataset preparation and image processing techniques utilized for instance segmentation in 3D applications.
The dataset prepared for 2D applications was also utilized for 3D applications, with minor modifications to the CNN training procedure. A collection of 188 RGB-D images at a resolution of 1920×1200 was acquired and subsequently resized to 800×800 for training and testing. Images were uploaded to the Roboflow platform (Des Moines, Iowa), and annotations were generated using the Smart Polygon feature powered by the Segment Anything Model (SAM) AI model. The dataset was randomly partitioned into train, validation, and test sets at a 70/20/10 ratio. The train set comprised 126 images, which were augmented to 378 images through the implementation of Roboflow augmentation features, including flipping and noise addition.
Training and testing were conducted utilizing the YOLOv8m instance segmentation model with Python on a computing platform equipped with an NVIDIA RTX A2000 12 GB graphics card, a 12th Gen Intel(R) Core ™ i9-12900K CPU, and 128 GB of RAM, operating under a 64-bit Windows 10 operating system and the PyTorch deep learning framework. The specified hyperparameters encompass 120 epochs, a batch size of 16, and an image size of 800. The training process commenced utilizing COCO-seg pretrained weights (yolov8m-seg.pt). The optimizer employed was stochastic gradient descent (SGD), configured with a learning rate of 0.01 and a weight decay of 0.0005. Data augmentation techniques included HSV adjustments (hsv_h = 0.015, hsv_s = 0.7, hsv_v = 0.4), geometric transformations such as translation (0.1), scaling (0.5), and horizontal flipping (fliplr = 0.5), as well as mosaic augmentation. The metrics for evaluating training performance include precision (P), recall (R), and mean average precision (mAP), as outlined in task 1.1.
Task 1.6: Post-processing of mushroom cap segmentation masks and point cloud data (PCD) extraction
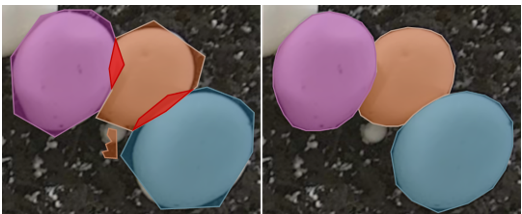
A mask for each individual mushroom cap was detected by the YOLOv8m instance segmentation model and subsequently overlaid on the captured image to extract point cloud data (PCD) from different mushroom tubs (Figure 6-A). However, the detected masks may have exhibited coarse and jagged boundaries, along with overlapping and noisy regions. This is attributable to discrepancies between the training and inference image resolutions, the up-sampling process of binary masks, and the quantized polygon representation. Therefore, it was necessary to apply post-processing to smooth boundaries using morphological operations, such as erosion and dilation, and to remove mask overlaps and noise (Figure 6-B).
 |
|
| (A) | (B) |
Figure 6. (A) Detected mushroom cap masks with red overlaps and noise, (B) Smoothed mushroom cap masks with overlap and noise removal.
Each individual 2D mask ([Height, Width]) was converted into a 4D tensor ([Batch, Channel, Height, Width]) to conform with the input format required by the PyTorch interpolation function. Both Batch and Channel dimensions were set to 1, as masks were processed sequentially and each pixel contained a single label. Given that the output masks possessed a lower resolution compared to the original image, they were resized to the original image size using nearest-neighbor interpolation to ensure the preservation of discrete mask values. The resized masks were employed to determine the pixel coordinates associated with each instance ID. These coordinates were subsequently mapped to the corresponding 3D coordinates (voxels) of the PCD. Instances with invalid values were excluded from subsequent analysis.
Task 1.7. PCD depth accuracy evaluation and noise removal
To evaluate the depth accuracy of the extracted point cloud, a checkerboard was positioned at five different locations relative to the camera on a flat surface with a consistent vertical offset of 45cm. One image was collected at each position. For each captured image, the distances from the center of each of the five designated checkerboard cells to the camera were measured manually utilizing a measuring tape and subsequently compared with the corresponding depth values estimated by the algorithm. The root mean square error (RMSE) was then computed between the measured and estimated values to quantify the point cloud depth accuracy.
To remove irrelevant voxels from PCD, a series of post-processing procedures was implemented. Initially, an iterative RANSAC (RANdom Sample Consensus) algorithm was utilized to assist in identifying the geometric shape of mushroom caps. RANSAC randomly sampled data points, fitted a model, and assessed its performance based on the number of inliers. The model was iteratively refined to maximize the number of inliers, resulting in a representation of the mushroom caps surface. Following RANSAC, a statistical outlier removal (SOR) method was employed to eliminate isolated voxels deviating from their local neighborhood. This method calculated the mean distance of each point to its nearest neighbors and identified and removed points whose distance exceeded the global mean and standard deviation.
In instances where mask misalignment resulted from interpolation, alongside false-positive (FP) detections, residual noise—such as curved or planar shapes—persisted despite the utilization of RANSAC and SOR methods. To mitigate these issues, the DBSCAN (Density-Based Spatial Clustering of Applications with Noise) algorithm was employed to identify and eliminate low-density noise regions. Ultimately, the PCD was down-sampled to decrease computational costs and improve processing efficiency.
Task 1.8. Mushroom maturity assessment employing mushroom cap diameter and surface curvature measures
Mushroom cap curvature serves as an indicator of its maturity stage. Mature mushroom caps tend to be flatter and more open (Lee, 2020). In addition, the typical diameter of a mature mushroom cap ranges from 2 to 5cm (Zied & Arturo, 2017). This study aimed to assess mushroom maturity by quantifying mushroom cap diameter and surface-curvature measures utilizing the principal curvatures, κ1 and κ2 . These represent the maximum and minimum values of all the normal curvatures (eigenvalues of the shape) at a specific point, where κ1 = 1/r1 and κ2 = 1/r2 (Figure 7). When κ1 = κ2, the point is umbilic, corresponding to a locally spherical or flat region (Callens & Zadpoor, 2018).
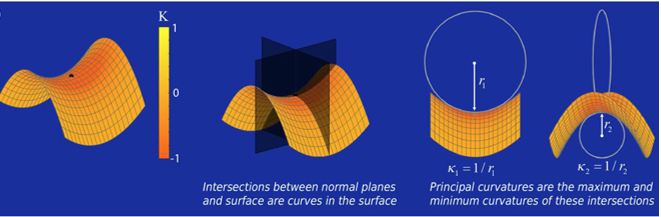
Figure 7. Principal curvatures κ1 and κ2 (Callens & Zadpoor, 2018)
To facilitate the calculation of the κ1 , κ2 , and the diameter of each mushroom cap, a local frame surrounding an anchor point P was estimated. For a set of neighboring 3D points {p i}i=1N, the local centroid μ and the corresponding 3 × 3 covariance matrix were computed as:
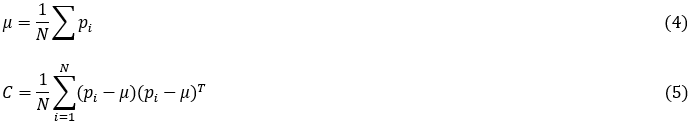
where N is the number of points. The anchor point P coincides with the local centroid C providing a stable and symmetric reference. Principal component analysis (PCA) of is obtained by solving the following equation:
![]()
which yields a set of eigenpairs (λj, νj) with λ1 ≥ λ2 ≥ λ3. The eigenvectors establish an orthonormal local frame: two tangent directions t1 and t2 (the largest variances λ1 , λ2) and the surface normal n (smallest variance λ3). Each neighbor pi is projected from the global coordinate system to the local coordinate frame centered at the anchor point P:
![]()
The surface in the vicinity of the anchor point P can be approximated using a quadratic height function on the tangent plane at this point:

where a, b, c, d, e, f are coefficients obtained by least squares on {(xi , yi , zi) }. To evaluate the curvature at the anchor point P, the local gradient equals zero. Therefore, the residual slope coefficients are d = e = 0. The principal curvatures are determined by the eigenvalues of the 2×2 Hessian matrix:

The combination of the principal curvatures produces different surface-curvature measures, including mean curvature H, curvedness C, and anisotropy r (Table 2).
Table 2. Surface-curvature measures produced by principal curvatures.
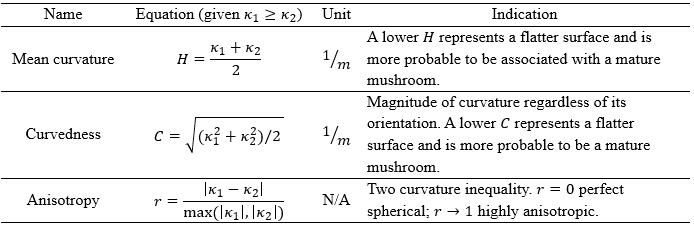
The mean curvature H and the magnitude of the curvedness C denote the extent to which the mushroom cap is domed. However, when the mushroom cap is deformed or partially occluded, one principal curvature collapses (κ2-› 0), resulting in the visible mushroom cap appearing cylindrical. In such cases, H and C can be low even for an immature mushroom cap. A high value of anisotropy r flags these cases.
To determine the diameter of the mushroom cap, the distance between the anchor point P and each point in the mushroom PCD was calculated by projecting its translation vectors (Pi = pi - μ) onto the local tangent plane by t1 and t2 (Eq. 10). The equivalent diameter of the mushroom cap was determined by doubling the robust 95%-percentile estimator of the surface points in order to mitigate the effects of noise and incomplete point coverage (Eq. 11):
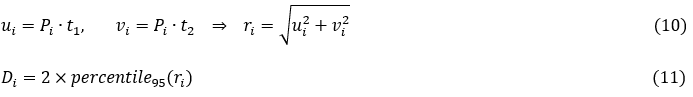
where ui and vi are the projections of the translation vector on the t1 and t2 tangent plane, respectively, and ri is the in-plane radial distance of each point from the anchor point, and Di is the equivalent mushroom cap diameter.
To evaluate the accuracy of the estimated diameter of the mushroom cap, the algorithm measurements were compared with the actual diameters of 100 mushroom caps, which were measured using a caliper. In addition, the diameter and three surface curvature measures were computed for 117 mushroom caps, which were manually classified into two categories (40 immature and 77 mature) by a human annotator. The extracted measures were employed as inputs to a linear support vector machine (SVM) classifier, with a cost parameter C = 1.0, a 75/25 train-test split, and balanced class weighting. Precision, recall, and F1-score were employed to evaluate the classification performance. To minimize the computational cost of the pipeline and enhance mushroom maturity assessment precision, mushrooms with cap diameters exceeding 4 cm were directly classified as mature, whereas those with diameters less than 3 cm were classified as immature. The assessment of mushroom maturity was subsequently conducted using diameter-based decision rules in conjunction with an SVM classifier. This methodology was employed on a total of 576 mushroom caps, comprising 198 immature and 378 mature samples. A confusion matrix was constructed to evaluate the mushroom maturity assessment pipeline results, and precision, recall, and F1-score were employed to quantify its overall performance.
Approach and Methods 2: Develop a decision-making algorithm to assign the picking sequence and the bending direction of mushrooms for the picking process.
Task 2.1: Decision-making and bending direction strategies in 2D
As the first step of picking, the decision of bending direction for a mushroom was made with respect to the targeted mushroom spatial configuration (Figure 8). When the mushroom was isolated (Figure 8-A), the algorithm arbitrarily opted for one bending direction in the span of 0o and 360o. Yet, in the case of single-vicinity mushroom, the bending direction was 180o opposite its angle of the vicinity mushroom (Figure 8-B). For multi-vicinity mushrooms with a broad free area on the side, the detachment direction was the bisector of the reflex angle between mushrooms (Figure 8-C).
 |
||
| (A) | (B) | (C) |
Figure 8. Arrangements of vicinity mushrooms: (A) an isolated mushroom with a random bending direction, (B) the bending direction is opposite to the vicinity mushroom angular arrangement, (C) the bending direction is the bisector of the reflex angle between mushrooms.
When three or more vicinity mushrooms were distributed around the targeted mushroom, the area between mushrooms would be calculated later, provided the broadest middle angle was more than 90o (Figure 9). To proceed, a block arch (required area for bending the mushroom) starting from one vicinity mushroom to another would be considered (blue and green areas). The width of the arc was equal to the bending distance. It should be highlighted that the arch had some intersections with the vicinity mushroom circles (blue area), and the algorithm was set up to verify if intersections were below a certain threshold. If that was the case, the area between mushrooms was determined to be sufficiently spacious for bending a mushroom. Subsequently, the bending direction would be the bisector of the middle angle between the vicinity mushrooms.
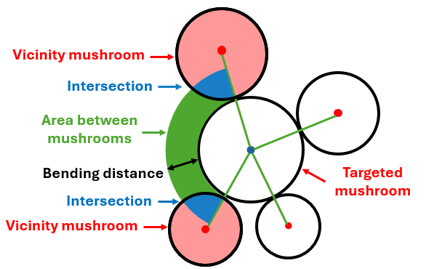
Figure 9. Illustration of a block arch with the bending distance width between the center points of vicinity mushrooms with over 90o middle angle. If the aggregate intersections (blue area) were below a certain threshold, the area between mushrooms (green area) would be sufficient for bending mushrooms toward.
Task 2.2. Clustering and picking sequence in 2D.
To obtain the clustering distribution in the mushroom tubs, a DBSCAN (density-based spatial clustering for applications with noise) (Ester et al., 1996) was implemented to position mature mushroom clusters and controlled by the eps (ε) and minPts parameters. The eps (ε) is the maximum distance between two points to be considered as neighbors, and the minPts is the minimum number of points required to form a dense region. In addition, as mushrooms have diverse cap sizes, the corresponding diameter for each mushroom was attributed as a weight to each point to adjust and fine-tune the clustering. Also, since the number of clusters varied from tub to tub, the performance of clustering was evaluated by implementing the silhouette coefficient metric with the following equation:
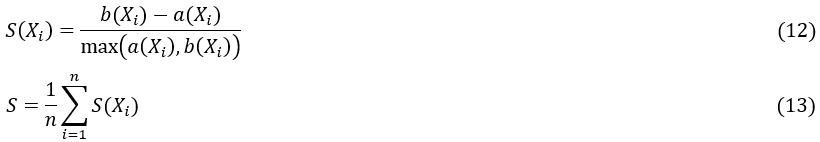
where S is the silhouette coefficient, Xi is the sample, a is cluster cohesion, b is cluster separation, and n is the number of samples. The range of the silhouette coefficient is between -1 and 1. A higher value of this coefficient is attributed to a better coherent cluster (Belyadi & Haghighat, 2021). To set the eps (ε) parameter, the Euclidean distance (dk) from each mature mushroom center (xi) to its 3rd-nearest neighbor (k = 3) was computed and the values {dk(xi)} were sorted to obtain the k-distance curve (Figure 10). The curve is flat for dense interior mushrooms and rises sharply (forming an elbow) for isolated mushrooms. The elbow was estimated by the 95th percentile of the sorted distances, εˆ=P95({dk}). It means about 95% of mushrooms have at least three neighbors within εˆ. The search for eps (ε) was limited to a band around the elbow εˆ:
![]()
The value δ was selected conservatively. For each mushroom tub, the minPts parameter was varied from 1 to 5, and eps (ε) within the band. The pair was selected based on the highest value of the silhouette coefficient. The average and standard deviation of the silhouette coefficient were calculated for 29 mushroom tubs with different numbers of mushrooms and arrangements. The clustering procedure involved partitioning mushrooms into separate clusters, structuring the ordering step, and enhancing the efficiency of decision-making and picking sequence. Subsequently, the algorithm followed the cluster orders based on the average Euclidean distance of each cluster from the origin to select mature mushrooms.
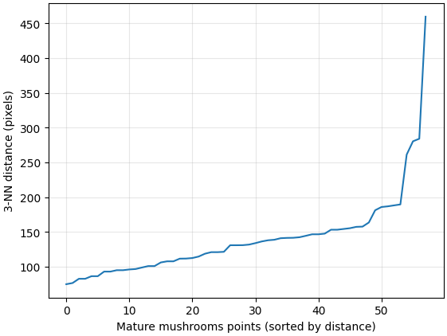
Figure 10. Example of k-distance curve for the 3rd-nearest neighbor for each mature mushroom point. The sharp increase (elbow) indicates the density break and is used to select the DBSCAN eps (ε) parameter with minPts = 4.
Following the mushrooms spatial arrangement in each cluster, the algorithm put targeted mushrooms in a sequence according to the Euclidean distance of the mushrooms to the origin (0, 0). So, mushrooms closer to the origin were set to be picked first (Figure 11). The picking sequence and number of vicinity mushrooms were updated right after a decision was made for a targeted mushroom. Therefore, the algorithm followed the picking sequence given that the previously identified mushroom no longer exists. Figure 12 illustrates the picking sequence and bending direction. In this cluster, seven mature mushrooms are identified and need to be picked in a sequence. It is expected that these mushrooms are picked without collisions with their neighbors.
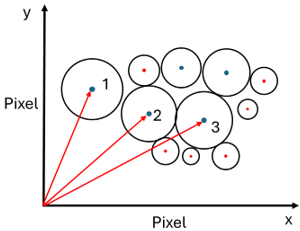
Figure 11. Assigning of picking sequence in a cluster based on the Euclidean distance of the mature mushrooms to the origin (0,0).
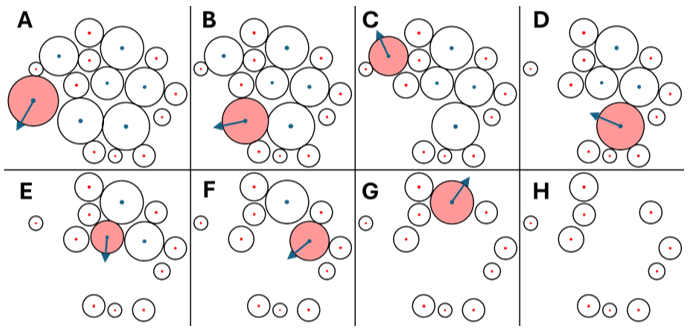
Figure 12. The picking sequence and bending directions of mature mushrooms from image A to image H, respectively.
Task 2.3. 2D decision-making algorithm validation
Several mushrooms, according to the preceding vicinity mushroom arrangements (Figure 8), were selected to provide ground truth for the model. The number of evaluated mushrooms is represented and distinguished according to each arrangement in Table 3. Subsequently, mushrooms within different arrangements were fed to the detection and decision-making algorithms, respectively, to estimate the related bending directions and to what extent the algorithm could outline the correct directions in each arrangement.
Table 3. The number of tested mushrooms within different arrangements (illustrated in Figure 8).
| Arrangement | A | B | C |
| No. mushrooms | 10 | 10 | 10 |
The algorithm's decisions regarding bending direction and picking sequence performance for the entire mushroom bed needed to be evaluated to determine the mushroom-picking strategy. To establish this, 29 images were taken from 29 tubs, with each containing an average of 64 mature mushrooms. Subsequently, the mushrooms in the images were detected, and the picking strategies and bending direction were obtained from the decision-making algorithm for all tubs. To test the feasibility of the algorithm, 90 randomly selected mushrooms were picked by a human picker following the bending direction and picking sequence obtained from the algorithm.
Task 2.3: 3D bending direction determination
The detection of mushroom PCD, along with measurements of their cap diameter and an assessment of their maturity, has facilitated the development of the mushroom picking sequence and bending determination. To identify the vicinity arrangement surrounding each targeted mushroom, proximity thresholds were established in both horizontal (xy) plane and the vertical (z) direction. Initially, the center-to-center distance between two mushrooms i and j was calculated as:

Subsequently, the maximum permissible distance τ between their centers was established as follows:
![]()
where Di and Dj represent the diameters of the two mushrooms, and is a user-tunable proximity coefficient. When k = 1, the envelope represents idealized circular mushroom caps that only contact at their boundaries. However, due to partial occlusion of mushroom caps, their irregular shapes, and the diameter estimates derived from noisy PCD, a k>1 was employed to expand the envelope and enhance robustness against shape variability, measurement noise, and segmentation uncertainty. Furthermore, a marginally larger value of k permitted the algorithm to accommodate the bending distance of mushrooms and to prevent potential collisions during the bending action. A mushroom was classified as a vicinity if dij ≤ τij (Figure 13).
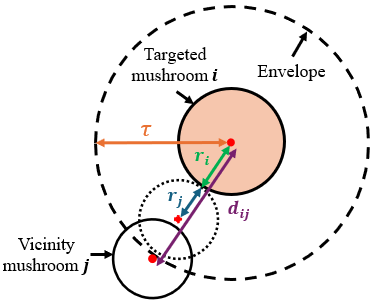
Figure 13. Schematic of vicinity mushroom detection on the horizontal plane. The mushrooms center-to-center distance dij was compared with the adaptive envelope using the maximum allowable distance threshold τij, defined as τij = k(ri + rj).
To further evaluate the vertical threshold, the disparity between the height components of two mushrooms was calculated, normalized by a scaling constant zscale, and compared with a user-defined maximum vertical gap zgap_max. The zscale compressed the vertical axis to mitigate the impact of slight height variation, because mushrooms primarily block each other laterally rather than vertically. Consequently, the vicinity region surrounding each mushroom was visualized as an oblate spheroid compressed along z axis and elongated within the xy plane.
However, there was a slight deviation between how the open-space region was identified in this 3D methodology. In 2D appraoch, the open-space region angle was exclusively determined based on the angular position of the center-to-center lines from the targeted mushroom to vicinity mushrooms A and B (i.e., the reflex angle between CA and CB). This study refined the calculation by incorporating the physical sizes of the vicinity mushrooms (rA and rB). As illustrated in Figure 14, the available open-space region was identified by taking the angular range between CA and CB, and subtracting the occupied regions defined by θA and θB. The bisector of this refined open-space region provided a more realistic and precise determination of the bending direction.
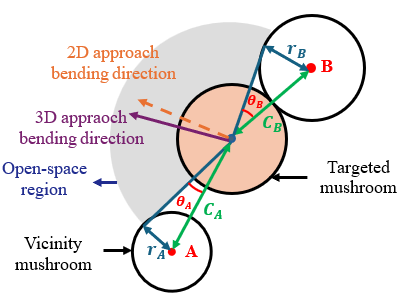
Figure 14. Refined calculation of the targeted mushroom bending direction by incorporating the sizes of the vicinity mushrooms (rA and rB) and their respective occupied angular spans (θA and θB).
Task 2.4. 3D picking sequence algorithm
Determining an appropriate picking sequence is a vital strategy for reducing the travel distance of the robotic end-effector during mushroom harvesting and enhancing the probability of successfully detaching each mushroom from the bed. In the proposed algorithm, once the PCD of the mature mushroom caps and their vicinity arrangements were identified, the mushrooms were grouped into clusters solely to structure the harvesting strategy.
Specifically, as illustrated in Figure 15, if mushroom A was within the vicinity of mushroom B, and B was within the vicinity of C, the algorithm classified them within the same cluster (Cluster 1), even in the absence of direct adjacency. In contrast, mushrooms separated by significant gaps, such as mushroom D, were treated as independent clusters (Cluster 2).
The algorithm identified the initial cluster for harvesting cluster (Cluster 1) by evaluating and selecting the shorter Euclidean distances to the centroid of the nearest mushroom in each cluster (mushrooms A and D). The mature mushrooms within the identified cluster were assigned a picking sequence according to their Euclidean distance from the origin and the available open-space region suitable for bending.
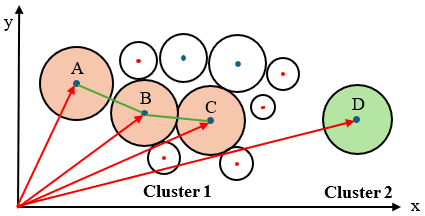
Figure 15. Example of grouping mushrooms into clusters based on the detection of the vicinity arrangement of mature mushrooms. The initial harvest cluster (Cluster 1) was selected according to the centroid of the mushroom with the closest Euclidean distance to the origin (mushrooms A). The green lines indicate mushroom vicinity arrangement; the red arrows denote the Euclidean distance to the origin. Cluster 1: Mushrooms A, B, C. Cluster 2: Mushroom D.
Task 2.5. 3D mushroom bending direction and picking sequence validation
To validate the determined bending directions and picking sequence by the developed pipeline, a total of 268 mushrooms within different vicinity arrangements were examined across three mushroom tubs: 37 in the isolated arrangement, 117 in the single-vicinity arrangement, and 114 in the multi-vicinity arrangement. Mushrooms were harvested according to the picking sequence determined by the pipeline. For isolated mushrooms, the bending was arbitrary, as the pipeline also determined a free direction.
For the other mushroom vicinity arrangements, wooden skewers were inserted into the center of each targeted mushroom and the corresponding vicinity mushrooms in order to physically represent their angular arrangements (Figure 16-A). For the single-vicinity arrangement, the skewers were placed into the middle slot of a corner-angle finder. The targeted mushroom was subsequently bent, while the skewer followed a direction opposite to that of the vicinity mushrooms towards the determined pipeline direction (Figure 16-B).
In the case of a multi-vicinity arrangement, the open-space region angle was determined utilizing a digital angle finder and subsequently compared with those determined by the algorithm. (Figure 16-C). During the bending process, the skewer of the targeted mushrooms was positioned in the central slot of the corner angle finder, while the skewers of the vicinity mushrooms were placed in the side components (Figure 16-D). This configuration ensured that the targeted mushroom was oriented toward the bisector of the measured reflex angle, thereby facilitating comparison with the algorithm-predicted bending direction.
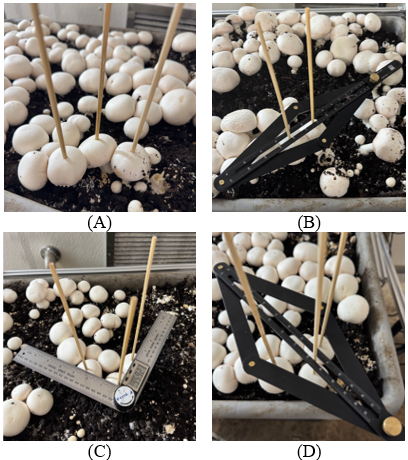
Figure 16. Experimental setup for validating the algorithm-predicted bending direction. (A) Wooden skewer inserted into the center of the mushroom cap of the targeted mushroom and its vicinity mushrooms, (B) For single-vicinity arrangement, the wooden skewers inserted into the mushrooms were positioned within the central slot of a corner-angle finder. The targeted mushroom skewer was guided in the direction opposite to the vicinity mushroom, (C) Determination of the available open-space region angle using a digital angle finder for multi-vicinity arrangement, (D) For multi-vicinity arrangement, the targeted mushroom skewer is positioned in the central slot, while the vicinity mushroom skewers are placed against the side components of a corner-angle finder. This arrangement is intended to guide the central skewer toward the bisector of the determined open-space region angle.
The entire pipeline was applied to 378 mature mushrooms of varying sizes and arrangements to determine the bending direction and picking sequence for each mushroom cap. Additionally, the procedure aimed to evaluate the number of remaining unassigned mushrooms.
Approach and Method 3: Develop an electrical and control system to move the robot's manipulator and a soft end-effector and pick mushrooms by bending and twisting mechanisms.
This objective has two main sub-sections to accomplish.
Task 3.1: To develop a manipulator and soft end-effector for mushroom picking.
For this project, the SCARA manipulator is proposed to pick mushrooms (Figure 17). This mechanism has parallel-axis joints with six degrees of freedom (DoF), two linked arms, and human arms. The manipulator revolves around each joint to cover a vast area or mushroom tray, and the far-end ones do the twisting motion for picking mushrooms. Furthermore, the vertical motion happens at the end joint connected to the soft end-effector to make the picking motion. Also, for the bending motion, two different scenarios are suggested here. The first is to add another joint (stepper motor) at the far end to tilt the end-effector and bend the mushrooms, followed by twisting and lifting. This scenario guarantees bending even with mushrooms with different poses but adds complexity to the system and increases the number of DoF. The other scenario is to move the distant arm toward any direction and expect the end-effector to cause bending on mushrooms. This mechanism is more straightforward and faster. The performance of each should be investigated through experiments. In addition, the camera will be located at one of the arms between joints to have the best view over mushroom trays.
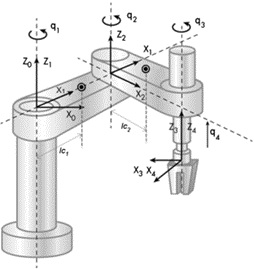
Figure 17. A SCARA manipulator (Torres-Del Carmen et al., 2020) that can be used for mushroom picking robot
The intended soft end-effector for this project is a vacuum cup. Figure 18 illustrates how the suction cup grips the mushroom cap to pick mushrooms. This cup is connected to a pump, and once it gets close to the targeted mushroom, it will stick to the caps to pick it up.
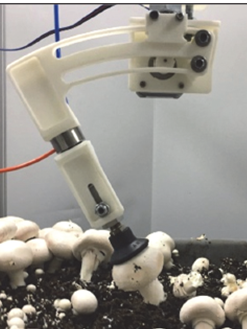
Figure 18. A soft end-effector is used to pick mushrooms by bending them (Huang, Jiang, et al., 2021).
An electronic system controls these systems. The information obtained by the machine vision section is sent to the controller to plan the path, move the manipulator, and locate the end-effector exactly above the targeted mushroom.
Task 3.2: To develop a stem trimming end-effector for harvested mushrooms.
Once the mushroom is picked, the soiled stem portion should be cut to remove the basal attachment of the casing soil. This task will be conducted using a stem-trimming system, which will be equipped with a photoelectric sensor and a knife. Once the harvested mushroom is held in front of the sensor using the vacuum cup, the knife is activated. The knife moves forward and trims the stem end. Finally, the end-effector will put the mushroom in the dedicated box.
CNN model training result and discussion for 2D applications:
The performance of the YOLOv5s model for button mushroom detection was evaluated through standard metrics of precision, recall, and mean average precision (mAP) for 300 epochs. The precision and recall were 92% and 94%, respectively. The mAP was 97% at an IoU threshold of 0.5 (Table 4).
Table 4. YOLOv5s model training result of mushroom detection under IoU of 0.5
|
Network model |
Precision |
Recall |
Mean Average Precision (mAP) |
|
YOLOv5s |
92% |
94% |
97% |
Results indicate that this model effectively detected mushrooms of different sizes in mushroom tubs, similar to the results of Chen et al. (2023). The model was able to detect most mushrooms that were partially obstructed by others in clusters and discern stems from mushroom caps. Consequently, the outcome of this model can be proclaimed reliable for further experiments. The model mistakenly detected one mushroom as two mushrooms when there was a casing substrate on the top of the cap. This issue might be addressed by increasing the size of the mushroom dataset.
Maturity assessment result and discussion based on cap size:
Upon image collection from different camera heights, the pixel numbers were counted for 2-cm grid cells (Figure 19). The curve showed a logarithmic relationship represented by the following equation:
![]()
where P represents the number of pixels for 2 cm at the camera height H; thus, through understanding the camera height, the number of calculated pixels represents the specific maturity threshold for the mushroom. The calculated R2-score was 97%. The farther the checkerboard was from the camera, the fewer pixels were in the grid cell.
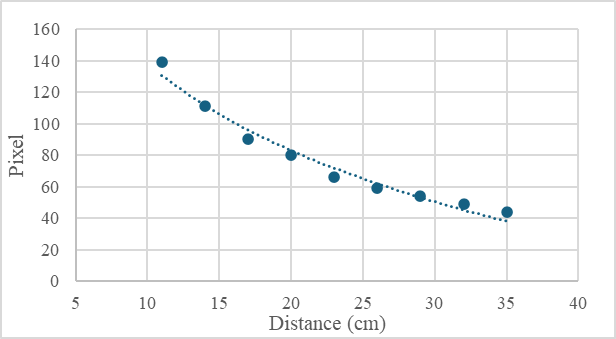
Figure 19. The relationship between the number of pixels for a 2×2 cm grid cell checkerboard vs. ZED X mini camera height.
Results represent the effectiveness and reliability of the method. In addition, according to Lee (2020), mushroom cap curvature estimation using point clouds is another pivotal maturity indicator. In addition, owing to the camera’s lens distortion, the mushrooms near the image edges underwent a mild curve. Therefore, the maturity estimation of border mushrooms may have contained some discrepancies. Incorporating external lighting systems can also help reduce shadows and improve detection reliability in challenging visual conditions.
2D-based bending distance result and discussion
Bending distance is an important consideration for determining the feasibility of harvesting button mushrooms. To determine this distance, the cap size and height of 39 mushrooms were measured, and the geometric calculations were conducted for the longest bending distance of the lowest and highest detachment angles, 6.9o and 20.7o, respectively. The results revealed a bending coefficient of 0.21±0.09, indicating that the bending distance can be estimated by multiplying the bending coefficient (k) by the cap diameter. Table 5 presents examples of bending distance for mushrooms with variable cap diameter and height. To ensure the designated bending direction can effectively pick mushrooms, the bending coefficient was set to 0.3.
Table 5. Examples of the bending distance for different detachment angles
Bending mushrooms, as a first step of the proposed harvesting method by Noble et al. (1997), requires free space around the targeted mushroom. The geometric calculation of the detachment angle, as derived by Huang, et al. (2021), represented that a bending coefficient (k) of 0.21±0.09 multiplied by the mushroom cap diameter provides sufficient bending distance for successful detachment. Additionally, as the pose of mushrooms might vary during their growth stage (Baisa & Al-Diri, 2022; Retsinas et al., 2023), estimating the pose can fine-tune the estimation of the bending distance.
Mature mushrooms clustering and spatial arrangement results and discussion for 2D application
Once the mushrooms in the growing bed (Figure 20-A) were detected by the YOLOv5s model, and mature mushrooms were distinguished by cap size pixel thresholding (Figure 20-A), the small mushrooms with less than half the size of the cap threshold were filtered out (Figure 20-A). Subsequently, the vicinity mushrooms were identified according to the hypothetical circle around mature mushrooms and their bending distance. Mushroom clusters were then identified based on eps (ε) and minPts thresholds of each individual mushroom tub to achieve the best clusters (Figure 20-D). It is worth noting that DBSCAN performance was robust to the different values of minPts and sensitive to the choice of eps (ε), with cluster formation being affected by slight variations in this parameter. Hence, the weighted average of the silhouette coefficient for the 29 mushroom tubs is provided in Table 6, where the weights were the number of mature mushrooms in each tub. The algorithm then outlines the angular arrangement of the vicinity mushrooms for every mature mushroom. Figure 22 shows an example of the angular arrangement of neighboring mushrooms around a target.
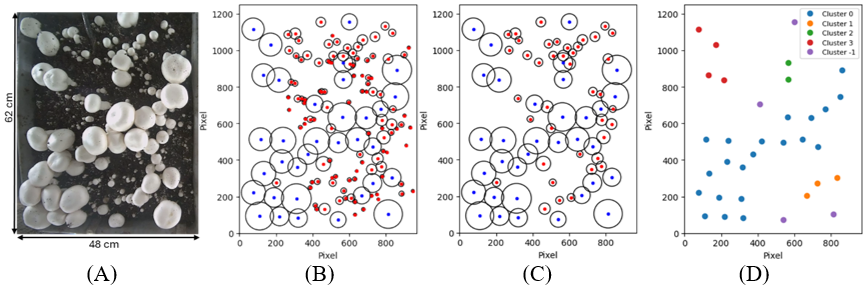
Figure 21. (A) mushrooms in a growing bed, (B) mushroom sketch with noise, (C) mushroom sketch after noise removal, (D) mushroom clusters.
Table 6. Weighted silhouette coefficient for 29 mushroom tubs with different clustering arrangements
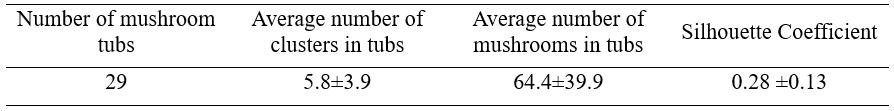
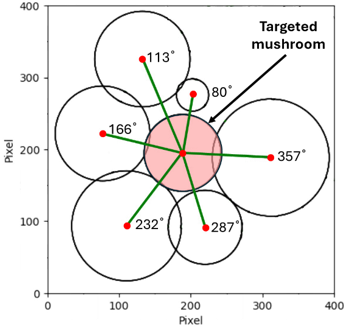
Figure 22. Example of an angular arrangement of vicinity mushrooms
The weighted average of the silhouette coefficient indicated that mushroom clusters are not clearly discernible and coherent. With an increase in the number of mushrooms in the tub, the number of clusters was reduced, and in some cases, only one cluster could be detected. Therefore, the number of mature mushrooms had an adverse relation to the number of clusters. As a result, recognizing clusters and splitting mushroom beds into different sections would be unfeasible if the number of mushrooms exceeds a certain threshold. This reflects increased mushroom density, which complicates picking path planning due to reduced free space for bending mushrooms. It is worth noting that dividing mushrooms into different clusters was only to partition dense arrangements to structure the ordering step for the decision-making and picking sequence algorithm. Clustering was a geometric separation indicator, and it did not determine the picking feasibility. However, the developed algorithm could easily detect mushrooms in the vicinity of targeted mature mushrooms, representing the effectiveness of spatial arrangement detection.
Decision-making ground truth result and discussion for 2D application
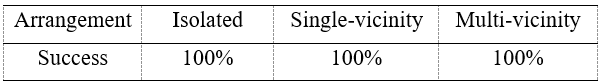
The ground truth of the decision-making algorithm utilized ten different mature mushrooms for each single mushroom arrangement. Figure 23 shows examples of mushrooms tested for ground truth in the estimated bending directions. For isolated arrangement, the red arrows were arbitrarily estimated as the bending directions for single isolated mushrooms. However, single-vicinity arrangement, the estimated green bending arrows were 180o opposite the location of the vicinity mushrooms. Finally, the estimated bending directions for multi-vicinity arrangement were the bisector of the reflex angle. Table 7 shows that the ground truth success for different arrangements was 100%, and the algorithm could estimate all bending arrows precisely.
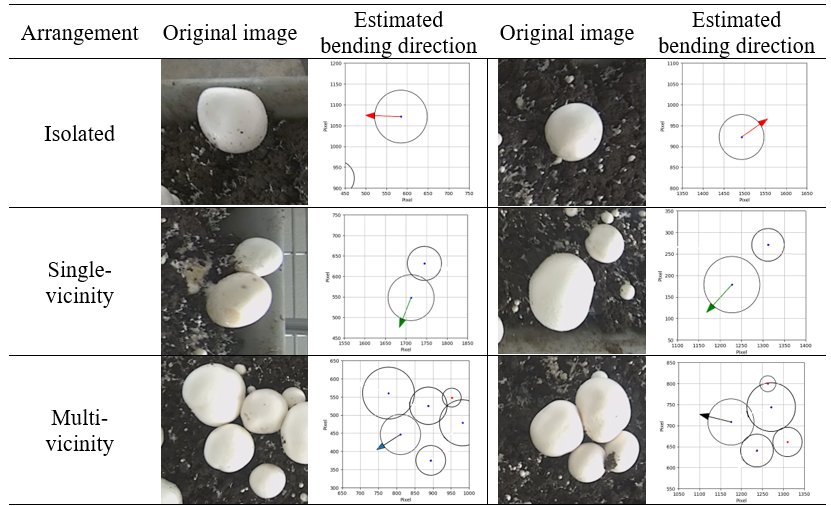
Figure 23. Examples of the estimated bending directions for ground-truth mushrooms in various arrangements. Each row represents the corresponding original image and its estimated bending direction plot. Arrows indicate the estimated bending direction based on the number of vicinity mushrooms.
Table 7. Success (%) results in the estimated bending directions for different mushroom arrangements
The ground truth results represent the algorithm’s capability to determine mushroom location vicinity detection, mushroom arrangement recognition, and the most appropriate bending direction. Moreover, the suggested intersection method can perceive free space in the mushroom neighborhood, providing a solution for unbendable mature mushrooms according to the current strategy thresholds. This method needs to be evaluated in the future to identify the proper intersection threshold between the targeted mushroom and the vicinity ones.
Decision-making and picking sequence evaluation result and discussion for 2D application
Multiple mushroom tub images were examined to determine the performance of the decision-making and picking sequence algorithm. Figure 24 shows the result of one of the clusters in the tubs. The algorithm successfully detected mushroom arrangements for each individual targeted mushroom, colored in pink, and determined the bending directions accordingly. Also, the in-cluster picking order shows that the algorithm successfully followed the picking sequence based on the Euclidean distance to the origin. Table 8 shows that the decision-making and picking sequence algorithm devised strategies to harvest the detected mushrooms.
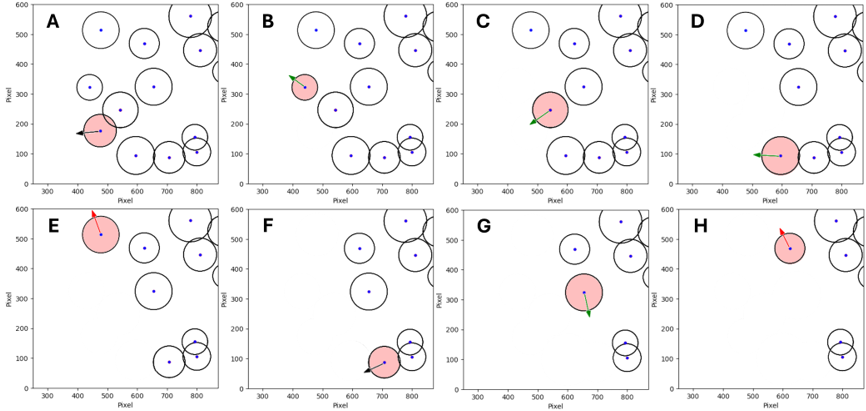
Figure 24. Picking sequence and bending direction decisions in one of the mushroom tubs’ clusters from graph A to H, respectively.
Table 8. Correctness of the bending decision with the decision-making and picking sequence algorithm
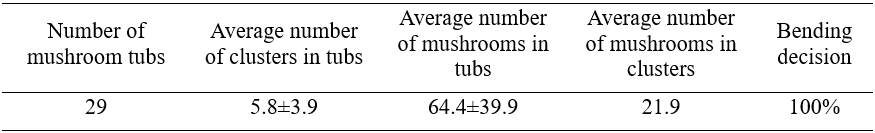
By following the bending direction and picking sequence from the algorithm, 90 randomly selected mature mushrooms were picked by a human picker. Out of 90 mushrooms, 78 (87%) of them were picked in accordance with the devised picking strategy (picking success rate), while 2 mushrooms were obstructed from the camera’s view, preventing the algorithm from assigning a decision, and were excluded from evaluation (obstructed targets). Additionally, in 9 instances (10%), involved two mushrooms being picked simultaneously (simultaneous picking), and in 10 instances (11%), involved the human picker deviating from the assigned sequence due to an ergonomic picking limitation (e.g., wrist position or standing angle) (deviation from strategy).
Figure 25 represents an example of bending direction and picking sequences for mushrooms in a single tub by following the cluster order assigned by DBSCAN. Figure 25-A shows that the YOLOv5s model detected mushrooms within bounding boxes. The mushrooms exceeding 2 cm were identified and marked with color points in a fashion that each belonged to a mushroom cluster (Figure 25-B). Figure 25-C represents the picking sequence. Numbers in the mushrooms indicate the picking sequence according to the proximity of the cluster and the mushrooms to the origin. The red decoding arrow represents the bending direction for isolated mushrooms, green represents mushrooms with one neighbor, and black represents those having two or more vicinity mushrooms. The results show that the algorithm successfully found strategies for picking the mature mushrooms from the tubs.
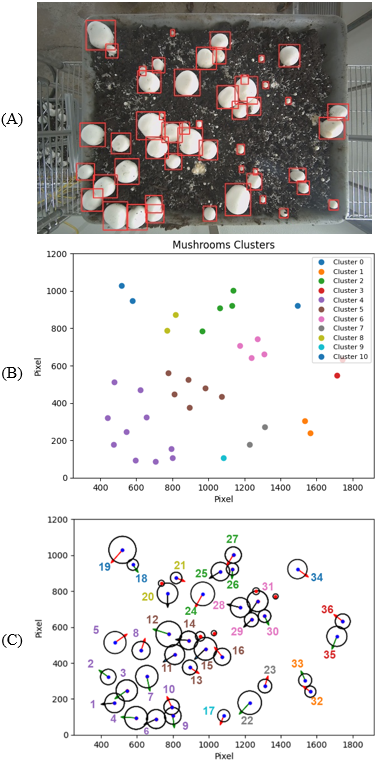
Figure 25. Examples of picking sequence and bending direction for the mushroom tubs. (A) mushrooms identified by the YOLOv5s model, (B) clusters of mushrooms over 2cm in size, (C) picking sequence according to the clusters and mushrooms proximity to the origin. The arrows colors represent the bending direction according to the targeted mushroom arrangements. Red: isolated mushroom, Green: one vicinity mushroom, Black: two or more vicinity mushrooms.
The suggested decision-making and picking sequence algorithm for picking strategies successfully selected various numbers of clusters and assigned bending directions for each single mature mushroom. Given that picking certain mature mushrooms was not feasible for highly crowded clusters, the algorithm must adopt the intersection method strategy to assess the feasibility of mushroom bending. If not, picking strategies might skip bending mushrooms and only twist and lift mushrooms in the future. The clusters were selected according to their proximity to the origin point using the current approach. However, the cluster selection method algorithm needs to be more efficient for large-scale harvesting so that it can find the optimal collision-free path. Similarly, an optimization algorithm for the picking sequence should be implemented to enhance the targeted mushroom picking assignments based on a more effective path, unlike using the Euclidean distances to the origin. These algorithms can also perform better by deploying a high-performance computational unit. In addition, the real-time feasibility of the algorithm will be evaluated in the future.
Furthermore, the results of human picking verification demonstrated the high feasibility of the proposed decision-making and picking sequence algorithm. To improve performance in the future, a closer view of the mushroom bed or an increased number of cameras could help address obstruction, leading to a higher picking success. Additionally, due to the dense growth of mushrooms and their tilted orientations, some mushrooms were harvested together. Since the primary objective of the algorithm is to facilitate successful mushroom picking, instances where two mushrooms were picked simultaneously were considered successful. Moreover, cases where the human picker did not follow the devised picking strategy were attributed to human error, unfeasibility, or the inconvenience of the suggested bending direction for the human wrist.
CNN model training result and discussion for 3D applications:
The performance of the YOLOv8m instance segmentation model for button mushroom detection was evaluated using standard metrics: precision, recall, and mean average precision (mAP). Following 120 training epochs, the model achieved a mask-based precision of 95.7%, a recall of 93.5%, and an mAP of 98.7% at an IOU threshold of 0.5 (Table 9). The model effectively detected the majority of the mushrooms (Figure 26).
Table 9. Performance of the YOLOv8m instance segmentation model for mushroom detection using mask-based methodology at an IOU threshold of 0.5.
![]()
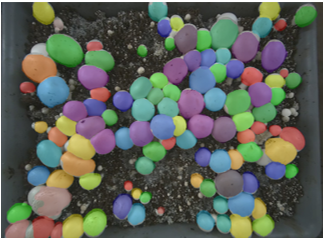
Figure 26. Example of mushrooms detected utilizing the YOLOv8m instance segmentation model. Random colors are employed to enhance visualization.
The metrics of precision, recall, and mAP used to evaluate the trained YOLOv8m instance segmentation model demonstrated promising mask-based performance, achieving 95.7%, 93.5%, and 98.7%, respectively. These results suggest that the trained model effectively detected button mushroom masks of diverse sizes and shapes. Furthermore, the model demonstrated the ability to identify mushrooms that were partially occluded and to differentiate mushroom caps from casing substrates and stems. Therefore, the segmentation results were considered reliable for subsequent experiments in this study.
Nevertheless, in certain instances, the trained model partially detected mushroom caps or incorrectly grouped two adjacent instances as a single entity. These errors were primarily attributed to a resolution mismatch between the training image size (800×800) and the detection image size (1200×1920), as well as mushroom cap deformities, dense mushroom clusters, casing substrate interference, image boundary distortion, mushroom cap outer-layer peeling, and discoloration. Any modifications to the detection image size resulted in increased mask overlap, under-detection of mushroom instances, grouping of multiple instances, and coarser and jagged mask boundaries. Such limitations could potentially be mitigated through the expansion of the training dataset in both size and diversity, or by training alternative segmentation models. Furthermore, the generalization of the proposed model to other farms or imaging conditions was not evaluated and is recognized as a limitation of this study. External validation under different environmental and imaging conditions is therefore left for future work.
Results and discussion of mask post-processing, PCD extraction, noise removal, and evaluation of PCD
The morphological processing improved the quality of the mushroom cap masks. Prior to post-processing, numerous masks exhibited coarse and jagged boundaries, small gaps, and overlaps with the vicinity mushrooms (Figure 27-A). These issues resulted in inaccurate voxel extraction during the mask-to-3D-point-cloud mapping. By applying erosion and dilation, the masks were smoothed, and overlapping regions were eliminated. (Figure 27-B). Consequently, the extracted PCD contained fewer background voxels.
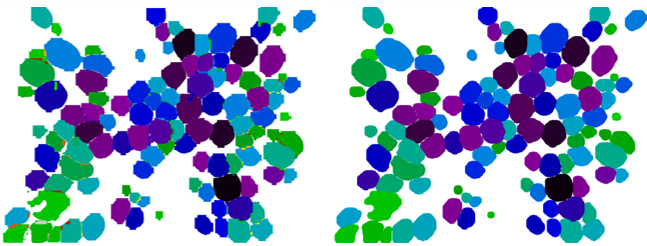
Figure 27. Example of mushroom cap masks (A) prior to and (B) following the application of morphological smoothing and overlap removal. Random colors are employed to enhance visualization.
The comparison between the estimated distances of the checkerboard cells and their manually measured values demonstrated that the vertical offset was estimated with 99.6 ± 0.3% accuracy, and the overall distance measurement achieved 98.7 ± 0.8% accuracy.
The extracted mushroom cap PCD initially contained irrelevant voxels and, therefore, required additional noise removal (Figure 28-A). To achieve a clear representation of a mushroom cap, a sequential pipeline was employed, consisting of RANSAC (Figure 28-B), statistical outlier remover (SOR) (Figure 28-C), and DBSCAN (Figure 28-D) approaches. Figure 29shows an example of the extracted mushroom cap PCD from an entire tub following the application of the proposed noise-removal pipeline.
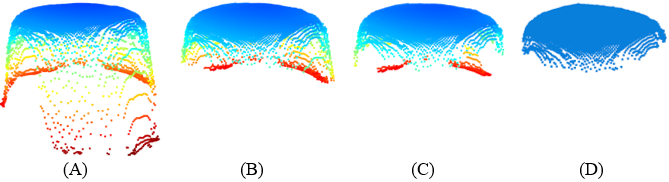
Figure 28. Example of a mushroom cap PCD (A) prior to noise removal and subsequent sequential application of (B) RANSAC, (C) statistical outlier removal (SOR), and (D) DBSCAN approaches.

Figure 29. Example of extracted mushroom caps PCD following the elimination of irrelevant voxels using the proposed noise-removal pipeline. Random colors are employed to enhance visualization.
The precision of the extracted and denoised mushroom cap PCD was evaluated by comparing the estimated diameters of 100 mushrooms with their ground-truth measurements. The results indicated that the proposed algorithm achieved diameter estimation accuracy of 91.2 ± 5.8%.
The segmentation masks were subjected to post-processing procedures that effectively smoothed the boundaries of the masks, eliminated overlaps between instance masks, and enhanced their shapes to more closely resemble circular mushroom caps. However, owing to a discrepancy in image size between the instance masks and the original images, particularly around the upper and lower regions of the frame, irrelevant voxels were extracted during the mask-to-3D-point-cloud mapping. This issue was compounded by inherent imperfections in the raw PCD, resulting in partial information loss in certain cases.
To address these limitations, the proposed noise-removal pipeline effectively cleansed the extracted PCD. The reliability of the cleansed PCD was validated through the distance-precision experiment and a mushroom cap diameter ground-truth comparison, achieving 98.7 ± 0.8% and 91.2 ± 5.8%, respectively. These results indicate that the post-processing and noise-removal pipelines adequately compensated for the segmentation and mapping procedures, and that the PCD was reliable for subsequent experiments.
Implementing more sophisticated interpolation techniques may yield additional enhancements in aligning masks with the original image size. Furthermore, owing to the fixed camera position and viewing angle, the PCD occasionally failed to capture the entire mushroom cap. The completeness of the extracted PCD could be improved by capturing the mushroom bed from multiple perspectives, either through repositioning the camera or by utilizing a line-scan imaging system to obtain denser and more uniform PCD.
Result and discussion of the maturity assessment pipeline for 3D application
Mushroom maturity was assessed by estimating the mushroom cap diameter and computing the surface-curvature measures, including mean curvature, curvedness, and anisotropy. These features were employed as inputs to a linear SVM classifier to classify 117 mushroom caps into immature and mature classes. The training performance of the classifier is reported in Table 10.
Table 10. Performance of the linear SVM classifier for the mushroom maturity assessment pipeline prior to its conjunction with diameter-based decision rules.
The confusion matrix for the mushroom maturity assessment pipeline, which was based on the combination of the diameter-based decision rules and the SVM classifier, for 576 mushrooms, is presented in Table 11. The overall performance of this pipeline is summarized in Table 12 with respect to precision, recall, and F1-score. Figure 30 illustrates the ultimate performance of the proposed pipeline in assessing mushroom maturity.
Table 11. Confusion matrix of the mushroom maturity assessment pipeline on 576 mushrooms.
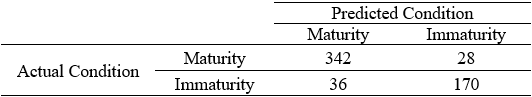
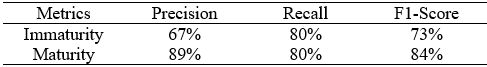
Table 12. The performance of the mushroom maturity assessment pipeline.
![]()
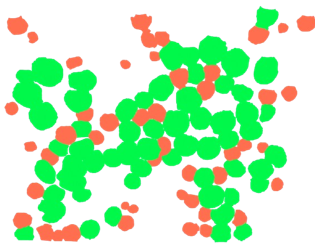
Figure 30. Example of mushrooms detected by the proposed mushroom maturity assessment pipeline, classified as mature (green) and immature (red).
These results demonstrate satisfactory performance for the mushroom maturity assessment pipeline. The classification performance could be further enhanced by expanding the dataset with additional mushroom samples, thereby generating denser and more uniform PCD. This approach may diminish the effects of occlusion on maturity assessment performance.
To enhance both robustness and computational efficiency, the SVM classifier was integrated with diameter-based decision rules. This methodology elevated the overall performance of the mushroom maturity assessment pipeline. These results imply that the proposed mushroom maturity assessment pipeline was sufficiently reliable for subsequent experiments concerning the mushroom bending direction and picking sequence determination.
Results and discussion of vicinity arrangement detection and determination of bending direction and picking sequence for 3D applications
The detection of mature mushroom PCD and the analysis of their spatial configuration facilitated the identification of vicinity arrangements, thereby paving the way to partition mushrooms into several clusters, solely to structure the harvesting strategy. Clustering utilized a user-tunable proximity coefficient τ, the maximum permissible distance zscale , a normalized scaling constant k, and a user-defined maximum vertical gap zgap_max (Figure 31).
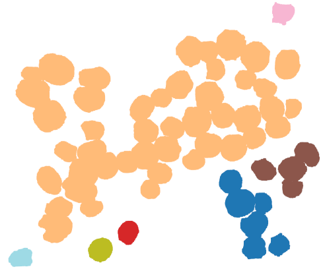
Figure 31. Example of clustering detected mature mushroom PCD into 7 distinct harvesting groups.
The bending direction for each mushroom within the clusters was identified based on the vicinity arrangement, the availability of open-space region according to user-defined thresholds, and the assigned picking sequence. Figure 32 illustrates the determined bending directions and picking sequence for the detected mature mushrooms, given that the origin is located at the top-left corner of the mushroom tub.
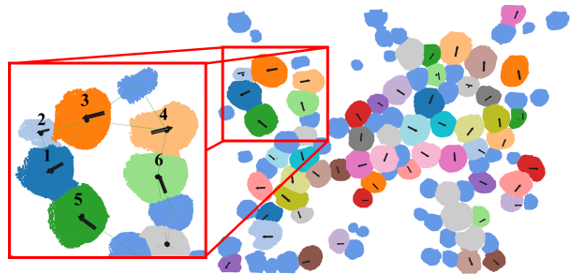
Figure 32. Example illustrating the bending directions and picking sequences of the detected mature mushrooms within a mushroom tub, determined based on the calculated clusters, vicinity arrangements, and Euclidean distance to the origin, which is positioned at the top-left corner. Blue mushroom caps represent immature mushrooms, gray mushroom caps indicate mature mushrooms that did not meet the available open-space region criteria. Random colors are employed to enhance visualization.
The precision of the determined picking sequence and bending direction for each mature mushroom was evaluated through human validation under different vicinity arrangements. All 37 mushrooms in the isolated arrangement were successfully harvested by applying arbitrary bending directions. In the case of a single-vicinity arrangement, the wooden-skewer insertion and bending tests confirmed that all 117 selected mushrooms were successfully bent towards the determined directions without collision. For the remaining mushrooms in the multi-vicinity arrangement, the determined open-space region angle demonstrated a precision of 97.6 ± 2.6%. Additionally, all assigned mushrooms were successfully bent utilizing the wooden skewer setup.
Finally, the detected mushrooms were subjected to a series of feature extraction algorithms and bending direction steps, including PCD extraction and noise removal, maturity assessment, analysis of the spatial configuration, vicinity arrangement and clustering identification. The detected mature mushrooms were subjected to a clustering procedure based on analysis of spatial configuration and vicinity arrangement identification. The identified clusters were employed solely to structure the harvesting strategy. The vicinity arrangement served as the basis for determining the bending direction and picking sequence for each target mushroom.
Validation employing the skewer insertion method at the central point of the mushroom caps demonstrated that the algorithm precisely estimated the available open-space region surrounding each mushroom cap and assigned appropriate bending directions. These findings suggest that the proposed methodology can effectively facilitate the strategy of determining bending direction and picking sequence for a robotic system designed for the selective harvesting of button mushrooms.
A 2D application of decision-making and picking sequence algorithm was proposed and analyzed for harvesting button mushrooms (Agaricus bisporus). Analysis results incorporate the CNN model for mushroom detection, mushroom maturity detection, distance covered by the mushroom after bending as part of picking motions (bending distance), clustering status of mushrooms in tubs, ground-truth bending directions estimations, and the success average of the devised strategies for multiple mushroom tubs. The major conclusions are as follows:
- The YOLOv5s model performed well on mushroom detection in mushroom tubs with 92% precision, 94% recall, and 97% mAP. Using a checkerboard, the size-based mushroom maturity was measured with an R2 = 97% correlation between pixel numbers and camera height.
- The average bending distance for mushrooms subjected to the bending picking motion was determined using a bending coefficient ( ) of 0.21±0.09, multiplied by the cap diameter of the targeted mushroom. Resulting in the bending distances of 5 to 15 mm for the tested mushrooms.
- The weighted average of the silhouette coefficient for evaluating the clustering of the overall tested mushroom tubs was 0.28±0.13.
- The decision-making strategy indicated that the algorithm was able to assign the correct bending direction and picking sequencing to all the matured mushrooms in the tested tub.
However, lacking 3D spatial data such as mushrooms height and coordinates are required for full robotic implementation. Therefore, a 3D perception algorithm for button mushrooms (Agaricus bisporus) was proposed, integrating a convolutional neural network (CNN) for mushroom detection and instance segmentation for 3D applications. This allows for the extraction of denoised mushroom cap point cloud data (PCD). Furthermore, it assesses mushroom maturity more realistically by combining measurements of mushroom cap diameter and surface curvature, analyzes their spatial arrangements, identifies their vicinity arrangements, and detects available open-space regions. Finally, it was capable of determining applicable bending directions and picking sequences for each mature mushroom for a selective robotic harvesting system. Several experiments were conducted to validate the precision and feasibility of the proposed approach for robotic mushroom harvesting applications. The main conclusions drawn from this study are as follows:
- The YOLOv8m instance segmentation model demonstrated robust mask-based performance in detecting button mushroom caps within mushroom tubs, achieving 95.7% precision, 93.5% recall, and 98.7% mAP.
- The mushroom cap PCD extraction pipeline, which includes iterative RANSAC (RANdom Sample Consensus), statistical outlier removal (SOR), and DBSCAN (Density-Based Spatial Clustering of Applications with Noise), performed reliably. The pipeline achieved a distance estimation accuracy of 98.7 ± 8% and a mushroom cap diameter estimation of 91.2 ± 5.8%.
- The trained support vector machine (SVM) classifier for the mushroom maturity assessment pipeline, based on a combination of mushroom cap diameter and surface-curvature measures, achieved 89% precision, 80% recall, and 84% F1-score. Integrating diameter-based decision rules (immature < 3cm, mature > 4cm) with an SVM classifier improved the overall performance of the maturity assessment pipeline to achieve a precision of 90.5%, a recall of 92.4%, and an F1-score of 91.4%.
- The bending direction and picking sequence determination algorithm successfully identified available open-space regions for isolated and single-vicinity arrangements, and achieved a precision of 97.6 ± 2.6% in multi-vicinity arrangements. Overall, the algorithm assigned valid bending directions and picking sequences with a precision of 97.1% across various mushroom vicinity arrangements.
In summary, the proposed 3D perception algorithm for button mushrooms provides a systematic strategy for determining bending directions and picking sequences. As a result, this approach could be effectively employed in the development of a selective robotic mushroom harvesting system. However, the current implementation is restricted to offline applications, and the dataset was collected exclusively at the Mushroom Research Center (MRC) at Pennsylvania State University under specific imaging conditions. In addition, the information generated by the 3D perception algorithm must be integrated into a robotic harvesting system to verify the practical success rate of the proposed bending direction and picking sequence pipeline. Therefore, future work will focus on the real-time integration of the algorithm within a robotic harvesting system. Additionally, extensive experiments will be conducted to assess the scalability and robustness of the proposed approach.
Education & outreach activities and participation summary
Participation summary:
This study's outreach program will improve farmers' performance in mushroom production by utilizing robotic solutions. This system brings many economic benefits for mushroom growers because they can tackle the problem of labor shortages, especially skilled workers. Also, it is advantageous for the workers because of the less intensive work and the more health benefits. As a result, this industry will gain advantages from sustainable production with high quality and efficiency.
Plan #1: Combination of extension article and peer-reviewed publications to introduce and validate robotic mushroom harvesting technology
An outreach article providing an overview of button mushroom harvesting technologies was published through Penn State Extension and made publicly available online: https://extension.psu.edu/overview-of-button-mushroom-harvesting-technologies. In addition, a peer-reviewed paper entitled “Decision-Making Strategies for Robotic Harvesting of Button Mushrooms Using YOLOv5s and Spatial Analysis” was published in IFAC-PapersOnLine: https://doi.org/10.1016/j.ifacol.2025.11.807. Furthermore, a peer-reviewed manuscript entitled “Development of a Decision-Making Algorithm to Identify Picking Strategies for Robotic Mushroom Harvesting” was submitted to Computers and Electronics in Agriculture and is currently under revision. Further publication of the research progress is anticipated in the future.
Plan #2: Assess growers’ knowledge of the robotic harvesting systems
Kennett Square, Pennsylvania, is widely known as the “Mushroom Capital of the World,” producing more than half of the mushrooms consumed in the United States. To assess growers’ awareness of and attitudes toward robotic harvesting systems, we organized a site visit to Phillips Mushroom Farms in Kennett Square in November. During this visit, we discussed key production challenges with growers and evaluated their satisfaction with current harvesting practices, as well as their familiarity with emerging robotic harvesting technologies. In addition, we participated in Ag Progress Days, held August 12–14, 2025, in Rock Springs, Pennsylvania, where we showcased recent advances in robotic mushroom harvesting and engaged with growers and other attendees to gather feedback on system novelty, perceived benefits, and adoption concerns. Further outreach will be held in the future to discuss their challenges more extensively and to share the most recent research advancements with the growers.
Plan #3: Demonstration, workshop, and post-research adoption survey.
The latest research progress on robotic mushroom harvesting was presented at the NABEC Conference on August 3–4 in Ithaca, NY, as well as at the IFAC AGRICONTROL 2025 (Sensing, Control, and Automation Technologies for Agriculture) held August 27–29 in Davis, CA. In addition, the research outcomes were presented at the Penn State Mushroom Short Course, held October 5–7 in State College, PA. Furthermore, poster presentations showcasing research progress were delivered at three venues: the College of Agricultural Sciences Gamma Sigma Delta, the Penn State Graduate Exhibition, and Penn State AI Week.
During these presentations, the following key issues related to the adoption of robotic mushroom harvesting systems were partially addressed: (i) System design: What components are needed to evaluate and facilitate the robotic harvesting system, adjust the robot's location, and replace components with the existing equipment? (ii) Ease of use: How can the system be maintained, and how can components be replaced as necessary? (iii) Management of in-field operations: How does the system adapt to terrain and various mushroom clusters? (4) Operator requirements: What knowledge is required to operate the system effectively?
In the future, a workshop will address the issues listed above in greater detail and will include a detailed analysis of the robotic mushroom-picking results. It will also provide a simple toolkit for evaluating the costs associated with investing in the system and the return on investment associated with a robotic harvesting system with reduced worker costs and improved mushroom quality. Materials produced for the workshop will be available online, including the economic evaluation toolkit, tutorials on configuring, operating, and calibrating the system, videos of system operation, safety, and maintenance, and all publications from the research activities.