Final Report for GS10-092
Project Information
We are studying the influence of land cover and farm habitat on solitary bee diversity and pollen collection. Of approximately 1,200 solitary bee specimens collected, 750 have been identified. Pollen processing is nearly complete at 100 samples, and identification has begun. ArcGIS facilitated characterization of land cover types in farm buffers. Preliminary results indicate 1) variation in bee community composition and abundance across farms in the study, 2) that pollen-carrying bees typically only carried 1-2 types of pollen, and 3) that 66 five hundred meter farm buffers across the study contained 8 land cover classes, pine being dominant.
Introduction
The purpose of this project is to assess the availability and possible contribution of native bees to sustainable agriculture in Northern Florida, and to identify factors that encourage diverse bee populations. Our study focused on pollination and species diversity on farms in two landscape contexts (natural and agricultural) to determine the influence landscape context has on shaping native bee populations. We ask the following questions: What native bees are found on sustainable farms and what do they pollinate? And, do the different landscape contexts affect the distribution and abundance of bees?
Our initial proposal included bee reproduction as a response variable and the urban/suburban landscape context. However, over the life of the project these two aspects proved to be unfeasible. We could not find enough farms nested in urban/suburban areas, but found a number of them in the natural and agricultural contexts. Bee reproduction proved not to be feasible to include because of the difficulty (established by a preliminary study) in attracting Northern Florida’s solitary bees to nest in artificial structures. The purpose statement above reflects these changes in the project focus.
Even though native bees have great potential as pollinators, their pollination choices (e.g. crop plants and/or native plants) have not been well studied here. With honeybees in decline or not meeting agriculture's growing demand for pollination (Johnson 2010) the native bees of Florida may already play a role as effective pollinators of crop plants (Hall 2010). The amount of pollination services native bees provide and how this varies with land management practices are unknown (Kremen 2002). And, with the variety of their body dimensions and tongue lengths, individual native bees are generally more effective than non-native honey bees as crop pollinators (Bohart 1972, Klein et al. 2007). Florida has over 300 species of native bees (Pascarella and Hall 2013) of which 140 species have been reported in this area (Hall and Ascher 2010).
Kremen et al (2002) observed that solitary bees could provide full pollination services to an organic watermelon crop on a farm near natural habitat but not for farms at greater distances away or for those practicing conventional agriculture. Bees are influenced on the landscape scale by habitat fragmentation (Steffan-Dewenter et al 2002) with small bee species diversity and abundance increasing in proximity to semi-natural habitats. Thus we are aware that bee abundance, diversity, and pollination services interact with both landscape configuration and local farm management. But which is more important? Can farmers manage their farm vegetation to encourage native bees, or are native bee populations reliant on the landscape beyond the farmer’s control?
This study examines the influence of landscape level factors and local, low-pesticide farm vegetation management practices on native bee diversity and abundance. We also use a proxy for pollination services- pollen carrying preferences of different bee species to indicate their potential-to-pollinate. Successfully determining the interaction of bees with farms and the surrounding landscape will give insight into managing native bee communities and indigenous pollination services that can be shared with farmers operating in Northern Florida landscapes.
Northern Florida provides an excellent study location because its projected urbanization will change the landscape context of farms here. Small farming operations in urbanizing foodsheds like North Central Florida’s are multiplying to fuel increasingly popular farmers markets (USDA 2013). Therefore this work will be especially relevant to farming in the urbanizing landscapes of this part of the state. Also, the decline in honeybee pollination services has been reported by beekeepers in this vicinity, so this is a great place to seek evidence that native bees may potentially be managed to fill the pollination gap.
Project Relevance to Sustainable Agriculture
Describing Native Bee Pollination: Florida has a diversity of bee species that may be important crop pollinators, but their importance to agriculture and what factors influence their pollination choices has not been studied here as it has been in other systems (e.g. Winfree et al. 2007in the Mid-Atlantic States and McIntyre et al. 2001 in Arizona). By identifying and collecting pollen from foraging native bees we will be able to identify which crops these bees have potential to pollinate (as with Westrich & Schmidt 1986) and provide information to farmers on which plants may be pollinated by native bees (and which bees) across different habitats. As a result of carrying out this project we hope be able to inform farmers in the area about whether or not they can take actions on the farm level to improve habitat for native bees. Our work will provide insight as to whether pollination as an ecosystem service performed by native bees is better in a natural landscape context than in more agricultural ones.
Enhancing Ecosystem Services on Sustainable Farms
Ideally, should sustainable farms should be located in biodiverse landscapes to allow the farms to take full advantage of ecosystem services like pest control by native enemies (Jones and Sieving 2006) and bee pollination? The success of sustainable agriculture is assessed unfairly because these farms are not located in their ideal contexts and assessment does not always consider what the farms return to their environs (e.g. cleaner water, healthier wildlife populations; Clerge et al. 2005). Also, the assessment of their success should not be entirely based on production of crop plants because these farms are expected to be more environmentally protective of ecosystem services (Wild Farm Alliance 2005). Our project will add to our knowledge of how and if sustainable farms support native bees (and vice versa) as an additional measure of benefits from these farms. On the practical side, this project will allow us to identify the set of native bee species that potentially pollinate crops.
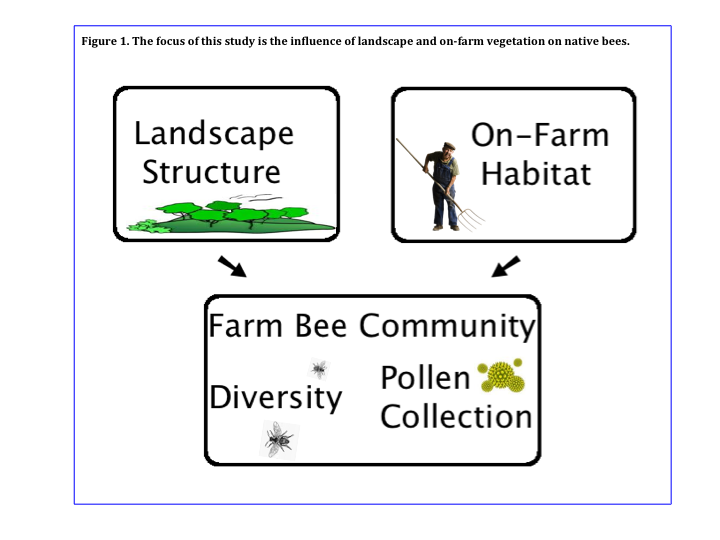
The central objective of our study is to determine the relative importance of a) on- farm management of vegetation and b) surrounding landscape factors as a predictor of native bee species richness, abundance, and pollen-carrying (Figure 1). The eleven farms in the study exhibit varied in on-farm vegetation management from closely mown lawn-like field verges to weedy edges and purposeful plantings of white clover and sunflowers as crops or ground cover. Do such plantings and vegetation affect the native bee diversity on these farms, or is diversity driven by landscape context? To answer this question, our study has four main objectives: 1) analysis of bee foraging habitat, 2) characterization of the landscape context of farms, 3) analysis of native bee species richness, and 4) analysis of pollen collection on farms by native bees.
- • Landscape Context Effects: The landscapes around the 11 farms in the study are dominated by forest (pine plantations and mixed oak woodlands) and agricultural land covers (crops and pastures). The landscape mosaic around these farms also includes developed areas (i.e., roads, parking lots, and houses) and wetlands. Last year I included a table in my report that showed preliminary estimates of dominant and secondary land covers in the immediate vicinity of the farms. In 2012 I began the process of quantifying the land cover types around each farm out to a distance of three kilometers.
- • Bee Foraging Habitat: The focus of this part of my study is to quantify the foraging habitat available for bees on the twelve farms. Foraging habitat includes crops that are flowering at different sampling times, farm edge vegetation, and habitat contained on some farms like preserved wetlands. I will determine if such habitats correlate with bee diversity on the farms.
- • Bee Species Richness: This part of my study focuses on bee diversity and abundance on the farms. Two kinds of sampling contribute to this data: hand netting and bee bowls.
- • Bee Pollen Choices: Here my study focuses on a possible pollination precursor- what bees are carrying as they forage on farms. Native bees collect and carry pollen to store for later consumption by their offspring, but the facts that they have this pollen on their bodies increases the likelihood that they may be pollinating flowers as they move between plants. Figuring out if they are actually pollinating flowers or their effectiveness at pollination is beyond the scope of this study.
Cooperators
Research
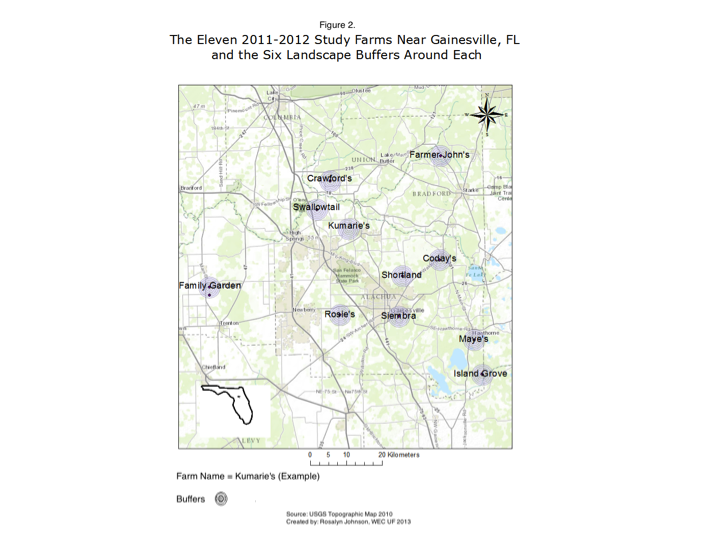
We gained permission from farmers of 11 farms in four North Central Florida counties (Alachua, Union, Bradford, and Gilchrist) to visit twice each month from the beginning of March until the end of June in 2011 and 2012. See Figure 2 for farm locations in relation to Gainesville, Florida.
We collected bees by using bee bowls (Droge 2008) set up in three groups of three bowls along a 10 meter transect on the first morning visit, and recovered specimens approximately 24 hours later if there was no rain. Rained-in bowl contents were discarded because the extra water diluted the soap solution in the bowls allowing bees to escape, and hard rain had the potential to splash or overflow specimens from the bowls. On both days we spent approximately 45 minutes visiting random flowering crops and plants to search for bees to hand capture with butterfly nets. Search duration was decreased if we had two netters of equal skill.
Bee identification proceeds with the use of five taxonomic keys.
On farm vegetation data was collected by making percentage estimates of ground cover and measuring plant height along transects in crops, on farm edges, and in habitats (e.g. wetlands) that existed within farm boundaries. In-crop transects were always established next to blooming crops. These were ten meters long and one meter diameter quadrats were placed at random to the left or right of the transect at 0, 5, and 10 meters. Farm edge and habitat transects were 50 meters long with quadrats every 5 meters.
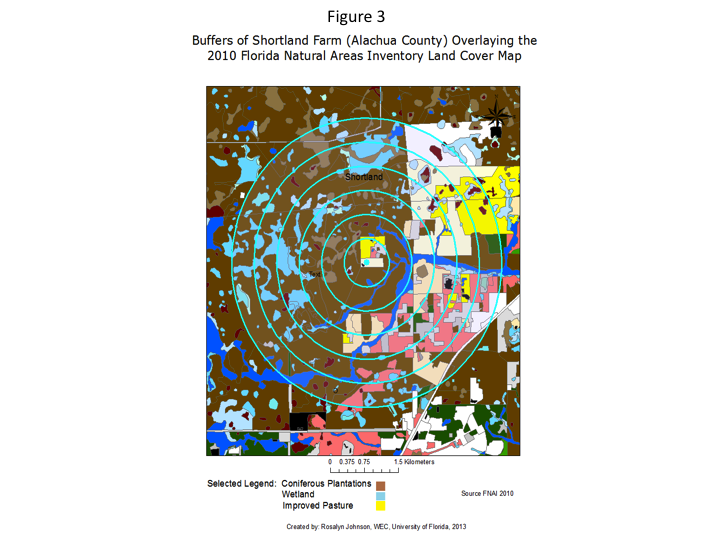
The landscape surrounding each farm was divided into six 500 meter buffers. See Figures 2 and 3 for buffer configuration. The size and number of buffers is based on the distance that bees are likely to move away from the farm where they are found. Bees of larger body size are capable of flying greater distances than shorter ones (Holzschuh et al. 2007, Greenleaf et al. 2007), and so we set the maximum influencing radius around farms at three kilometers (the expected flight distance of our large, native carpenter bees (Xylocopa spp.)).
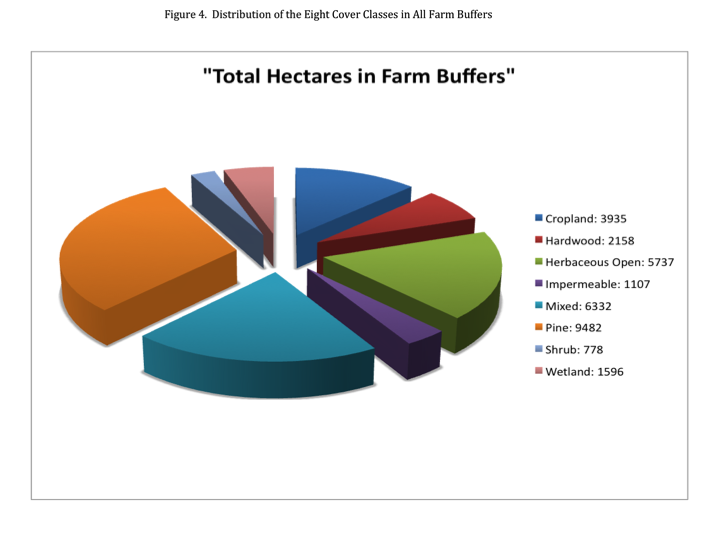
Using ArcGIS and the Florida Natural Areas Inventory land cover map from 2010, we tabulated the square meter area of more than 70 (eg. cypress, xeric hammock, scrubby flatwoods, shrub and brushland, roads, utilities, etc.) into eight general land cover types (wetland, pine, mixed, herbaceous open, hardwood, impermeable, shrub, and cropland) for the statistical analysis.
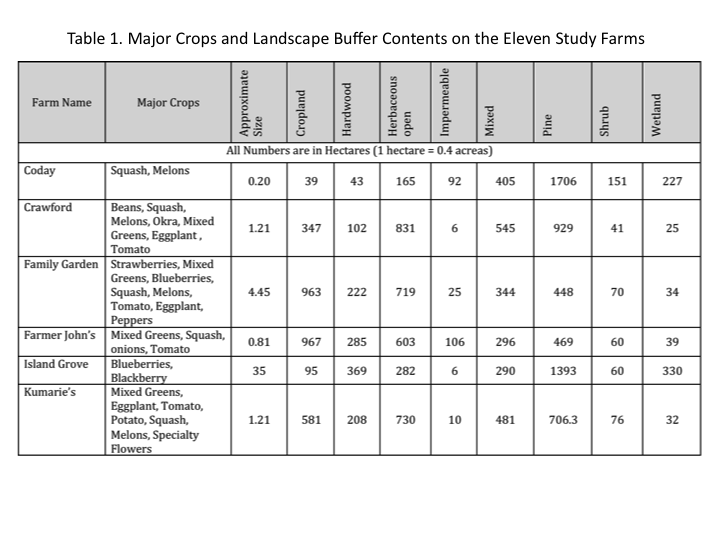
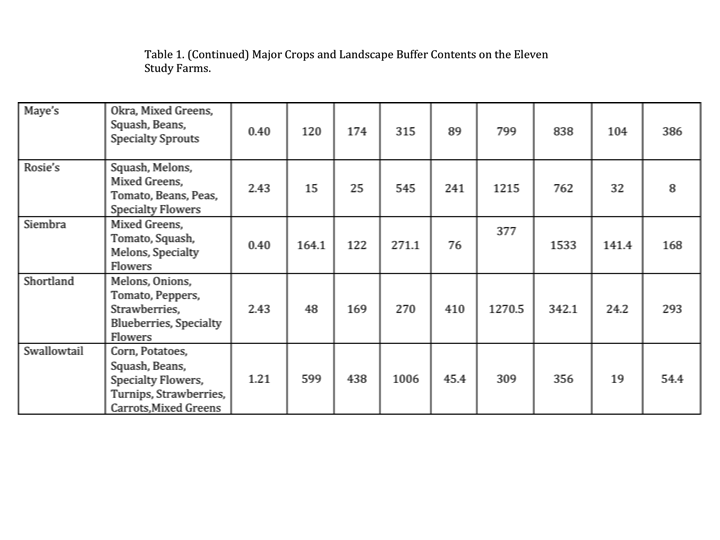
Table 1 shows the breakdown of major crops raised during the growing season on the eleven farms in the study. Squash was a common crop on all the farms except Island Grove that was distinctive in its domination by blueberries. Farm size in hectares (1 acre= 0.4 hectares) is also listed in the table.
The largest farm in the study, Island Grove met the mixed-crop criterion set by our study by growing organic blackberries and nursery plants on large scales as well. Mixed greens, common on eight of the eleven farms, were an important crop for bees in the early Spring when the previous year’s crop of greens were bolting and blooming. Although most farmers did not collect seed from those plants, it was a common practice that appeared to attract native bees by providing nectar when few other plants were blooming.
The farm buffers introduced in Figures 2 and 3 consist of eight land cover types. Distribution of hectares of these cover types is documented in Table 1. The total distribution of buffer space is shown in Figure 4.
While netting bees on random flower walks around farms, we noticed pollen-laden bees a small proportion of the time. Of all bees captured for the study (approximately 1,200) less than 10% could be captured for this part of the study because bee bowl processing washed pollen from those bees. Hand netted bees that carried pollen were stored separately in plastic vials to minimize contamination.
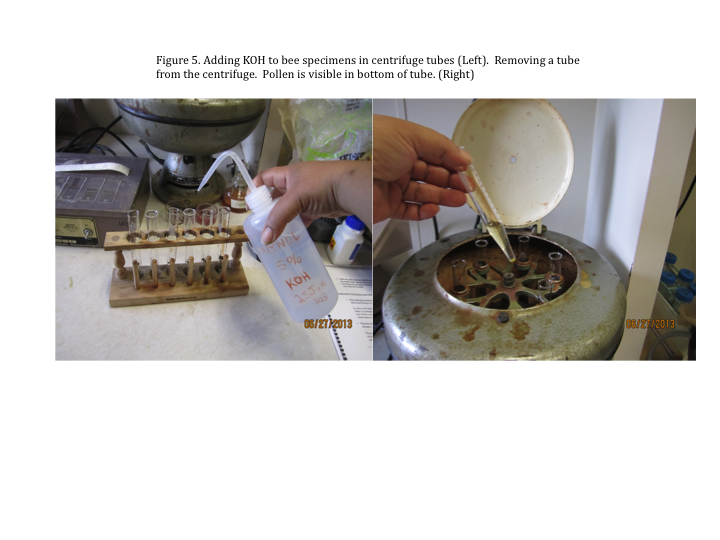
We removed pollen from bee specimens in a heated 5% potassium hydroxide solution to help clear the pollen grains of surface oils and internal contents (Figure 5). The resulting sample is washed twice with distilled water, once with glacial acetic acid, once with an acetic anhydride and sulphuric acid solution, again with glacial acetic acid, twice with distilled water, then once with a 50% glycerin and water solution. To keep the pollen in the tub through all of these washings, we centrifuged the sample at each step. This process was described by D. Jarzen (2008). Slide mounts were prepared with glycerin jelly.
- Figure 5. Adding KOH to bee specimens in centrifuge tubes (Left). Removing a tube from the centrifuge. Pollen is visible in bottom of tube. (Right)
- Table 1. Farm Characteristics and Buffer Contents
- Table 1. (Continued) Farm Characteristics and Buffer Contents
- Figure 2. Eleven Study Farms Near Gainesville, FL and Their Landscape Buffers
- Figure 4. Distribution of the Eight Cover Classes in All Farm Buffers
- Figure 3. Buffers around Shortland Farm with the FNAI Land Cover Map from that Area
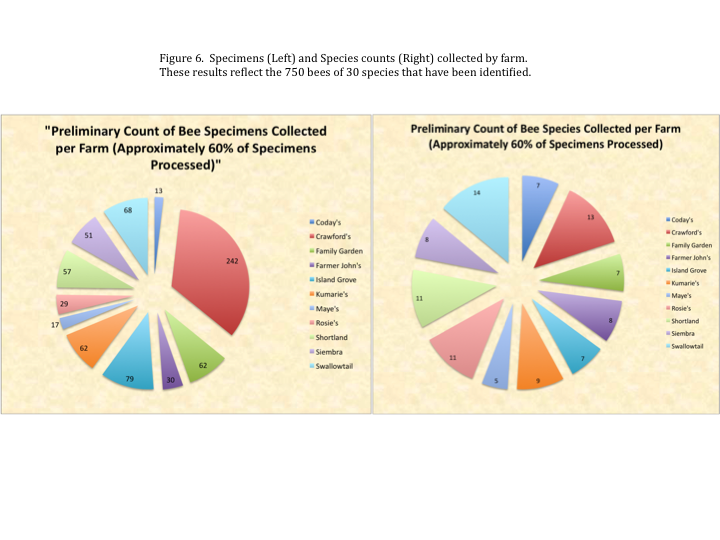
Research findings are still preliminary as bee identification is 60% complete and one of the most complex genera (Lasioglossum) remains to be identified to species level. However, some data is available now and is summarized in Figure 6 and Table 2. Figure 6 displays data on the number of specimens and species identified to date. A notable preliminary finding is that the Crawford farm far exceeds the others in bee abundance, and is the second in rank in bee species diversity to date. On the opposite end, the Coday farm produced the fewest bees and diversity was almost entirely limited to the most common species. During fieldwork we observed that the Coday farm produced fewer crops and mowed right to the edges of the fields. Knowing this and having quantified it, it will be interesting to look at the farm’s landscape context once that part of the study is completed.
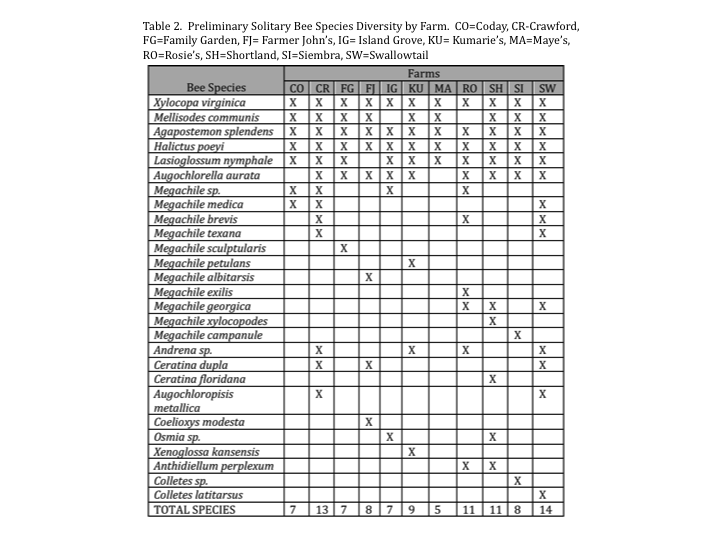
In general the farms showed great variation in number of bees captured, but less variation in the overall number of species found. However, Table 2 shows the breakdown of species found per farm with the most commonly found species at the top of the chart. There is more variability in bee communities sampled on each farm than in the overall species diversity.
The 66 buffers have been tabulated and we are now in the process of checking the data for anomalies and preparing it for data analysis. Land cover data in the farm buffers is summarized in Table 1.
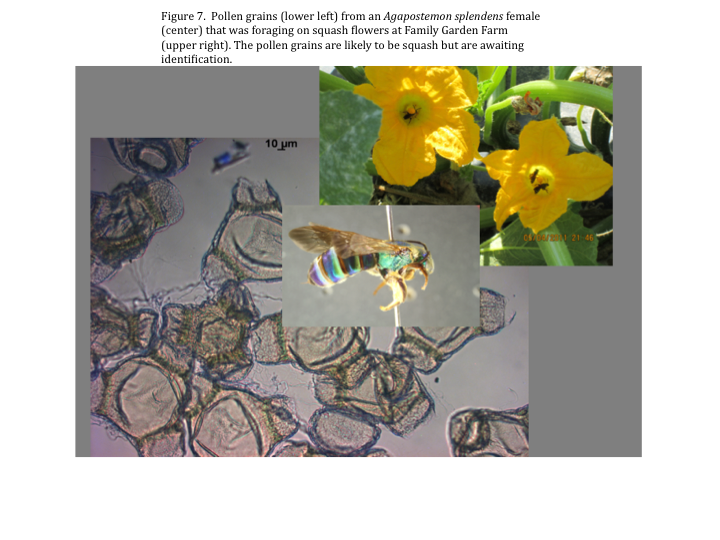
Approximately one hundred samples have been processed so far, and another twenty or so are pending. Pollen identification is progressing as we gather appropriate keys and contact nearby experts in the Palynology field. Prior to final identification of pollen grains by key and confirmation by experts, we have begun to take digital photos of the grains and the bees that carried them. An example is below in Figure 7. One or two types of pollen per sample is typical.
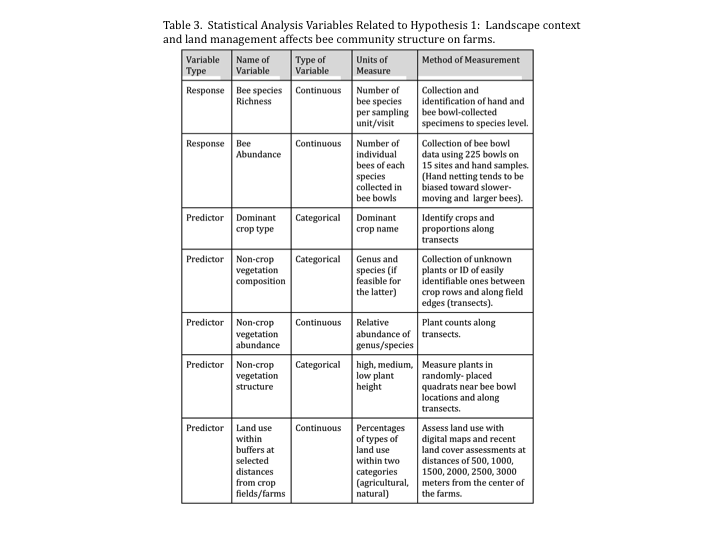
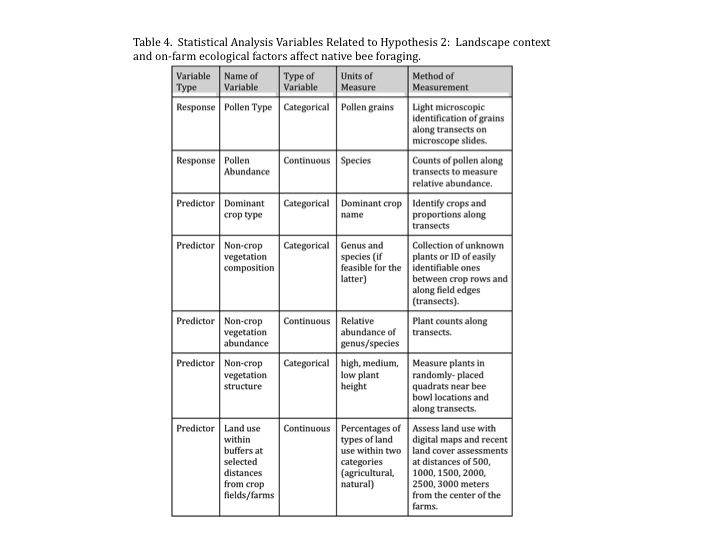
We will use 4 separate analyses for bee species richness, bee relative abundance, pollen richness and abundance; relying on generalized linear modeling to relate all the predictor variables to each of the responses variables. Tables 3 and 4 describe the variables we plan to use in the analyses.
- Figure 7. Pollen grains (lower left) from an Agapostemon splendens female (center) that was foraging on squash flowers at Family Garden Farm (upper right).
- Table 2. Solitary Bee Species Diversity by Farm
- Table 3. Statistical Analysis Variables Related to Hypothesis 1: Landscape context and land management affects bee community structure on farms.
- Table 4. Statistical Analysis Variables Related to Hypothesis 2: Landscape context and on-farm ecological factors affect native bee foraging.
- Figure 6. Breakdown of Number of Specimens and Species Identified So Far
Educational & Outreach Activities
Participation summary:
We will follow up on the farmers’ greater familiarity with native bees with an educational outreach book of images similar to that in Figure 6, pointing out bees that were found on each farm, pollen collection that we documented, and images of the pollens the bees were carrying on the farms.
In addition we expect three journal publications from this work based on the three chapters of my doctoral dissertation. The dissertation is in progress now, but much of the material to be included will be based on pending analyses that require identification of bee species diversity and abundance. That work should be completed soon. We will provide a copy of the dissertation to SARE when it is complete.
Project Outcomes
Farmers who participated in the project are already more aware of native, solitary bees as a result of this project. We made a point of displaying the bees we captured and talking about the project with farmer participants.
When we have the results of the statistical analysis we’ll be able to tell farmers if they can improve native bee presence on their farms by changing farm vegetation management (e.g. allowing or encouraging flowering, non-crop plants) or if the bee population is driven more by landscape scale factors. If that is the case we can encourage farmers to pay attention to natural areas around their farms and perhaps add their voices to county planning practices to support bee pollination services in their areas.
Areas needing additional study
- • Research into the habitat needs of bees is still needed. Seventy percent of native bees in North Central Florida are ground nesters. But, we don’t know what type of habitat they prefer or how flexible they are in their choices of nesting sites. During this study we gained anecdotal information on three bee species (an Adrena species, Agapostemon splendens, and Halictus poeyi) that were observed nesting on three farm properties.
- • Pollination studies are still needed. Although we will establish that solitary bees carry crop pollen in this study, answering the question of whether or not they are effective pollinators of crops here in North Central Florida would require a focus on bee-flower interactions and monitoring crop production that results from those interactions.
- • Are there crop combinations that might serve to maximize native bee pollination services? For example, we observed that the flowers of bolted, leafy greens are a food source for bees in the Spring before a number of other crops bloom. Is there an optimal series of crops that can support bees on farms throughout the growing season? Should farmers be concerned about providing forage for natives when no crops are blooming (e.g. letting weedy plants like Bidens spp. grow along field edges)?
Bohart, G.E. 1972. Management of wild bees for the pollination of crops. Ann. Rev. Entomol. 17: p. 287–312. Clergue, B., B. Amiaud, F. Pervnchon, F. Lasserre-Joulin, S. Planeureux. 2005. Biodiversity: function and assessment in agricultural areas. A review. Agron. Sustain. Dev. 25: p. 1-15. Droege, S. 2008. Handy Bee Manual. (ftp://ftpext.usgs.gov/pub/er/md/laurel/Droege/Standard%20Files) Florida Natural Areas Inventory. 2010. http://www.fnai.org/gisdata.cfm Greenleaf, S., N. Williams, R. Winfree, & Kremen C. 2007. Bee foraging ranges and their relationships to body size. Oecologia. 153:589-596. Hall, H.G. and J. Ascher. 2010. Surveys of bees (Hymenoptera: apoidea: anthophila) in natural areas of Alachua County in North-central Florida. Florida Entomologist 93(4): 609-625. Holzschuh, A., I. Steffan-Dewenter, D. Kleijn and T. Tscharntke. 2007. Diversity of flower-visiting bees in cereal fields: effects of farming system, landscape composition and regional context. Journal of Applied Ecology 44: p. 41–49. Jones GA and KE Sieving. 2006. Intercropping sunflowers in organic vegetables to augment avian predators of arthropod pests. Agriculture, Ecosystems, and Environment 117: 171-177. Jones GA, KE Sieving, and SK Jacobson. 2005. Avian biodiversity and functional insectivory in north-central Florida farmlands. Conservation Biology 19: 1234-1245. Jones GA, KE Sieving, ML Avery, RL Meagher. 2005. Parasitized and non-parasitized prey selectivity by an insectivorous bird. Crop Protection 24: 185-189. Jarzen, D. 2008(?). Palynology Laboratory Manual. Florida Museum of Natural History. Gainesville, FL. Klein, A, B Vaissiere, J Cane, et al. 2007. Importance of pollinators in changing landscapes for world crops. PROCEEDINGS OF THE ROYAL SOCIETY B-BIOLOGICAL SCIENCES 274:303-313 Kremen, C., N. Williams, and R. Thorp. 2002. Crop pollination from native bees at risk from agricultural intensification. Proceedings of the National Academy of Sciences. 99(26): 16812-16816. McIntyre, N.E., Hostetler, M.E., 2001. Effects of urban land use on pollinator (Hymenoptera: Apoidea) communities in a desert metropolis. Basic and Applied Ecology 2: p. 209–218. Pascarrella, J. and H.G. Hall. 2013. Bees of Florida. Located at: http://entnemdept.ifas.ufl.edu/hallg/melitto/intro.htm US Department of Agriculture. 2013. USDA Celebrates National Farmers Market Week, August 4-10 Confirms Growth and Sustainability in Farmers Markets. Schmidt, K. (1986): Methoden und Anwendungsgebiete der Pollenanalyse bei Wildbienen (Hymenoptera, Apoidea). - Linzer Biol. Beitr., 18: 341-360. Wild Farm Alliance. 2005. Executive Summary of Organic Farmers’ and Certifiers’ Guides to Conservation of Biodiversity on Organic Farms. Accessed online 30 May 2010 at http://www.wildfarmalliance.org/resources/sumguides.pdf Winfree, R., N. Williams, J. Dushoff, C. Kremen. 2007. Native bees provide insurance against ongoing honeybee losses. Ecology Letters, 10(11) p. 1105-1113.