Final report for GS15-142
Project Information
Abstract:
This project resulted in the development of a straightforward protocol that can be used in-field to estimate the volume of vegetable crops left behind after the primary harvest. A case study on a commercial North Carolina farm demonstrated the use of this protocol, indicating the volumes of underutilized vegetables can be higher than previously thought. Edible produce was left unharvested on the thirteen fields evaluated at an average estimated rate of 7,887 pounds per acre. Approximately 63% of this volume did not meet buyer standards. A two-year R&E grant was developed from this project and further research is underway.
Introduction:
Currently, the most well-known statistic on food waste in the US is an estimate of 40%, which is a calculation using a model based on the difference between the available food supply and what is consumed (Gunders, 2012, Hall, et al., 2009). Feeding America estimates the amount of fruit and vegetables wasted each year in the US at about 6 billion pounds, and analysis of USDA data for unharvested acreage calculates that in North Carolina alone approximately 117 million pounds of produce were unharvested in 2013 (Feeding America, 2013; Reed, 2014). Losses at the farm level can be significant, however, there are no studies that we identified that quantify the volume of loss, and production level losses are not included in USDA food waste data, or other recent food waste studies (BSR, 2014; Buzby, et al., 2014; Gunders, 2012). Not only does the loss of specialty crops reduce farm efficiency and sustainability, but the recovery of those crops can increase farm profitability and availability of fresh fruits and vegetables.
Quantifying food waste at the production level is the first step in reaching the ultimate goal of increasing production efficiency and improving profit and competitiveness for North Carolina and southeastern vegetable growers. Edible crops that do not meet grade standards can still be of very high nutritional quality, and could potentially be marketed to commercial or institutional kitchens, discount grocery stores, retail stores, or other industries. In order to analyze the quantity of losses on specialty crop farms in North Carolina, it is important to understand the role grade standards play in rejection of product on-farm and within the retail buying environment. USDA quality standards allow for standardization throughout the industry, are a marketing tool which provides a common language, assists producers and handlers in labeling, comprises the basis for reporting, helps settle disputes, and rewards top quality (Abbott, 1999; Kader, 2002). Despite the importance of standards, they tend to define quality according to aesthetic appearance, like shape and size, rather than flavor or nutritional value (Abbott, 1999; Kader, 2003). Quality standards are applied, and losses are incurred, by the grower, harvester, packer, distributor/wholesaler, retailer, produce manager, stocker, shopper, and eater (Abbott, 1999). However, the increasing popularity of farmers’ markets across the nation and in North Carolina suggests that consumers may be willing to purchase cosmetically imperfect produce.
An increase in the global population is leading to calls for increases in crop yields. However, a more sustainable way to increase yield would be to reduce waste, improving efficiency in farming operations and food availability for consumers at the same time, and without an increase in inputs or acreage under production (Kader, 2003, 2005). Utilizing more of the crop will increase agricultural sustainability by directly increasing the human food supply, make the most use of on-farm resources, improving the economic viability of farm operations, and enhancing the quality of life for growers and society.
This project uses field sampling to determine how much edible and marketable produce is left unharvested after the primary harvest has ended. Presenting the proposed research and methods to grower and agricultural professional audiences has increased awareness of food loss at the farm level.
Field evaluations for this case study have shown that the volume of marketable food remaining in the field can be high in comparison to the marketed volume, which could provide opportunity for growers to further profit from the crop they are already cultivating. Additionally, the volume of food that could be recovered for human consumption was much higher than the estimates discussed in previous studies, revealing the potential for recovery organizations to procure even more healthy food. Further research on the amount, types, and reasons for food loss at the farm level has been repeatedly recommended, and this study confirms that it is needed.
- Develop straightforward protocol that can be used to estimate marketable and edible potential of crops remaining in the field after the primary harvest has ended.
- Determine volume of edible crops that remain in the field after harvesting to typical USDA standards for vegetable crops in North Carolina. Determine reasons behind the loss of these crops.
Cooperators
Research
Several key reports on food loss revealed that an understanding of the volumes lost at the field level was necessary in order to discuss solutions for produce recovery. Upon starting this project, it was determined that no protocol existed to sample and estimate losses in the field, and that became a primary focus. In order to generate a protocol that could be used by recovery groups nationally, but was also straightforward for use by growers, a key requirement would be its applicability to multiple crops. Using field samples to calculate the amount of produce available in the field for recovery or marketing proved to be a straightforward technique for determining harvest potential at the end of the season. Field samples were scaled into volume estimates of the remaining crop using the row spacing, field acreage, yield and buyer specifications provided by the grower. A semi-structured interview with the grower provided insight into the decision to stop harvesting, market connections, quality considerations, common production practices, and potential solutions for further utilizing the crop.
Field sampling method:
Three adjacent rows of 50’ length located randomly in the field were harvested, sorted according to marketable quality, and weighed. Rows were harvested separately. All vegetables remaining on each plant after the appropriate harvest interval were collected into a suitable harvest container. Visibly diseased, decayed, overmature, sun-scalded or damaged vegetables that remained attached to the plant were also harvested in order to determine the portion of the crop that was marketable or unmarketable, in contrast to the inedible portion.
In this study, the focus was on growers’ opportunity to further market the crop, or the potential for recovery. Therefore, the produce was sorted into categories of inedible, marketable, and edible but unmarketable according to current quality standards. Vegetable size and shape were assessed using produce inspection equipment recommended by the USDA-AMS Specialty Crops Inspection Division (USDA-AMS, 2016). Specifically, the Caliper II plastic caliper and the General Purpose Sizer, an aluminum 6-blade set of sizers, were used to determine diameter, an Area Gauge, IA #30G was used to measure length as well as to size defects and blemishes, and several Visual Aids were used to determine proper color and characteristic shape (USDA-AMS, 2016). Harvest knives were used to collect zucchini and cabbage. A CAS PB300 Bench Scale (CAS Corporation, East Rutherford, NJ, USA) was used in the field to collect weights. This scale is legal for trade, accurate to 0.05 lbs when measuring 0 – 150 lbs, and portable. Data was recorded in pounds for inedible, marketable, and EBU categories from each of the three rows separately.
Determining how many plants are present in each sample row, and comparing that to the estimated plants per acre based on the plant and row spacing provided by the grower, generated a multiplier that adjusted the plants per acre to a realistic estimate of the plant coverage present under the field conditions. Once that was calculated, the remaining vegetable volume was recorded for each category of quality, and the mean volume per plant was determined. This per-plant loss in each of the three categories provided a starting point for scaling the data to the acre, and to the entire field. A convenient method to determine produce available in one acre simply takes the ratio of the total weight of the sample from one category to the sample area and multiplies it by the square footage in one acre.
The farm highlighted by the case study is owned and managed by a multi-generational family, and has been in operation for over sixty years. The case study farm is a mixed vegetable and commodity farm of approximately 300 acres, producing vegetable crops on over half of the acreage.
Of the fields sampled, each provided unique results, as the conditions for production, harvest, and marketing were individual to the crop and harvest date. Field size averaged 6.75 acres, and ranged from 2.5 acres to 14.75 acres. The size of the sample taken in each field represented between 0.13% and 0.90% of the total field area.
Sorting the produce collected from the three sample rows into the categories of marketable according to the growers’ specifications, edible but currently unmarketable (EBU), and inedible due to disease, damage, or over-maturity provided a clear picture of the quality of produce remaining in the field. Scaling up from the volume found per plant using the adjusted plants per acre provides an estimate of the volume remaining per acre. Marketable volume remaining averaged 2,595 lbs per acre over all fields sampled. Edible but unmarketable vegetables remaining averaged 5,292 lbs per acre.
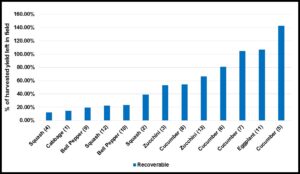
Current figures in food loss and waste are often reported in estimated percentages, and farm-level losses for fruit and vegetables are most commonly considered to be 20% of the marketed yield (Gustavsson et al., 2011). Five fields of the thirteen evaluated contained marketable produce in amounts greater than 20% of the harvested and marketed yield, including all four cucumber fields and one of the squash fields. All of the fields evaluated contained produce that was considered edible but would not meet buyers’ specifications, representing amounts greater than the harvested and marketed yield. Six fields contained edible but unmarketable volumes in amounts greater than 40% of the grower’s yield, including three cucumber fields, two zucchini fields, and the eggplant. What is unclear throughout related studies based on estimates from grower interviews, is whether the estimates growers have provided account for only marketable produce, or all produce that is suitable for human consumption. Combining the marketable and edible portions of the remaining produce found in this study reveals much higher percentages may be lost at the farm level than previously thought (Figure 1). Considering all of the crops found to be of wholesome edible quality in the fields evaluated, the percentage of losses ranged from 12.2% of the harvested yield in one of the squash fields, to 142.7% in one of the cucumber fields, and averaged 57%.
It is important to understand that in the case of postharvest losses, estimates from the 1970’s and 1980’s are frequently carried forward in literature as modern estimates (Parfitt, 2010). Decades of innovation in plant breeding, irrigation, plant nutrition and other areas have made production more efficient. At the same time, the potential exists for the current market-driven system to have become more or less wasteful over time. The grower in this study also assumes a 20% loss including both the field and packing house, but orders supplies and packaging based on a 15% loss.
Using field sampling provides a concrete starting point for estimation, rather than beginning with a grower’s visual estimate of what remains in the field. This technique overcomes the limitation of underestimation that may occur when reporting. Additionally, using a standardized method across many crops allows for a metrics that can be compared to be utilized, such as pounds per acre. Field sampling is considered to be a good choice of method when losses are unknown (Franke et al., 2016) and methods are needed to support monitoring losses (WRAP, 2017).
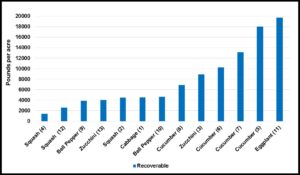
One published study has undertaken field sampling to determine the volume of losses occurring in commercial production of vegetable crops in developed countries. A study of lettuce produced in Sweden determined through field sampling of five farms that an average of 2,855 pounds per acre (converted unit) of lettuce heads remained in the field after the primary harvest, in addition to a much larger amount of outer leaves (Strid and Eriksson, 2014; Strid et al, 2014). The study used three sample areas on each farm to determine the remaining crop per square meter, then scaled the data up to the hectare (Strid and Eriksson, 2014).
Again, combining the marketable and edible volumes found after the primary harvest, the volumes suitable for recovery are potentially vast (Figure 2). Volumes ranged from 1,385 lbs per acre in squash to 19,766 lbs per acre in eggplant, and averaged 7,887 lbs per acre. These volumes exceed the lettuce study’s findings, and no other published studies exist for comparison.
The remaining volume in the field that was considered to be marketable according to current buyer specifications for quality averaged 19.17% of the yield that was marketed from the farm, closely mirroring the 20% usually reported as a national estimate. This commonality again raises the question, are reported losses that are estimated by growers and others simply taking the marketable portion into account? Additionally, this provides strong evidence of how yields could be raised immediately, without increasing the use of land or chemical resources. However, continuing the harvest would require increased demands on labor, and an increase in farm labor costs. With pressing demands in other fields, labor efficiency dropping because of high quality is harder to find in the field, and prices that provide a slim margin for profit, the grower must balance priorities, which can include leaving a portion of the marketable crop unharvested.
Solutions that provide more opportunity to profit from the entire crop produced, and solutions that improve fresh produce recovery efficiency are needed. Godfray et al. (2010) call for “radical” changes to the way food is produced, similar to “those that occurred during the 18th- and 19th-century Industrial and Agricultural Revolutions and the 20th-century Green Revolution.” Through many innovations in the way crops are produced, vegetable yields have grown. However, further utilization of crops that are edible but may not meet current buyer standards for quality can increase the available supply of fresh produce in the US by an estimated 20%, without increasing the amount of some of the resources used in their production.
Results from field sampling and scaling can provide growers with more information to make decisions on whether or not to continue the harvest. While the data collected for this case study represents a single time point in the life of each field, it has confirmed that wide variability occurs at the field level, and that estimates derived from historical data or interviews could be made more reliable with corroboration through field sampling. This project has outlined an efficient method for growers, recovery organizations, markets interested in purchasing produce, or government agencies to use in order to measure and further understand the volume of losses occurring on vegetable farms, and has demonstrated its practical usage on one farm.
Field evaluations for this case study have shown that the volume of marketable food remaining in the field can be high in comparison to the marketed volume, which could provide opportunity for growers to further profit from the crop they are already cultivating. Additionally, the volume of food that could be recovered for human consumption was much higher than the estimates discussed in previous studies, revealing the potential for recovery organizations to procure even more healthy food. Further research on the amount, types, and reasons for food loss at the farm level has been repeatedly recommended, and this study confirms that it is needed.
Educational & Outreach Activities
Participation summary:
Summarized versions of these results have been incorporated into presentations at several events geared towards growers or Extension Agents, bringing awareness to the volumes of produce lost in the field. The Graduate Student Project Coordinator has spoken at the North Carolina Cooperative Extension Service Statewide Local Food Program Team meeting, the North Carolina Tomato Growers Association Meeting, and the Southeast Vegetable & Fruit Expo (North Carolina Vegetable Growers Association Annual Meeting). At this year’s Southeast Vegetable & Fruit Expo, the Graduate Student Project Coordinator has organized a session devoted to vegetables that are underutilized in North Carolina and the opportunities to further market crops.
Two publications are in preparation currently. A research article detailing the novel method used to estimate produce left in the field along with a case study is currently being reviewed by the Graduate Student’s committee. An Extension Bulletin is currently being reviewed by growers and Extension Specialists.
Project Outcomes
The most visible result of this work is its translation into further research on the same topic. A Southern SARE Research and Education Grant entitled A Supply Chain Approach to Finding Win-win Sustainable Solutions for Edible but Unharvested Produce (571385-02452) was secured for 2017 – 2019. It includes four Cooperating Farmers and seven Project Participants from the produce supply chain. The proposed project aims to enhance farm economic and environmental sustainability by: (1) Providing produce growers with easy-to-utilize protocols to determine the quantity of ‘Less than Price Point and Cosmetically Imperfect’ product left in the field (2) Conducting economic analysis to understand the impact on farmer profitability of harvesting/selling LPP and CI product (3) Capitalizing on existing relationships with produce buyers and processors to identify winwin scenarios to bring edible but unharvested produce into new market channels, and identifying and piloting these scenarios with cooperating farmers (4) Fabrication, field testing, and economic analysis of the use of a mechanical harvest-aid to efficiently clear and sort product from fields after major harvesting is completed and (5) Translation of the protocols and outcomes into video and text howto guides for growers, agricultural educators, researchers, and food recovery organizations. Knowing what volume is lost onfarm and why this occurs is a first step to utilizing more of the crop. Connecting this knowledge to the downstream components of the food supply chain—to the wholesaler/distributors and processors and their grocery and food service customers—makes it much more likely that any recommendations reflect real-world business circumstances, and that the findings will be adopted and institutionalized at the systems level.
Presenting this research in its proposed form and resulting information has informed vegetable growers about the losses they experience in their fields. Focusing on connecting growers to supply chain partners that accept a wider range of produce quality has resulted in successes for some growers.
It is anticipated that future work under the Research and Education grant, in particular a video tutorial, will lead to farmer adoption of this measurement strategy in order to reduce losses in the field. Current work that connects area growers to buyers will also become an area of farmer adoption.
Sampling on multiple farms will be required to further understand these initial findings, and this is a focus of the new project. Related research is underway that focuses on the decision making process surrounding the end of the harvest period and determining which strategies that reduce losses in the field would benefit growers, including increasing growers’ market connections, developing a harvest-aid to improve gleaning efficiency, and providing more options to produce value-added products.
References cited:
Abbott, J.A. 1999. Quality measurement of fruits and vegetables. Postharvest Biology and Technology. 15:207—225.
Business for Social Responsibility. 2014. Analysis of U.S. Food Waste Among Food Manufacturers, Retailers, and Restaurants.
Buzby, J.C., et al. 2014. The Estimated Amount, Value, and Calories of Postharvest Food Losses at the Retail and Consumer Levels in the United States. USDA-ERS.
Feeding America website. Accessed February 2, 2015. http://www.feedingamerica.org/our-response/how-we-work/securing-meals/
Franke, U., Hartikainen, H., Mogensen, L., and E. Svanes. 2016. Food losses and waste in primary production: Data collection in the Nordic Countries. http://www.gpp.pt/images/MaisGPP/Iniciativas/CNCDA/Nordicofoodlosses.pdf
Godfray, H.C.J., J.R. Beddington, I.R. Crute, L. Haddad, D. Lawrence, J.F. Muir, J. Pretty, S. Robinson, S.M. Thomas, and C. Toulmin. 2010. Food Security: The Challenge of Feeding 9 Billion People. Science. 327:812-818.
Gunders, D. 2012. Wasted: How America is Losing Up to 40 Percent of Its Food from Farm to Fork to Landfill. Natural Resources Defense Council Issue Paper: 12-06B.
Gustavsson, J., Cederberg, C., Sonesson, U. 2011. Global food losses and food waste. Food and Agriculture Organization of the United Nations. Sweden. <http://www.fao.org/fileadmin/user_upload/ags/publications/GFL_web.pdf>.
Hall, K.D. 2009. The Progressive Increase of Food Waste in America and Its Environmental Impact. PLoS ONE. 4:11. e7940.
Kader, Adel A. 2002. Postharvest Technology of Horticultural Crops. Third Edition. University of California, Agricultural and Natural Resources Publication 3311.
Kader, Adel A. 2003. A Perspective on Postharvest Agriculture (1978-2003). HortScience. 38(5):1004-1008.
Kader, Adel A. 2005. Increasing Food Availability by Reducing Postharvest Losses of Fresh Produce. ActaHort. 682:2169-2175.
Parfitt, J., Barthel, M., and S. Macnaughton. 2010. Food waste within supply chains: quantification and potential for change to 2050. Philosophical Transactions of the Royal Society. 365:3065-3081.
Reed, J. 2014. North Carolina Surplus Data and Food Bank Breakdowns. Hunger-Free Minnesota, on behalf of the NC Association of Food Banks.
Strid, I. and M. Eriksson. 2014. Losses in the supply chain of Swedish lettuce – wasted amounts and their carbon footprint at primary production, whole sale and retail. Proceedings of the 9th International Conference on Life Cycle Assessment in the Agri-Food Sector. http://lcafood2014.org/papers/246.pdf
Strid I, Eriksson M, Andersson S, Olsson M (2014) Losses of iceberg lettuce during primary production andwhole sale in Sweden (in Swedish), report 146. Swedish Board of Agriculture, Jönköping, Sweden.
USDA-AMS. 2016. Equipment Catalog for Fresh and Processed Produce Inspections. https://www.ams.usda.gov/sites/default/files/media/Fresh%20and%20Processed%20FV%20Products%20Inspections.pdf
Waste & Resources Action Programme (WRAP). 2017. Food waste in primary production: a preliminary study on strawberries and lettuces. http://www.wrap.org.uk/sites/files/wrap/Food_waste_in_primary_production_report.pdf