Final report for GS16-161
Project Information
Land use conversion to agriculture and urbanization impacts dynamics of flora and fauna, often negatively. With the use of acoustic recordings, this study estimates the potential impact of urbanization and agriculture on bat species diversity and abundance. We also examined the influence of land cover features such as tree canopy, impervious surfaces, and other features that might drive abundance of bats across 19 sites in the Lower Rio Grande Valley of south Texas. To achieve the research objectives bats were monitored from sunset to sunrise with acoustic surveys in sites spread across four general land use types: agricultural, peri urban, urban, and natural areas. A total of 14,614 distinct calls were detected over 114 observations during the period of 1 May to 15 August 2017. These calls corresponded to nine distinct species of bats, all of which were detected in all of land use types. Results from this study indicate that there were no significant differences in bat abundance or diversity in the four different habitats, although we found a general trend of increasing abundance and decreasing diversity in urban and peri-urban sites. Brazilian free tail bats were the most commonly detected (representing 30.7% of all recordings), and were particularly dominant in both peri-urban sites and urban sites representing 45.5% and 37.8% of all recorded calls, respectively. A closer analysis of land cover features revealed that species evenness increased with tree canopy, and decreased with an increase of nearby area covered in impervious surfaces. Certain bat species were more closely associated with landscapes dominated by soil (such as the cave myotis), while others seemed to avoid urbanized areas entirely. This study highlights that changes in land use can affect bat diversity in somewhat predictable ways. Findings from this study may justify efforts to include urban forests in the design of urban landscapes, especially for flying organisms like bats and birds.
Objectives of this project were to:
1) Acoustically record echolocation calls of local chiropterans in four distinctive land uses: natural, agriculture, urban-suburban and urban-metropolitan. This objective was modified from the original proposal -- we were unable to find comparable areas that were considered organic agriculture vs. conventional agroecosystems.
2) Determine what kind of landscape variables that may influence specific chiropteran species such as edge lines and bodies of water.
Cooperators
- (Researcher)
- (Researcher)
- (Educator and Researcher)
Research
Study Sites- Twenty distinct sites were selected across the Lower Rio Grande Valley spanning four different land-use categories: urban sites were placed towards city centers, peri-urban sites located at the fringe of rural-urban interface, agriculture sites where land use was dominated by grain crops, and sites within natural areas such as state parks and protected private reserves or restoration areas. These sites were selected based on access and safety. Each land use type initially included 5 different sites (Table 1). Due to safety reasons within one of the natural areas, no further observations were made at this site. Thus, a total of 19 sites were included in this study.
Table 1: Description of 19 sites across the Rio Grande Valley used in this study. Sites were categorized into four general habitat types: Agriculture (AGR); Natural Areas (NAT); Peri-urban (PUR); and Urban (URB) areas.

Each of the 19 sites were visited 6 times over the study period (May-early August 2017). At each visit, average temperature, precipitation, humidity, wind speed, and wind direction were recorded (Kestrel 2000, Minneapolis, MN) Digital Thermal to explore any potential effect on these factors on strength of detection or on the patterns of bat diversity or abundance. Data was compared to the weather recorded by nearest National Weather Service Stations to confirm accuracy. In the possibility of extreme weather conditions, (wind speed > 25 mph, or the possibility of hail or lightening,) data collection was rescheduled for later in the week.
Bat Surveys – Echolocation calls were recorded using two ultrasound detector units, (Pettersson D500X; Uppsala, Sweden) installed with a unidirectional, advanced electret microphone (M500, Pettersson, Uppsala, Sweden). The microphone was mounted up on a 12 ft. 13 pvc pipe stand with the detector in a box for protection. The detectors were placed nightly at each site, programmed to record between sunset and sunrise the next day, a total of around 10 hours per observation period. This timeframe exceeded the more common 2-hour observation period (see for example, Wickramasinghe et al. 2003), but in our preliminary trials we found that bat activity in these areas ranged throughout the whole night.
Proximal sites were paired together, for ease of recording. At each site, one complete bat detector unit was installed. Each site was visited 6 times over the entire study period (May through early August); sites pairs were randomly visited every two weeks. Because sites were at state parks, residential homes and operational farms, this randomized schedule was made at the beginning of every month to give owners and land managers advanced notice.
Bat Identification- All recording files were downloaded each day and relabeled by the SonoBat™ D500x file Attributer 2.7, labeled by detector, site type, site location, and date. Audio files within the range of typical echolocation calls were sorted, and files that were not recognized (by pitch or frequency) were tagged for further review. Audio files of poor quality outside of the range for bats (i.e. lower than 20 kilohertz) are typically not kept by the software, but for this study, the setting was kept encompassing a wider range of calls for more species of bat. After the files were scrubbed by the software, the files would go through the SonoBatch program which would identify any files in three different ways: 1) identified by species, 2) partially identified species, and 3) no match. The database that was used to identify the bats for this region was the Texas South Central database which covered San Antonio to the Lower Rio Grande Valley (Sonobat 4, Arcata, California). In addition to software matching, all files were manually vetted by KJ to double-check for consistency.
Land Cover Features- At each fixed detector location, a radius of 80 meters and 805 meters (0.5 mi) were drawn on Google Earth™, to analyze land cover around the detectors. These distances were predetermined based on, respectively, (1) double the range of the bat detector and (2) bats fly several miles a night so the range was widened to half a mile so adjacent sites would not overlap (Brush 2016 and Fenton 1997). The Google Earth™ images were converted into ArcGIS (version 10.3; ESRI, Sacramento CA) to make two distinct maps at each of the sites including the area within the two radii (a total of 38 maps). Maps were uploaded to iTree Canopy™ (US Forest Service, Kent OH) to get estimate land cover features based on six categories: tree, grass, water, impervious surface, shrub and soil. To reduce the standard error, 750 points were randomly chosen and categorized in each map. Percent coverage for each land cover feature were recorded in a database to include in statistical analysis.
Data analysis- Species diversity was calculated at each site by incidence (or distinct detections, as a proxy for abundance) and Simpson’s diversity index (Duchamp and Swihart 2008). Average species diversity and abundance at each site included the six respective observations done at each site over the entire study period. When conditions of normalcy and heteroscedacity were met, an Analysis of Variance (ANOVA) was performed to look for differences in diversity, and abundance across the four-different land-use categories (AGR, URB, PUR, NAT). We also used linear regression to test hypothesized relationships between data on land cover features and bat diversity and abundance. All statistical analysis was performed using JMP® (Cary, NC). To explore relationships between specific bat species abundance and data on landscape features (at 80m and 805m radius) and weather, redundancy analyses (RDA) were performed (Canoco ™; Microcomputer Power, Ithaca, NY). As a short-term study with compensational response data, we used a linear ordination method and constrained RDA, with unrestricted permutations (Canoco™).
Species diversity – A total of 14,614 distinct calls were recorded and detected from May through early August 2017. SonoBatch detected 7 bat species, but by manual inspection of the data, we detected the presence of another distinct signature bat calls (one of high frequency and one of low frequency (Lfreq 1-20kHz and Hfreq 21-125 kHz) that were not included in the sound library, for a total of 9 distinct audio calls that can be attributed to different species (see Table 2). Across the four land use types, we recorded an average of 128.2 distinct calls each night with the highest frequency of incidences in PUR and URB areas. All distinct species were found throughout all 4 habitat types, but with some variation in abundance. For example, calls associated with Tadarida brasiliensis (TADR, Brazilian free-tailed bats) was the most commonly recorded (accounting for nearly a third (30.7%) of all calls) and detected in all 19 sites, but on average was more commonly detected in PUR and URB when compared to observations in NAT (see Table 2) where it accounted for 45.5% and 37.8% respectively, of all detections in these sites. PESU (Perimyotis subflavus, tricolored bat) was relatively uncommon, accounting for only 1.6% of all calls, but was also detected across the four habitat types. We found no significant differences among habitat types in total bat incidence (df =18; F=1.05; p =0.391), although there is a general trend indicating that urbanized areas (PUR and URB) areas have greater relative incidence of bats than NAT and AGR areas (Figure 1). There were also no statistically significant differences in species diversity (Simpson’s, 1-D) among habitat types (df =18; F=2.731; p =0.080).
Figure 1. Relationship between dominant landscape features and bat species diversity (Simpsons, 1-D). 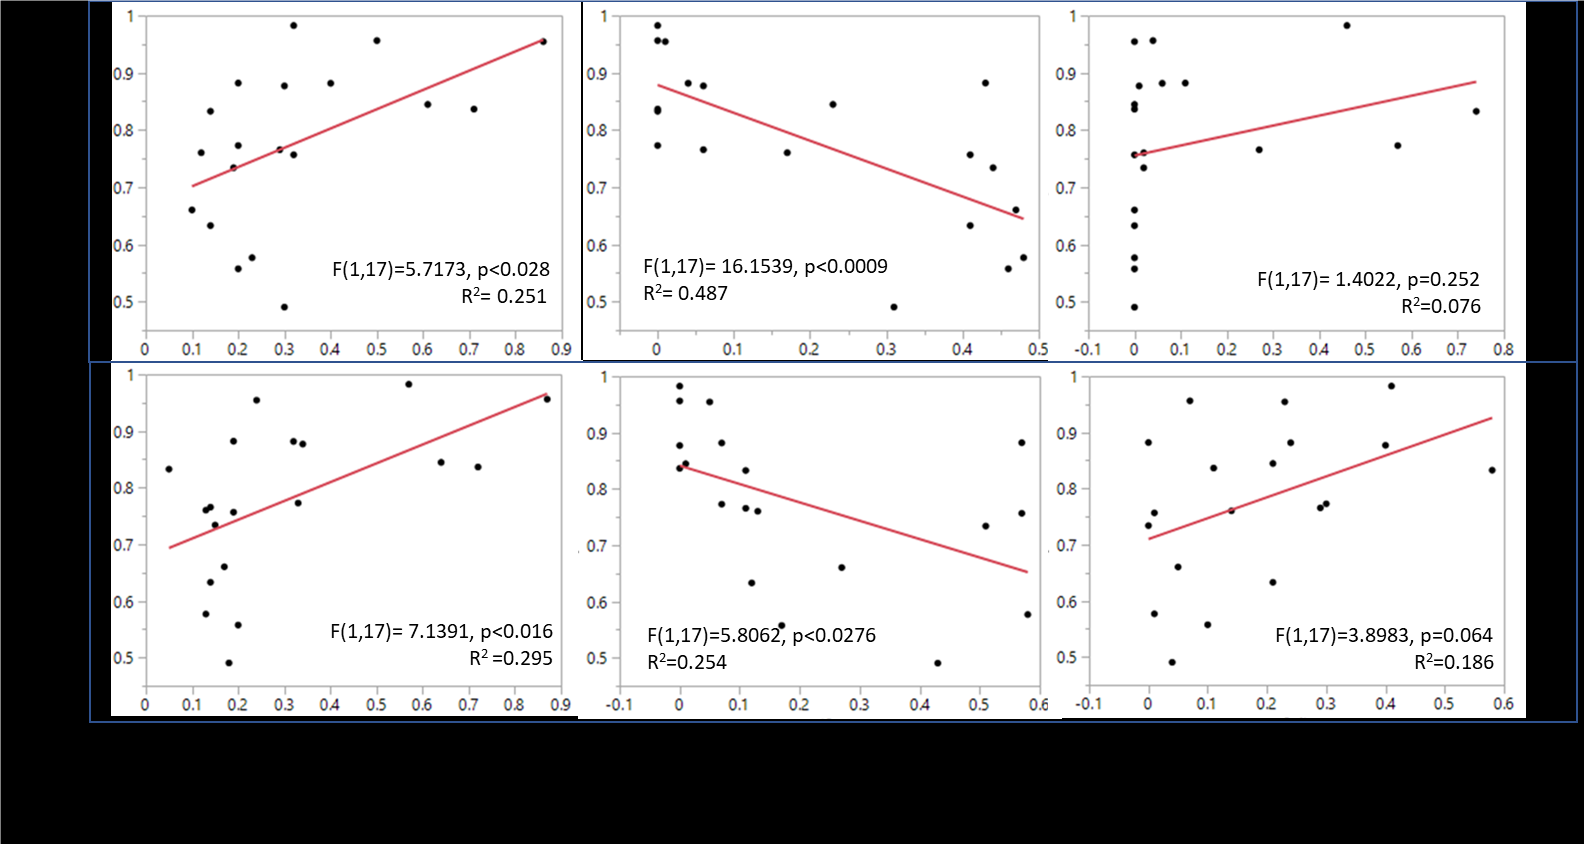
Our results show that certain landscape feature variables can help predict bat diversity when accounting for both near-landscape features and far landscape features (within 805m, Figure 2.3 bottom graphs). For example, increases in tree canopy (within 80m and 805m) was strongly associated with increases in species diversity across the 19 sites when taking into account tree coverage both near the observation sites and within a half mile of the site. Oppositely, sites with considerable land covered by impervious surfaces were strongly associated with decreased bat biodiversity. Land cover categories of soil, water and shrub coverage were poor predictors of biodiversity, although this may have been confounded with skewed data, especially when looking at near-landscape features.
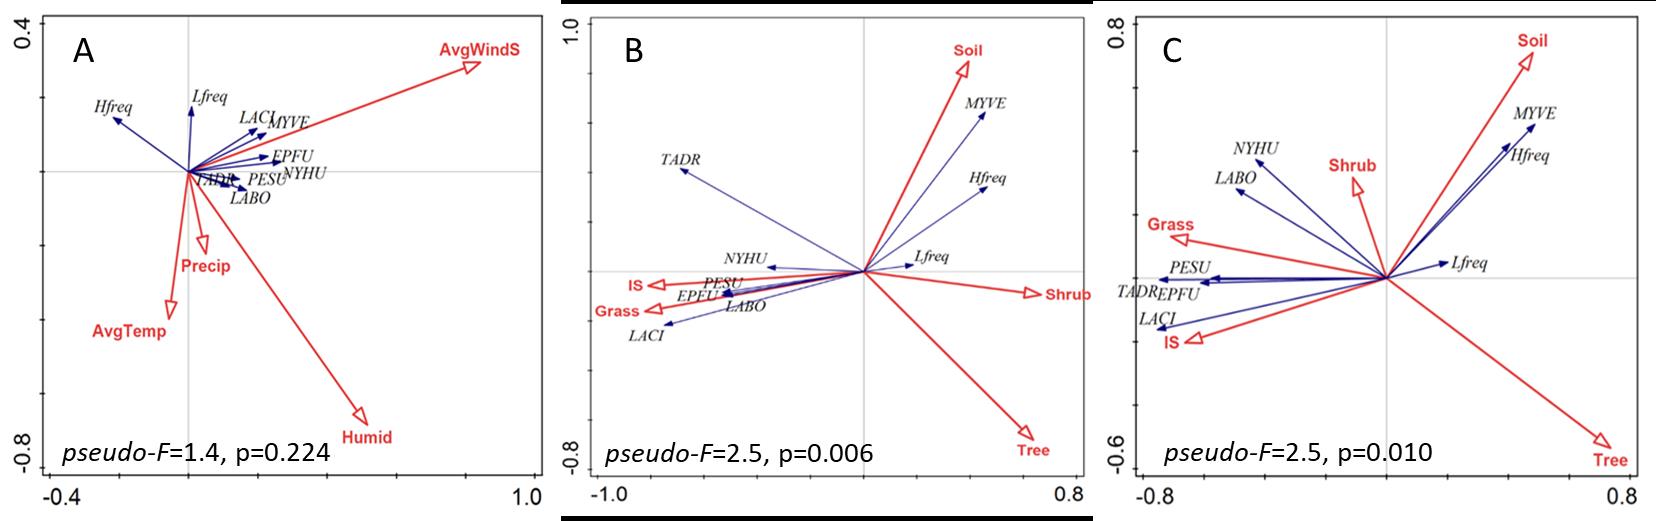
Effect of weather and landscape features on bat populations- Redundancy analysis, which explores how hierarchical data may cluster around certain predictor variables, indicate weather data played an insignificant role on bat species composition (pseudo f=1.3, p = 0.224, Figure 2). The pseudo F statistic listed here describes the ratio of between-cluster variance to within cluster variance, and larger F-values indicate close-knit and separated clusters (Calinski and Harabasz, 1974). Larger, significant F-values for redundancy analyses suggests that immediate landscape features can influence bat species composition. In addition, impervious surface (IS), grass, tree coverage, and soil coverage, within both a near-landscape radius (80m) and far-landscape radius (805m), have the strongest effects on bat species composition. In both RDA analyses, grass and IS are strongly associated and correspond to PUR and URB. Shrub coverage had the least effect on the species of bats. The water variable was excluded in the RDA.
Effect of species incidence and landscape features on bat populations- In RDA of near-landscape land cover (80m radius, Fig. 2.4 B, left), exploratory variables account for 48.8% of the variation, with axis 1 and 2 account for a cumulative 40.0% of the explained variation (pseudo-F=2.5, P=0.006). An urban (PUR and URB) to natural (NAT) gradient, since both are on opposites of the gradient. Six of the 9 species of bat strongly respond to the urban side while the other 3 species weekly correspond to natural areas. EPFU, PESU, and LABO responded strongly to IS and grass landcover and were commonly found in URB and PUR sites. Similar trends were found in RDA test of explanatory landscape variables within a far landscape radius (805m) (pseudo-F=2.1, P=0.01). Across this broader landscape analysis, EPFU, PESU, and LABO continued to respond strongly to IS and grass landcover corresponding with their common occurrence in URB and PUR sites.
Figure 2. Redundancy analysis exploring the effect of weather (A), landscape composition at 80m (B), and landscape composition at 805m (C) on various bat species of the Lower Rio Grande Valley found in this study.
Conclusions
This study serves as a base line study for future graduates, to use as documentation of which south Texas bat species occur where. More research needs to be done in this regard, including studies on the biology and ecology of the fourteen species that have been documented in the LRGV. Three things should be considered for future studies in the LRGV, which is their roosts, their diet, migration and identify all calls as possible for a complete call library.
These results suggest that urbanized areas can support a significant abundance of bats, which might exploit increased roost availability and high densities of insects, especially near street lights (Gehrt Chelsvig 2003; A´vila-Flores and Fenton 2005; Everette et al. 2001; Gaisler, J., et al. 1998; Rydell 2006). Most of the observation locations in urban and peri-urban habitat types were at homes with yards landscaped with lush, dense native vegetation, perhaps atypical to other yards in their respective neighborhoods. This native vegetation promotes diversity of species including insects (McKinney 2002; Burghardt and Tallamy 2013) and may have increased the activities of bats within these sites. This aspect was somewhat difficult to control since all locations required permission included in this study from land managers and property owners, who agreed to volunteer for this study. For various reasons, it was difficult to find cooperation from various homeowners within urban and peri-urban sites, and thus locations were placed within a self-selecting group of volunteers. The data from this study reveal that certain bat species have exploited, adapted to, or generally avoid some habitats. For example, the Brazilian free-tailed bat (Tadarida brasiliensis) was commonly detected in urbanized sites, seemingly exploiting certain resources that are abundant in these areas. Alternatively, this bat was relatively infrequent in NAT sites where there was more evenness in the diversity of bats. The hoary bat is also considered an urban exploiter, occurring around 10 times more frequently in urban and peri-urban sites when compared to agricultural (AGR) and protected areas sites (NAT). The cave myotis (Myotis velifer) might be considered an agricultural exploiter—it was extremely common in agricultural sites, and rare in all other sites. This bat may be exploiting agricultural areas for prey that may not be readily available at other sites, although may not be roosting in the area-- cave myotis may forage further from their roost than other bats due to their relatively larger size and well-adapted wings (Schmidly and Bradley 2016).
Other bats, such as the unidentified bat (Hfreq) in Table 2.3 is largely present in NAT and AGR sites, but very infrequent in urbanized areas. Following Donnelly and Marzluff (2004) and Brush (2016), bats such as these might be considered as urban avoiders. Despite a thorough, intense study, we also did not detect five of the other fourteen species found in the RGV. Although this may be an artifact of the rarity of these species, this also may be due to the sensitivity of some species to high levels of disturbance. Although a higher incidence of bats were detected in these urbanized environments, bat biodiversity remained highest in natural areas, consistent with that of other studies on biodiversity (McKinney 2002; Fenton 1997; Ávila-Flores and Fenton 2005; Threlfall et al. 2016). Although this finding was not significant, we did find a significant linear relationship between the diversity of bats and tree coverage within given landscape. This finding was consistent with that of other vagile organisms (Donnelly and Marzluff 2004; Brush 2016), although Donnelly and Marzluff (2004) found that there was a curvilinear relationship between song bird diversity and tree canopy coverage in the northwestern U.S. Although this does not appear to be the case for bats, more resolution is needed with additional studies which take into a consideration size and connectivity of landscapes. More replicative studies will also help improve the confidence of our findings especially given the probability of user error when using remote sensing devices such as acoustic monitors. In this study, we did have some issue with device tampering, especially in the natural area sites, which may have limited the number of calls detected. Additionally, although we recorded a considerable amount of distinct calls in one sampling season, multiple year recordings should be considered to look for variations in the data.
However, despite the inherent limitations in an intensive study using remote sensing instruments, the data presented in this study demonstrate the potential of using acoustic recordings as a non-invasive method to monitor bat populations, and provide results that are the first documentation of the effect of habitat and habitat features in bad biodiversity and abundance of the specious LRGV. As an area dominated by agribusiness and urban growth, this data can be extended to other regions with conflicting land use change to inform the design and management of both agroecosystems and urban expansion, and to help conserve bat species and the ecosystem services they provide.
Educational & Outreach Activities
Participation summary:
This work was presented at the Subtropical Agriculture and Environments Conference held in Weslaco TX (February 2017). Research findings were presented in both a poster and an oral presentation.
A complete summary of this work was presented at a public seminar in Edinburg TX on December 4, 2017. More than 30 attendees were present.
Project Outcomes
The 4 farmers we worked with voiced appreciation and acknowledgements of the benefits of bats in agroecosystems, especially that of the organic farm and transitioning farms (sites 3-5). The rancher that owned site 1 also appreciated the knowledge that her ranch supported a high diversity of bats in the region. This study represents what is probably the most comprehensive survey of bats in the Rio Grande Valley, and also explores the potential of agricultural lands as a refuge for biodiversity. Although we were not able to accomplish some of our original goals to quantify the services of pest management within agroecosystems, we were able to document a relatively high abundance and diversity of bats in agricultural fields. With this work as a baseline, additional studies may find that bats can significantly reduce crop pest populations (especially of nocturnal Lepidopteran pests such as loopers and other brassica pests). With additional information, this data can perhaps be included into integrated pest management schedules, so that farmers can reduce pesticide use on their crops, and help sustain biodiversity of other organisms. Not only would this be healthier for the farms and the folks that work on it, but may also help save money and dependence on external inputs.
We realized that it is a challenge to get field work done! First, getting farmers to agree to participate in research requires that we communicate a clear benefit to their operation. Luckily, we have a working relationship with several local area farms/ranches--many other farms declined to participate in this work. For that reason, we had to be quick-thinking, and modified the research to best accomplish our project goals of understanding the conservation value of agroecosystems for bats. In collaboration with folks from the Rodale Institute, we also learned that it is hard to decipher landscape level patterns using remote sensing of moving/flying organisms.
Due to certain constrains, this study was only done over one summer period (May-August), providing only a temporal snapshot of diversity and abundance of bats in various ecosystems. A longer term study is required to provide a complete picture of the bats population dynamics and the conservation value of agroecosystems.
Acoustically recording is a great way to study them but we also recommend that mist netting be incorporated into the next study to confirm bat identification (connect the bats with the recordings.) Due to lengthy time of getting the necessary permits and the delay of equipment, we did not mist net for this project. Since we also had a delay of equipment being delivered, our study period was just 1 summer period (May-August). I would also recommend that the study period be extended to either multiple summers or a year long study so we can get a better picture of the bats habits instead of just a snapshot of them.
I would also recommend that if a bat colony (day roost) can be found, then the colonies guano would be interesting to examine. If the guano is studied, we could examine what their diet is consisting of and to see if there are an traces of pesticides. By studying their guano, we could see if they are consuming crop pests and/or the amount of pesticides the bats are also consuming.