Final report for GS17-177
Project Information
Over the past decade, occurrence of potato southern blight caused by Sclerotium rolfsii Sacc. has increased on the Eastern Shore of Virginia (ESVA) and surrounding areas. There is no known potato cultivar resistant to S. rolfsii, and traditional management relying on fumigants and fungicides has provided inconsistent results. Field and laboratory research was conducted in 2017 and 2018 evaluating the effect of four planting dates (PD) and ten cultivars as strategies to reduce the impacts of potato southern blight. Artificial field inoculations were performed between 51 to 73 days post-planting, utilizing a composite inoculum of two S. rolfsii isolates associated with previous ESVA potato southern blight outbreaks. In general, less in-field southern blight incidence was observed for the earlier PDs in both years. In 2018 there was less incidence than compared to 2017. Chipping potato cultivars ‘Atlantic’, ‘Snowden’, and ‘Accumulator’ tended to be more tolerant in early PDs, and only ‘Accumulator’ appeared to be more tolerant in latter PDs. Later PDs also resulted in decreased yield and tuber quality and increased percentage of diseased tubers. ‘Accumulator’ consistently produced the greater marketable tuber yields and least diseased tubers across PDs in both years. ‘Atlantic’ and ‘Snowden’ produced the least disease in the earlier PDs only. There was a significant positive correlation between final southern blight incidence and the percentage of diseased tubers. Furthermore, a significant negative relationship was observed between disease incidence and yield, and the percentage of marketable tubers. The laboratory experiment revealed that ‘Snowden’, ‘Accumulator’, and ‘Atlantic’ had the least S. rolfsii penetration. ‘Adirondack Blue’ in 2017, and ‘Red Norland’, ‘Russet Burbank’, together with ‘Adirondack Blue’ in 2018 had the greatest pathogen penetration. ‘Adirondack Blue’ and ‘Russet Burbank’ had the greater diseased tuber tissue in 2017 and 2018, respectively, whereas ‘Accumulator’ and ‘Atlantic’ provided the least percentage of diseased tubers in 2017 and 2018, respectively. In general, early PDs coupled with tolerant cultivars are recommended as strategies to suppress potato southern blight.
The main goal was to identify potential cultural control options in managing southern blight to ensure the sustainability of potato production in regions impacted by this disease through the following objectives:
- Evaluate the effect of planting dates on southern blight incidence in potato by establishing field trials examining four different planting dates and assessing disease incidence, yield parameters, and tuber quality.
- Evaluate the effect of cultivar and the interaction with planting dates on the incidence of southern blight, by initiating field trials with ten popular cultivars and assessing disease incidence, yield parameters, and tuber quality.
- To screen the effect of potato cultivars on the susceptibility of post-harvest infection by rolfsii.
Cooperators
- (Researcher)
Research
Effect of planting date and cultivar selection on reducing potato loss due to southern blight
Field trial establishment
Field trials (0.60 acres) were established in 2017 and 2018 at Virginia Tech’s Eastern Shore Agricultural Research and Extension Center (ESAREC), in Painter, VA, on a Bojac sandy loam soil with a 0-2% slope (Natural Resources Conservation Service-USDA 2017). There was no known history of S. rolfsii in the trialing locations. Wheat was previously grown in the field for both years.
The experiment was arranged in a split-plot design with four replications, with planting dates as a whole plots and cultivars as sub-plots. In 2017, tubers were planted on Mar 7, Mar 24, Apr 14, and May 10; in 2018: Mar 29, Apr 11, Apr 24, and May 9. Planting dates started as early as the weather allowed and included standard planting dates recommended for commercial production for the mid-Atlantic region (Kuhar et al. 2019). Ten commercial cultivars with unknown resistance to S. rolfsii were used in the study (Table 1). Each whole plot was 25 ft. long x 60 ft. wide with a single guard row on each side and 20 ft. wide buffers between blocks and the subplots were 3 ft. wide x 25 ft. long. Certified potato seed for each cultivar was hand-cut two days prior to planting and dusted with mancozeb (1 lb/ctw; Nubark Mancozeb 6D; Wilbur-Ellis Company LLC, Fresno, CA) immediately after cutting. The seeds were hand planted 10 in. apart within rows with a 36 in. row spacing in pre-formed split back ridges. Bifenthrin (Brigadier 2EC at 16 floz/A, FMC Corporation, Philadelphia, PA), azoxystrobin (Quadris 2.08SC at 16 floz/A, Syngenta Crop Protection, Greensboro, NC), and mefenoxam (Ridomil Gold 4SL at 6 floz/A, Syngenta Crop Protection, Greensboro, NC) were applied in an in-furrow spray at planting. Granular fertilizer (10-10-10) at 600 lb/A was hand-banded prior to planting.
| CultivarZ | Flesh color |
Utilization | Maturity |
| Superio | White | Early fresh & chipping | Early-medium |
| Red Norland | White | Fresh | Early |
| Dark Red Norland | White | Fresh | Early |
| Envol | White | Early fresh | Very early |
| Atlantic | White | Chipping | Medium |
| Snowden | White | Chipping | Late |
| Yukon Gold | Yellow | Early fast | Early |
| Russet Burbank | White | Fresh & Processing | Late |
| Adirondack Blue | Purple | Fresh specialty & chips | Early-medium |
| Accumulator | White | Chipping | Medium-late |
| Z All potato cultivars were imported from certified potato seed producers. | |||
Field trial managements
S-metolachlor (Dual Magnum 7.62EC at 1.5 pt/A, Syngenta Crop Protection, Greensboro, NC) and metribuzin (TriCor 75DF at 0.5 lb/A, United Phosphorus, Inc., King of Prussia, PA) were applied within two days after planting for weed control. Hand weeding was performed as needed for all planting dates throughout the growing season. Bed-mounding and cultivation were performed 2-3 weeks after emergence. Nitrogen (urea 90 lb/acre) was broadcast evenly at blooming stage. Insect and foliar diseases were controlled with standard practices for the mid-Atlantic (Kuhar et al. 2019).
Field inoculum preparation and inoculation
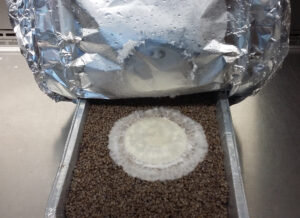
A composite field inoculum utilizing two isolates of S. rolfsii collected on the ESVA was prepared by adapting a technique described by Vagher et al (2014). Five hundred cm3 of millet seed were placed in aluminum foil pans with 600 ml of deionized water and subsequently covered with aluminum foil and autoclaved for 45 min. Millet was stirred and autoclaved for an additional 45 min. A 7 day-old culture of S. rolfsii grown on Potato Dextrose Agar (PDA) was placed face down on the autoclaved millet, double wrapped with aluminum foil, and incubated in a growth chamber for 8 to 10 days at 30°C. The millet was ground into 2-6 mm pieces and dried at room temperature. The final composite inoculum consisted principally of mycelia with a few sclerotia. Forty grams of infected millet seed was scattered 51 to 73 days after planting (DAP) within the plot area (each plot received the same amount of inoculum).
Data collection and Statistical Analysis
Once potatoes emerged, stand counts were collected weekly until the stem and leaves were fully developed for most plants. Disease incidence (% of plants with disease symptoms per plot) was collected during the growing season at two-week intervals in 2017 and a one-week interval in 2018. Plants with disease were determined based on wilting symptoms and the presence of mycelium and sclerotia on the base of the stems (Papavizas and Collins 1990). Soil and air temperature, relative humidity, and rainfall data were collected hourly in 2018 with HOBO® micro weather station data loggers (Onset Computer Corporation, Bourne, MA) installed in field trials. In 2017, the weather data were retrieved from the ESAREC weather station (relative humidity was not available).
Plots were harvested 93 to 114 DAP in 2017, and 90 to 105 DAP in 2018. Each plot was machine lifted, and potato tubers were collected by plots in bins. Harvested tubers were weighed and graded according to USDA standards (Agricultural Marketing Service-USDA 2011). Tubers were inspected visually and symptomatic tubers with brown, yellow, or tan round sunken lesions, white mycelium or soft tissue, were considered diseased (Weber 1943). Yield data was tabulated to obtain marketable yield per hectare, percentage of diseased tubers ([rotten tuber weight /total weight] x 100), and a percentage of marketable potato tubers ([marketable tuber weight/total weight] x 100).
Data were analyzed using SAS® 9.4 Mixed Model Procedures (SAS Institute, Inc., Cary, NC). Analysis of variance (ANOVA) was performed on the final disease incidence, marketable tuber yield, percentage of marketable tubers, and percentage of diseased tubers. To meet ANOVA assumptions, arcsine-square root transformation was applied to the southern blight incidence, percentage of marketable tubers, percentage of diseased tubers, and square root transformation was applied for marketable tuber yield. Main effects of treatments, block, and interactions were included in the model. When the interaction was significant, test slices were used to determine the effect of the cultivar at every planting date. Means comparisons were conducted using the Fisher Least Significant Difference test (LSD) at a 5% significance level. A Spearman correlation analysis was conducted between disease incidence, marketable yield, percentage of marketable yield, and percentage of diseased potato tubers.
Comparison of cultivar susceptibility to S. rolfsii in postharvest infection
Laboratory experiments were conducted in 2017 and 2018 at Virginia Tech’s ESAREC. Potato tubers from the 10 cultivars harvested from the 2017 and 2018 field trials were used in these studies. Six healthy and undamaged potato tubers were selected randomly from each harvest. The tubers were washed in tap water and dried before storing in paper bags at 5°C for 1-2 weeks. Before inoculation, the tubers were pre-washed with tap water, then sterilized for 1 minute with commercial bleach diluted in deionized water (DI) to 10% (v/v) (≈ 0.6 % NaOCl). Lastly, potato tubers were submerged in DI water for 1 min and dried with a paper towel.
The S. rolfsii isolate 16-S2, isolated from an ESVA potato field in 2016, was selected as the strain to be used in the post-harvest assessments. The fungus was grown in Potato Dextrose Agar (PDA) and stored at room temperature for 7-8 days.
Tuber inoculation and experimental design: The inoculation was conducted aseptically using a disinfected 5mm cork borer, a 5mm mycelial plug of a 7-8 days old culture was transferred onto each tuber. The tubers were randomized within a plastic tray previously disinfected with ethanol (70%), and were subsequently incubated at 30°C with high relative humidity (90%+) (Daami-Remadi et al. 2010). The experimental design was a randomized complete block design with five replications per block (planting date).
Tuber assessment
Measurements of pathogen external growth were assessed 48, 72, 96, 144, and 264 hrs after inoculation in 2017, and 48 and 72 hrs after inoculation in 2018. Pathogen external growth was assessed by taking two perpendicular measurements in a cross pattern using a caliper and averaging the measurements to obtain the external lesion diameter.
The tuber rot severity was assessed by measuring pathogen penetration and percentage of necrotic tissue at 11d post-inoculation in 2017 and 8d post-inoculation in 2018. Pathogen penetration was estimated by making a longitudinal cut at the inoculation point. Subsequently, with a caliper, maximum lesion width (w) and depth (d) was calculated with the formula: P (mm) = (w/2 + (d-5))/2 (Daami-Remadi et al. 2010; Lapwood et al. 1984).
The percentage of diseased tissue was estimated by weighing the tubers before (Wi) and after (Wf) cutting them and removing the diseased tissue. Subsequently, the percentage of diseased was calculated using the formula: Diseased tissue (%) = ((Wi-Wf)/Wi) × 100 (Daami-Remadi et al. 2010).
Statistical analysis
ANOVA was performed on means of external mycelial growth and disease severity, and separated using Fisher’s Least Significant Difference test (LSD) at a 5% significance level using SAS® 9.4 PROC General Linear Models (SAS Institute, Inc., Cary, NC). Pearson’s Correlation analysis was carried out between the pathogen external growth, pathogen penetration, and percentage of diseased tissue.
Effect of planting date and cultivar in-field southern blight incidence.
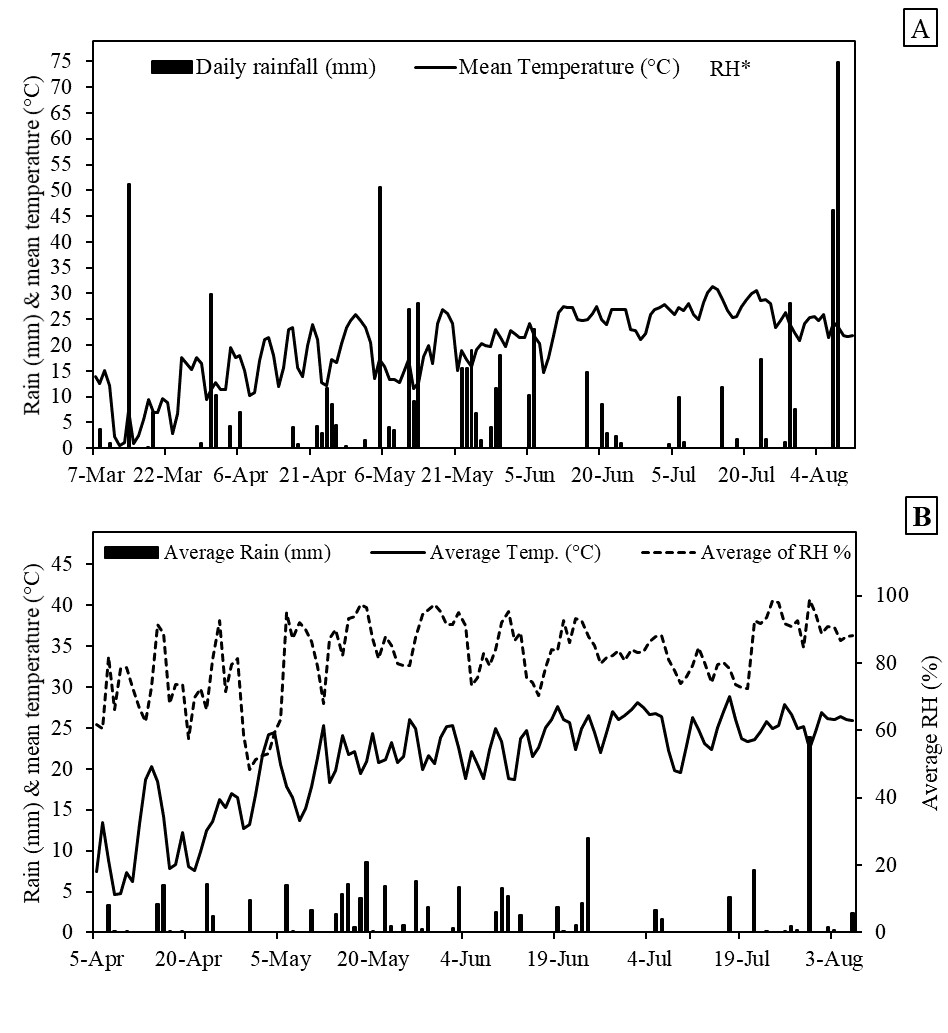
Weather conditions differed between years. In 2017 and 2018, accumulated rainfall over the course of the trials were 158 mm and 124 mm, respectively. Air temperatures were slightly warmer in 2018 than 2017, but averaged below 30°C in both years (Fig.1). Due to the variability, data from the two years were analyzed separately. There were significant interactions (P≤0.05) between the main factor planting date (PD) and cultivar for final in-field southern blight incidence, marketable tuber yield, percentage of marketable tubers, and percentage of diseased tubers in 2017 and 2018; therefore, the effect of cultivar was tested at every PD.
In general, the last PDs for both years produced the most final southern blight incidence compared to the first two PDs (Table 2). In 2017, ‘Atlantic’, ‘Yukon Gold’, ‘Russet Burbank’, and ‘Accumulator’ presented the least southern blight incidence in the 7 Mar PD, and the same result was observed in the 24 Mar PD, but included ‘Snowden’ as well. For the 7 Mar PD, greater disease incidence was observed for ‘Adirondack Blue’, ‘Superior’, ‘Red Norland’, and ‘Dark Red Norland’, but for the 24 Mar PD, ‘Dark Red Norland’ had significantly greater southern blight incidence than all the other cultivars. Differences in southern blight incidence among cultivars decreased in last two PDs in 2017, and ‘Accumulator’ significantly presented the least disease incidence (Table 2). In 2018, ‘Superior’ and ‘Adirondack Blue’ possessed the greater disease incidence for the 29 Mar planting, and for 11 Apr planting the trend was similar, but the red cultivars were among the more susceptible as well. ‘Yukon Gold’ and ‘Accumulator’ produced the least incidence for the 11 Apr planting, but for the subsequent planting ‘Russet Burbank’ and ‘Atlantic’ showed the least incidence together with those two cultivars as well. Only ‘Accumulator’ possessed the least incidence for the earlier and later PDs of 2018. In general, in 2018, southern blight incidence increased for the last two PDs compared to early plantings of that year, but remained lower than the last two PDs in 2017.
| 2017 | 2018 | ||||||||
| Cultivars | 7-Mar | 24-Mar | 14-Apr | 10-May | 29-Mar | 11-Apr | 24-Apr | 9-May | |
| ------------------------Southern blight incidence (%)Y ------------------------- | |||||||||
| Superior | 53 abZ | 48 b | 99 ab | 99 abc | 90 a | 95 a | 91 ab | 83 bc | |
| Red Norland | 54 ab | 32 bc | 99 ab | 100 ab | 76 b | 91 ab | 96 a | 93 ab | |
| Dark Red Norland | 55 ab | 78 a | 99 ab | 100 a | 73 bc | 91 ab | 94 a | 91 abc | |
| Envol | 43 bc | 31 bc | 94 bc | 100 a | 60 cd | 79 bcd | 82 bc | 90 abc | |
| Atlantic | 11 e | 13 d | 89 c | 93 c | 76 bc | 65 de | 75 cd | 81 cd | |
| Snowden | 27 cd | 14 d | 94 bc | 96 bc | 81 ab | 78 cd | 78 c | 93 ab | |
| Yukon Gold | 19 de | 12 d | 99 ab | 100 a | 70 bc | 57 df | 61 d | 86 abc | |
| Russet Burbank | 23 de | 18 cd | 96 abc | 97 bc | 75 bc | 85 bc | 74 cd | 86 abc | |
| Adirondack Blue | 62 a | 49 b | 100 a | 100 ab | 91 a | 95 a | 94 a | 95 a | |
| Accumulator | 16 de | 26 cd | 71 d | 66 d | 52 d | 48 f | 68 cd | 67 d | |
| Z Column means followed by different letters are significantly different from each other based on ANOVA and Fisher’s LSD test at P ≤ 0.05.
Y Final disease incidence prior to harvest. Arcsine-square root transformation was applied prior to data analysis. Back-transformed means are presented. |
|||||||||
Marketable tuber yield varied between 2017 and 2018. Tuber yield in 2017 surpassed 2018 in all PDs. In general, later PDs had a negative effect on marketable tuber yield. Within 2017, Mar PDs resulted in greater yield than Apr and May PDs. The same tendency, but with less tuber yield was observed in 2018, where the last two PDs produced the least marketable tubers. In 2017, among cultivars, ‘Envol’, ‘Atlantic’, and ‘Accumulator’ produced a greater marketable tuber yield, and results were similar to those for the 24 Mar PD, but included Snowden and ‘Russet Burbank’ as well. The least yield was observed for ‘Yukon Gold’, ‘Russet Burbank’, and ‘Adirondack Blue’ in the 7 Mar PD and ‘Yukon Gold’ and the red potato cultivars only for the Mar 24 PD (Table 3). Yield differences were less among cultivars in the Apr PD in 2017, and only ‘Accumulator’ significantly presented the most yield. ‘Atlantic’, ‘Snowden’, and ‘Accumulator’ presented greater marketable tuber yield for Mar 2018 PD, while only ‘Accumulator’ surpassed the other cultivars in the 11 Apr PD. In general, marketable tuber yield started to decrease in the second PD for most cultivars. Only ‘Accumulator’ remained fairly steady in 2018, but was significantly reduced in the last 2017 PDs as well (Table 3).
| 2017 | 2018 | ||||||||
| Cultivars | 7-Mar | 24-Mar | 14-Apr | 10-May | 29-Mar | 11-Apr | 24-Apr | 9-May | |
| ----------------------------Marketable tuber yield (Mg/ha)Y ----------------------------- | |||||||||
| Superior | 29.4 bcdZ | 29.4 bcde | 6.3 d | 2.6 ab | 17.0 de | 6.8 ef | 5.8 cd | 2.4 d | |
| Red Norland | 30.1 bcd | 27.5 def | 4.9 d | 1.5 bc | 18.7 cd | 13.0 cd | 7.0 bc | 3.5 bcd | |
| Dark Red Norland | 32.4 bc | 26.2 ef | 5.9 d | 1.8 abc | 17.1 cde | 10.4 de | 7.9 bc | 3.2 cd | |
| Envol | 32.6 abc | 30.6 bcd | 11.4 bc | 2.2 abc | 15.8 de | 15.7 bc | 9.1 bc | 5.6 bc | |
| Atlantic | 33.8 ab | 32.9 ab | 11.1 bc | 1.6 abc | 26.5 ab | 20.3 b | 9.2 bc | 5.2 bc | |
| Snowden | 28.6 cde | 32.4 abc | 2.6 b | 2.8 a | 27.3 ab | 17.8 bc | 9.5 b | 6.0 b | |
| Yukon Gold | 24.0 f | 23.6 f | 6.3 d | 1.3 c | 13.4 e | 5.5 f | 2.8 e | 0.2 e | |
| Russet Burbank | 25.6 ef | 32.0 abc | 9.1 c | 0.2 d | 17.4 cde | 7.1 ef | 5.6 d | 1.6 d | |
| Adirondack Blue | 27.4 def | 28.3 cde | 6.6 d | 1.4 c | 22.7 bc | 13.5 cd | 7.3 bc | 3.3 bcd | |
| Accumulator | 37.3 a | 36.5 a | 19.4 a | 2.2 abc | 33.3 a | 28.5 a | 21.4 a | 17.9 a | |
| Z Column means followed by different letters are significantly different from each other based on ANOVA and Fisher’s LSD test at P ≤ 0.05.
Y Marketable tubers data was obtained by grading and weighing according to USDA standards. Square root transformation was applied prior to data analysis. Back-transformed means are presented. |
|||||||||
Overall, the percentage of marketable tubers in the two early PDs in 2017 surpassed that of all the other PDs. ‘Russet Burbank’ and ‘Adirondack Blue’ produced the least marketable tubers in the 7 Mar PD in 2017. Later PDs in 2017 exhibited a decreased percentage of marketable tubers for Apr and May PDs (Table 4). In 2017, ‘Snowden’ and ‘Accumulator’ provided the greater percentage of marketable tubers for the third PD, however, in the fourth PD were similar to those produced by ‘Envol’ and ‘Yukon Gold’ (Table 4). ‘Atlantic’, ‘Snowden’, ‘Adirondack Blue’, and ‘Accumulator’ significantly presented greater percentage of marketable tubers in the first 2018 PDs. In general, the negative PD effect on tuber quality was less in the latter three 2018 PDs than in 2017 (Table 4). In the 11 Apr and 9 May 2018 PDs, ‘Accumulator’ presented the greater percentage of marketable tuber, whereas in the 24 Apr PD, the means did not differ with ‘Envol’, ‘Atlantic’, ‘Russet Burbank’, and ‘Adirondack Blue’ (Table 4).
| 2017 | 2018 | ||||||||
| Cultivars | 7-Mar | 24-Mar | 14-Apr | 10-May | 29-Mar | 11-Apr | 24-Apr | 9-May | |
| --------------------------------Marketable tubers (%)Y-------------------------------- | |||||||||
| Superior | 95 aZ | 84 def | 50 cd | 48 bcd | 79 b | 55 de | 69 bcde | 61 bc | |
| Red Norland | 95 a | 81 ef | 30 f | 45 d | 65 c | 55 de | 56 f | 54 cd | |
| Dark Red Norland | 97 a | 77 f | 39 e | 48 cd | 65 c | 49 def | 66 cdef | 56 cd | |
| Envol | 95 a | 90 bcd | 58 bc | 58 abc | 69 bc | 77 b | 76 abc | 72 b | |
| Atlantic | 95 a | 90 bc | 58 bc | 42 d | 91 a | 69 bc | 73 abcd | 64 bc | |
| Snowden | 96 a | 96 a | 65 ab | 59 a | 94 a | 71 bc | 70 bcde | 69 b | |
| Yukon Gold | 94 a | 86 cde | 44 de | 61 a | 66 c | 37 f | 60 ef | 31 e | |
| Russet Burbank | 84 b | 87 cde | 53 cd | 11 e | 72 bc | 47 ef | 80 ab | 60 bc | |
| Adirondack Blue | 83 b | 82 ef | 43 de | 46 d | 89 a | 62 cd | 62 def | 46 d | |
| Accumulator | 96 a | 93 ab | 71 a | 58 ab | 95 a | 87 a | 82 a | 88 a | |
| Z Column means followed by different letters are significantly different from each other based on ANOVA and Fisher’s LSD test at P ≤ 0.05.
Y Arcsine-square root transformation was applied prior to data analysis. Back-transformed means are presented. |
|||||||||
The effect of PD and cultivar on the percent of diseased tubers varied between years. The early 2017 PDs resulted in the least diseased tubers. Among cultivars, ‘Adirondack Blue’ produced greater diseased tubers by percent in the 7 Mar PD in 2017; whereas in the 24 Mar PD, ‘Adirondack Blue’ together with ‘Superior’, ‘Red Norland’, and ‘Dark Red Norland’ yielded the most diseased tubers. The percent of diseased tubers increased in later PDs in 2017. In the 14 Apr PD, ‘Atlantic’, ‘Snowden’, and ‘Accumulator’ produced the least diseased tubers, whereas on 10 May, ‘Russet Burbank’ and ‘Accumulator’ yielded fewer diseased tubers (Table 5). In 2018, the March PD had the least percent of diseased tubers compared to the rest of the 2018 PDs. Furthermore, in the earliest 2018 PD, ‘Atlantic’, ‘Snowden’, and ‘Accumulator’ resulted in the least percent of diseased tubers. ‘Accumulator’ had the greater percent of diseased tubers in the 11 Apr and 9 May PD, but there were no differences in diseased tubers between ‘Envol’, ‘Atlantic’, and ‘Russet Burbank’ in the 24 Apr PD. ‘Yukon Gold’ and the red cultivars exhibited a greater percentage of diseased tubers for all 4 PDs in 2018 (Table 5).
| 2017 | 2018 | ||||||||
| Cultivars | 7-Mar | 24-Mar | 14-Apr | 10-May | 29-Mar | 11-Apr | 24-Apr | 9-May | |
| --------------------------------Diseased tubers (%)Y-------------------------------- | |||||||||
| Superior | 4 bZ | 14 ab | 47 cd | 33 bc | 19 b | 40 bcd | 28 bcd | 33 cd | |
| Red Norland | 3 bc | 16 ab | 66 a | 55 a | 34 a | 43 bc | 42 a | 43 bc | |
| Dark Red Norland | 1 bc | 21 a | 60 ab | 38 b | 33 a | 50 ab | 32 abcd | 40 bc | |
| Envol | 2 bc | 7 cd | 40 de | 35 bc | 30 ab | 22 f | 23 de | 23 d | |
| Atlantic | 1 c | 5 cde | 34 ef | 49 a | 7 cd | 29 def | 26 cde | 31 cd | |
| Snowden | 1 bc | 2 e | 34 ef | 29 bc | 5 cd | 27 ef | 28 bcd | 27 d | |
| Yukon Gold | 4 b | 11 bc | 53 bc | 26 c | 32 a | 62 a | 39 ab | 68 a | |
| Russet Burbank | 0 c | 5 de | 37 e | 14 d | 23 ab | 51 ab | 16 e | 22 d | |
| Adirondack Blue | 10 a | 15 ab | 56 bc | 37 b | 8 c | 35 cde | 35 abc | 51 b | |
| Accumulator | 1 c | 4 de | 26 f | 15 d | 3 d | 9 g | 16 e | 7 e | |
| Z Column means followed by different letters are significantly different from each other based on ANOVA and Fisher’s LSD test at P ≤ 0.05.
Y All potato tubers were inspected visually and symptomatic tubers with S. rolfsii Sacc. infections were considered diseased. Arcsine-square root transformation was applied prior to data analysis. Back-transformed means are presented. |
|||||||||
There were significant correlations (P≤0.05) between final southern blight incidence and marketable tuber yield, percentage of marketable tubers, and percentage of diseased tubers. There was a strong positive relationship (P<0.0001) between diseased tubers and final disease incidence in 2017; however, the relationship was weak in the 2018 experiment (Table 6). In both cases, when incidence increased, the percentage of diseased tubers also increased. A strong negative relationship (P<0.0001) was seen between southern blight incidence and marketable tuber yield in 2017; but a moderate relationship in 2018 (Table 6).
| 2017 | 2018 | ||||
| VariablesZ | Correlation coefficient |
p-value | Correlation coefficient |
p-value | |
| DTubers (%) vs. DINC | 0.81 | <0.0001 | 0.34 | <0.0001 | |
| Mkt (%) vs. DINC | -0.82 | <0.0001 | -0.36 | <0.0001 | |
| Mkt (%) vs. DTubers (%) | -0.90 | <0.0001 | -0.98 | <0.0001 | |
| Mkt Yld vs. DINC | -0.79 | <0.0001 | -0.41 | <0.0001 | |
| Mkt Yld vs DTubers (%) | -0.76 | <0.0001 | -0.70 | <0.0001 | |
| Mkt Yld vs. Mkt (%) | 0.87 | <0.0001 | 0.75 | <0.0001 | |
| Z Variables are abbreviated as follows: DTubers (%)= Percentage of diseased tubers, DINC = final southern blight incidence, Mkt (%) = percentage of marketable tubers, Mkt Yld= marketable yield. | |||||
Post-harvest tuber inoculations
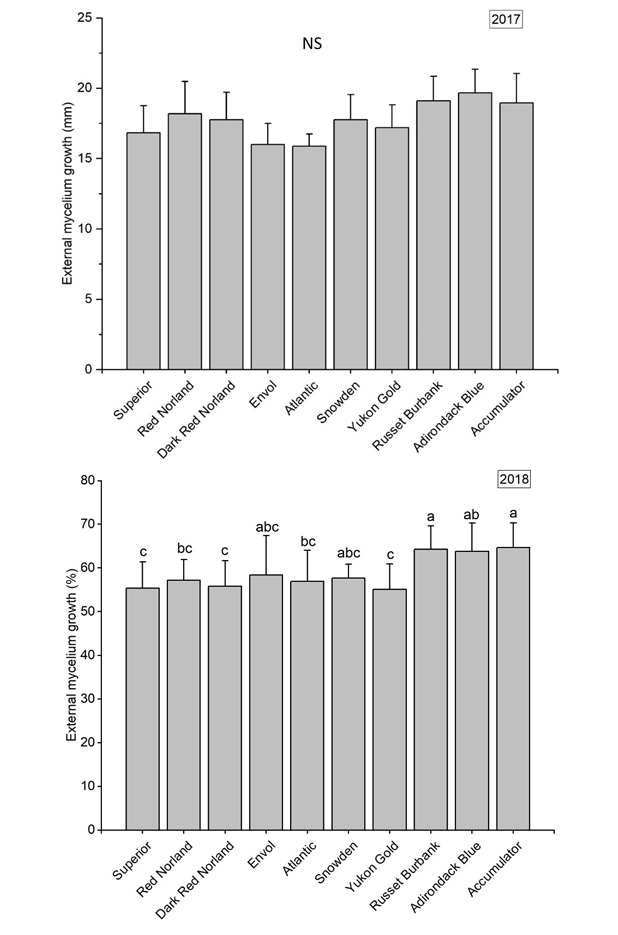
Cultivar affected external S. rolfsii mycelium growth on harvested tubers statistically significantly in 2018 (P=0.0381) but not in 2017 (P=0.4937). There was greater external mycelium development on tubers in 2018 than 2017. In 2017, the mycelium growth remained below 20 mm, while in 2018 it grew to 65 mm. ‘Russet Burbank’ and ‘Accumulator’ had greater mycelium growth, while ‘Superior’, Red Norland, and ‘Yukon Gold’ provided the least external mycelium growth (Fig. 2).
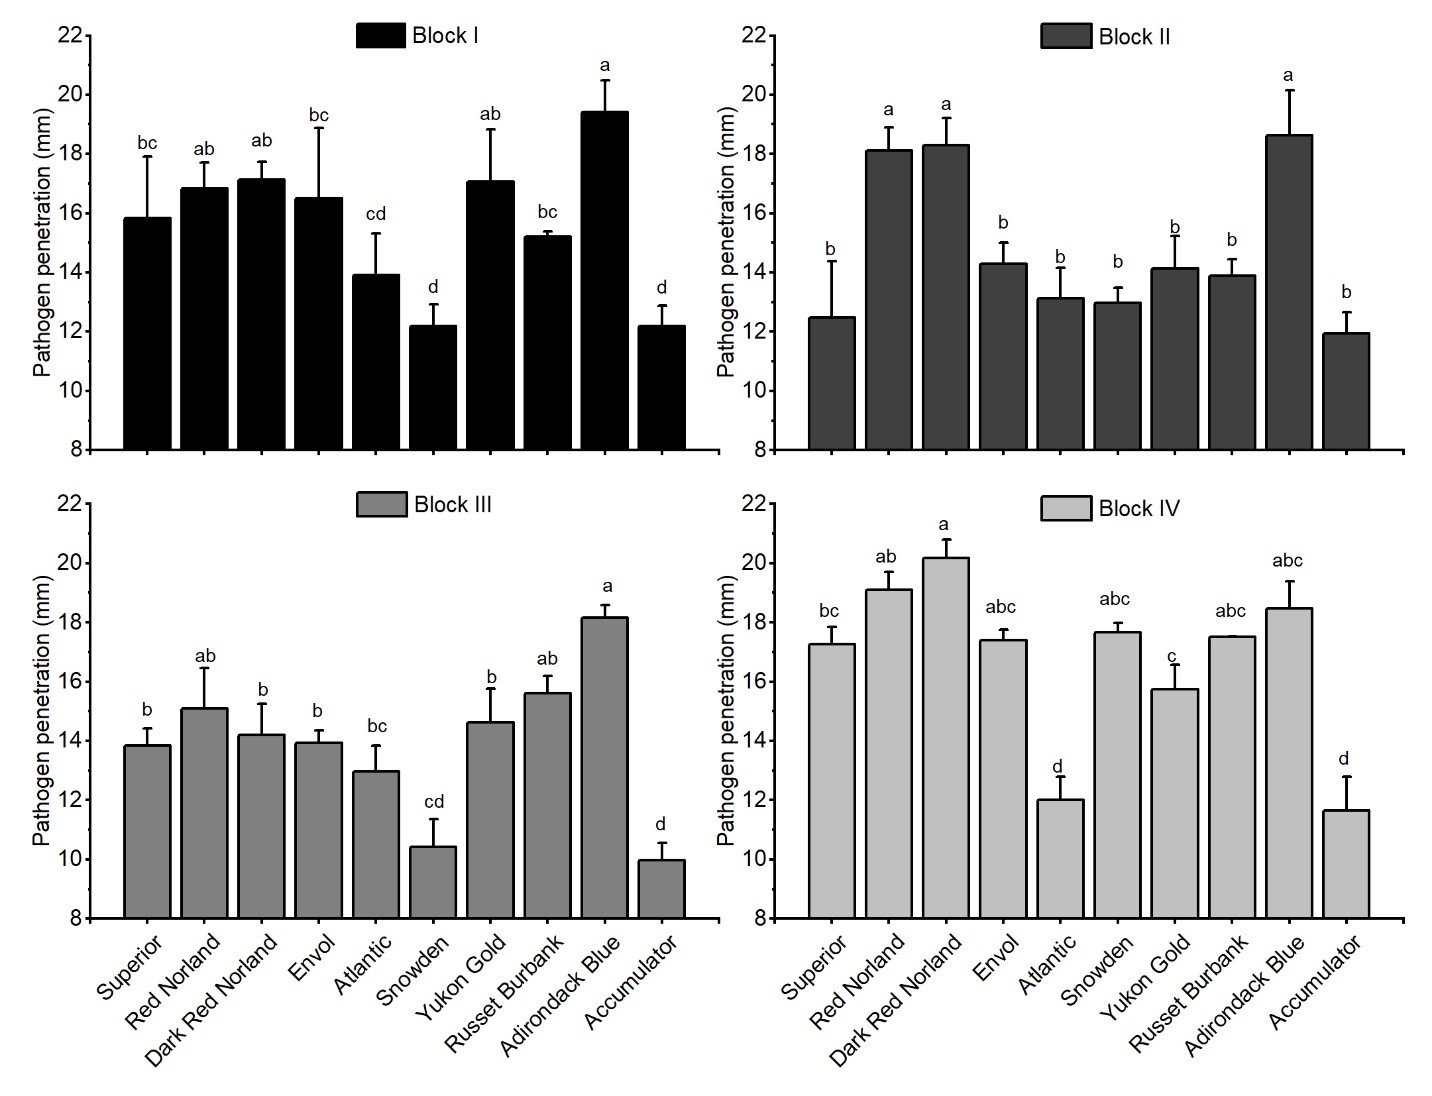
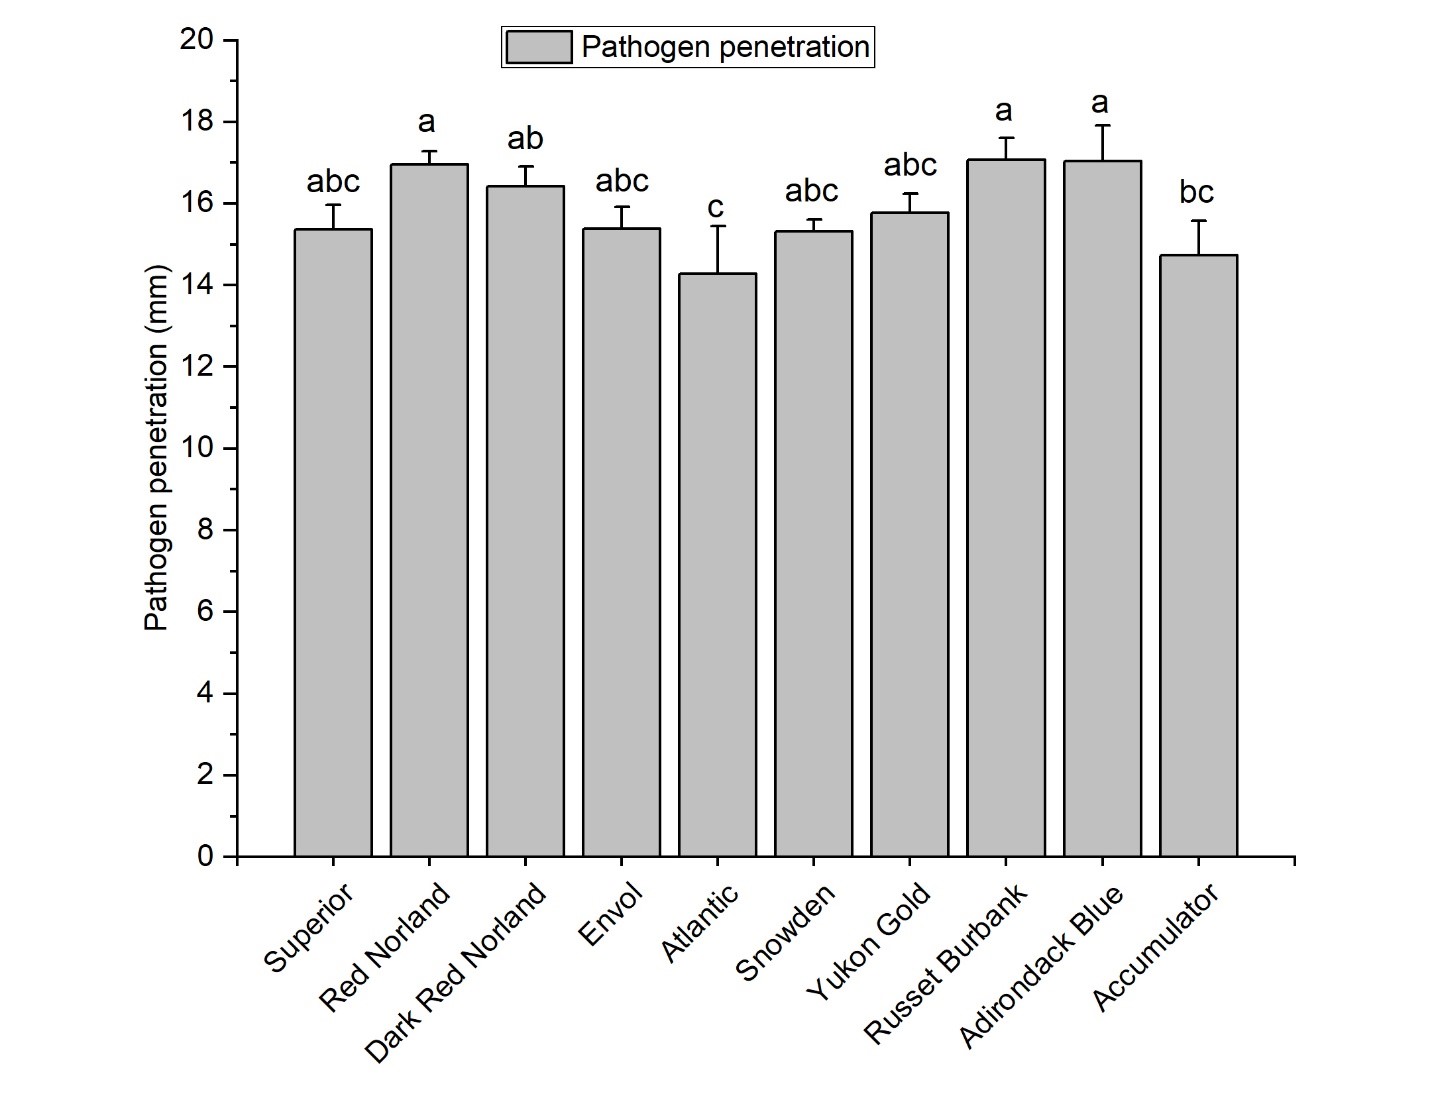
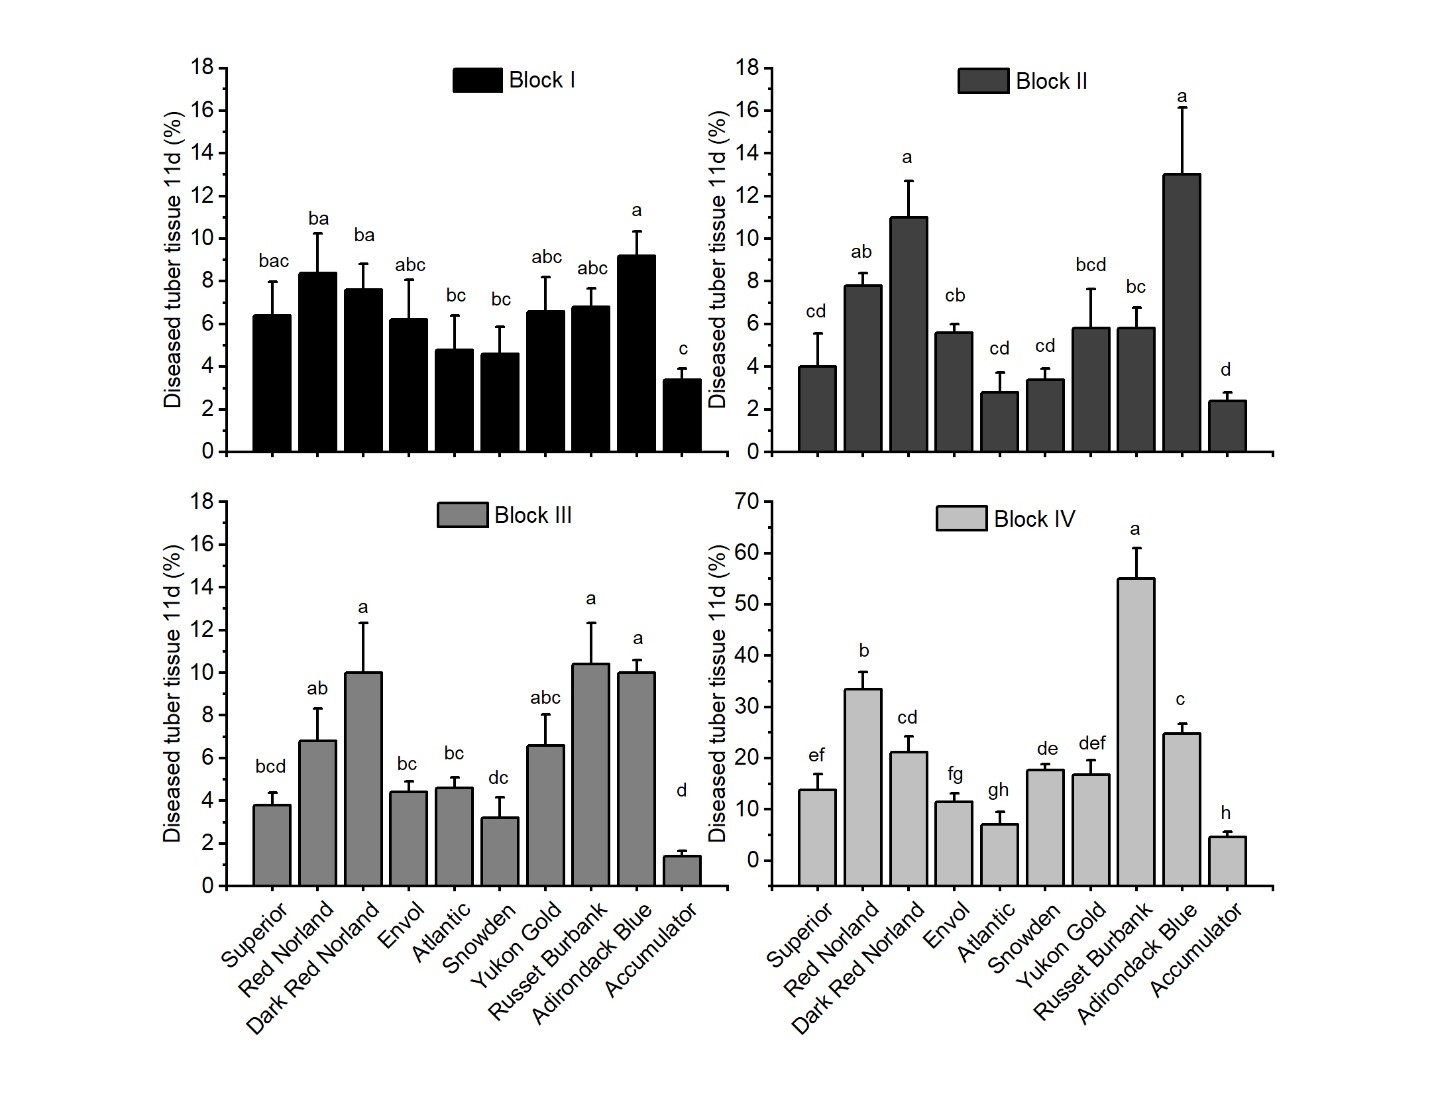
For pathogen internal progress, there was a significant cultivar-block interaction in 2017 (P=0.0183) but not in 2018 (P=0.271). ‘Snowden’ and ‘Accumulator’ presented the least pathogen penetration in blocks I, III, IV, but in block II, ‘Envol’, ‘Atlantic’, and ‘Russet Burbank’ were statistically similar to those two cultivars. ‘Adirondack Blue’ provided the greater pathogen penetration for blocks I and III, but in Block II and IV, it was coupled to red cultivars (Fig. 3). In 2018, ‘Red Norland’, ‘Russet Burbank’, and ‘Adirondack Blue’ had the greater pathogen penetration, whereas ‘Atlantic’ presented the least pathogen penetration (Fig. 4).
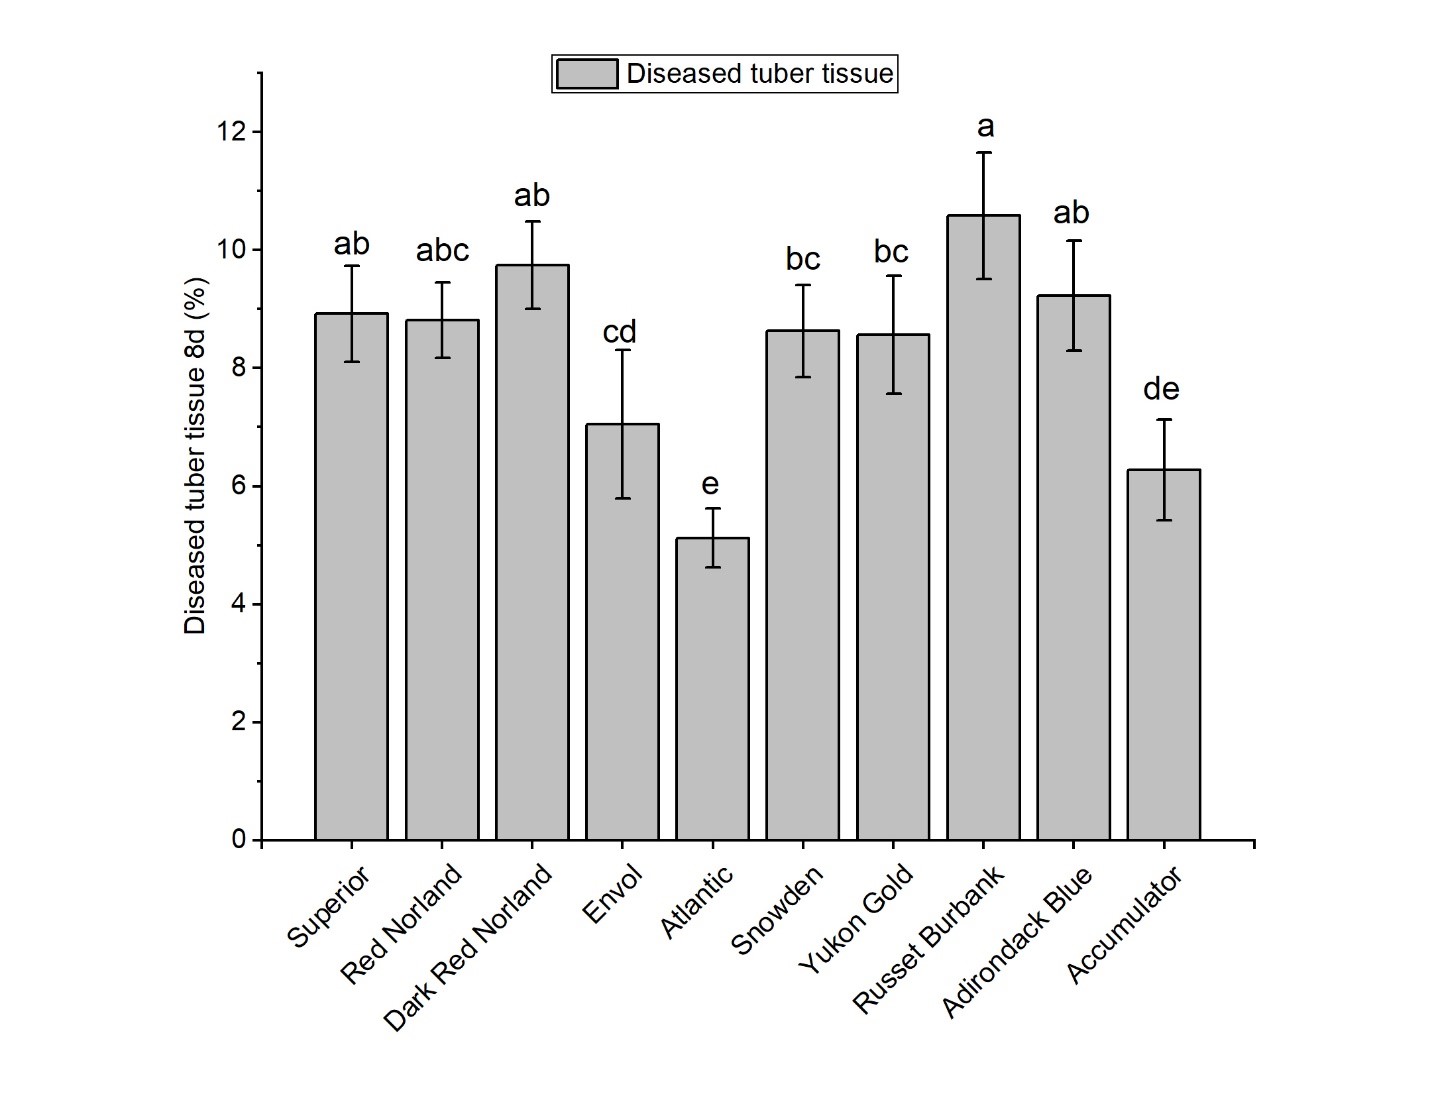
There was significant cultivar-block interaction in 2017 (P<0.0001) for diseased tuber tissue. ‘Accumulator’ significantly exhibited the least diseased tuber tissue in all blocks. ‘Adirondack Blue’ presented a greater diseased tuber tissue in blocks I and IV, but it was coupled with ‘Dark Red Norland’ in Block II, and with ‘Dark Red Norland’, and ‘Russet Burbank’ in Block III (Fig. 5). ‘Atlantic’ exhibited the least diseased tissue in 2018, and ‘Russet Burbank’ presented the most diseased tuber tissue, while the rest of cultivars presented intermedia reaction to diseased tissue caused by S. rolfsii (Fig. 6).
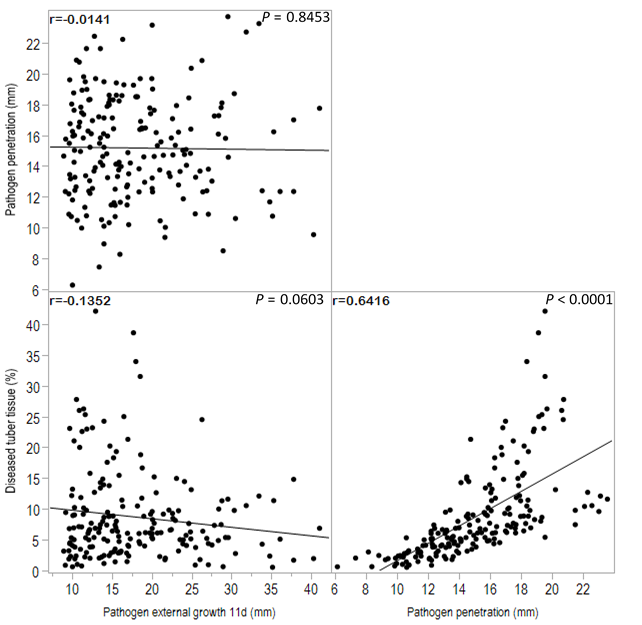
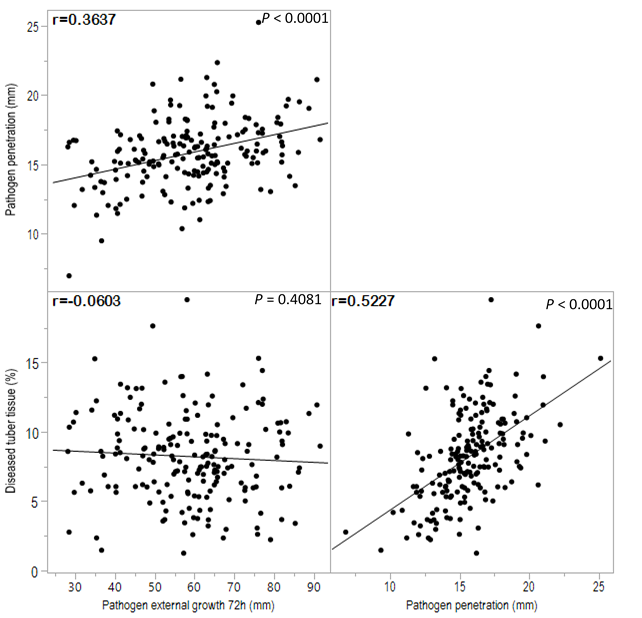
Pearson’s correlation analysis for the 2017 experiment showed a statistically significant positive relationship (P<0.0001) between pathogen penetration and diseased tuber tissue (Fig. 7). The analysis did not provide enough evidence to support a relationship between external mycelium growth and pathogen penetration and diseased tissue in the 2017 experiment (P>0.05). However, in 2018, the correlation was statistically significant between pathogen penetration and diseased tissue (P<0.0001), and between external mycelium and pathogen penetration (P<0.0001), the relationship of the latter, although it is weak (Fig. 8).
Discussion
To our knowledge, there have been no previous publications researching the effect of PD and cultivars on southern blight in-field incidence on potatoes in the U.S. There are several studies in crops such as peanuts, carrots, and soybean and diseases such Phialophora gregata or S. rolfsii worldwide using cultivars and PD as an approach to its management (Grau et al. 1994; Hagan et al. 2001; Jenkins and Averre 1986).
Different weather conditions were observed in both years of this study, but in general, conditions were adequate for S. rolfsii in-field development. The accumulated rainfall was greater in 2017, and appeared to be more uniformly dispersed across the 2017 growing season, which could explain the overall greater in-field southern blight incidence for the later 2017 PD compared to 2018. Incidence was more severe in the two early 2018 PDs compared to the 2017 early PDs. The planting dates in 2017 started earlier than 2018, and this was due to weather conditions. This early planting could be another factor that led to less in-field southern blight incidence development compared to the two early 2018 PDs. Southern blight incidence varied according to the PD, and there were also differences depending on the cultivar. In general, table stock cultivars tended to have higher southern blight incidences in 2017; however, that tendency changed in first and last PD in 2018, where chipping cultivars such as ‘Snowden’ were included among the cultivars with greater in-field southern blight incidence as well. Among table stock cultivars, ‘Envol’ provided an intermediate southern blight incidence compared to the red potatoes and ‘Adirondack Blue’. Most of the cultivars reached one-hundred percent disease incidence the last 2017 PDs, but this did not happen in 2018. This could be linked to warmer conditions and less rainfall in 2018, where the conditions for pathogen development were not ideal. ‘Accumulator’ appears to be more tolerant to southern blight incidence in later PDs.
The first PDs produced greater marketable tubers and the least percentage of diseased tubers in both years. The last two PDs in both years substantially reduced the marketable yield of the tuber, to the point of being less than commercially acceptable. In addition, quality decreased and diseased tubers increased in later PDs, which could be related to a greater incidence of diseases. ‘Accumulator’ has more tolerance to later planting dates, which could be an option for growers in fields with greater S. rolfsii infestation.
Correlation analysis showed how pathogen behavior varies easily from year to year, and this is supported by the results which revealed that in 2017 the relationship between incidence and percentage of diseased tubers was fairly strong, while in 2018, it was weak. In either case, the relationship is positive, meaning that when in-field southern blight incidence increases, tuber disease does as well.
Laboratory analysis to compare the susceptibility of cultivars to S. rolfsii infection revealed that cultivars react differently to S. rolfsii inoculation under a controlled environment. The susceptibility was compared by measuring external mycelium growth, pathogen penetration, and percentage of diseased tuber tissue. S. rolfsii is a ubiquitous soil-borne pathogen that possesses wide host range worldwide (Saraswathi and Reddy 2012), and have the capability to easily colonize dead or decaying organic matter under ideal conditions, and this was probably one of the reasons why there was no difference between tubers external mycelium progress in 2017. However, there were differences in penetration, which means that it cannot entirely determine the damage of the pathogen just by seeing the external progress. This argument was also supported by a lack of evidence to conclude a significant relationship revealed between external mycelium growth and pathogen penetration in the correlation analysis in 2017, and only a weak correlation was seen in the 2018 experiment.
Conclusion
The present research provided novel information on the effect of PD and cultivar on potato southern blight. The results revealed that in-field southern blight incidence varied markedly between planting dates. Later planting dates decreased potato tuber yield and quality, but the quantification of the impact depends on other factors such as weather conditions. Cultivars such as ‘Accumulator’ provide more tolerance to southern blight in later PDs. On the other hand, red cultivars and ‘Adirondack Blue’ tend to be more susceptible to S. rolfsii. An early PD coupled with tolerant cultivars are recommended as strategies to suppress potato southern blight.
References
Agricultural Marketing Service-USDA. 2011. United States Standards for Grades of Potatoes. Retrieved from https://www.ams.usda.gov/sites/default/files/media/Potato_Standard%5B1%5D.pdf. Accessed Oct. 10, 2019.
Daami-Remadi, M., Jabnoun-Khiareddine, H., Sdiri, A., and El Mahjoub, M. 2010. Effect of temperature on Sclerotium rolfsii mycelial growth and rot severity on potato tubers. Tunisian Plant Science and Biotechnology II. The African Journal of Plant Science and Biotechnology 4:54-58.
Grau, C., Oplinger, E., Adee, E., Hinkens, E., and Martinka, M. 1994. Planting date and row width effect on severity of brown stem rot and soybean productivity. Journal of production agriculture 7:347-351.
Hagan, A. K., Weeks, J. R., Bowen, K. L., and Wells, L. W. 2001. Influence of production practices on peanut disease and yield. Alabama Agr. Exp. Station. Auburn University Bull. 643.
Jenkins, S. F., and Averre, C. W. 1986. Problems and progress in integrated control of southern blight of vegetables. Plant Disease 70:614-620.
Kuhar, T. P., Arancibia, R. A., Hamilton, G. C., VanGessel, M. J., and Wyenandt, C. A. 2019. 2019 Mid-Atlantic Commercial Vegetable Production Recommendations. Virginia Cooperative Extension. 456-240. Available at: https://www.pubs.ext.vt.edu/456/456-420/456-420.html.
Lapwood, D. H., Read, P. J., and Spokes, J. 1984. Methods for assessing the susceptibility of potato tubers of different cultivars to rotting by Erwinia carotovora subspecies atroseptica and carotovora. Plant Pathology 33:13-20.
Natural Resources Conservation Service-USDA. 2017. Web Soil Survey. https://websoilsurvey.sc.egov.usda.gov/. Accessed Nov. 20. 2018.
Papavizas, G., and Collins, D. 1990. Influence of Gliocladium virens on germination and infectivity of sclerotia of Sclerotium rolfsii. Phytopathology 80:627-630.
Saraswathi, M., and Reddy, M. 2012. Phenolic acids associated with Sclerotium rolfsii in groundnut (Arachis hypogaea L.) during pathogenesis. International Journal of Plant Pathology 3:82-88.
Weber, G. F. 1943. Southern blight, Corticium rolfsii of potato tubers. Phytopathology 33:615-617.
Educational & Outreach Activities
Participation summary:
During 2017, the field trial was included in the plant disease identification and management demonstrations for the 4-H youth and graduate students’ tours that were held at ESAREC in Painter, VA.
The research was presented to potato growers and agricultural professionals at the 2018 Eastern Shore Agricultural Conference & Trade Show in Melfa, VA, on January 24, 2018. Later, the research was presented at the 73rd meeting of the NJDelMarVaPa Extension Plant Pathologists Meeting in Newark, DE. The preliminary results of the project were presented at the 2018 Potomac Division 74th Annual Meeting in Ocean City, MD, on March 22, 2018. At the 2018 American Phytopathological society, Pacific Division meeting in Portland, OR, and finally at the International Congress of Plant Pathology in Boston, MA.


Project Outcomes
The project allowed me to understand the information farmers need, and to help them make improved crop production decisions based on these results. I gained scientific communication skills by sharing the project outcomes with scientists, extension groups, graduate students, growers, and children.
This project generated information that is not currently available. This information provides options for farmers to select cultivars and a planting date to minimize the negative impact on potato yield caused by southern blight. Likewise, this could reduce the use of pesticides as a primary option for the management of southern blight.
I am very grateful for the financial support to this project provided by SARE, this, without a doubt, contributes to the agricultural sustainability and development of successful agricultural professionals.