Final report for GS18-195
Project Information
Nitrogen is an essential and often growth-limiting nutrient for plants. Legumes like peanut (Arachis hypogea) fulfill their nitrogen requirement by symbiotic association with nitrogen-fixing bacteria, rhizobia. This symbiotic interaction results in the formation of root nodules that fix atmospheric nitrogen to enhance the growth and yield of peanuts. In addition to this, peanut yield also depends on variety, farming practice, type of rhizobia inoculation, and nutrient availability. Nutrient availability is largely determined by microbial activity in the rhizosphere that influences plant health, nutrition, yield, soil structure, and soil fertility. However, our understanding of the complex response of peanut yield and microbial diversity to organic vs conventional farming systems and to rhizobia inoculations is extremely limited.
In this research, we studied the impacts of conventional vs. organic cultivation practices and rhizobial inoculation with commercial vs. single strain inoculum on peanut yield and soil microbial diversity of five peanut cultivars.
Our results showed that yields from organic cultivation were significantly lower than the yields from inorganic cultivation practices. Georgia06 and TUFRunner511 consistently showed higher yields in both organic and inorganic trials. Our results showed significant two-way interactions between cultivation type and genotype for most of the phenotypes tested.
16S microbiome sequencing showed considerable variation between the cultivation types and inoculum showing that there is a preferential association of microbes to various inoculum and cropping systems. In a permutational multivariate analysis of variance, there was evidence for an effect of cultivation type and inoculum on bacterial communities. The cultivation type and inoculum explained a high percentage of the differences among bacterial communities.
Therefore, it is critical for the farmers to choose varieties properly based on their cultivation practices. Organic cultivation practice had higher diversity of bacteria than inorganic cultivation practice. This research guides farmers and scientists to improve peanut yield while promoting microbial diversity and increasing sustainability.
Objective 1: To determine the effects of different farming practice, rhizobia inoculation, and peanut cultivars and their interactions on peanut yield.
Objective 2: To elucidate the effects of different farming practice, rhizobia inoculation, and peanut cultivars and their interactions on soil microbial diversity.
Research
Materials and methods
Plant Materials
Five peanut lines were selected for this experiment: Georgia 06G, Georgia 14N, TUFRunner-511, E4(Nod-), and E5(Nod+). Georgia 06G (Branch, 2007) was selected as this is the most common cultivar of peanut grown in the Southeastern United States. Georgia 14N is a runner type peanut that is high-oleic, tomato spotted wilt virus (TSWV) resistant, and root-knot nematode (RKN) [Meloidogyne arenaria (Neal) Chitwood race 1]–resistant (Branch and Brenneman, 2015). TUFRunner 511 is a cultivar developed by the University of Florida, Florida Agricultural Experiment Station, North Florida Research and Education Center (NFREC) near Marianna, FL, that has high oleic oil chemistry, with 76% oleic fatty acid (Tillman and Gorbet, 2017). E4 and E5 are sister recombinant inbred lines derived from a cross between PI262090 and UF487A where E4 is non-nodulating and E5 is nodulating (Peng et al., 2018).
Experimental design
The field experiment was conducted at the University of Florida / Institute of Food and Agricultural Services (UF/IFAS) Plant Science Research and Education Unit (PSREU) in Citra, Florida at 29.408780, -82.144976 following a split-split-plot design with three replications. Three factors were included in the experiment with farming practice (organic vs inorganic) as the whole plot, rhizobia inoculation [commercial inoculum, single-strain inoculum, no (blank) inoculum] as the sub-plot, and peanut cultivars (five peanut cultivars) as the sub-sub plot. Each experiment unit was four-row plots of 15 ft. length x 12 ft. width containing 30 seeds per row.
Organic cultivation practice
Peanut field planting, field maintenance, and harvesting were conducted according to the UF/IFAS recommendations for peanut growing in this region. Both fields were planted on 2019-05-02. For the organic field, organic fertilizer 10-2-8 at 1000 lbs per acre and Sulfate of Potash at 50 lbs per acre were applied at planting. Gypsum at 2000 lbs per acre was applied on June 25. Organic fertilizer 10-2-8 at 500 lb/acre was applied on July 22. Insecticide (Dipel at 1 lb/acre) was applied on August 8. Fungicide Double Nickel at 3 lb/acre, Serenade at 3 qt/acre, Serenade at 3 qt/acre, basic copper at 1.5 lb/acre and Serenade at 3 qt/acre were applied on June 7, June 19, July 8, August 6, and August 28, respectively. Hand weeding was done on July 19, August 26, and September 23. The plants were harvested by digging pods from the ground with a digger-shaker-inverter on October 10 and left partially dry in the field for three days. Then a peanut picker was used to remove the nuts from the vine and the nuts were collected and placed on trailers where heated air was passed through the peanuts to complete the drying process.
Inorganic cultivation practice
For the inorganic field, preplant fertilizer (5-10-15) at 700 lbs per acre, fungicide (Abound) at 24oz per acre in furrow, and insecticide (Imidacloprid) at 10oz per acre in furrow were applied during planting. Pre-emergent herbicides Prowl H20 at 1qt/acre and Strongarm at 0.45 oz/acre were applied on May 3. Dual Magnum herbicide at 24oz per acre was applied on May 13. Fungicide (Bravo at 16oz per acre, Tebustar at 7.20z per acre) and insecticide (Dimlin at 8 oz per acre) were applied on June 7. Gypsum at 200 lb per acre was applied on June 11 followed by herbicide (Cadre at 4 oz per acre) on June 12. Fungicide (Bravo at 24oz/acre and Tebustar at 7.2 oz/acre) and insecticide (Dimlin at 8 oz/acre) were applied on June 19. Fungicide (Elatus at 7.3 oz/acre and Miravis 3.4oz/acre) were applied on July 8. Fertilizer 10-10-10 at 500 lb/acre was applied on July 22. Fungicide (Elatus 7.3oz/acre and Miravis 3.4 oz/acre) were applied on August 6 and (Bravo 24oz/acre and Topsin 10oz/acre) were applied on August 28. The plants were dug on October 10 and followed the same protocol as described above.
Inoculum
Commercial inoculum (Dyna Start Max) was applied at the rate of 1oz per 1,000’ or row according to the manufacturer’s recommendations which was equivalent to 1.04 × 10¹¹ viable cells for the entire experiment. Same amount of Lb8 inoculum (Paudel et al., 2020) was prepared and applied in the experiment. For the control, water with no inoculum was used.
Phenotyping
Plant photosynthesis rate was recorded by SPAD chlorophyll meter readings (SCMR) at 30, 60, and 90 days after germination to monitor peanut leaf chlorophyll content. Three plants from each plot were randomly sampled, and the second fully expanded leaves from the top of the main stems were tested at 09:00-10:00 am at 3 points. After peanut harvesting, pod yield, nodule number, nodule biomass, above-ground and below-ground biomass were measured.
Soil sampling
Prior to harvest, the roots were removed from the soil with a shovel and then gently shaken to remove the soil that was not tightly attached to the roots. The roots from two plants per replication were pooled. The roots were placed in a clean and sterile 50-ml conical tube containing 25 mL of sterile phosphate buffered saline (PBS) solution and vortexed for 15 s (Mcpherson et al., 2018). The soil that was washed off from the roots was poured into a 50-ml Falcon tube, centrifuged and stored at 4 °C until DNA extraction on the same day; this soil was termed the rhizosphere compartment (Lakshmanan et al., 2017; Xu et al., 2018).
DNA extraction
Total genomic DNA was extracted using the DNeasy PowerSoil Pro Kit (QIAGEN) according to the manufacturer’s protocol. Quality and quantity of DNA was checked and sent for normalization, library preparation, and sequencing at CD Genomics. The V4 region of the 16S rRNA gene was amplified following the EMP protocol and sequenced using Illumina NovaSeq pair-end 250bp (Mcpherson et al., 2018).
16S rRNA gene amplification and sequencing library preparation
Reads from 16S-V4 region were analyzed using Qiime2/v2020.8 (Bolyen et al., 2019). Reads were trimmed and dereplicated using DADA2 as implemented in Qiime2 with paired-end setting (including quality control, trimming, pair-joining, and chimera removals) resulting in 97.5% of retained reads, before importing into Qiime2 artifacts. The 16S-V4 representative Amplicon sequence variant (ASV)s was assigned to the greengenes database using naϊve Bayes classifier in Qiime2 producing taxonomy tables. Phylogenetic trees were built using Qiime2 using the FastTree algorithm.
Statistical analysis and microbiome characterization
Alpha diversity indexes were calculated for observed sequences, richness, and evenness. Beta diversity analysis included principal coordinate analysis (PCoA) on Bray-Curtis and weighted UniFrac distance. The feature table was rarefied to a sampling depth of 56,000. This sampling depth was selected as it was approaching the maximum depth which retained all samples for our analysis.
Results and discussion
Soil analysis prior to planting
Phosphorus and NH4N were significantly higher in inorganic plots as compared to the organic plots (Table 1). Therefore, organic fertilizer was applied prior to planting in the organic plots. There were no significant differences between the other elements.
Table 1. Soil analysis of the organic and inorganic plots prior to planting.
|
FieldType |
P* |
K |
NH4N* |
NO3N |
TKN |
pH |
|
Inorganic |
146.93a |
16.87 |
0.76a |
1.07 |
261.21 |
6.61 |
|
Organic |
119.82b |
13.38 |
0.53b |
0.88 |
232.60 |
6.64 |
Different letters indicate significant differences between groups (p < 0.05).
Yield
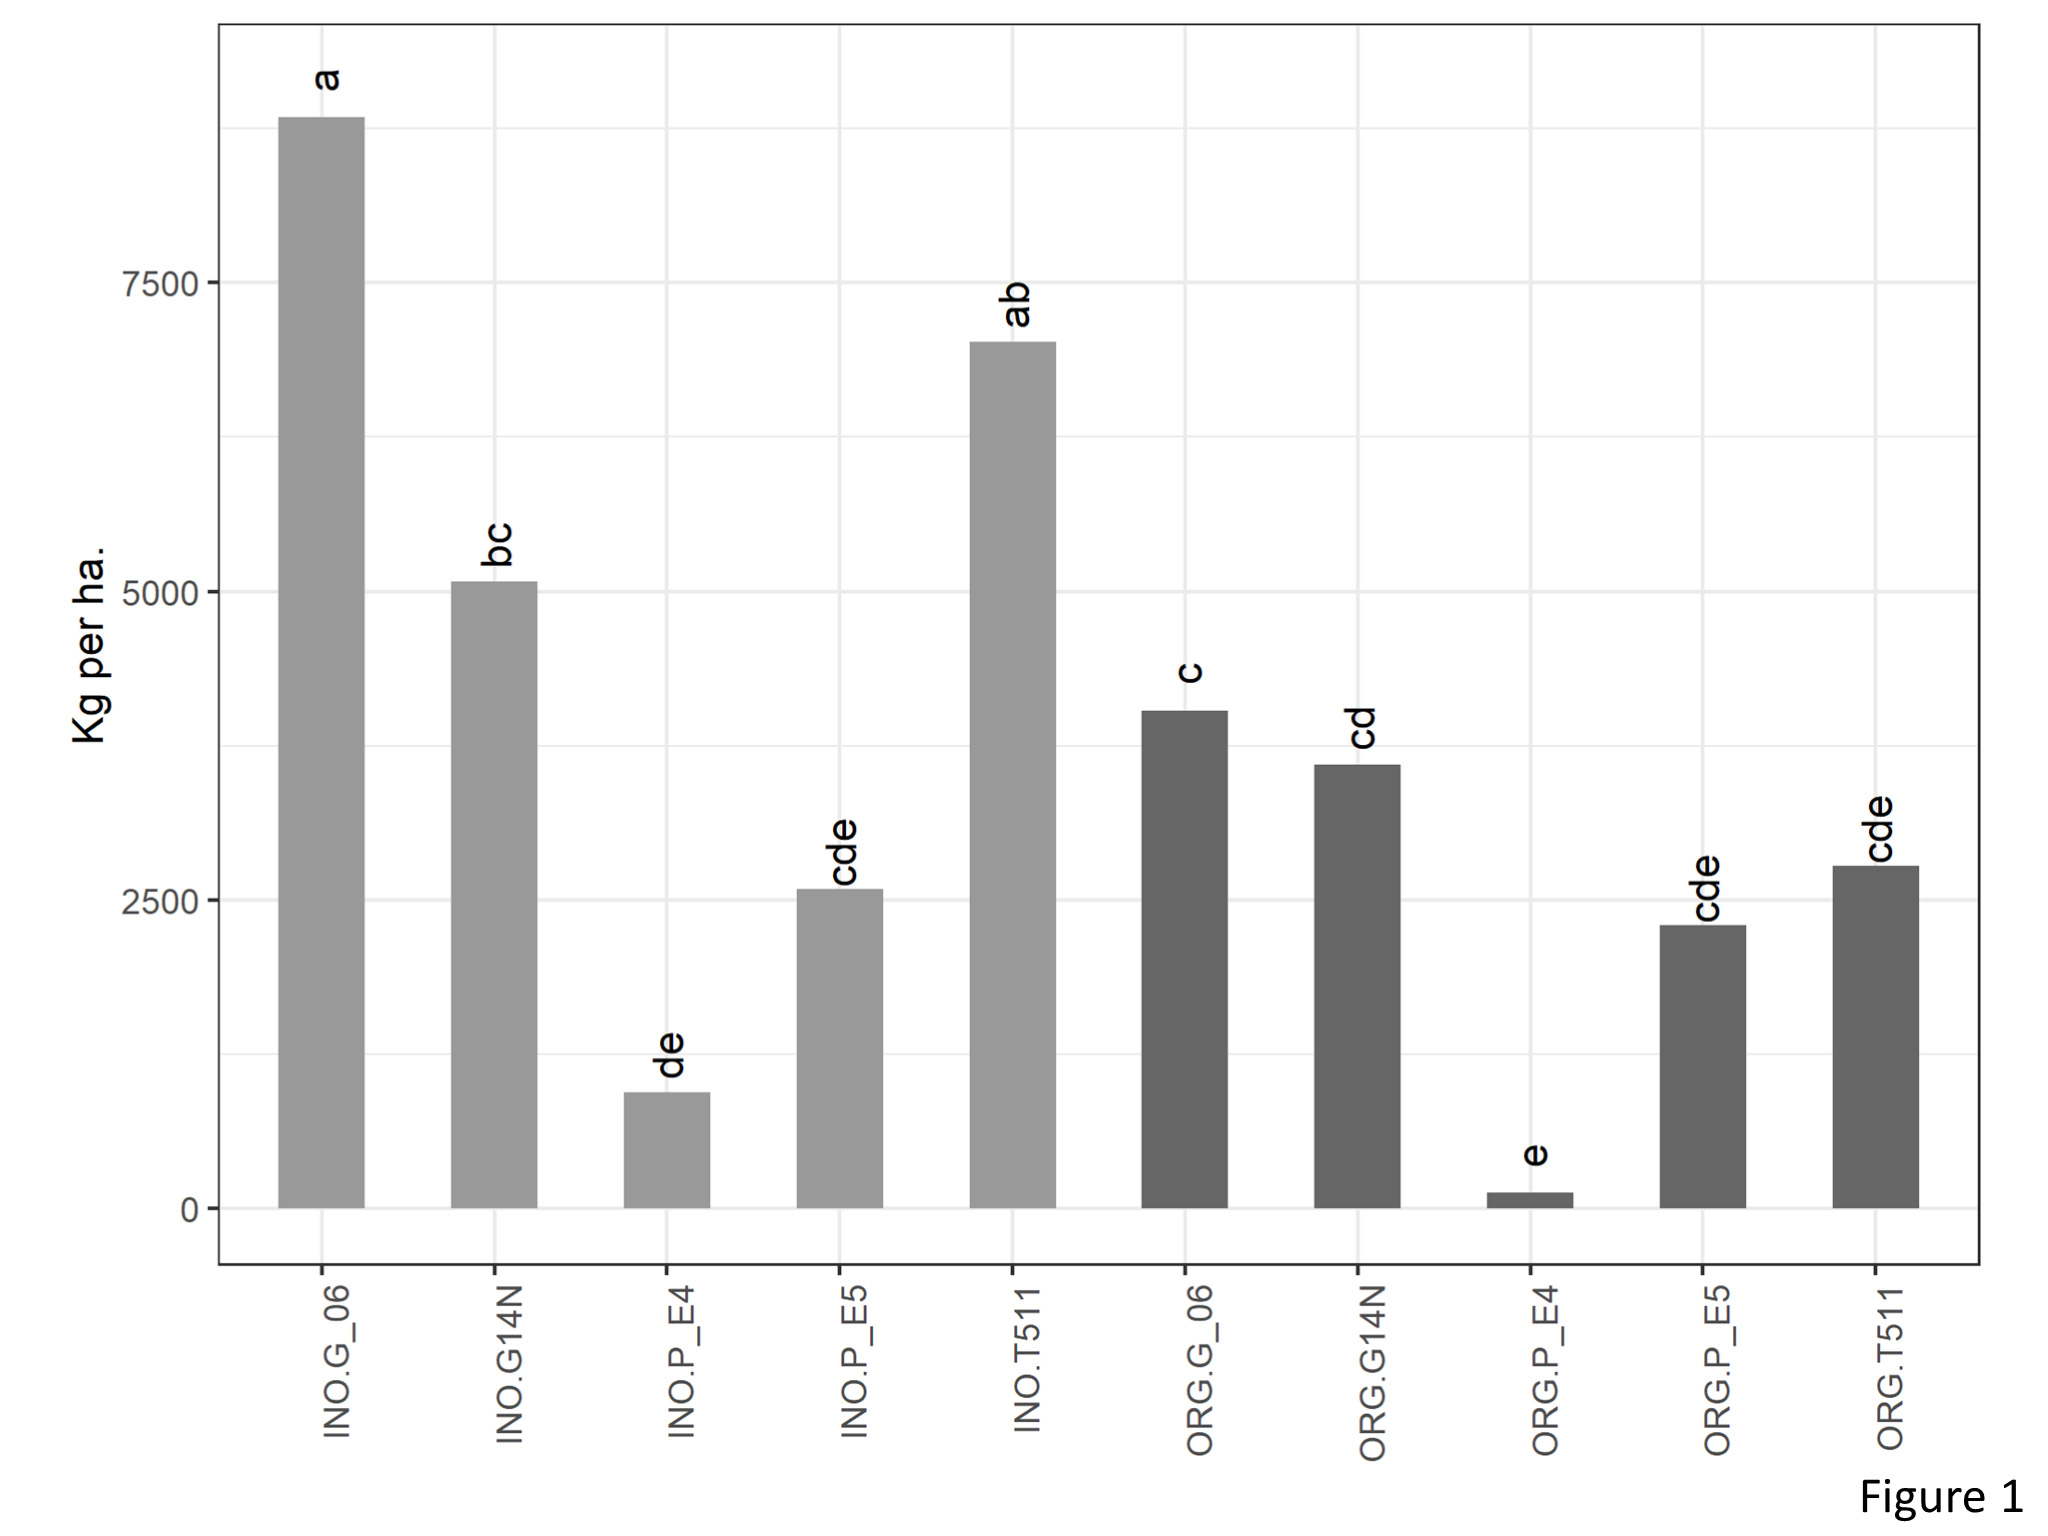
There was significant interaction between genotype and cultivation type for yield (kg per ha) (Figure 1). In the organic plots, yield of Georgia06 was significantly higher than E4 and at par with rest of the four genotypes. Interestingly, on the inorganic plots, yield of Georgia06 was at par with TUF511 and significantly higher than E4, E5, and Georgia14N.
Figure 1. Yield of peanuts (kg per ha) of different genotypes in the organic and inorganic plots. Different letters indicate significant differences between groups (p < 0.05)
Shoot mass
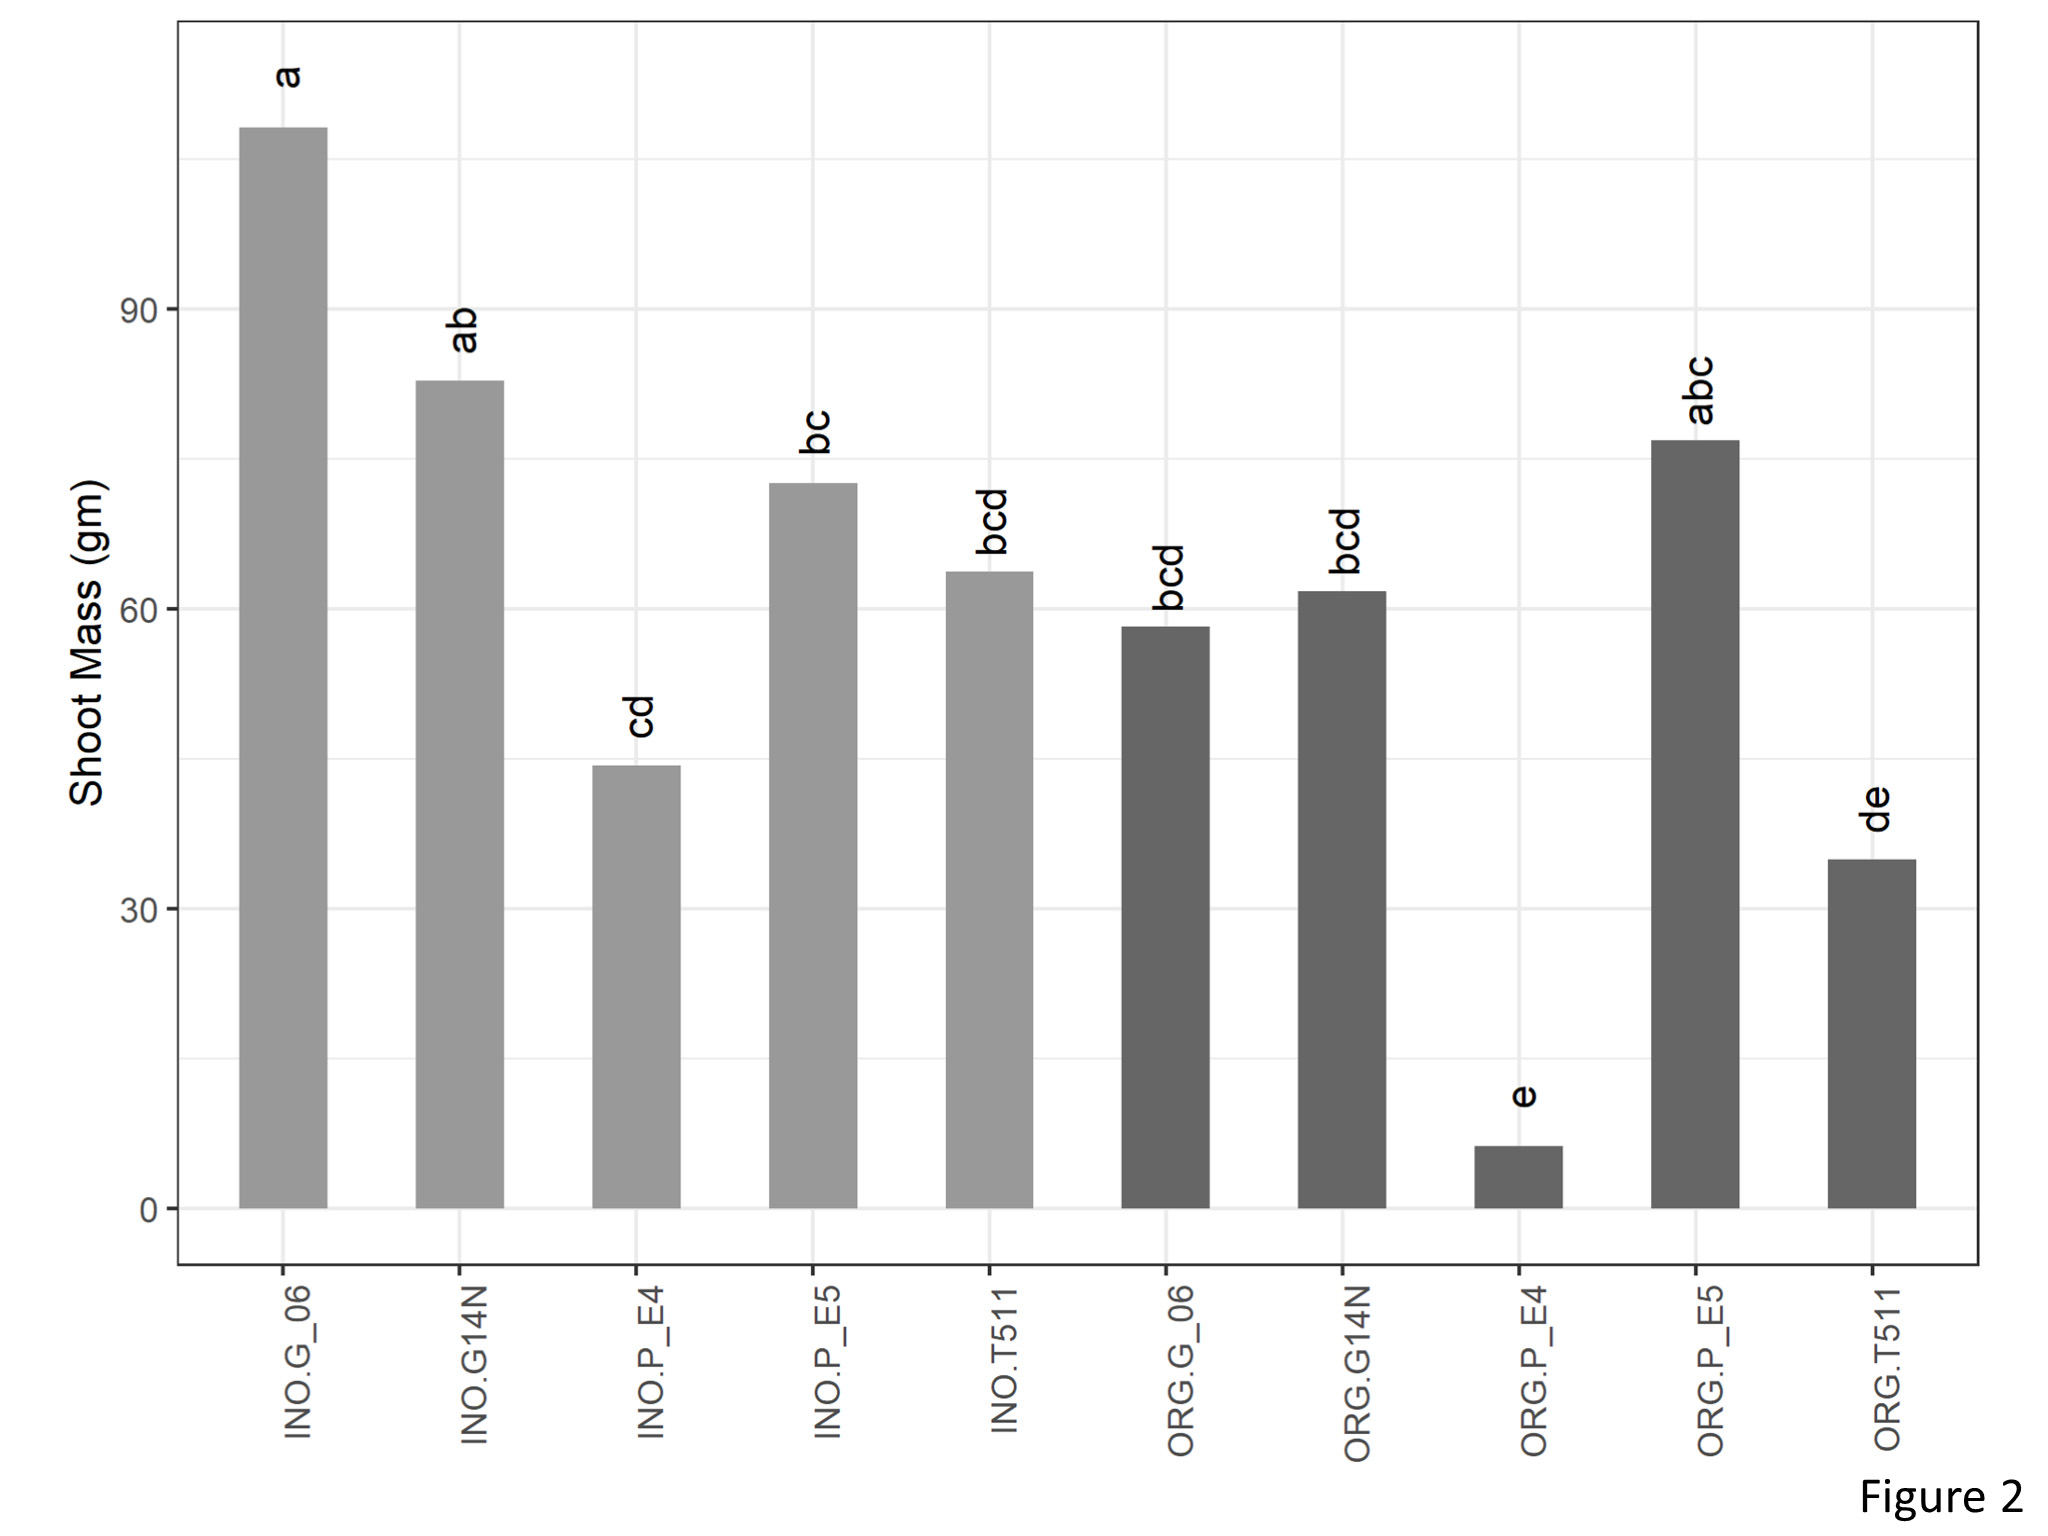
There was a significant interaction between cultivation type and genotype for shoot mass (Figure 2). In the organic plots, E4 and TUF511 had significantly lower shoot mass as compared to E5. There were no significant differences between the other genotypes. In the inorganic plots, Georgia 06 was at par with Gerogia14N and produced significantly higher shoot mass compared to E4, E5, and TUF511.
Figure 2. Shoot mass of peanuts (kg per ha) of different genotypes in the organic and inorganic plots. Different letters indicate significant differences between groups (p < 0.05)
Pod number
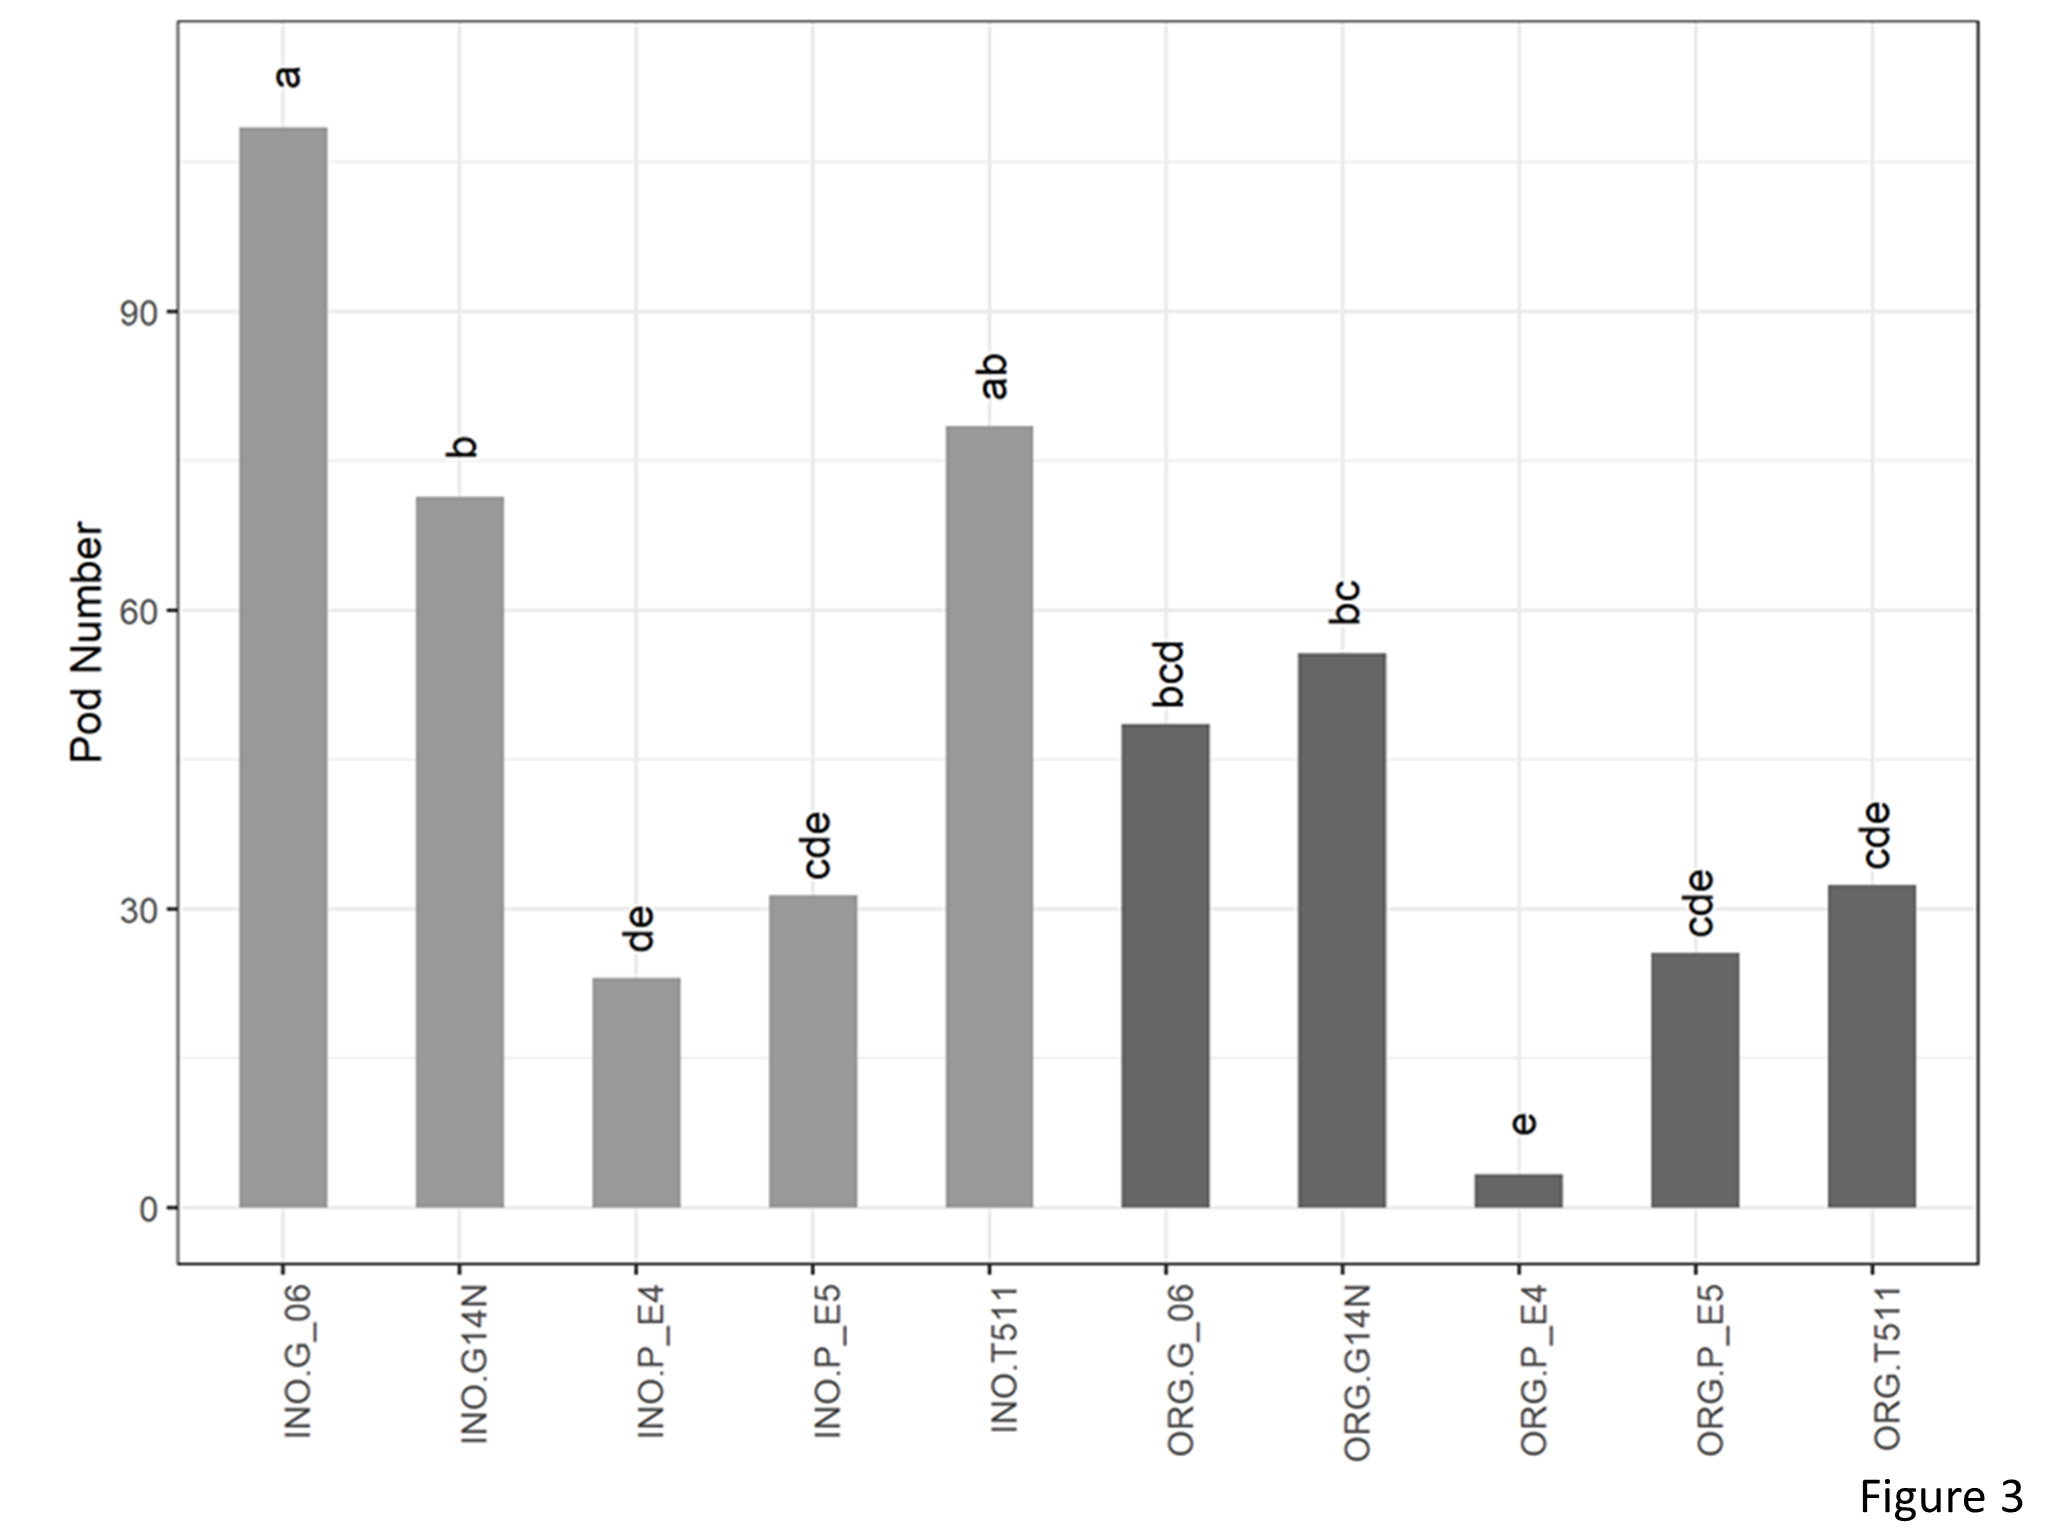
A significant interaction between cultivation and genotype was found for pod numbers (Figure 3). Number of pods in organic plot of E4 (3.38) was significantly lower than that of Georgia06 (48.63) and Georgia14N (55.71).
Figure 3. Pod number per plant of peanuts of different genotypes in the organic and inorganic plots. Different letters indicate significant differences between groups (p < 0.05)
Nodule number
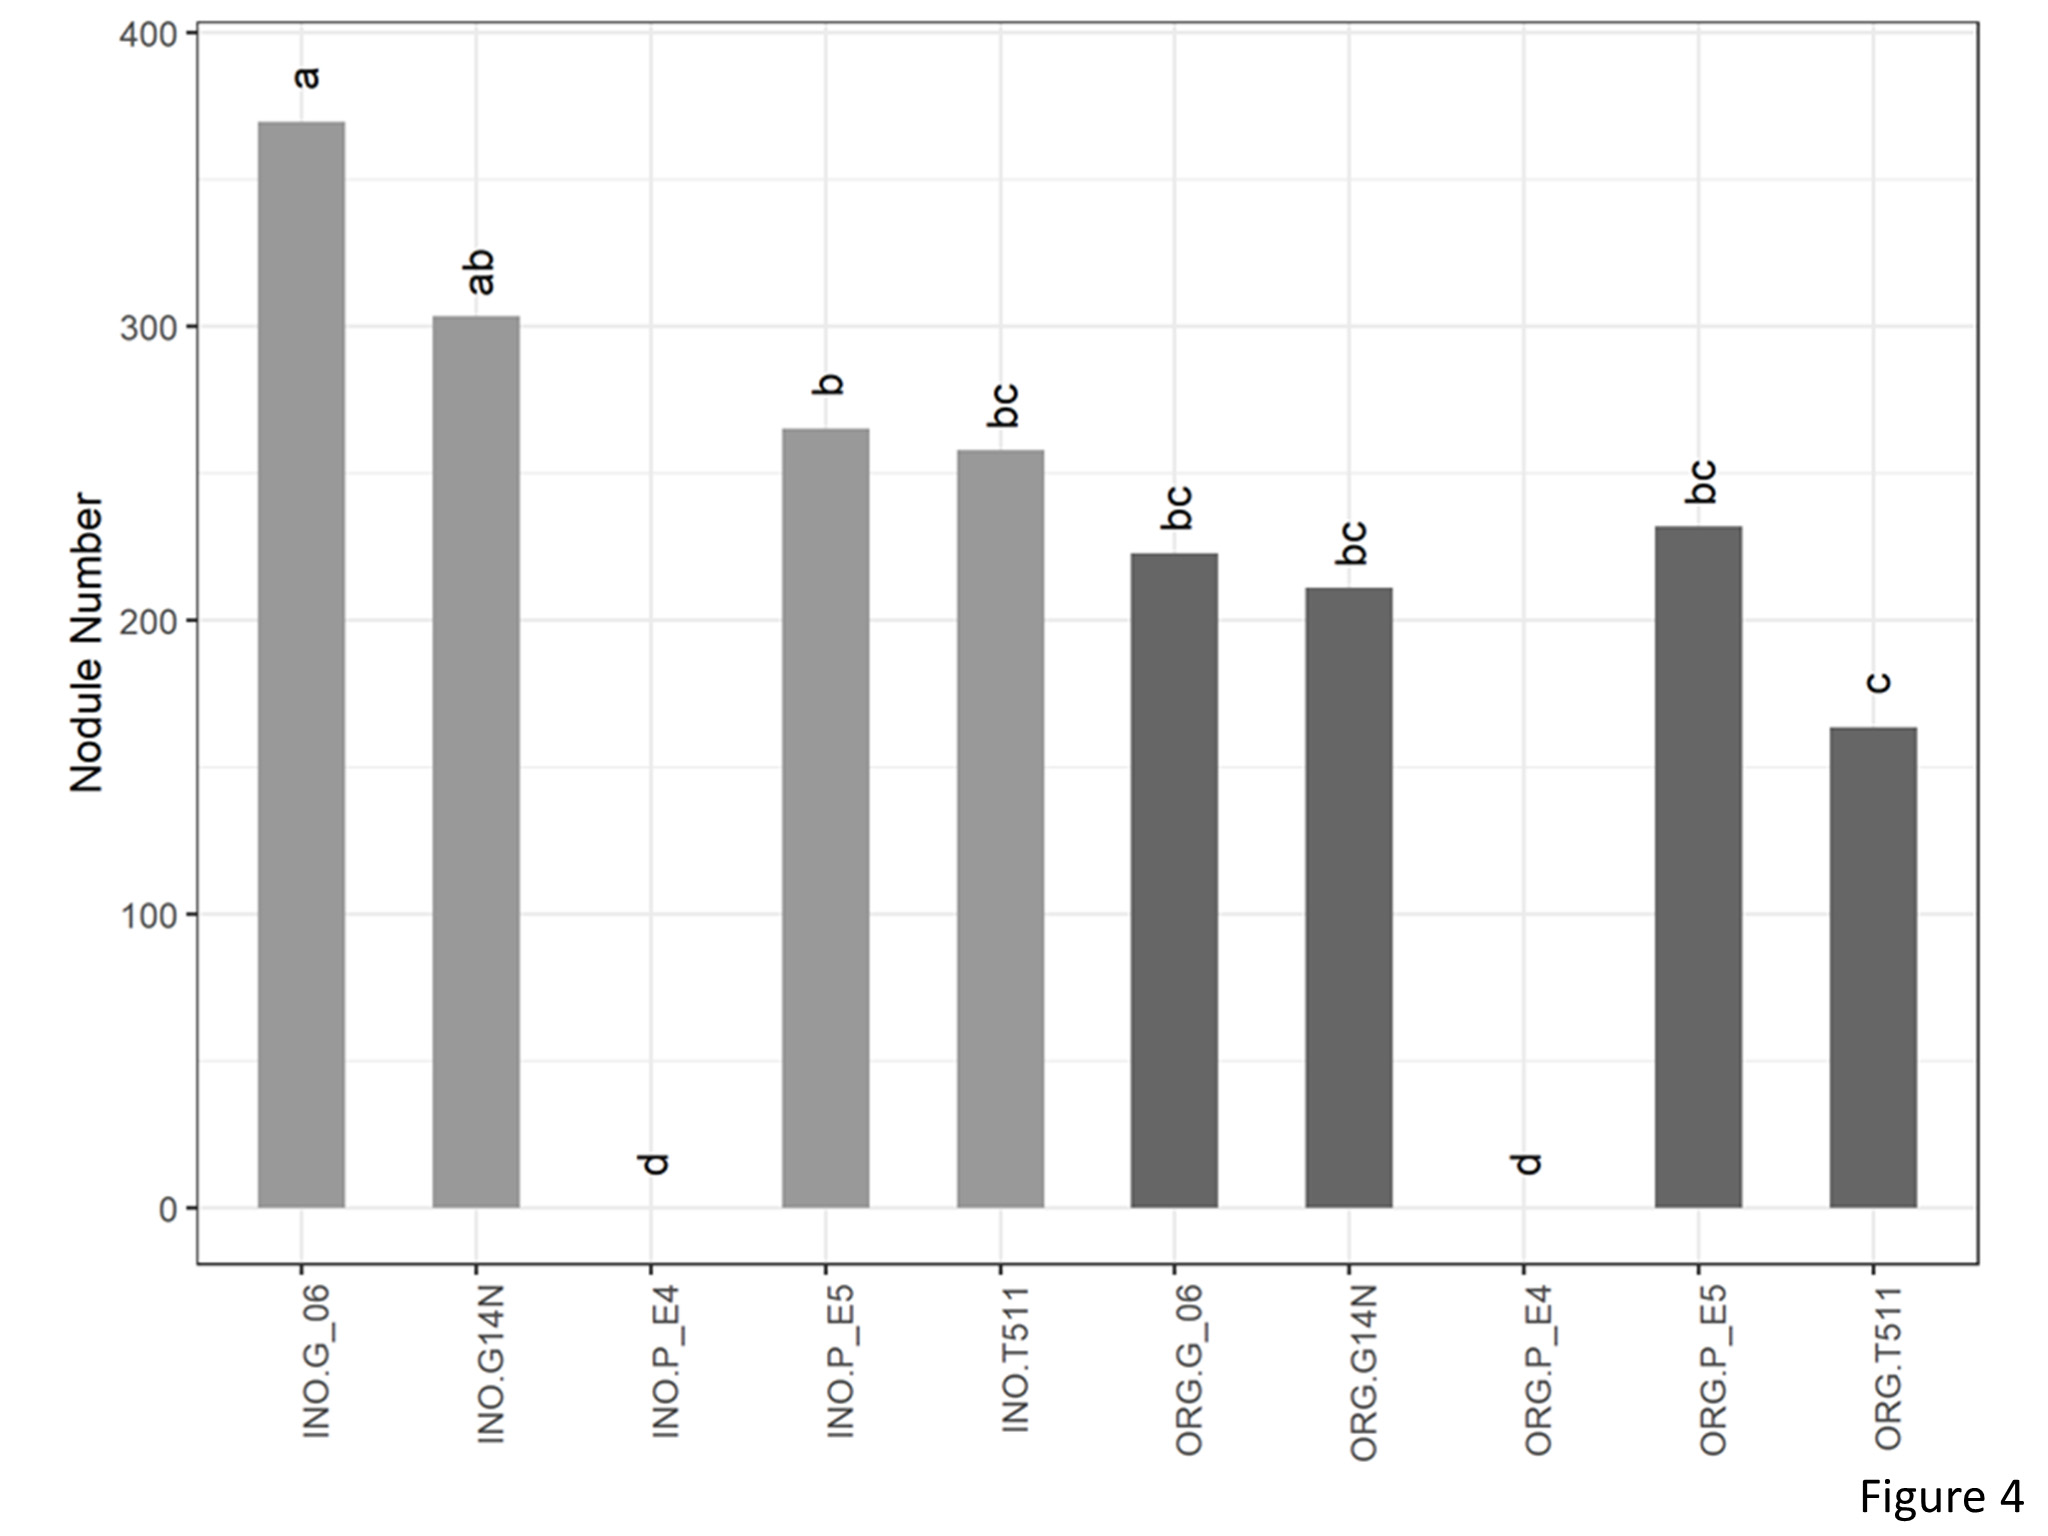
A significant interaction was seen between genotype and cultivation type for nodule number (Figure 4). In the organic plots, nodule number was significantly lower on E4 which is a non-nodulating type. However, there were no significant differences between the other four genotypes. In the inorganic plots, number of nodules were at par with Georgia14N and significantly higher than E4, E5, and TUF511.
Figure 4. Nodule number per plant of peanuts of different genotypes in the organic and inorganic plots. Different letters indicate significant differences between groups (p < 0.05)
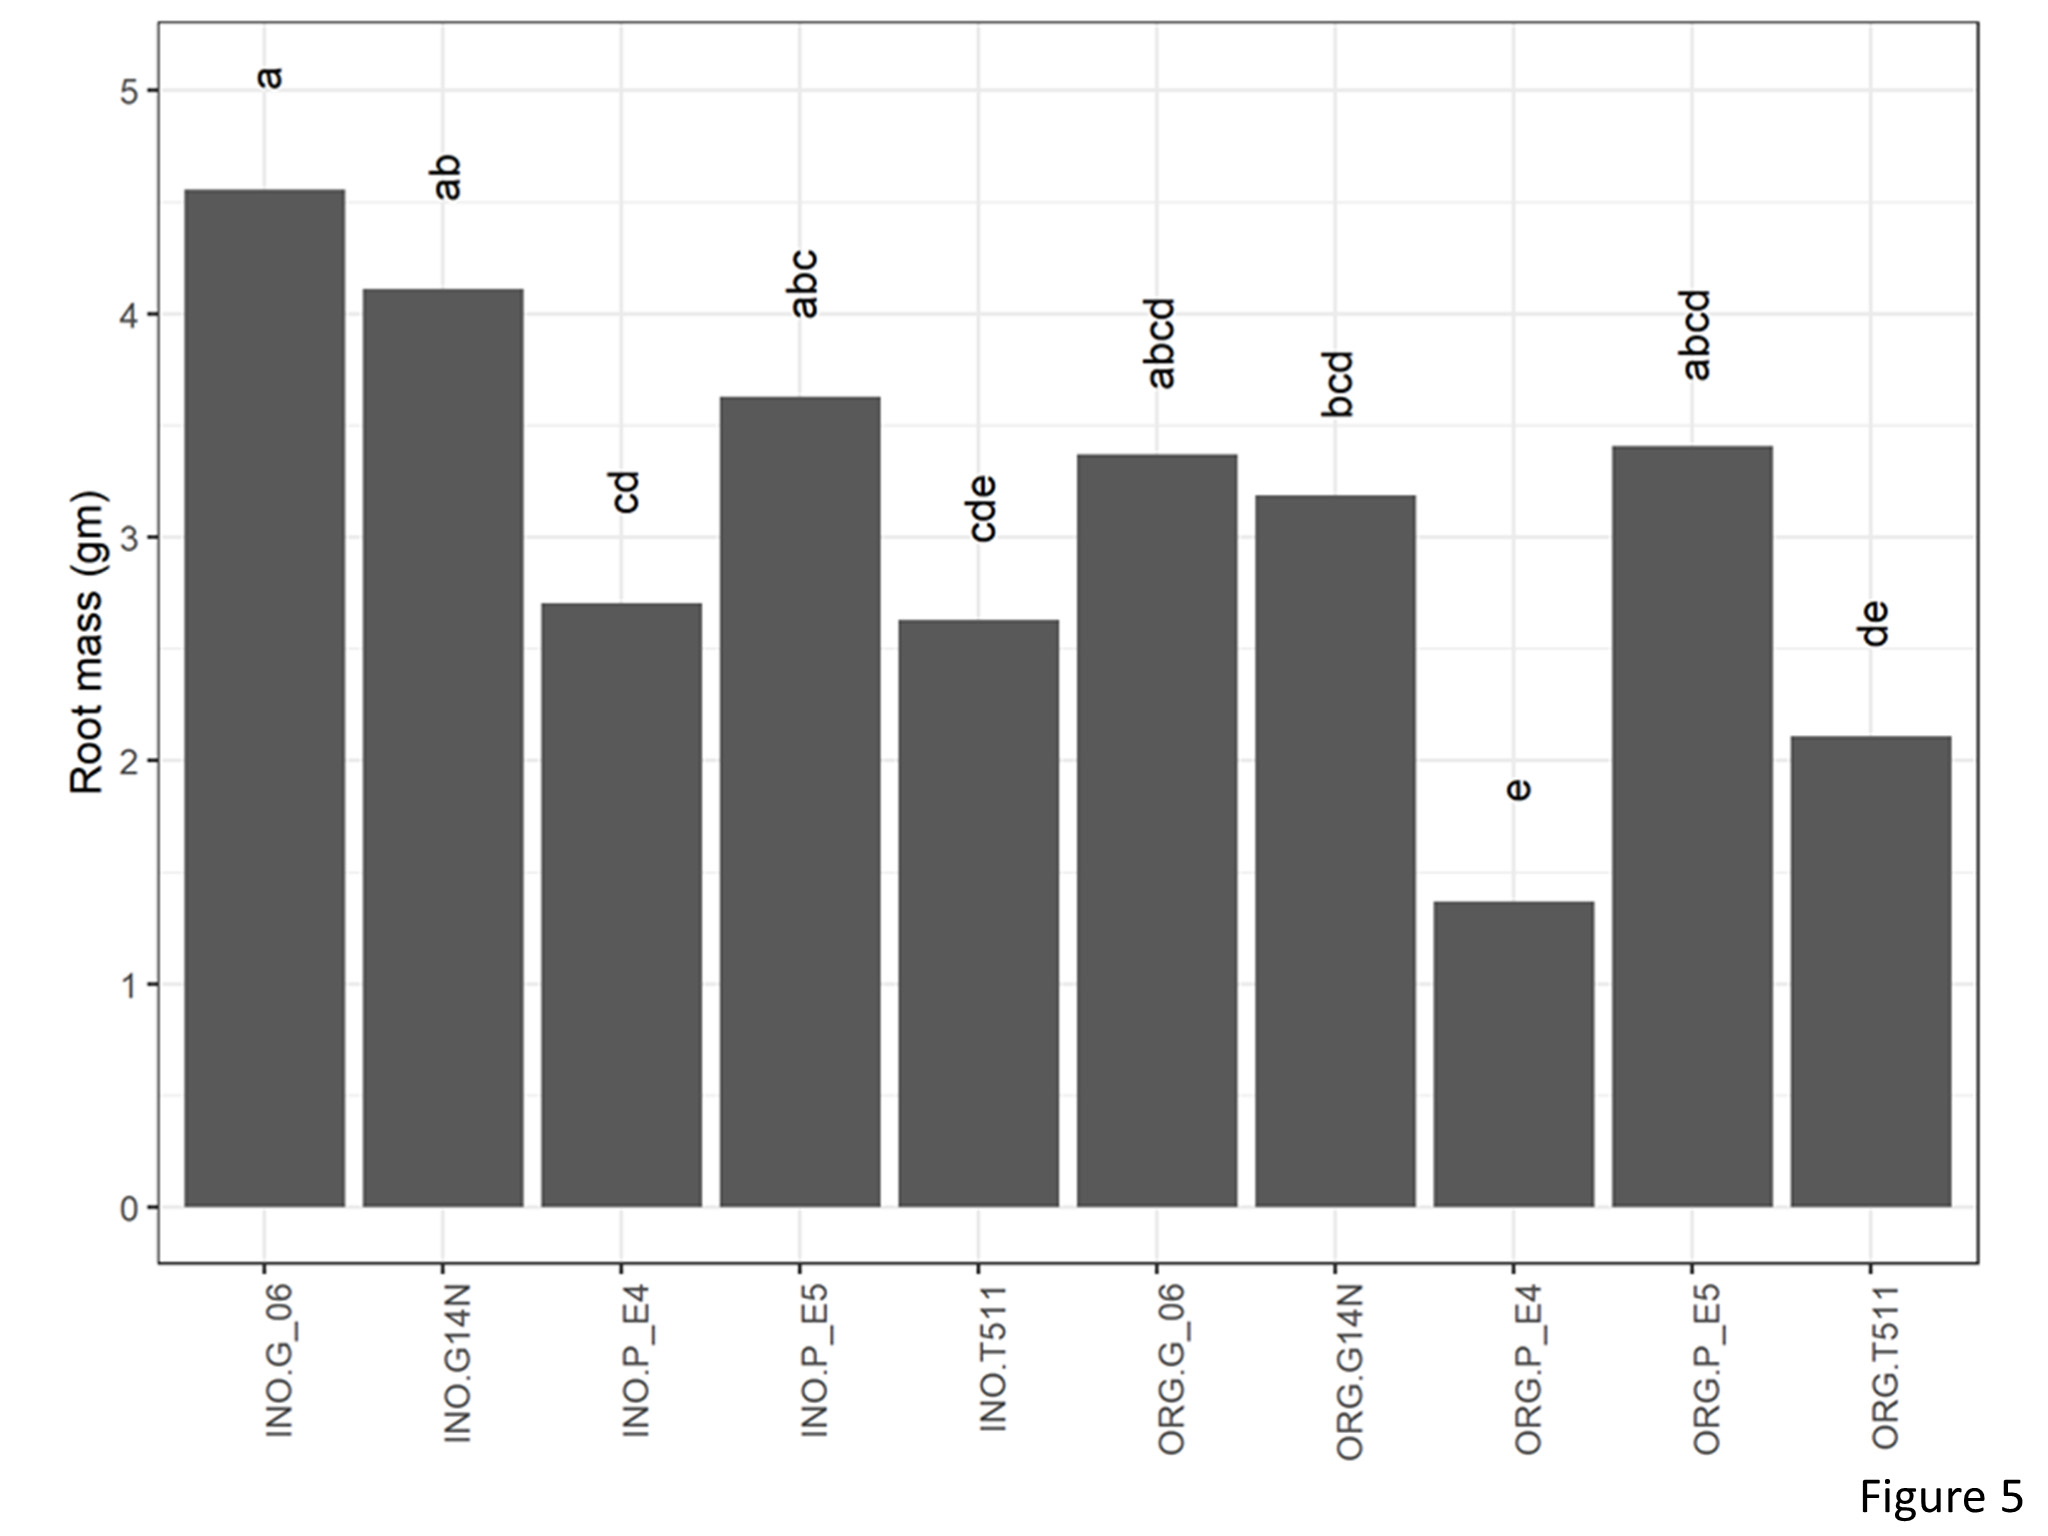
Rootmass
Signifiact differences for rootmass were seen for genotype and cultivation type (Figure 5). Root mass of Georgia06 were at par with Georgia14N and E5 and were significantly higher than E4 and TUF511. Root mass in the inorganic plots was significantly higher than that on the organic plots.
Figure 5. Root mass per plant of peanuts of different genotypes in the organic and inorganic plots. Different letters indicate significant differences between groups (p < 0.05)
SPAD
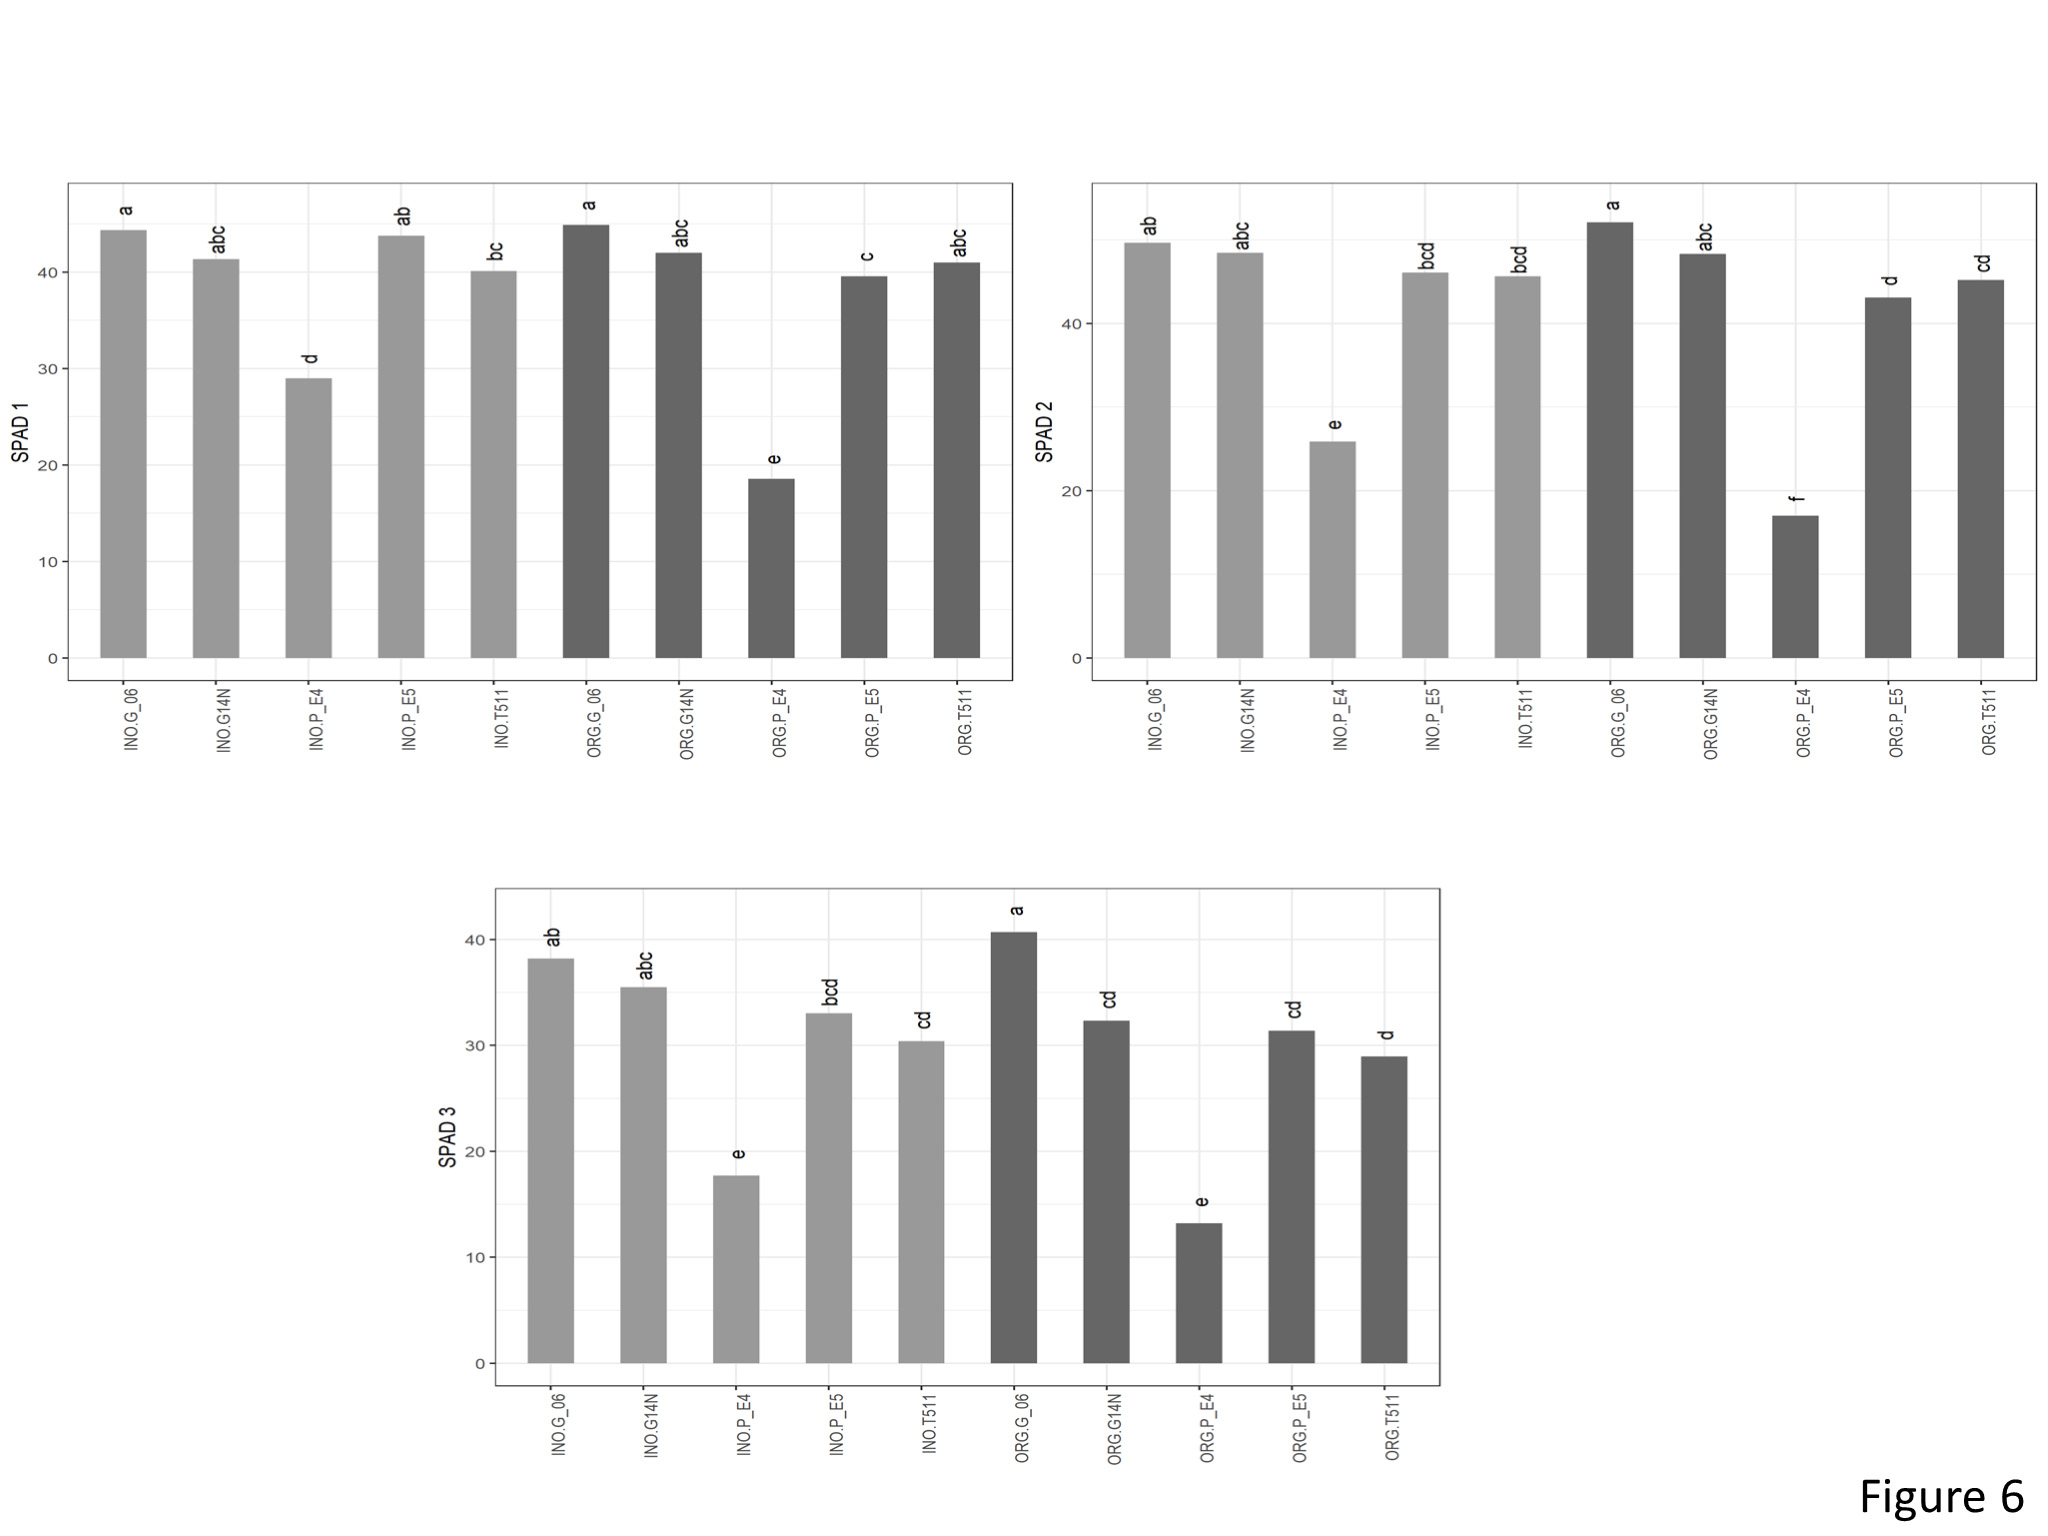
Significant interaction effect was seen between genotype and cultivation type for SPAD1 (Figure 6). In the inorganic plots, Georgia06 had highest SPAD values compared to E4 and E5 and was at par with Georgia14N and TUF511. In the inorganic plots, SPAD values for Georgia06 were at par with Georgia14N and E5 and significantly higher than E4 and TUF511. Similar interactions were seen with SPAD2. For SPAD3, the genotype main effect was significantly different. SPAD3 for Georgia06 was significantly higher than the other genotypes.
Figure 6. SPAD values of peanuts of different genotypes in the organic and inorganic plots. Different letters indicate significant differences between groups (p < 0.05)
Impact of microbial inoculants on the soil microbial community
Alpha diversity index
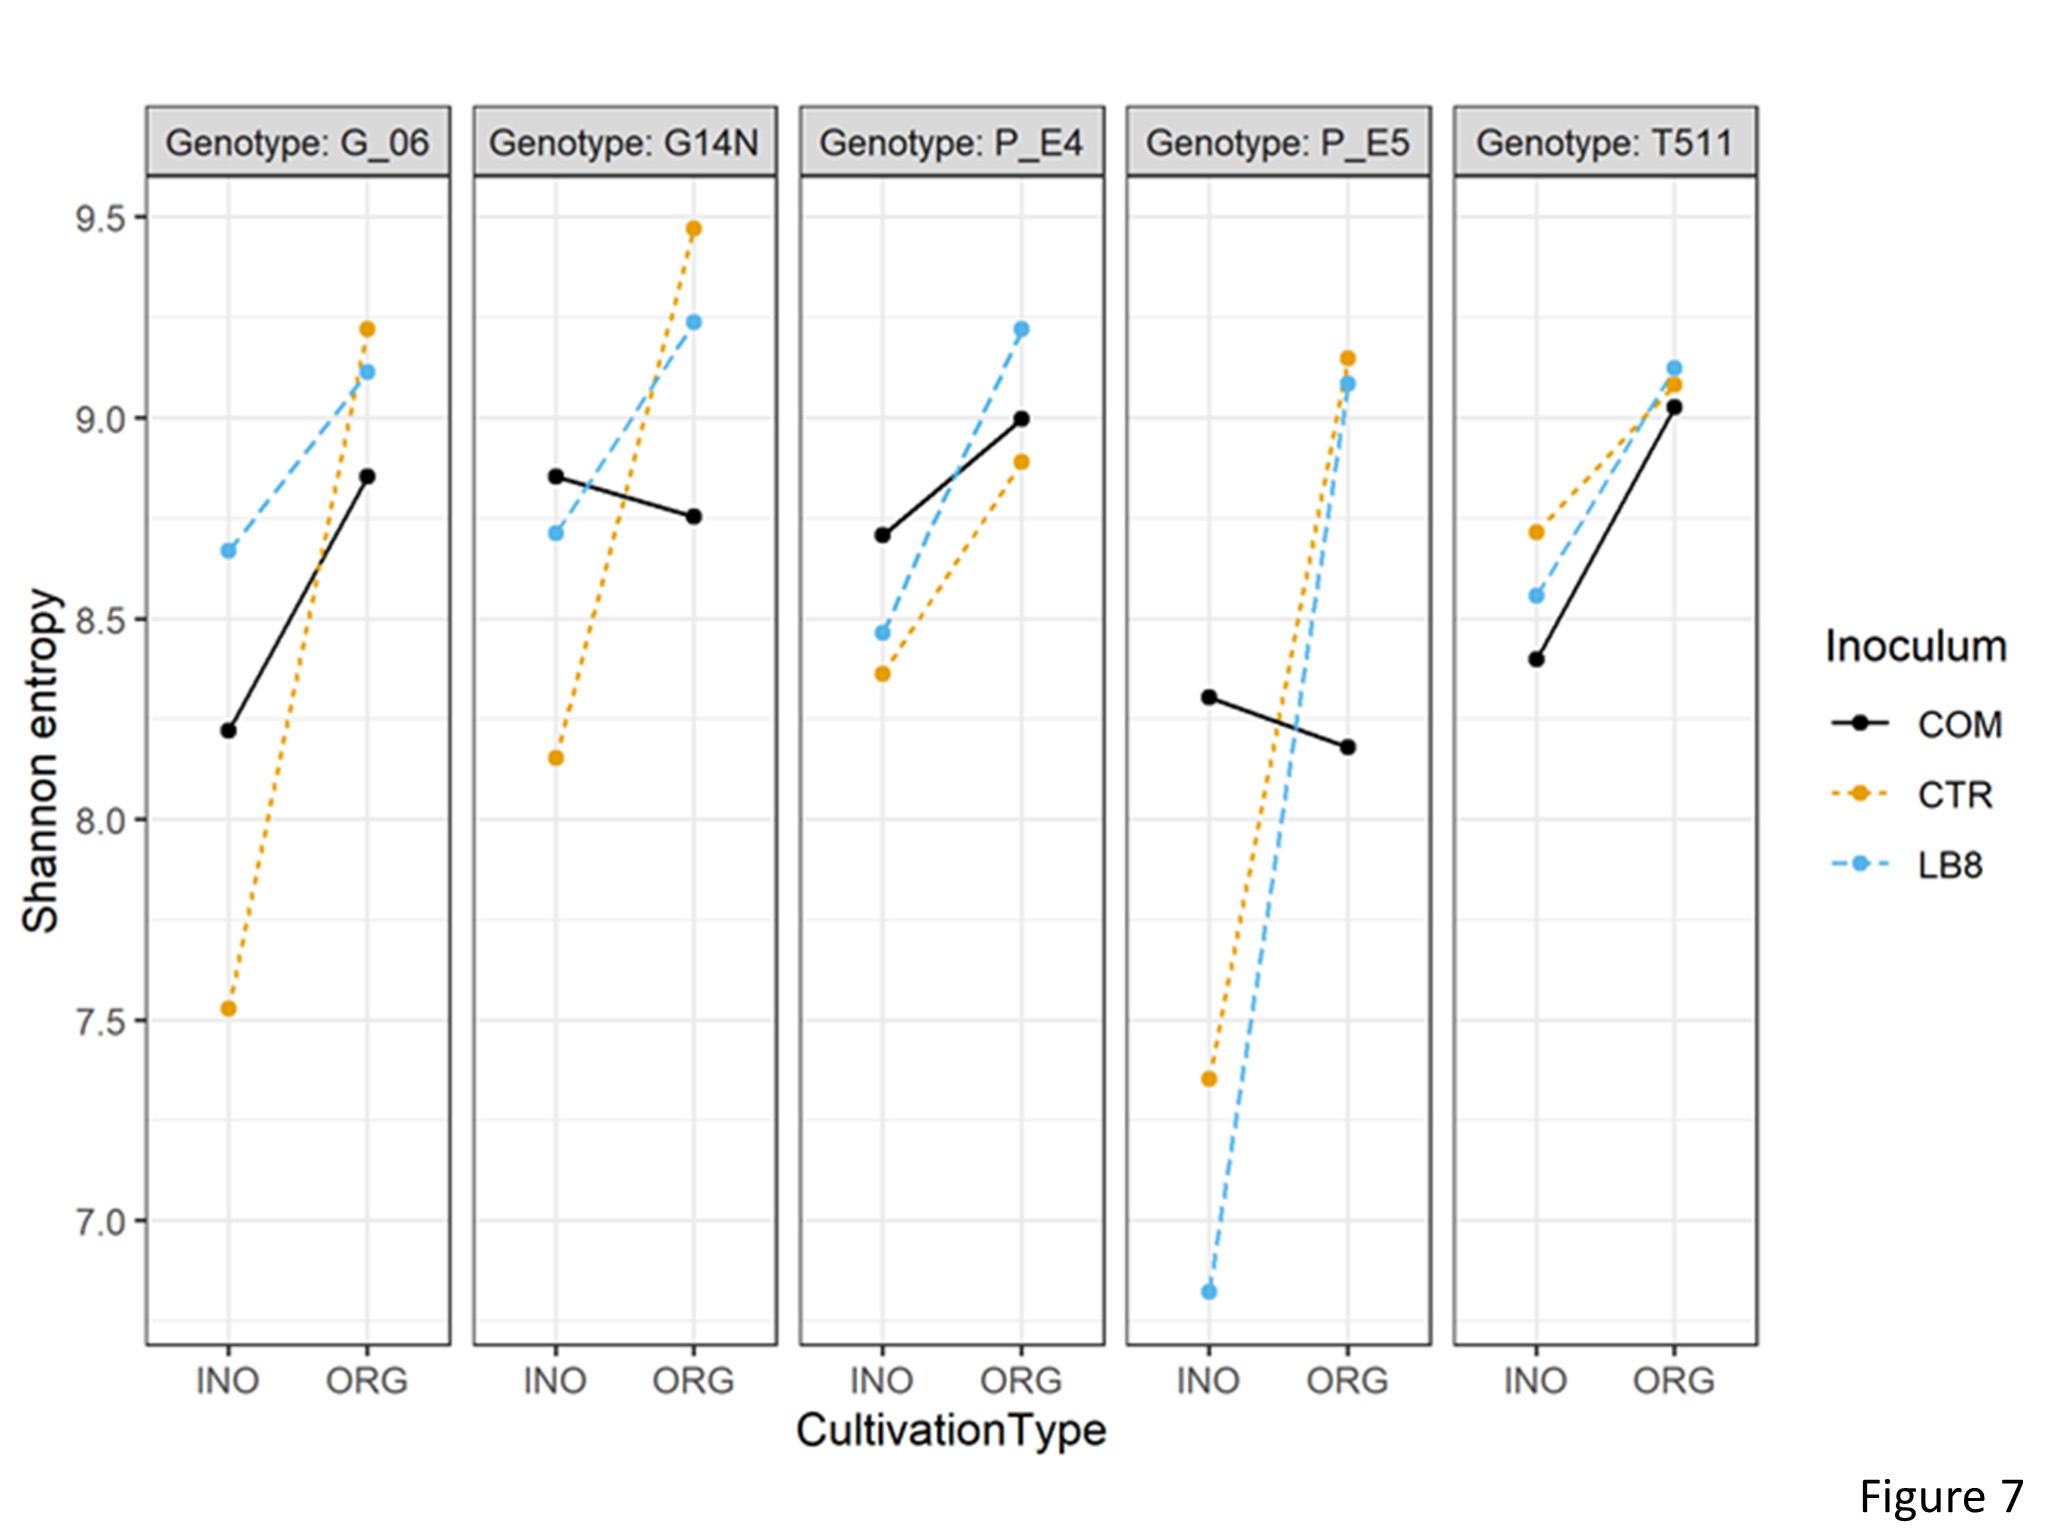
To understand the variations in the soil rhizobia, alpha diversity metrices were calculated on rarefied OTU tables for comparison groups based on cultivation type, inoculum, and genotype. The α metrics included Shannon entropy (community evenness or entropy) and pielou’s evenness within each comparison group. Statistically significant differences at adjusted p-value < 0.05 were determined using analysis of variance with alpha diversity as the response variable on the y-axis, and cultivation type, inoculum, and genotype as crossed predictor variables on the x-axis. 3 way interactions were significant between the cultivation type, inoculum, and genotype for both Shannon entropy and Pielou’s evenness. Shannon entropy was significantly lower in genotype E5 than Georgia14N while using LB8 inoculum in inorganic plots (Figure 7). Similarly, Shannon entropy was significantly lower in inorganic plots as compared to organic plots for E5 while using LB8.
Figure 7. Interaction plot of Shannon entropy of different genotypes in the organic and inorganic plots for different inoculums.
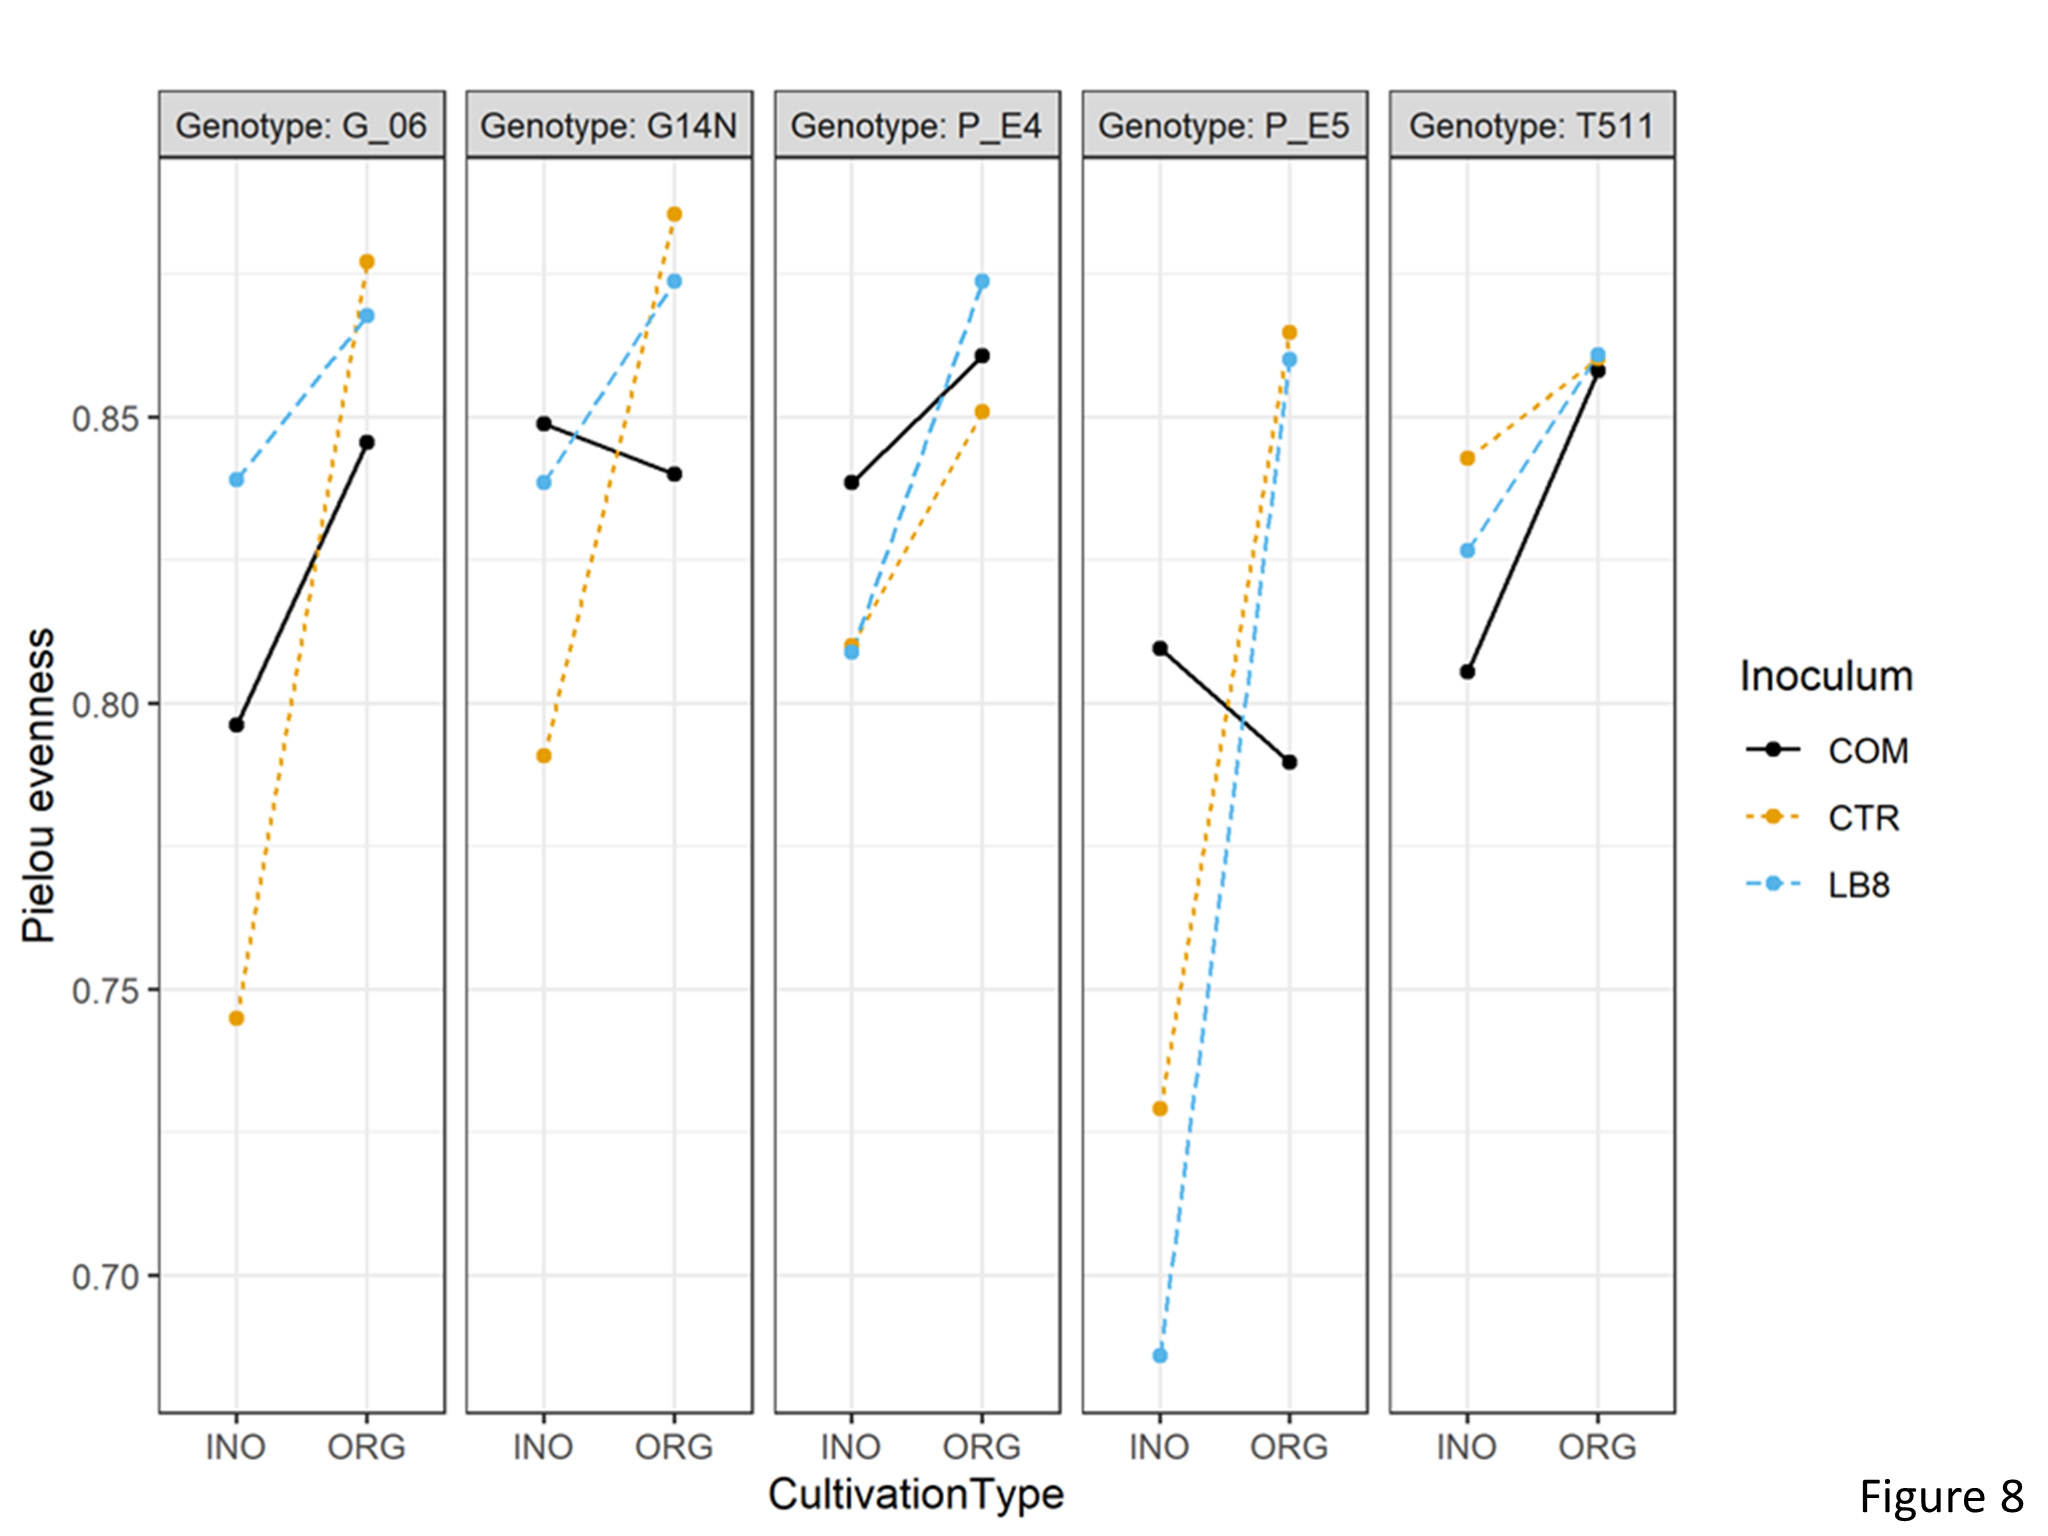
Three way interactions were significant for pielou’s evenness. Pielou’s evenness was significantly lower in inorganic plots as compared to organic plots for E5 while using LB8 suggesting that inorganic practice had the presence of a dominant species in this sample (Figure 8).
Figure 8. Interaction plot of Pielou’s evenness of different genotypes in the organic and inorganic plots for different inoculums.
Beta diversity
Beta diversity analysis for determining the differences between microbial communities showed that the first two principal components were able to explain 58% of the total variation (Figure 9). Samples were clustered according to the cultivation practice.
Figure 9. Plot of PCoA using the weighted UniFrac as distance.
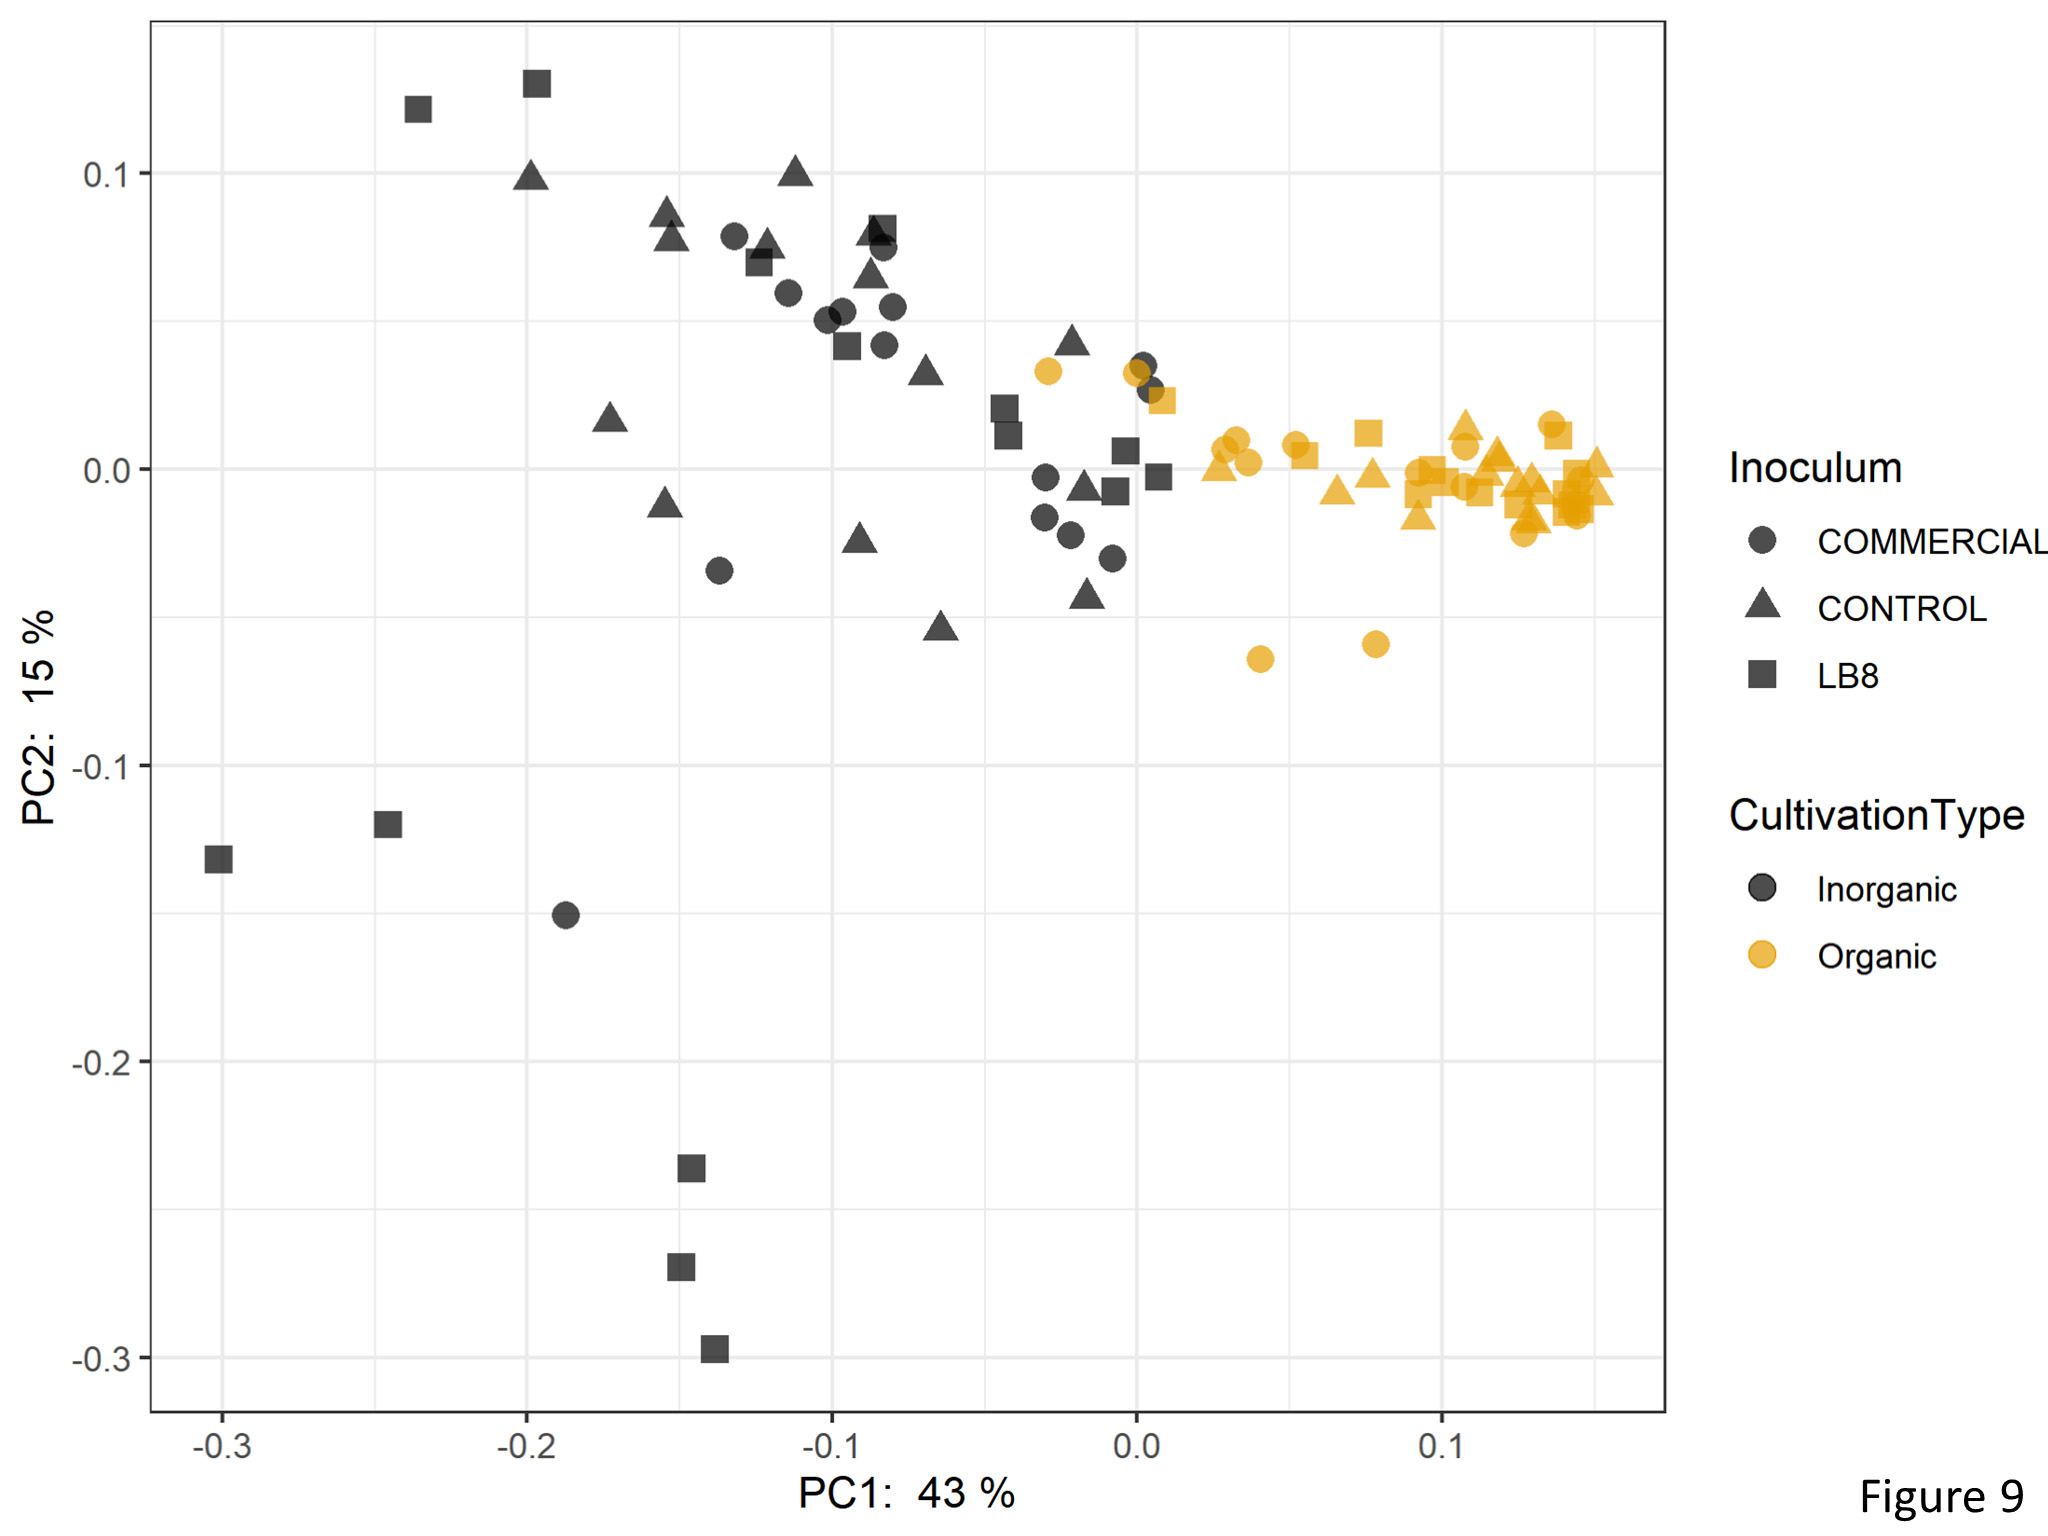
PermANOVA
In a permutational multivariate analysis of variance (PERMANOVA) based on the Bray-Curtis dissimilarity matrix identified cultivation type, inoculum, and genotype as factors explaining the variation in the bacterial community. The percentage of variation explained by cultivation type was higher (5%) than that for inoculum (4%) and genotype (2%).
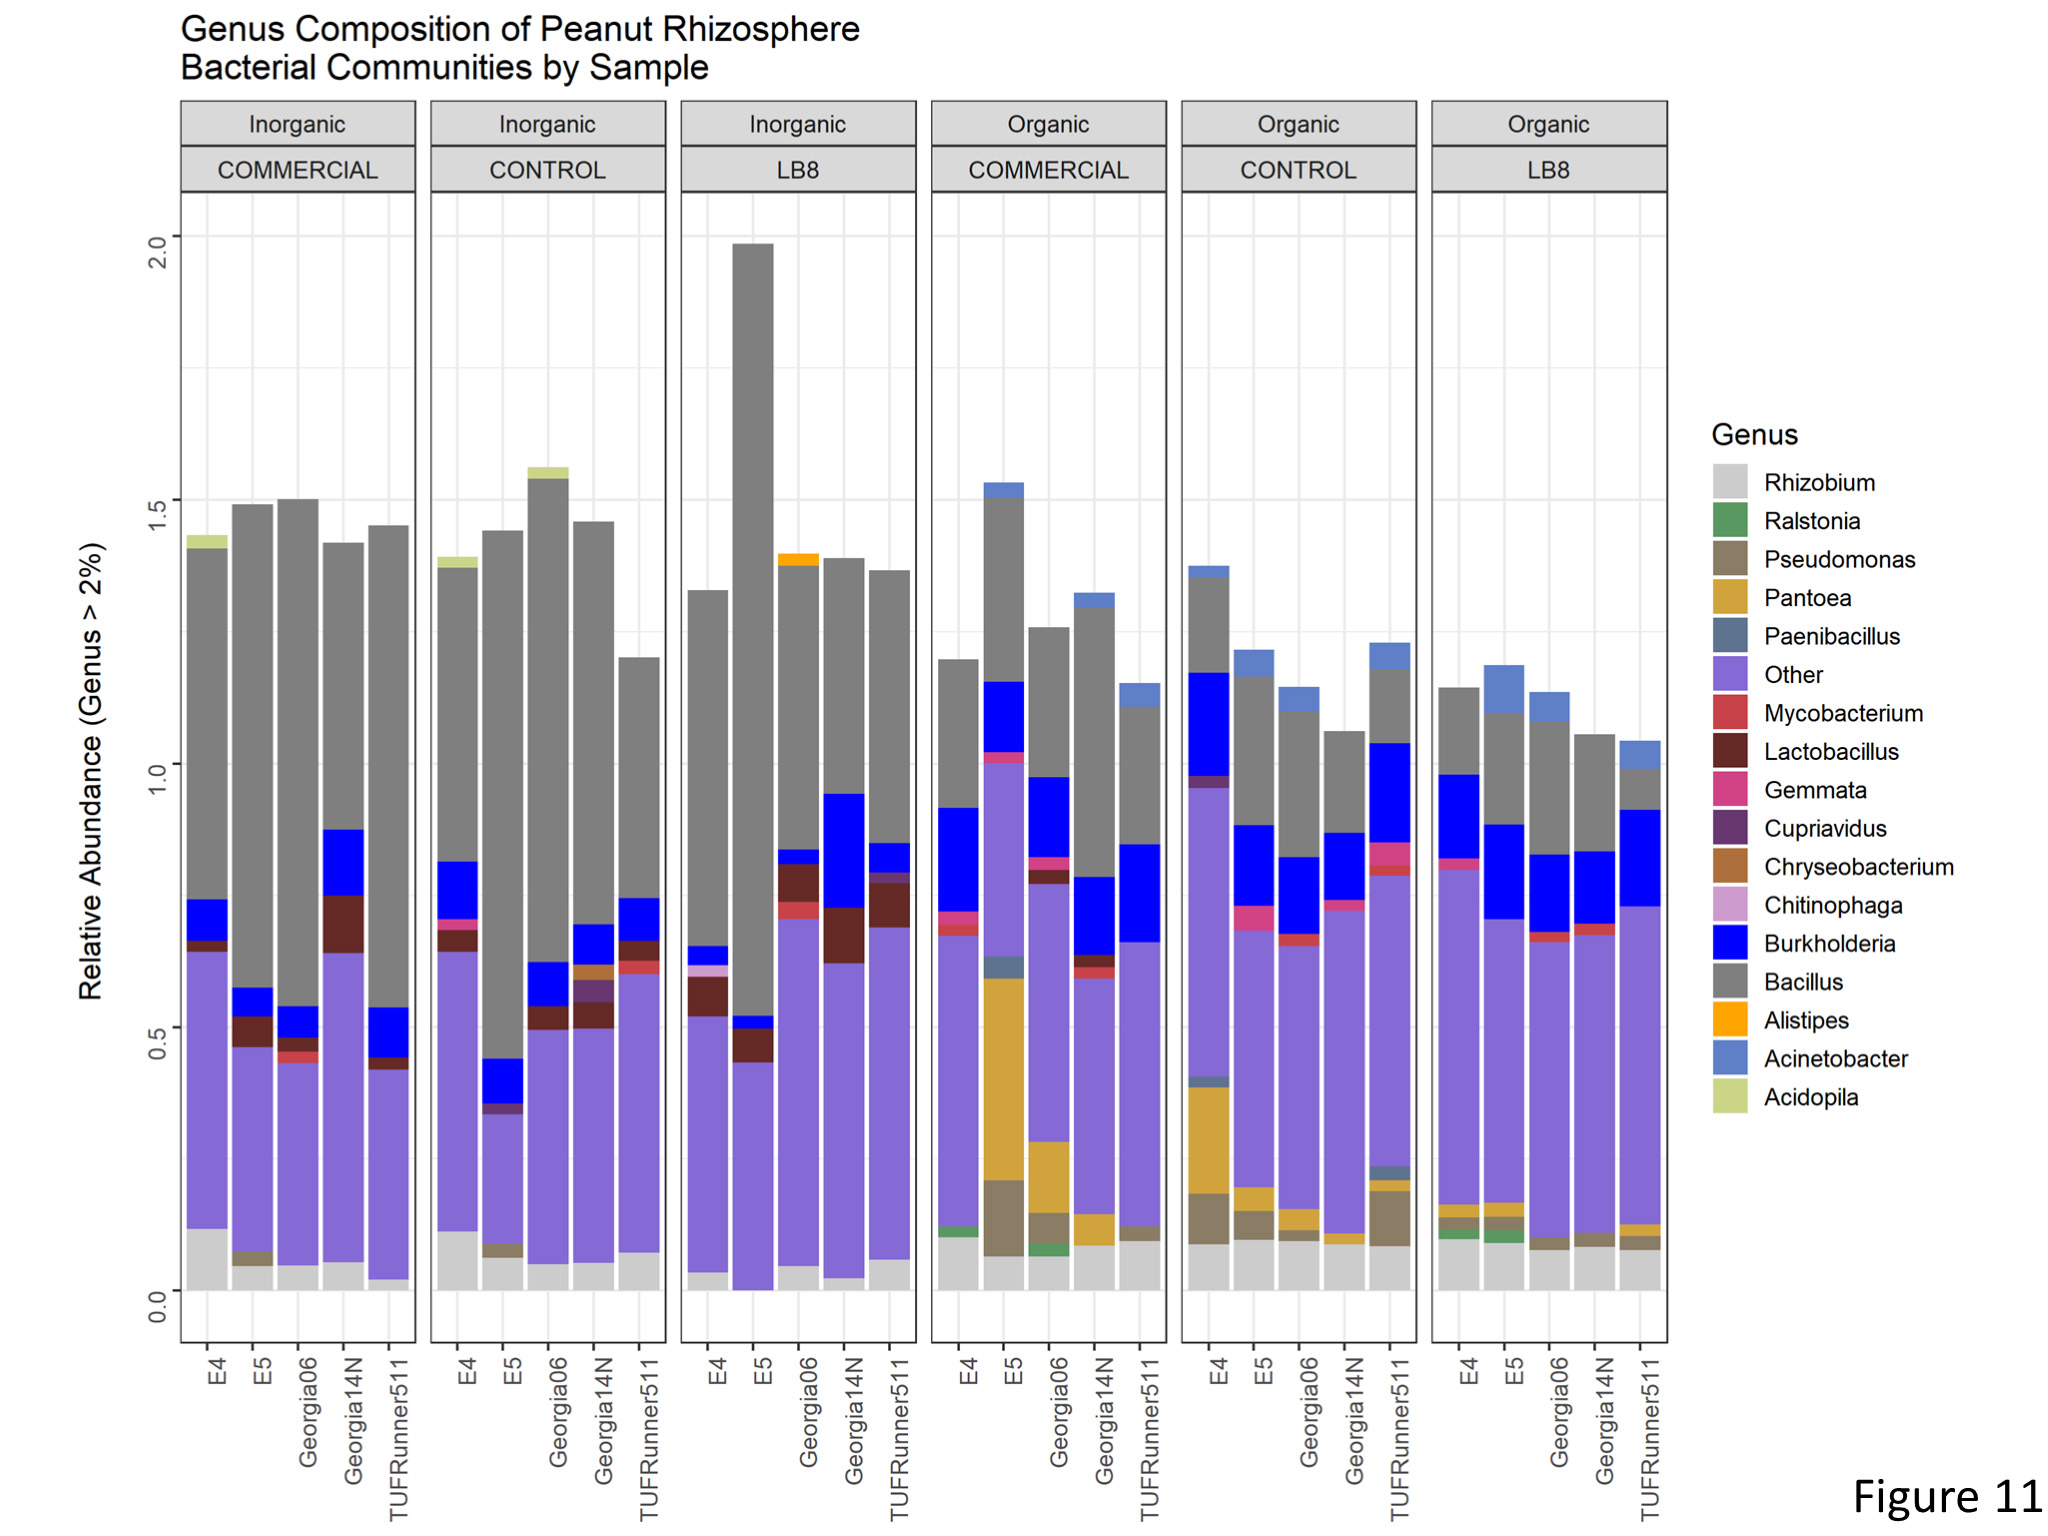
Taxonomy barplots
Bacterial diversity and community composition in the peanut rhizosphere differed among the cultivation practice. The relative frequency of Firmicutes significantly decreased on the organic treatment (Figure 10), and this was largely attributed to species from the genus Bacillus (Figure 11). This was compensated by an increase in the relative frequency of Roteobacteria.
Figure 10. Phylum composition of peanut rhizosphere
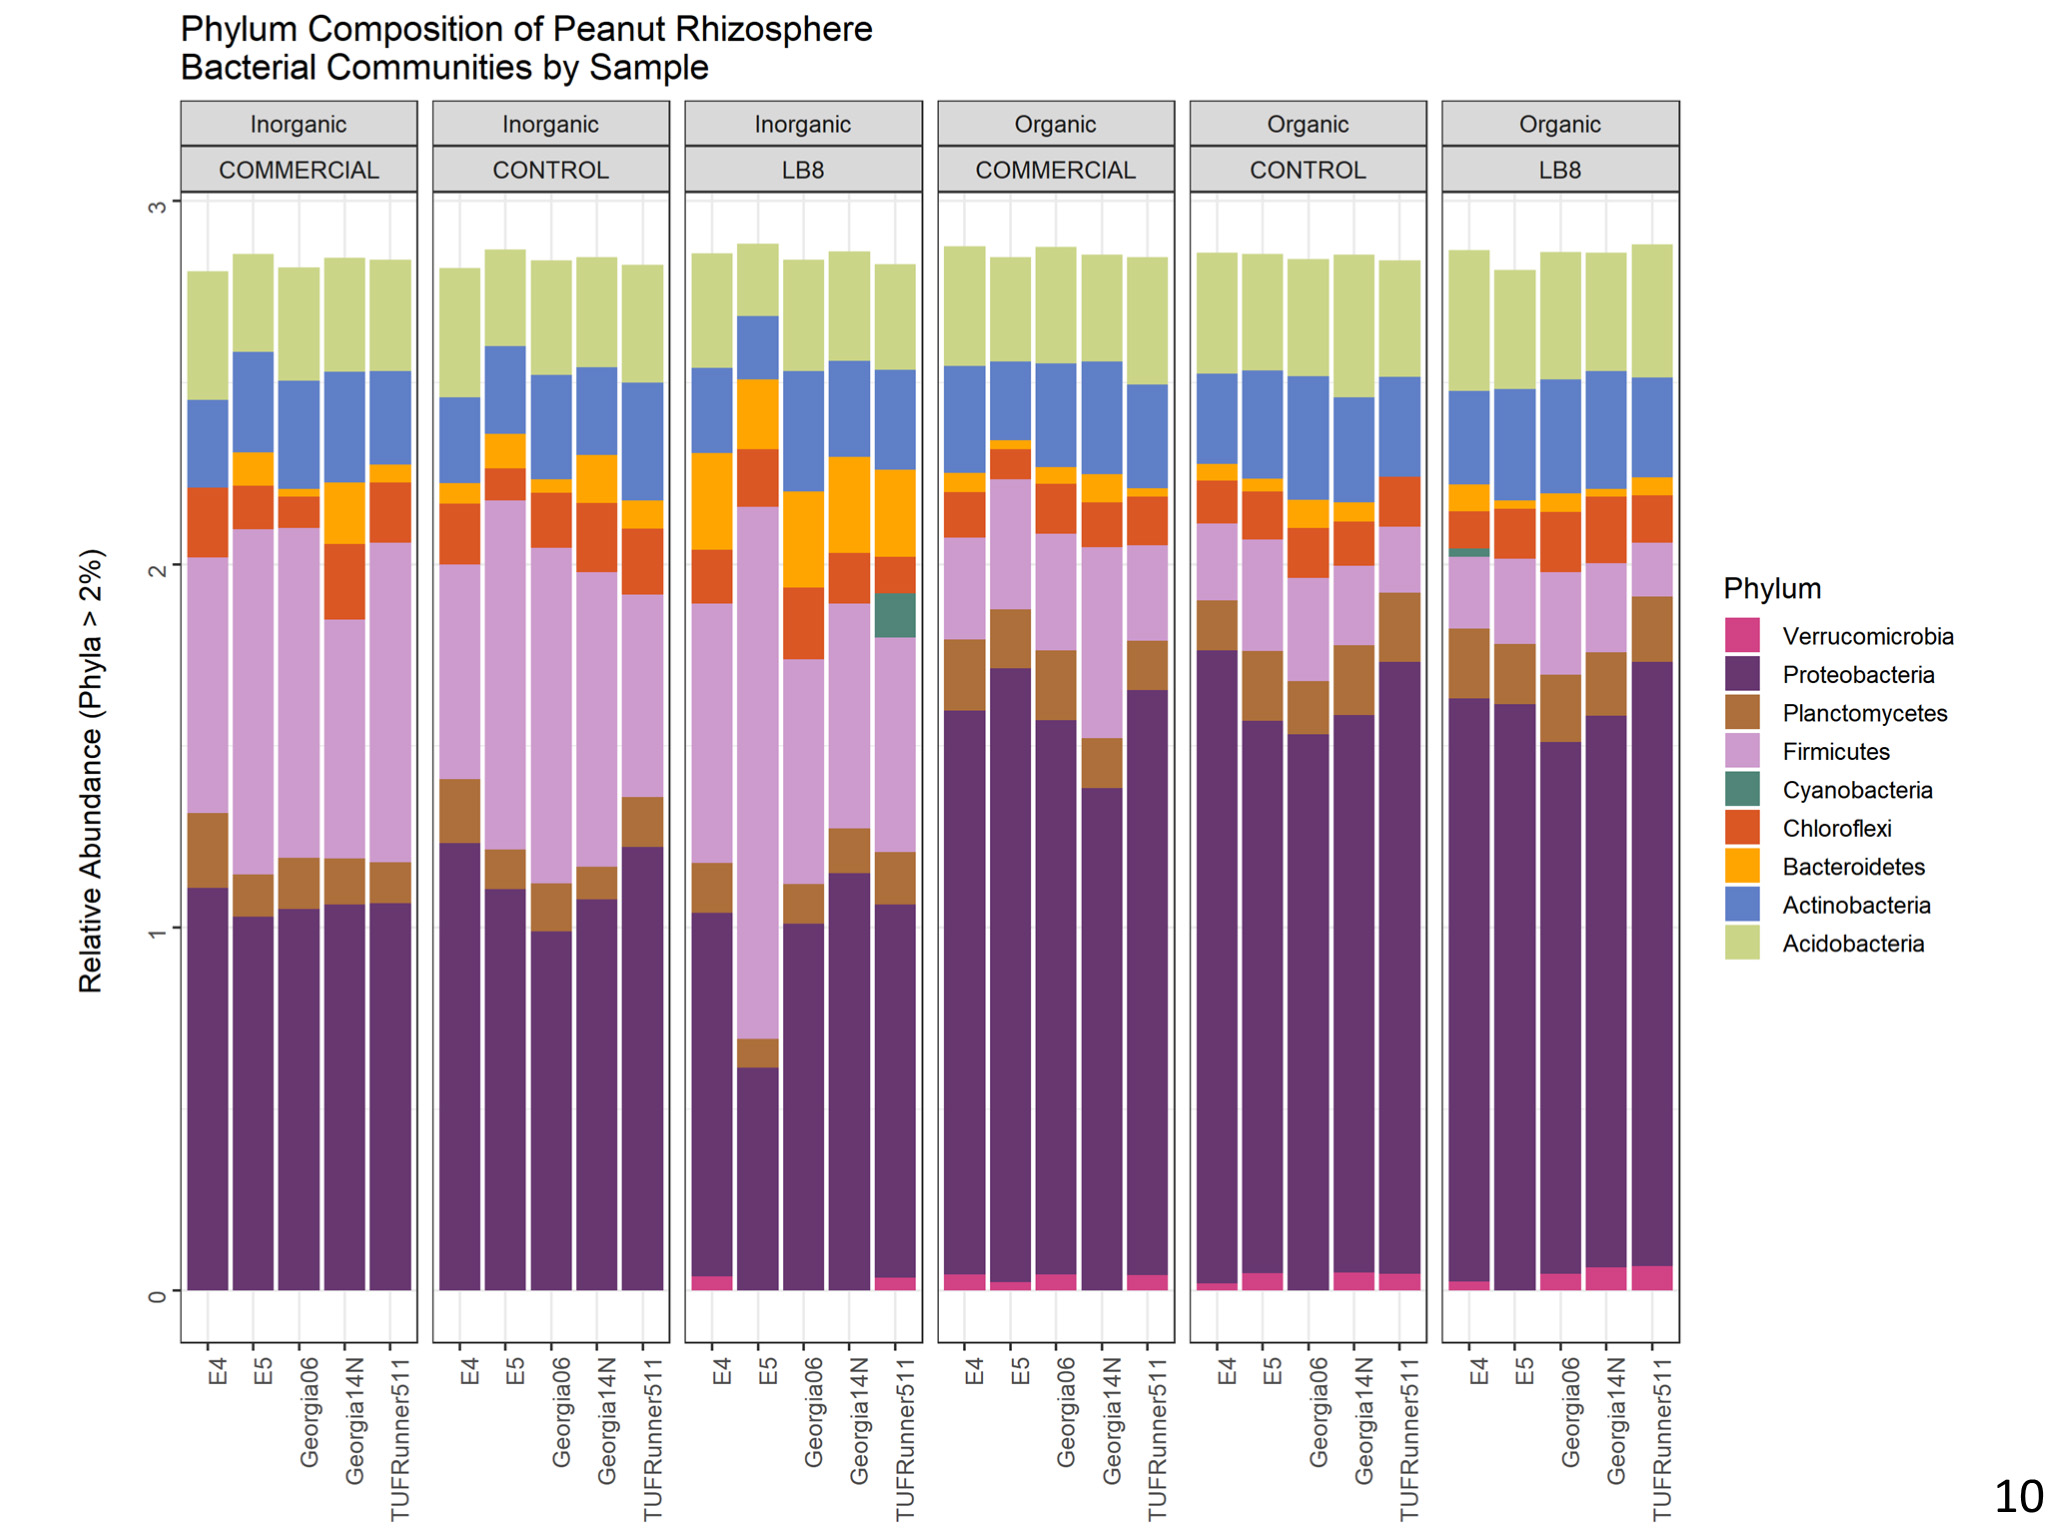
Figure 11. Genus composition of peanut rhizosphere
Conclusion
Our results showed that yield was significantly higher for inorganic cultivation practice as compared to organic cultivation practice for most of the genotypes evaluated. Significant interactions between cultivation type and genotype were observed for most of the variables suggesting that they play a major role in peanut cultivation. Effect of inoculum was not significant for the phenotypic data collected but its effect was seen for the alpha diversity metrices of the microbiome suggesting that the inoculum played major role in maintaining the community structure of the peanut rhizosphere.
Educational & Outreach Activities
Participation summary:
We didn't plan the outreach activities.
Project Outcomes
We have prepared a manuscript draft, which will be published in a decent peer-reviewed journal and will be accessed by a broad audience to know the differences in terms of crop yield, plant growth, soil health, microbe biodiversity, etc between organic and inorganic peanut cultivations.
We understand better the organic practices and procedures. During the social or conferences, we started to talk to farmers doing organic farming and researchers working on organic issues.