Final report for GS21-240
Project Information
Southern crop producers are shifting more and more to sustainable practices to increase conservation efforts. Whether it be the planting of shelterbelts for erosion control or the use of cover crops to promote better soil health, growers have several options to improve farm sustainability. Conservation strategies can be developed through the aid of programs like the Conservation Stewardship Program, whose main goal is to provide farmers the tools to successfully apply these conservation tactics on their farms. Several of these environmental manipulations may also support more stable natural enemy abundances, but a better understanding of whether the tactics provided by the Conservation Stewardship Program effectively increase natural enemy abundance is still needed. Do conservation areas such as buffer strips enhance natural enemy or pest populations or both?
In this study, an investigation of the effects of conservation plantings on both natural enemy and pest populations adjacent to soybean plantings will take place. An assessment of arthropod populations in conservation areas (i.e., buffer strip, orchard, and shelterbelt) will be conducted both on-station as well as in collaboration with a Louisiana soybean producer currently enrolled in the Conservation Stewardship Program. Additionally, stink bug pests and four natural enemy groups, Anthocoridae, Geocoris spp., Reduviidae, and Araneae, will be targeted to track movement and verify whether migration into adjacent soybean occurs.
The main goal of this proposed study was to aid in the development of more sustainable management strategies by determining if Conservation Stewardship Plantings effectively conserve natural enemies or if they provide a bridge for pests into adjacent soybeans.
Objective 1. Monitor abundance of arthropod natural enemies and pests within Conservation Stewardship plantings during the growing season.
Objective 2. Determine movement of arthropods from Conservation Stewardship plantings into adjacent crop using a mark and capture technique
Cooperators
- (Researcher)
Research
Objective 1:
This study took place in St. Joseph, LA in 2022 and Baton Rouge, LA in 2022 and 2023. All sampling sites were located adjacent to a soybean planting. In St. Joseph, research was conducted on one on-station site (Northeast Research Center), Site A, and one off-site (commercial grower), Site B. The on-stations site was a buffer strip (0.40–0.55 ha) and the off-station site was a 91.44 m long edge of a shelterbelt. In Baton Rouge, research was conducted on three on-station sites (Doyle Chambers Central Research Station), Site C, Site D, and Site E. Site C was a 0.12 ha buffer strip, Site D was a 0.60 ha pecan orchard, and Site E was a 60.96 m long edge of a shelterbelt. The buffer strip at Site A were comprised of a mix of native perennial grasses (e.g., Panicum virgatum, Andropogon gerardi), clovers (e.g., Trifolium alexandrinum, T. repens, T. incarnatum), and vetches (e.g., Vicia sativa, V. villosa). The buffer strip at Site C mainly contained grasses (e.g., Cynodon dactylon), clovers (e.g., T. repens) and weedy species (e.g., Ambrosia trifida, Triadica sebifera). Within the shelterbelts, perennial grasses (e.g., C. dactylon, Paspalum notatum, P. urvillei) morning glories (Family: Convolvulaceae) and clovers (e.g., T. repens) were present. The ground of the pecan orchard was mainly comprised of perennial grasses (e.g., P. notatum, P. urvillei) and clovers (e.g., T. repens). Each sampling site was divided into four to eight blocks of approximately equal size.
Within each sampling year, arthropod sampling started before soybeans were planted (April to May) and ended when soybeans reached the seed development stage (R5/R6) (Fehr et al. 1977). The growth stage of the adjacent soybean field was concurrently monitored alongside arthropod sampling. At monthly intervals, foliar-residing arthropods were sampled within each site using a D-vac vacuum (John W. Hock Company, Gainesville, Florida) with a 25 cm diameter suction opening. The sampled areas were randomly selected by tossing a 0.9 m hoop into each block. A set of three samples was taken from each block at each sampled site. Specimens were collected in 25 cm× 35 cm mesh bags and then placed into 17.78 cm × 20.32 cm seal top bags (Elkay Plastics Co., Inc., Commerce, CA) and kept in a cooler. D-vac samples were returned to the laboratory and kept in the freezer until further processing. Foliar-residing arthropods were identified to the lowest possible taxonomic level using a dissecting microscope. Only species of known pest or natural enemy status in soybean were evaluated.
For predator analysis, collected specimens were separated into four functional groups: Araneae, Formicidae, predaceous Hemiptera, and predaceous Coleoptera. Each functional group was assessed individually within each sampled site. For pest analysis, collected specimens were separated into four pest groups: Pentatomidae, Colaspis spp. Diabrotica spp., and threecornered alfalfa hopper, Spissistilus festinus. Similarly, each pest group was evaluated individually within each sampled site. Due to low numbers in foliar-residing arthropod samples, counts from the set of three D-vac samples within each block were totaled. Count data was evaluated using a generalized linear mixed model approach in R version 4.3.1. Sampling time point was treated as fixed effect and site block was treated as a random effect. The response variable for each model was the number of individuals collected for select arthropod groups within each predator/pest group. Arthropod groups were excluded from analysis if low counts were collected during the sampling period.
Objective 2:
The predator/pest mark-and-capture was conducted in soybean fields adjacent to the conservation plantings discussed in Objective 1. Site C was excluded from mark-and-capture evaluation due to reduced soybean stand in adjacent field. In 2022, soybeans were planted on 27 April adjacent to Site A and Site C, and on 15 May adjacent to Site D. In 2023, soybeans were planted on 24 April next to Site C and Site E. A soybean variety trial comprised of twenty-seven different varieties was planted next to Site A. Site C (2022) and Site D were adjacent to fields planted with Asgrow 43X0 and Asgrow 52X9 soybeans, respectively. Soybeans adjacent to Site C (2023) and Site E were both planted with Pioneer P54A54X variety soybean.
Mark-and-capture protocols followed that described in Bastola and Davis (2018). A liquid egg white (Great value, Walmart Inc., Bentonville, Arizona) marker was sprayed at 10% concentration to mark arthropods prior to their potential movement into the adjacent soybean field. Egg whites were sprayed using a handheld sprayer (The Fountainhead Group Inc., New York Mills, New York). At each evaluated conservation planting, applications took place at two time points, when soybeans reached the flowering stage (R2/R3) and when seed development occurred (R5/R6). At each time point, a 1.5 m x 200 m section along each conservation planting edge bordering the adjacent soybean field was sprayed with egg white solution. Two days after application, sampling was conducted along five equidistantly spaced (50 m) transect lines directed into soybean away from the center of sprayed section edge. Along each transect, sampling occurred at 0 m (field edge), 5m, and 10 m from the sprayed area. One set of mark-and-capture sampling time points (R2/R3 and R5/R6) took place at each farm site, except Site E where only the R5/R6 application was made. Additionally, due to the large area at Site A and Site C (2023), two 1.5 m x 200 m sections were sprayed with egg white solution and treated as separate observations. Arthropods were collected in 25 cm× 35 cm mesh bags and then placed into a kill jar (plaster of Paris filled with ethyl acetate). Collected specimens were individually transferred into labeled 10.16 cm × 15.24 cm ziplock bags (Reloc ZippitTM ) using forceps, and then stored in a cooler. Due to the number of arthropods collected, only specific predator and pest groups were taken for evaluation. The natural enemy groups selected were Anthocoridae, Geocoris spp., Reduviidae, and Araneae. For pests, only stink bugs (Family: Pentatomidae) were selected for assessment. Additionally, plant material was taken from the sprayed areas to confirm that protein marking had not degraded 48 hours after application. Samples were returned to the lab and stored in a -20ºC freezer until further evaluation via enzyme-linked immunosorbent assay (ELISA).
Enzyme-linked immunosorbent assays (ELISA) were conducted to detect the egg white protein in both arthropod and plant samples. Insect/plant samples were transferred into 2 ml conical tubes after which 500 μL of TBS buffer (Tris-buffered saline) was added. Additionally, 500 μL of TBS buffer (Tris-buffered saline) was added to tubes containing unsprayed insects (Piezodorus guildinii) to be used as a negative control. Specimen tubes were vortexed for 30 s and then stored in a –2º C fridge overnight. On the second day, 80 μl of solution from each sample was pipetted into wells of a 96-well microtiter plate (BRAND plates®, REF 781720, Wertheim, Germany) in triplicate. Serial dilutions (1000 ppm–1 ppb) of albumin from chicken egg white (A7641, Sigma-Aldrich, St. Louis, Missouri) were used as a positive control for each evaluated plate. For the negative control, 80 μl of unsprayed insect sample and 80 μl of blank TBS were placed into wells in triplicate. The microtiter plate was covered with a slightly damp paper towel and incubated at 37 °C for 2 h in a mini-incubator (Labnet I5110A). Subsequently, plates were washed three times with 1X PBST (phosphate-buffered saline + 0.09 % Tween-20) wash buffer. The wash buffer was prepared by mixing 0.9 ml Tween-20 with 1 L of 1X PBS. Next, 200 μl of PBS solution containing 1% BSA (bovine serum albumin, P3688, Sigma-Aldrich) (blocking solution) was added to each well using a multi-channel pipet. The PBS BSA solution was prepared by mixing 1 L of dd water with P-3688 PBS-BSA sachet. The microtiter plate was then covered again with a slightly damp paper towel and incubated at 37 °C for 1 h. After incubation, each plate was washed three times with 1X PBST. Then, 80 μl of primary antibody (1:8000 in 1% PBS-BSA, anti-chicken egg albumin produced in rabbit) (C6534, Sigma-Aldrich) was pipetted into each well. This solution was made by mixing 10 μl of TBS of primary antibody in 8 ml of PBS-BSA and then 1 ml of the previous solution was added to 9 ml of PBS-BSA (1:8000). After the addition of primary antibody, microtiter plates were covered with a slightly damp paper towel and incubated at 37 °C for 1 h. After incubation, plates were washed three times with 1X PBST. Then, 80 μl of secondary antibody (1:2000 in 1% PBS-BSA, alkaline phosphatase anti-rabbit IgG (H + L) made in goat (AP307, EMD Millipore Corp.) was added to each well. This solution was prepared by mixing 5 μl of secondary antibody into 10 ml of PBS-BSA. After addition of secondary antibody, each microtiter plate was covered with a slightly damp paper towel and incubated at 37 °C for 1 h. After incubation, plates were again washed three times with 1X PBST. Lastly, 50 μl of alkaline phosphatase yellow (pNPP) liquid substrate system for ELISA, (P7998, Sigma-Aldrich) was pipetted into each well. Microtiter plates were then covered with a slightly damp paper towel and incubatedat 37 °C for 30 min. Absorbance was read with the photometric microplate absorbance reader (Multiskan® EX, Cat no. 51118170, Thermo Electron Corporation, Vantaa, Finland) at 450 nm with 490 nm filter to reduce background absorbance. Samples were deemed to be positive when the reading of ELISA optical density value (OD values) of the insect/plant samples was greater than the mean of the OD values for the negative control plus 4 times it’s standard deviation (mean negative control + 4 SD of negative control) (Bastola & Davis, 2018).
Due to the low number of positive specimens observed during the experimental period, only specimens that were determined to have moved from conservation plantings were evaluated for analysis. Analysis was conducted using Chi-squared tests to assess whether the proportion of positive samples were influenced by growth stage (R2/R3 vs. R5/R6), arthropod type (predator vs. prey), predator type (Araneae vs. predaceous Hemiptera), or locality within the field (0m vs. 5m vs. 10m).
Objective 1:
Over the two-year sampling period (2022–2023), 6,249 predator specimens were collected across the five sampled sites. The most abundant predator species were Araneae, accounting for over 60% of the collected natural enemies. The second most predator abundant group was Formicidae, attributing to nearly 31% of the sampled arthropods. The final two groups, predaceous Hemiptera and predaceous Coleoptera, accounted for 7% and 1%, of specimens found in the observed conservation plantings, respectively. Due to the low numbers of predaceous Coleoptera within each site, this group was excluded from analysis. The abundance was pest groups across the two-year sampling period (2022–2023) was relatively lower than that observed for predators with 837 specimens from four pest groups. Pentatomidae accounted for nearly 51% of the collected pests and threecornered alfalfa hopper (TCAH), Spissistilus festinus, accounted for 33%. Individuals from the coleopteran genera, Colaspis and Diabrotica attributed to 10% and 6% pest specimens collected, respectively.
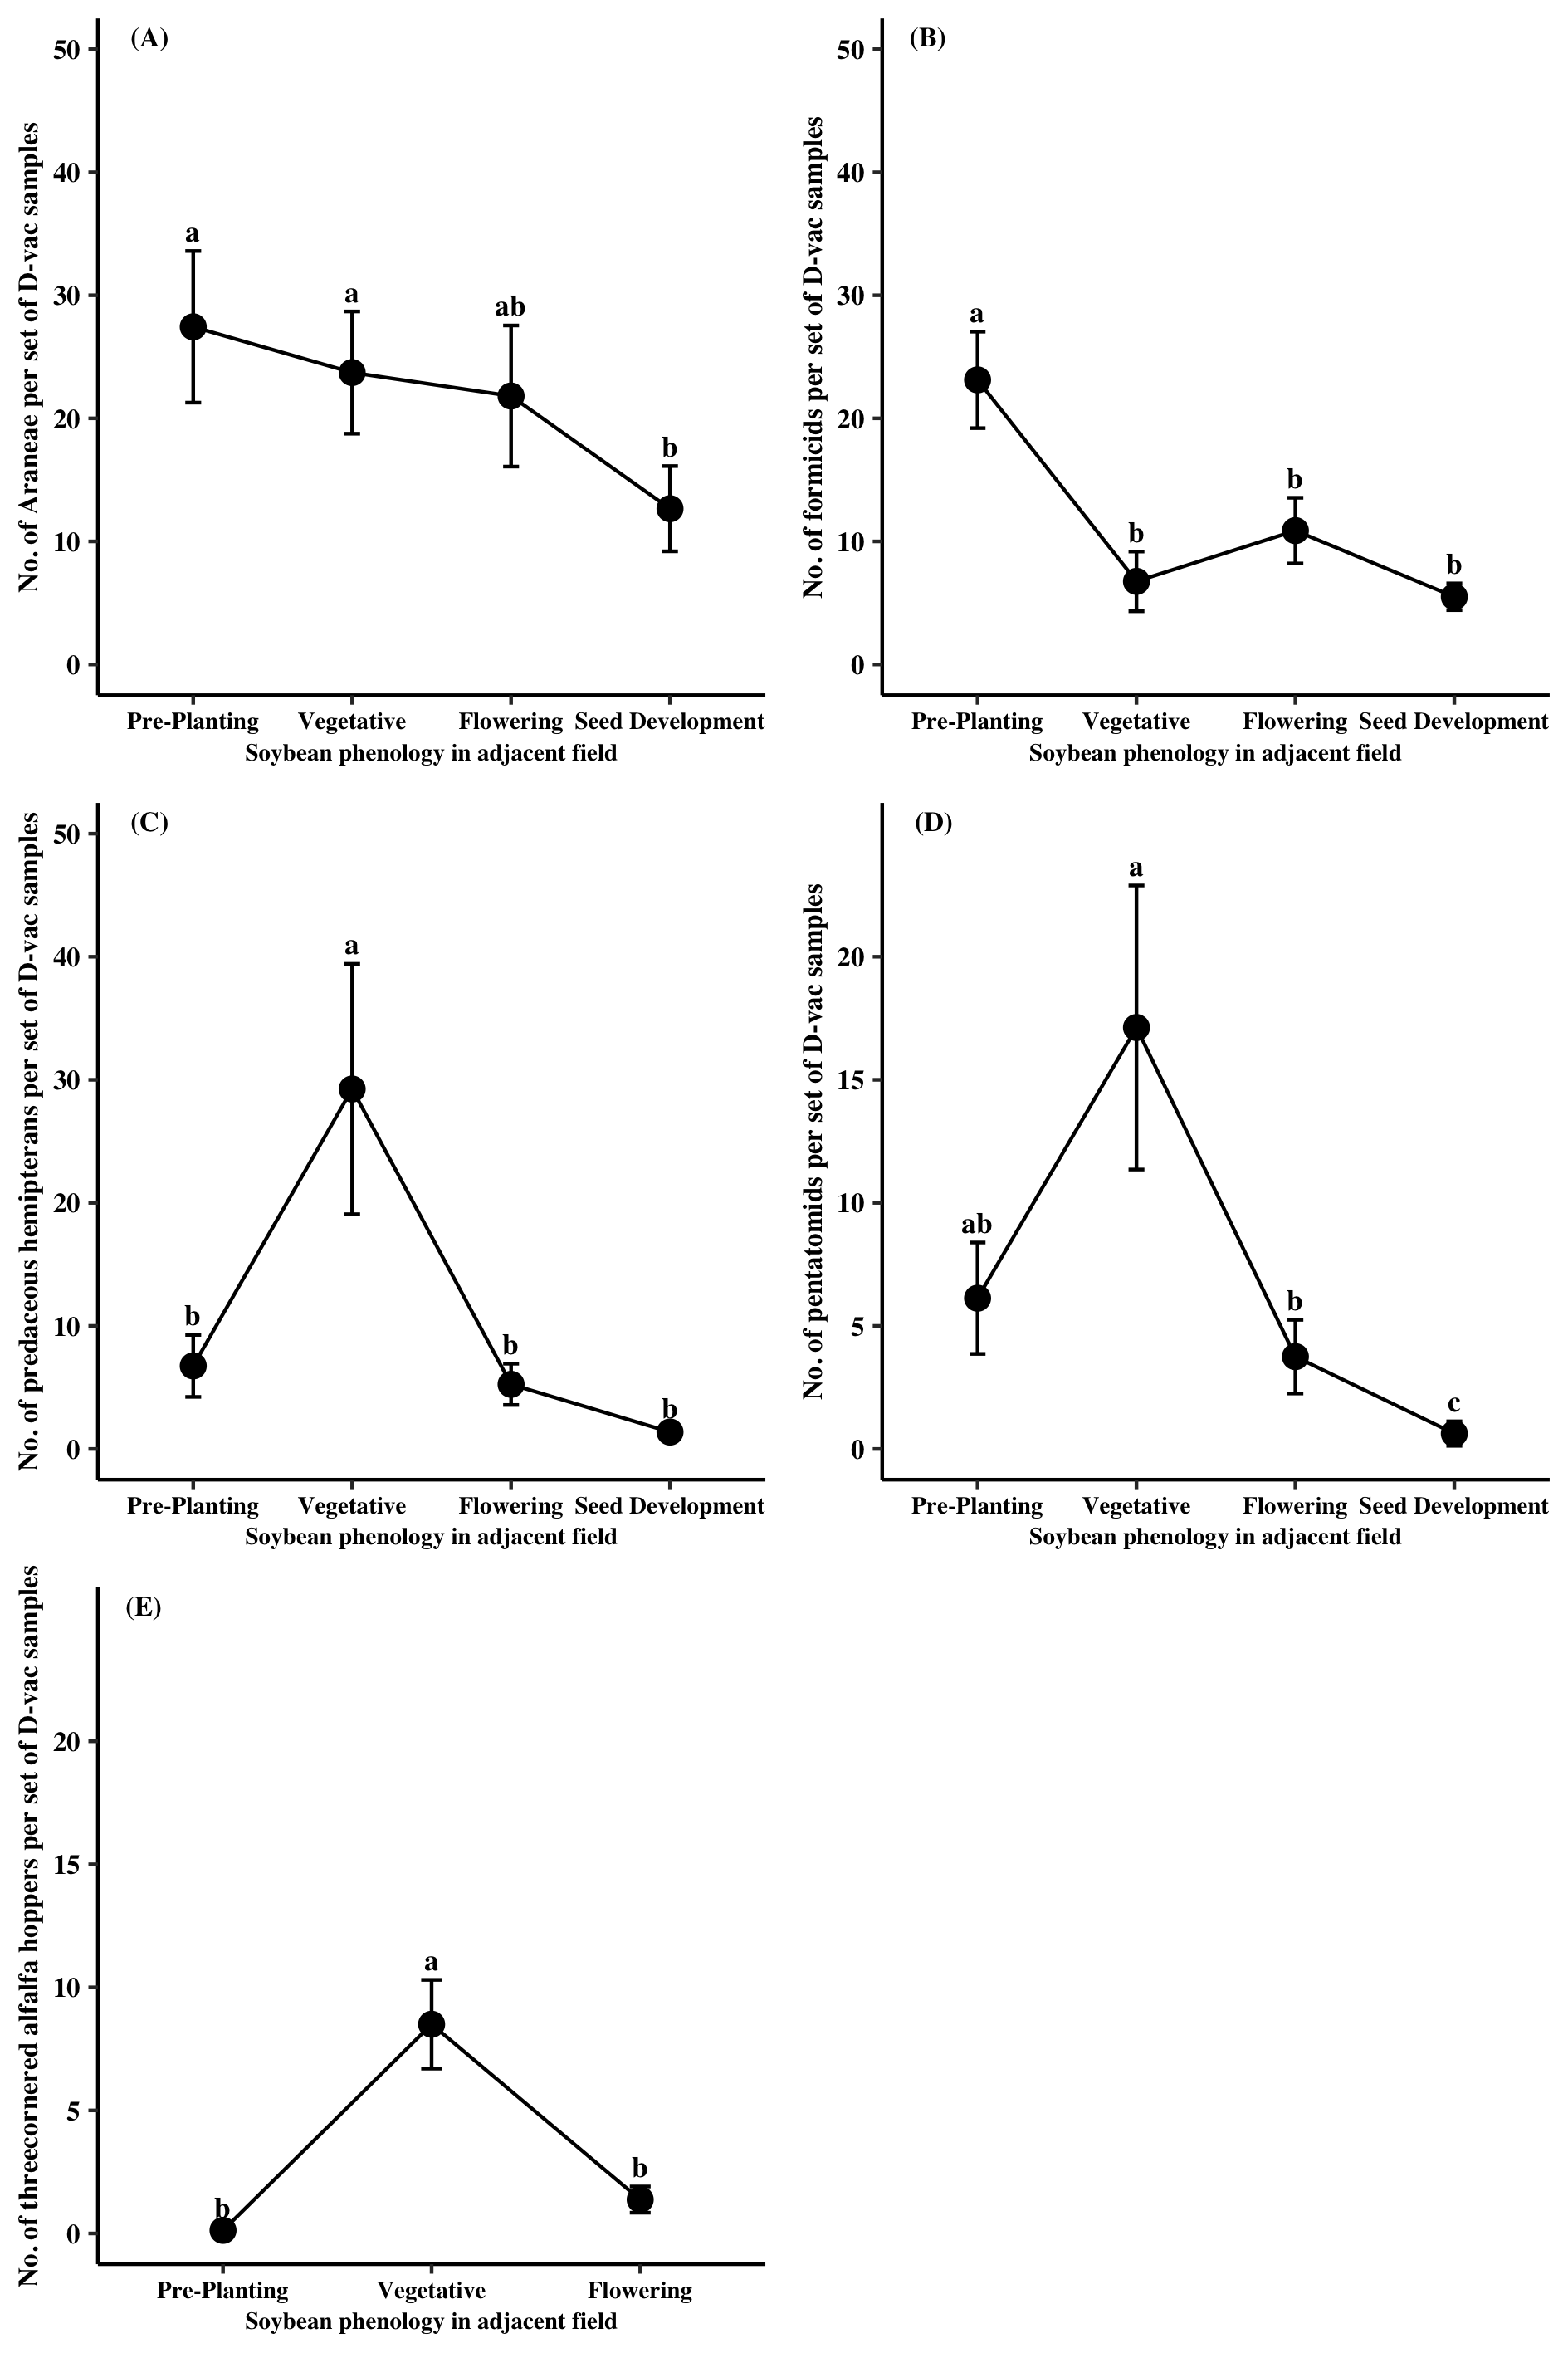
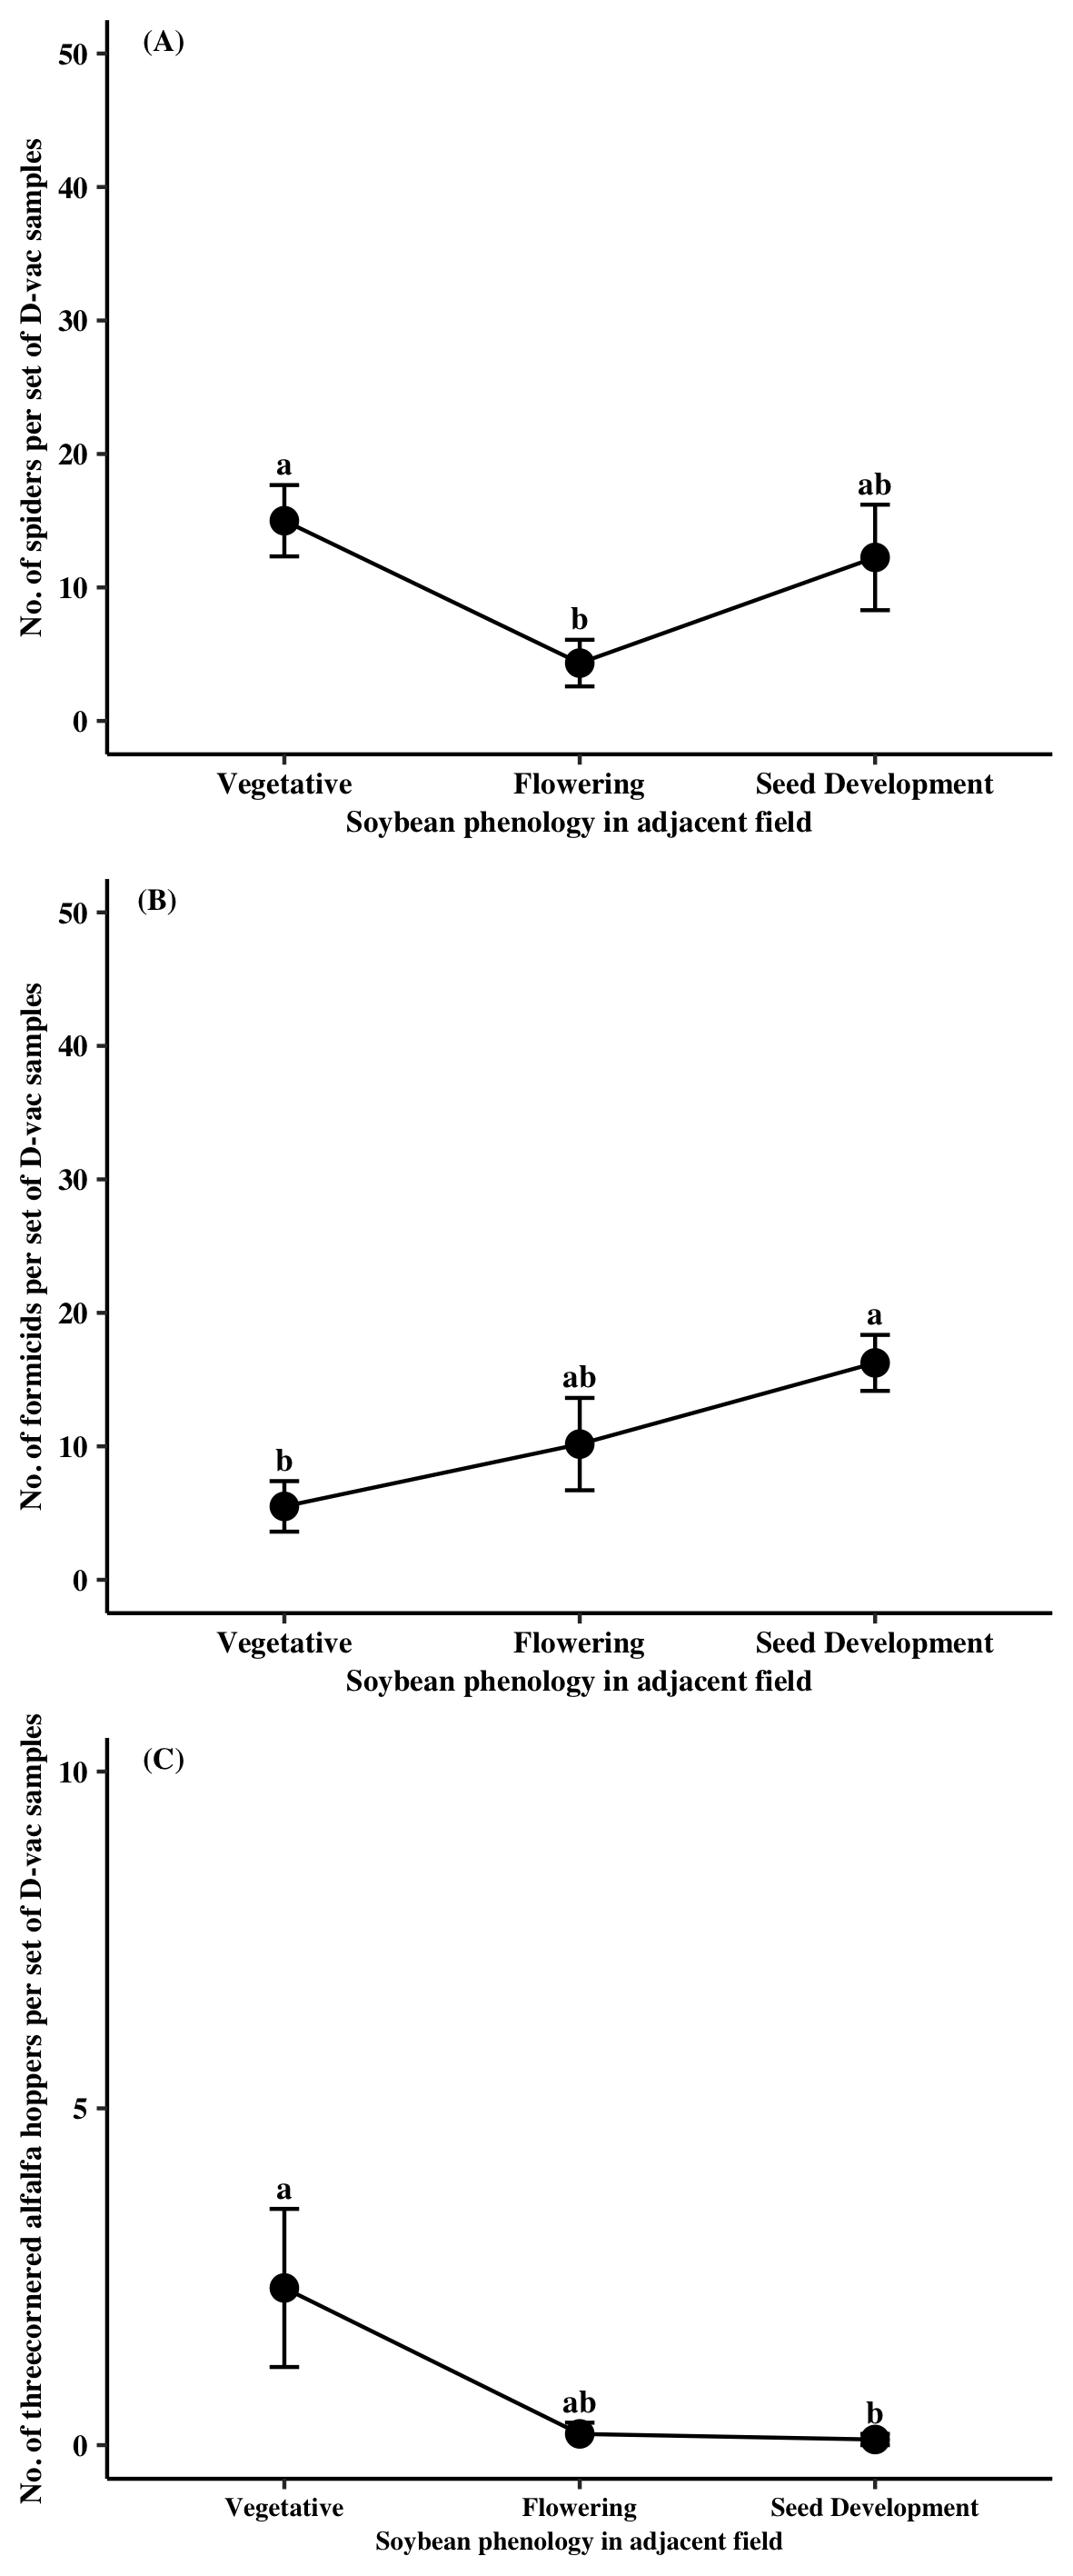
Predator specimens collected from Site A were mainly comprised of Araneae (77%), Formicidae (14%), and predaceous Hemiptera (9%). A significant time point effect was found for all three predator groups (Araneae: χ2 = 13.64, df = 3, P = 0.0034; Formicidae: χ2 = 25.06, df = 3, P < 0.0001; Pred. Hemiptera: χ2 = 28.32, df = 3, P < 0.0001). For Araneae, significantly more individuals were found in Site A when the adjacent soybean field was at the pre-planting and flowering stages relative to when the field was at the seed development stage (Figure 1A). Similarly, formicids were more abundant in Site A prior to the planting of soybean compared to when soybean was in the field for all observed growth stages (Figure 1B). Predaceous hemipterans were most common within Site A when the adjacent soybean field was at the flowering stage compared to other sampling time points (Figure 1C). The majority of pest specimens collected from Site A came from two groups, Pentatomidae (73%) and TCAH (25%). A significant sampling time point effect was found for both pentatomids and TCAH (Pentatomidae: χ2 = 26.33, df = 3, P < 0.0001; TCAH: χ2 = 48.09, df = 2, P < 0.0001). Pentatomidae numbers in Site A were reduced by nearly 97% when adjacent soybean reached the seed development relative to the point when soybean was at the vegetative stage (Figure 1D). Individuals from TCAH were the highest at Site A when adjacent soybean was at the vegetative stage (Figure 1E).
Only two natural enemy groups were found in significant abundance at Site B, Araneae (44%) and Formicidae (55%). Populations of both predator groups were significantly impacted by sampling time point (Araneae: χ2 = 52.20, df = 2, P< 0.0001; Formicidae: χ2 = 73.14, df = 2, P < 0.0001). Individuals from Araneae were most abundant in Site B when the adjacent soybean field was at the vegetative stage followed by the flowering stage and then the seed development stage (Figure 2A). Formicidae followed a similar trend with more specimens being collected within Site B when the adjacent soybean field was at the vegetative stage relative to when soybean was flowering or going through seed development (Figure 2B). Two major pest groups were found at Site B, Pentatomidae (57%) and TCAH (42%). Sampling time point significantly affected pentatomid abundances in Site B (χ2 = 33.14, df = 2, P < 0.0001). More pentatomids were found earlier in the season when adjacent soybean was at the vegetative stage relative to later in season (Figure 2C). TCAH populations were not evaluated as numbers were only collected on one date, when adjacent soybean was at the vegetative stage.
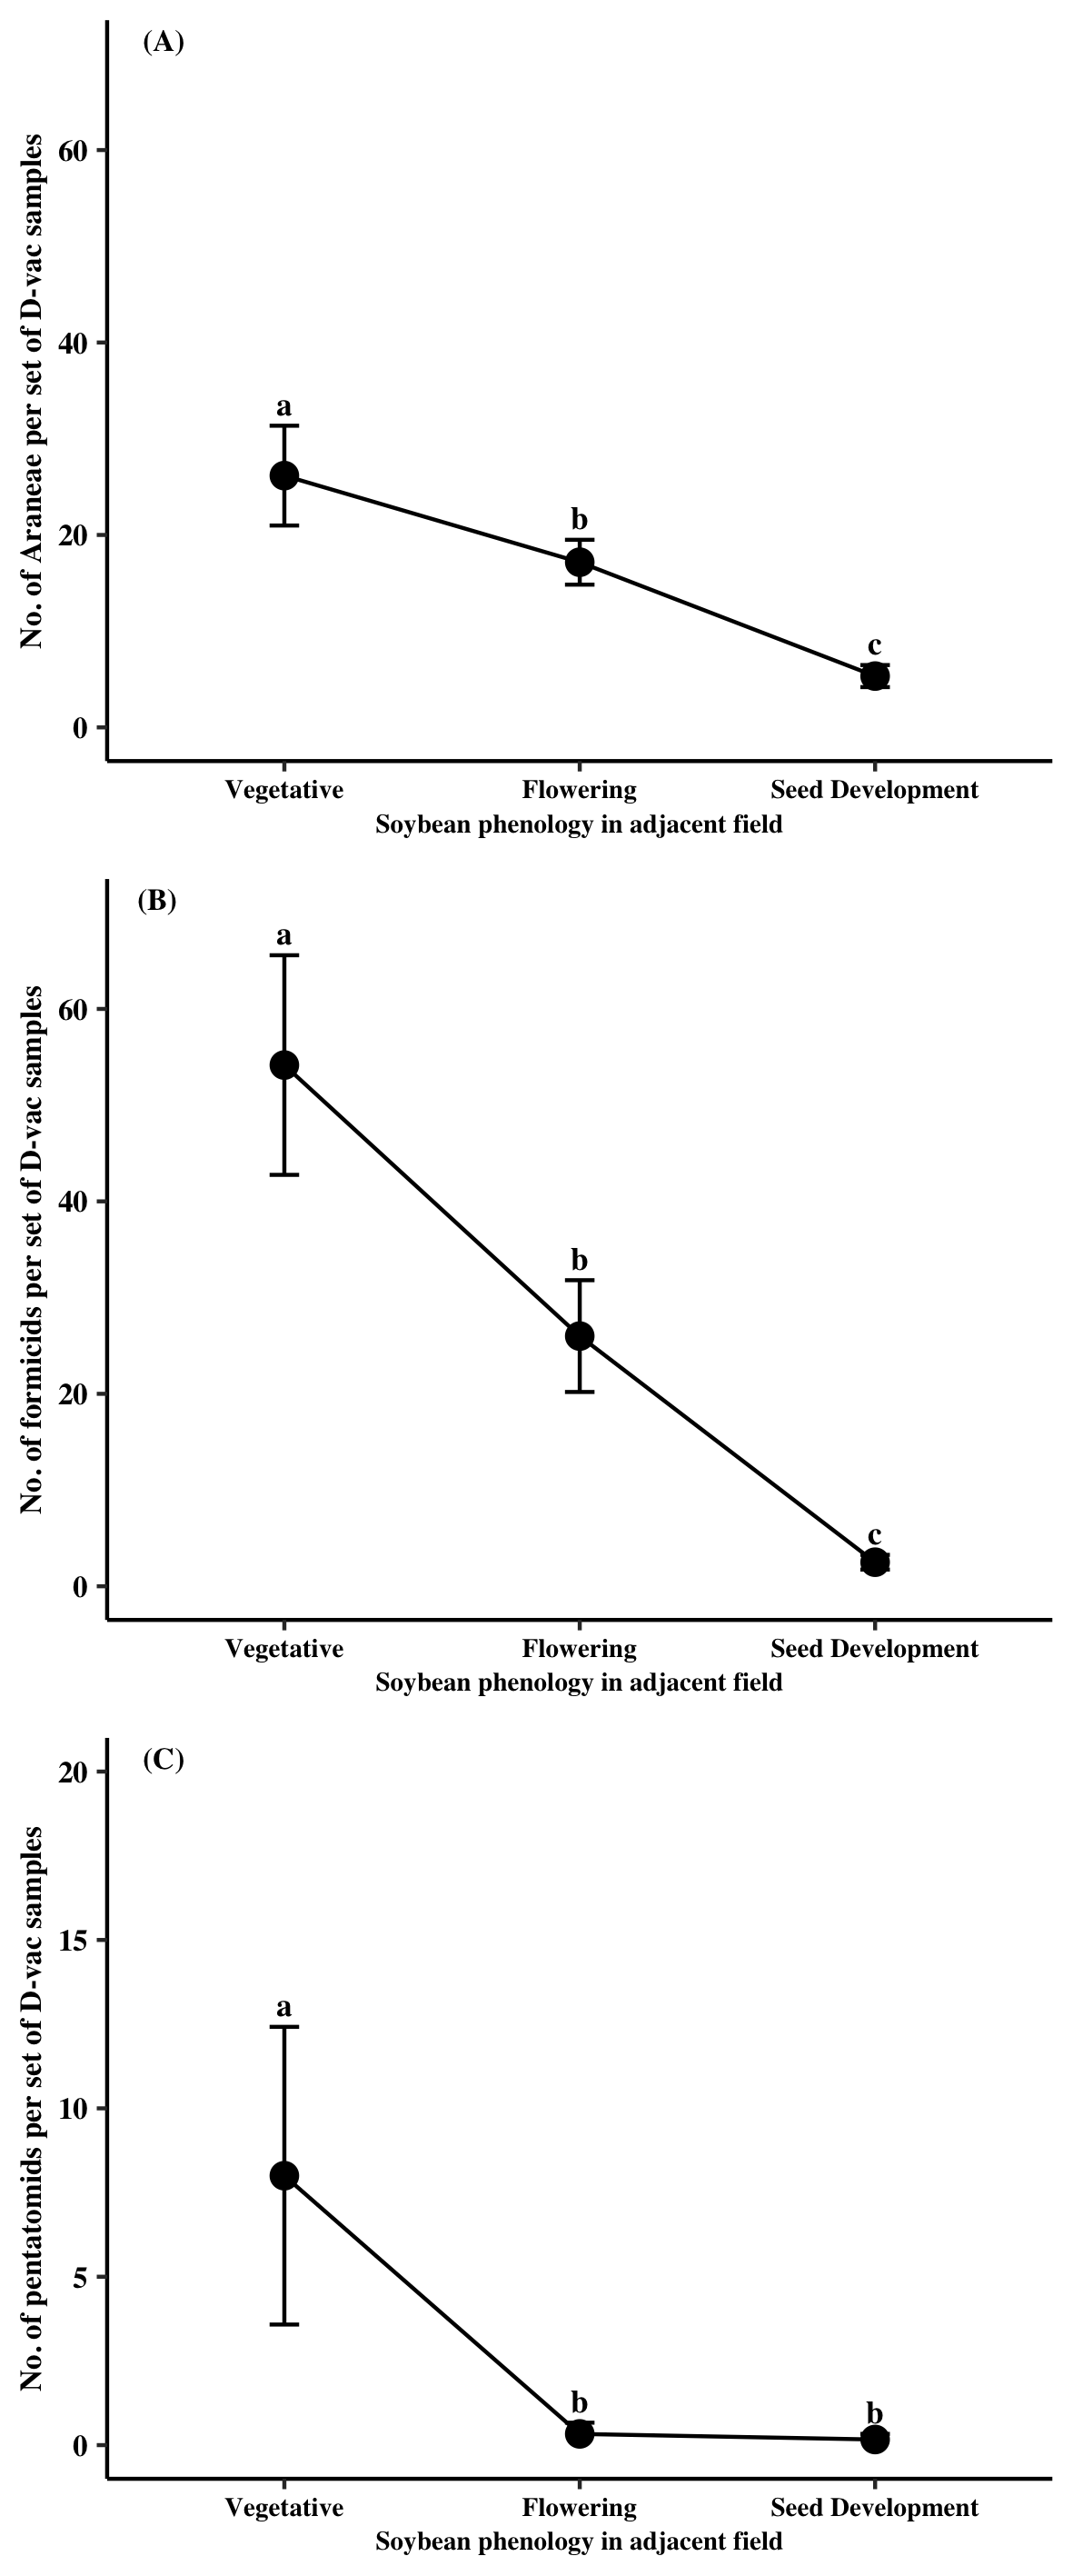
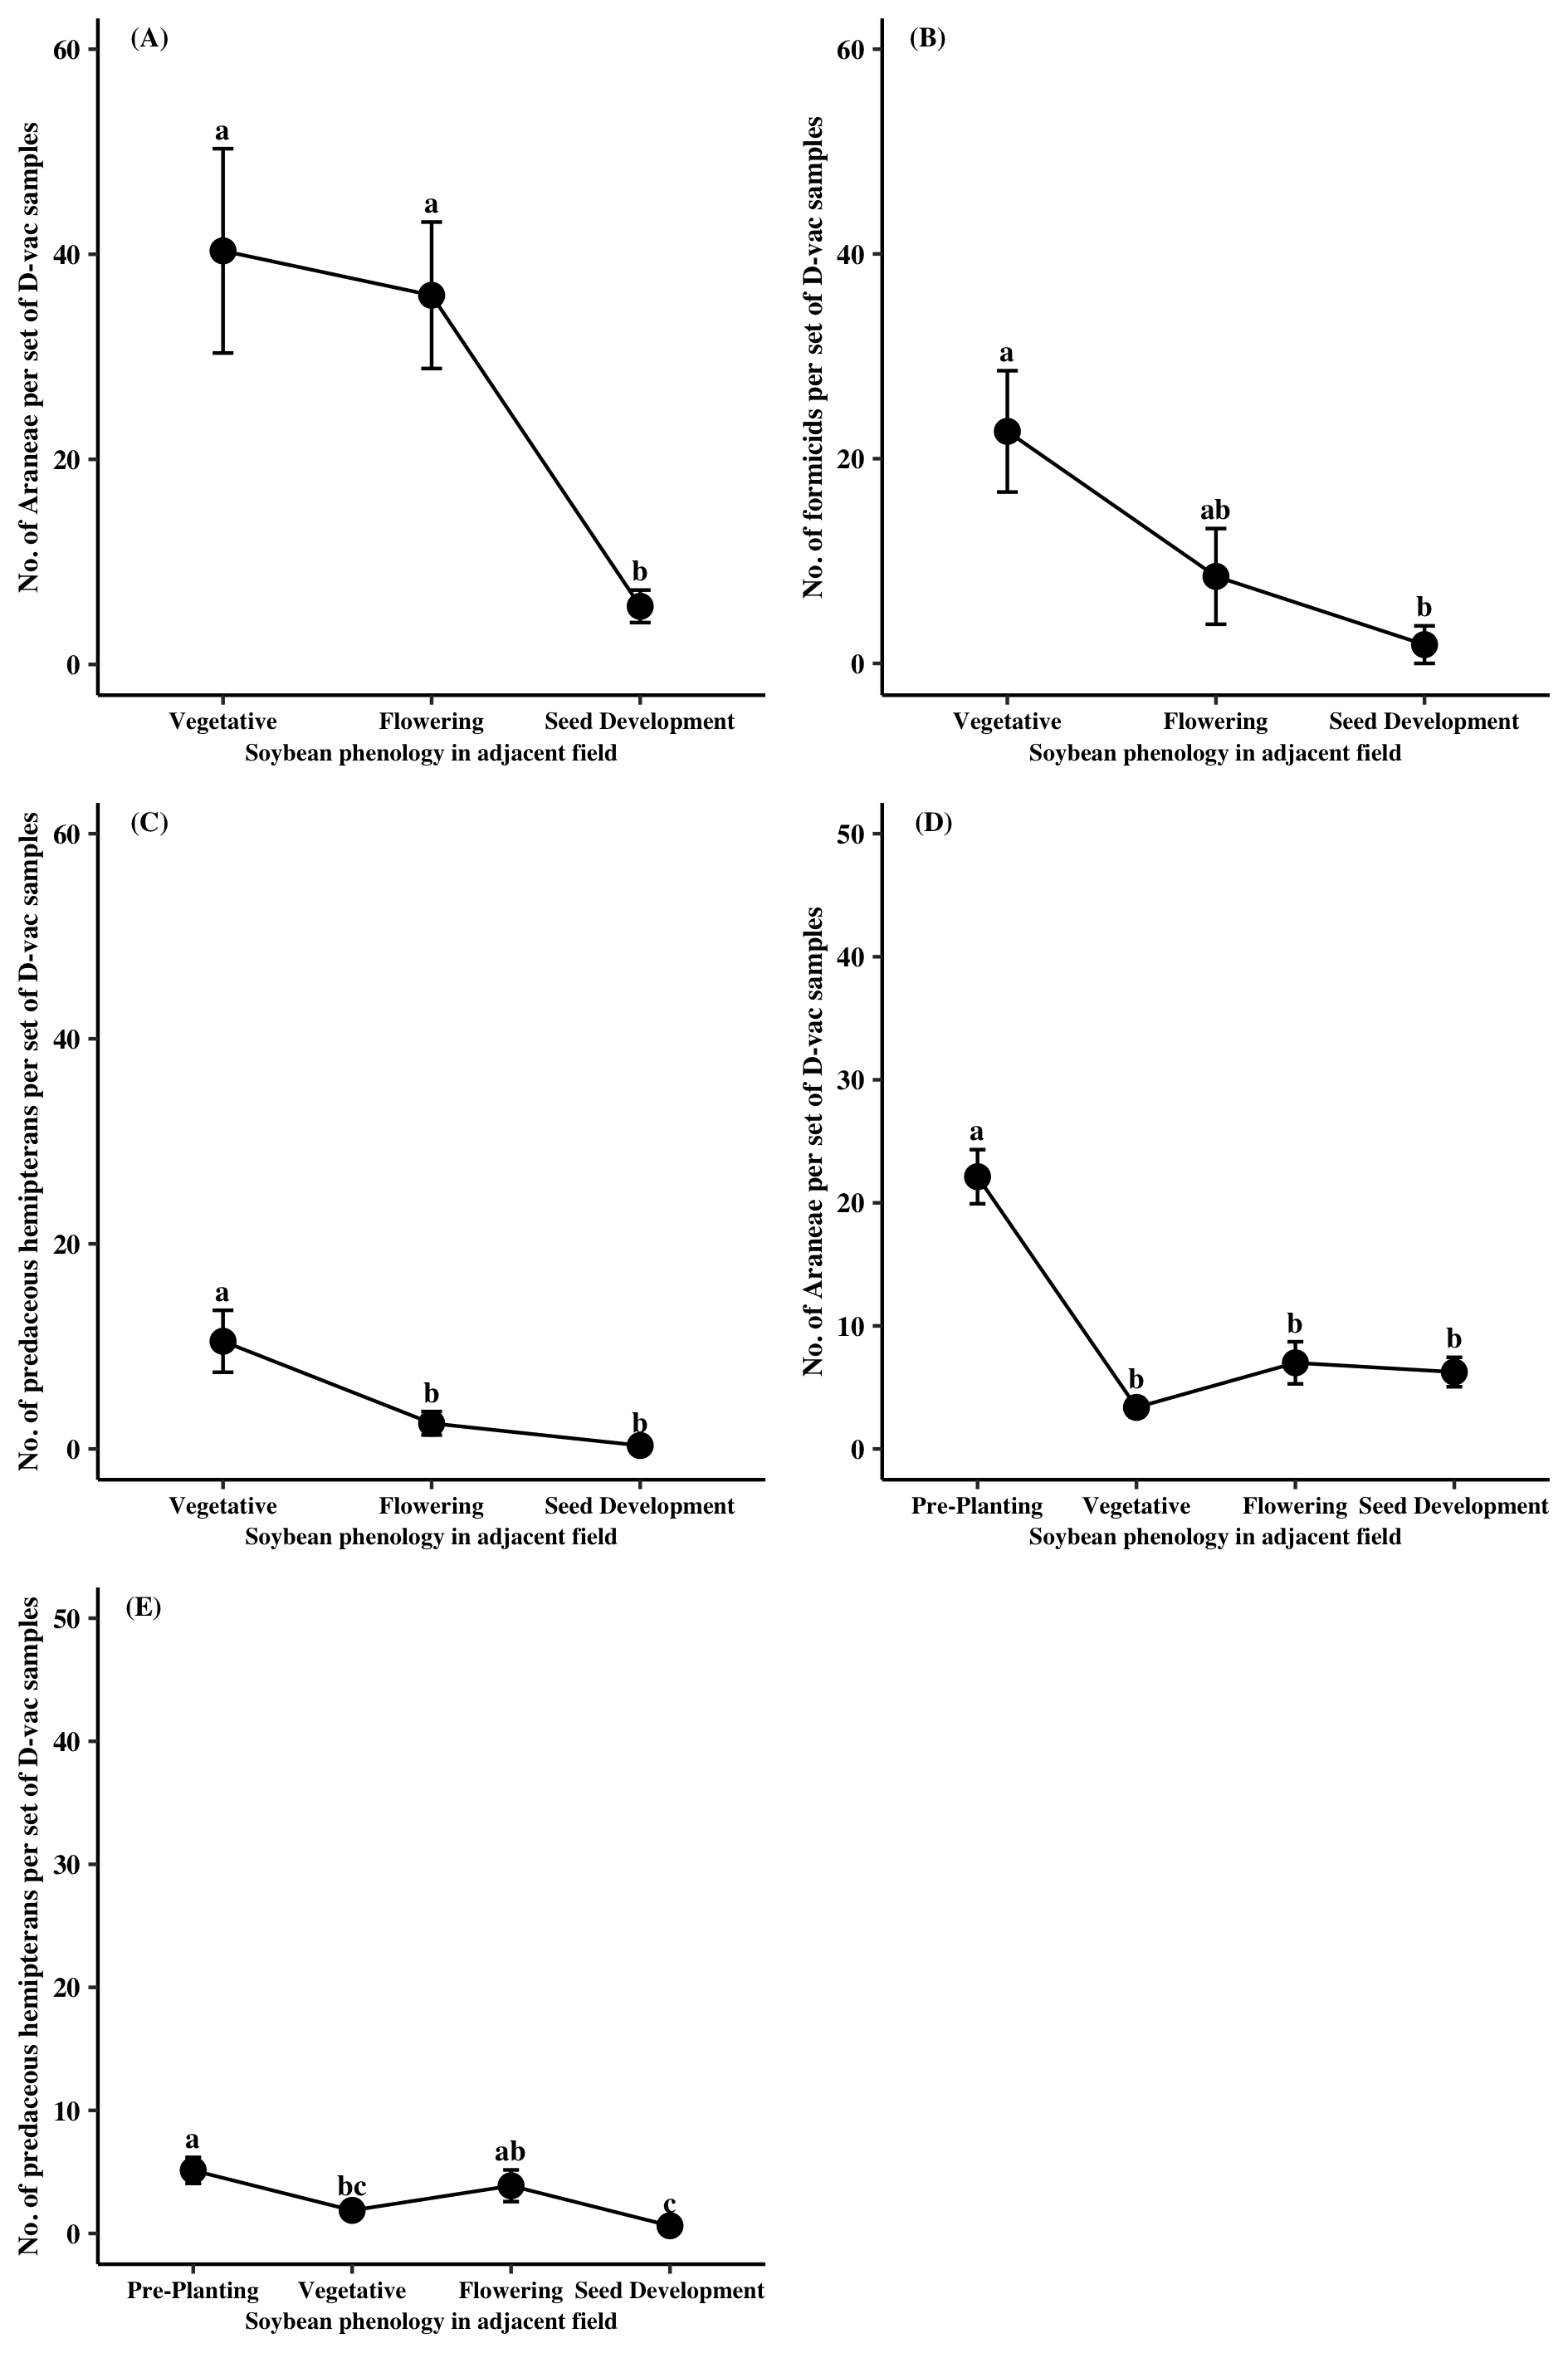
At Site C in 2022, the natural enemy groups collected were comprised of Araneae (63%) followed by Formicidae (25%) and predaceous Hemiptera (11%). A significant sampling time point effect was found for all three natural enemy groups (Araneae: χ2 = 63.95, df = 2, P < 0.0001; Formicidae: χ2 = 12.85, df = 2, P = 0.0016; Pred. Hemiptera: χ2 = 15.82, df = 2, P = 0.0004). Significantly more Araneae were found at Site C when the adjacent soybean field was at the vegetative and flowering stages relative to when soybean was at the seed development stage (Figure 3A). For Formicidae, more individuals were found at Site C when the adjacent soybean was at the vegetative stage in comparison to when soybean at the seed development stage (Figure 3B). Similarly, specimens from the predaceous hemipteran group were found in higher numbers in Site C when the adjacent soybean was at the vegetative stage relative to the flowering and seed development time points (Figure 3C). In 2023, Formicidae, Araneae, and predaceous Hemiptera comprised 57%, 32%, and 9% of the collected predator specimens, respectively. A significant sampling time point effect was found for Araneae and predaceous Hemiptera populations, but not for Formicidae (Araneae: χ2 = 48.46, df = 3, P < 0.0001; Pred. Hemiptera: χ2 = 30.27, df = 3, P < 0.0001). Over three times more Araneae were found prior to soybean planting at Site C in 2023 compared to after soybean was planted (Figure 3D). Predaceous hemipterans were collected in more abundance in Site C around pre-planting and when the adjacent soybean was at the flowering stage relative to later in the season (Figure 3E).
Pest populations at Site C in 2022 were comprised of three groups, Pentatomidae (39%), TCAH (31%) and Colaspis spp. (29%). Sampling time point had a significant effect on all three groups (Pentatomidae: χ2 = 15.46, df = 2, P = 0.0004; TCAH: χ2 = 29.29, df = 2, P < 0.0001; Colaspis spp.: χ2 = 7.76, df = 2, P = 0.0206). Populations from each group exhibited similar trends with higher numbers of pests in Site C occurring earlier in year when adjacent soybean was at the vegetative stage (Figure 4A–C). In 2023, pest numbers were lower in Site C and the lack of pest occurrence within each sampling date did not allow for evaluation of the effect of sampling time point. However, pest groups only occurred earlier in the sampling season prior to soybean planting and when adjacent soybean was at the vegetative stage. The pest populations were comprised of pentatomids (28%), TCAH (33%), Diabrotica spp. (27%) and Colaspis spp. (12%).
The major natural enemy groups collected from Site D were the Araneae (84%) and Formicidae (13%) across the sampling period. The other two groups, predaceous Coleoptera and predaceous Hemiptera, only accounted for 3% of the collected specimens. No sampling time point effect was found for any of the collected predator groups (i.e., Araneae, Formicidae, and predaceous Hemiptera). The major pest groups collected from Site D were Pentatomidae (27%), TCAH (61%), and Colaspis spp. (10%). Similar to predator species, no sampling time point effect was found for pest groups at Site D.
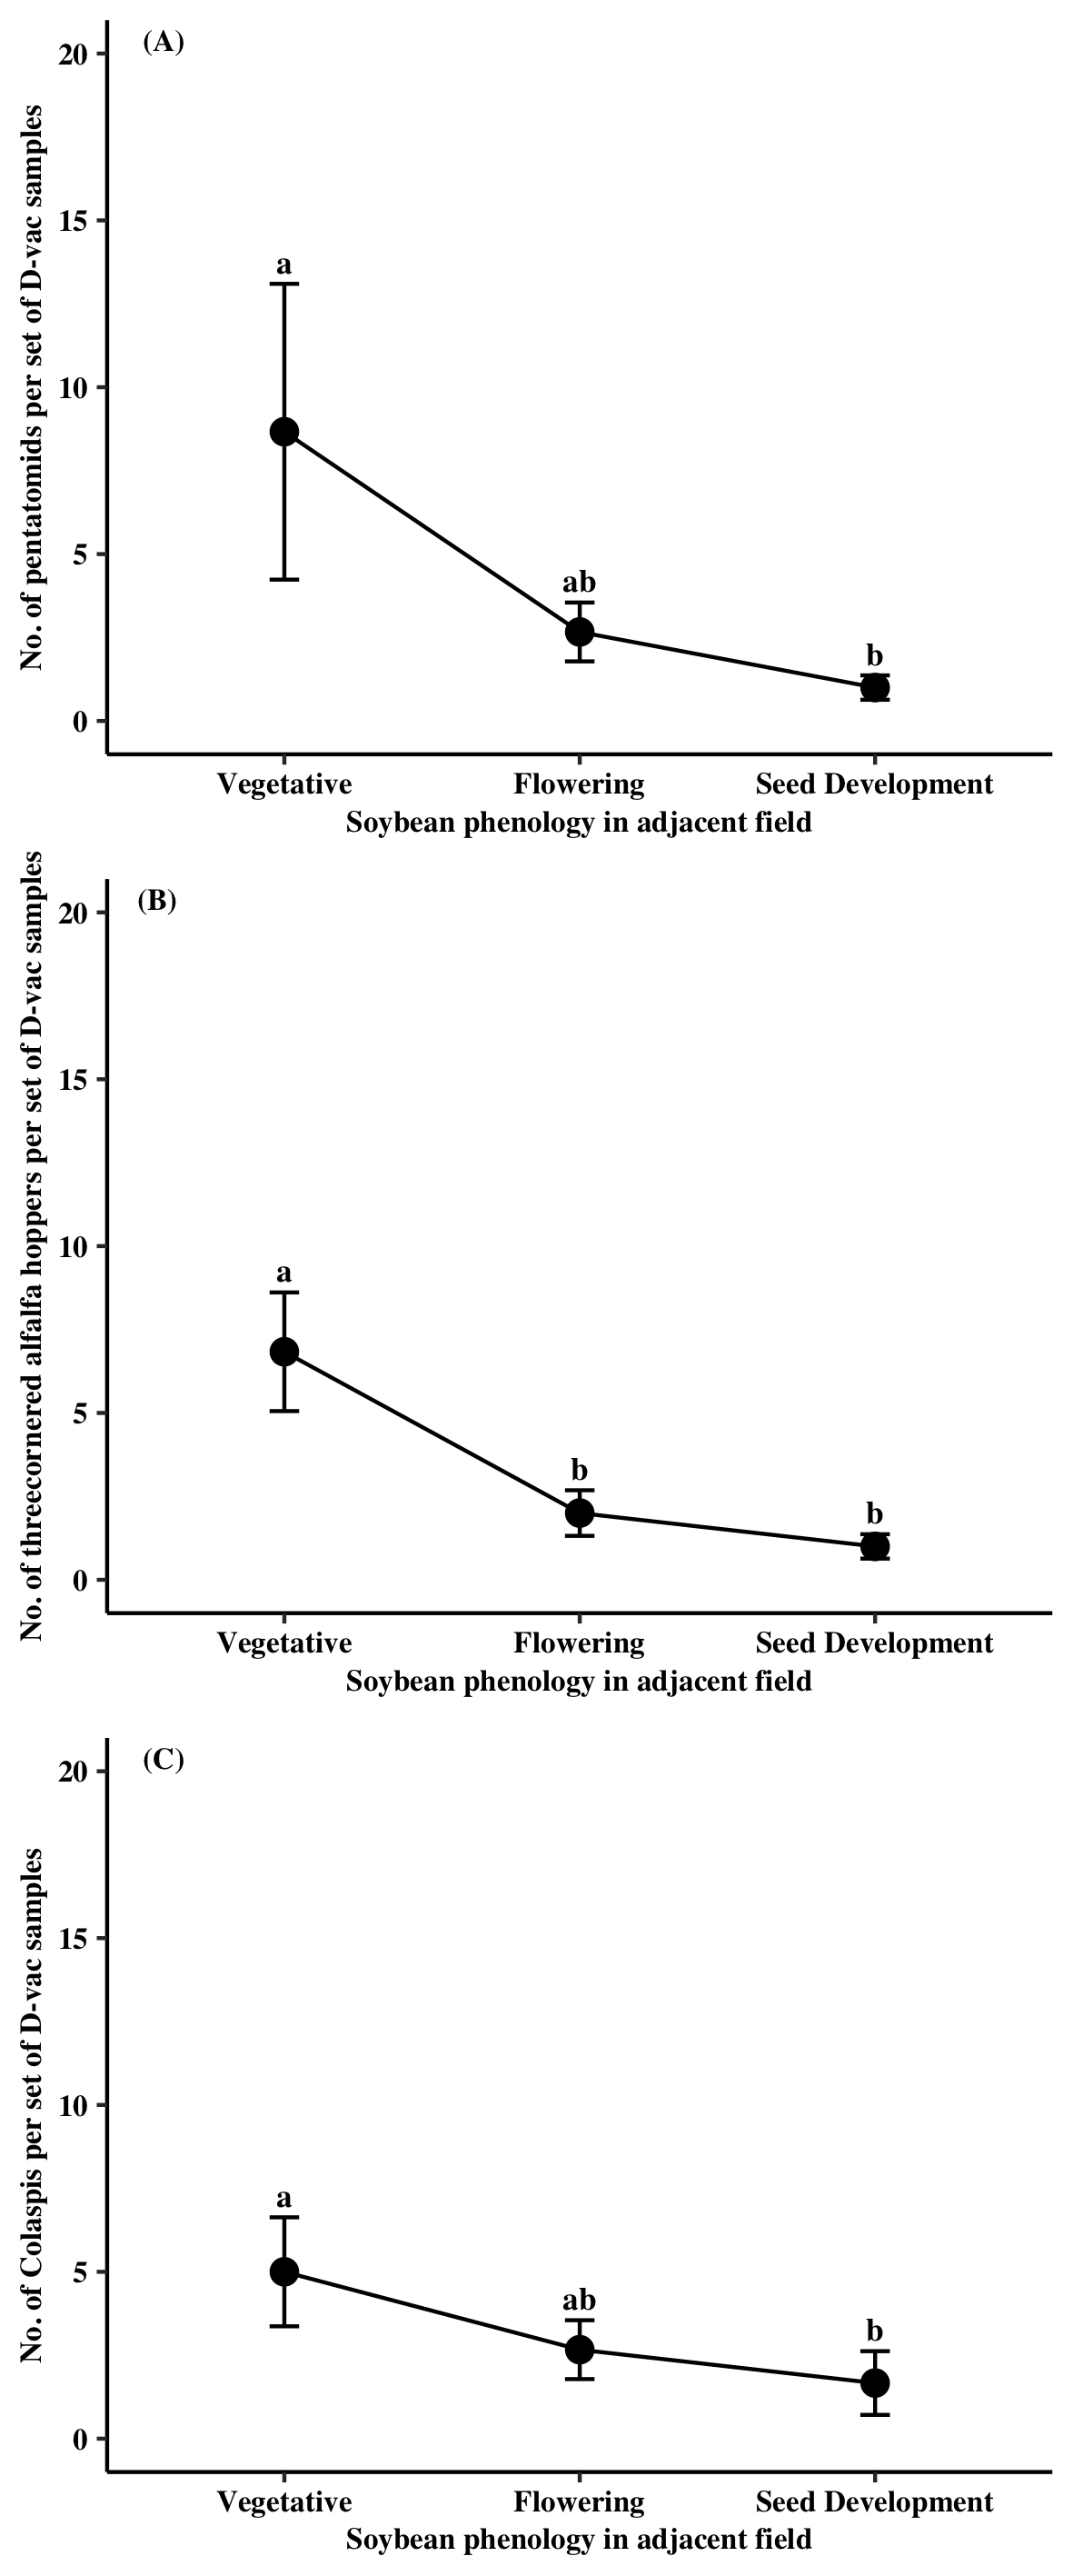
Araneae (44%) and Formicidae (51%) were the two most abundant predator groups collected at Site E in 2023. Both Araneae and Formicidae were significantly impacted by sampling time point (Araneae: χ2 = 6.56, df = 2, P = 0.0378; Formicidae: χ2 = 14.80, df = 2, P = 0.0006). Araneae collected in Site E when adjacent to soybean at the flowering stage was 70% less than when adjacent to soybean at the vegetative stage (Figure. 5A). Nearly three times more formicids were found within Site E when adjacent soybean at the seed development stage relative to the when soybean was at the vegetative stage (Figure 5B). Pest were low throughout the experimental period at Site E with only 32 specimens collected. TCAH accounted for 50% of the specimens found followed by pentatomids at 28%. Sampling time point only significantly affected TCAH populations (χ2 = 9.19, df = 2, P = 0.0101). Samples taken from Site E when adjacent soybean was at the vegetative stage had higher amounts of TCAH relative to samples in Site E when the soybean was at seed development (Figure. 5C).
Overall, results from this objective suggest that both predator and pest populations were more abundant in conservation planting areas at earlier sampling time points. This trend was observed across multiple sites and multiple arthropod groups exhibited this pattern as well. This may suggest that these habitats harbor both predators and pests earlier in the season prior to their movement into adjacent crops like soybean. Even though pests (i.e., Pentatomidae, TCAH) were also found in these areas, they occurred at much lower abundances than the observed predator groups (i.e., Araneae, Formicidae). Conserving these areas may allow for higher abundances of predators like Araneae to move from these plantings into the adjacent crop.
Objective 2:
Over the two-year sampling period and across five sites 300 specimens were collected for mark-and capture analysis. Of the specimens collected, only 24 (8%) were determined to have moved from conservation plantings (positive reading). In 2022, 10 out of 235 (4%) collected specimens were found to be positive. In 2023, 14 out 65 (21.5%) collected specimens were determined to have moved from a conservation planting, all of which came from Site E at the R5/R6 sampling time point. A total of 69 plant samples were taken as positive controls across the two-year sampling period. Overall, 87% of the samples came back positive, exhibiting some degradation over the 48 hour period. A majority of the negative samples came from Site A at the R2/R3 growth stage (60% positive). Excluding this set, nearly 96% of the plant samples came back positive.
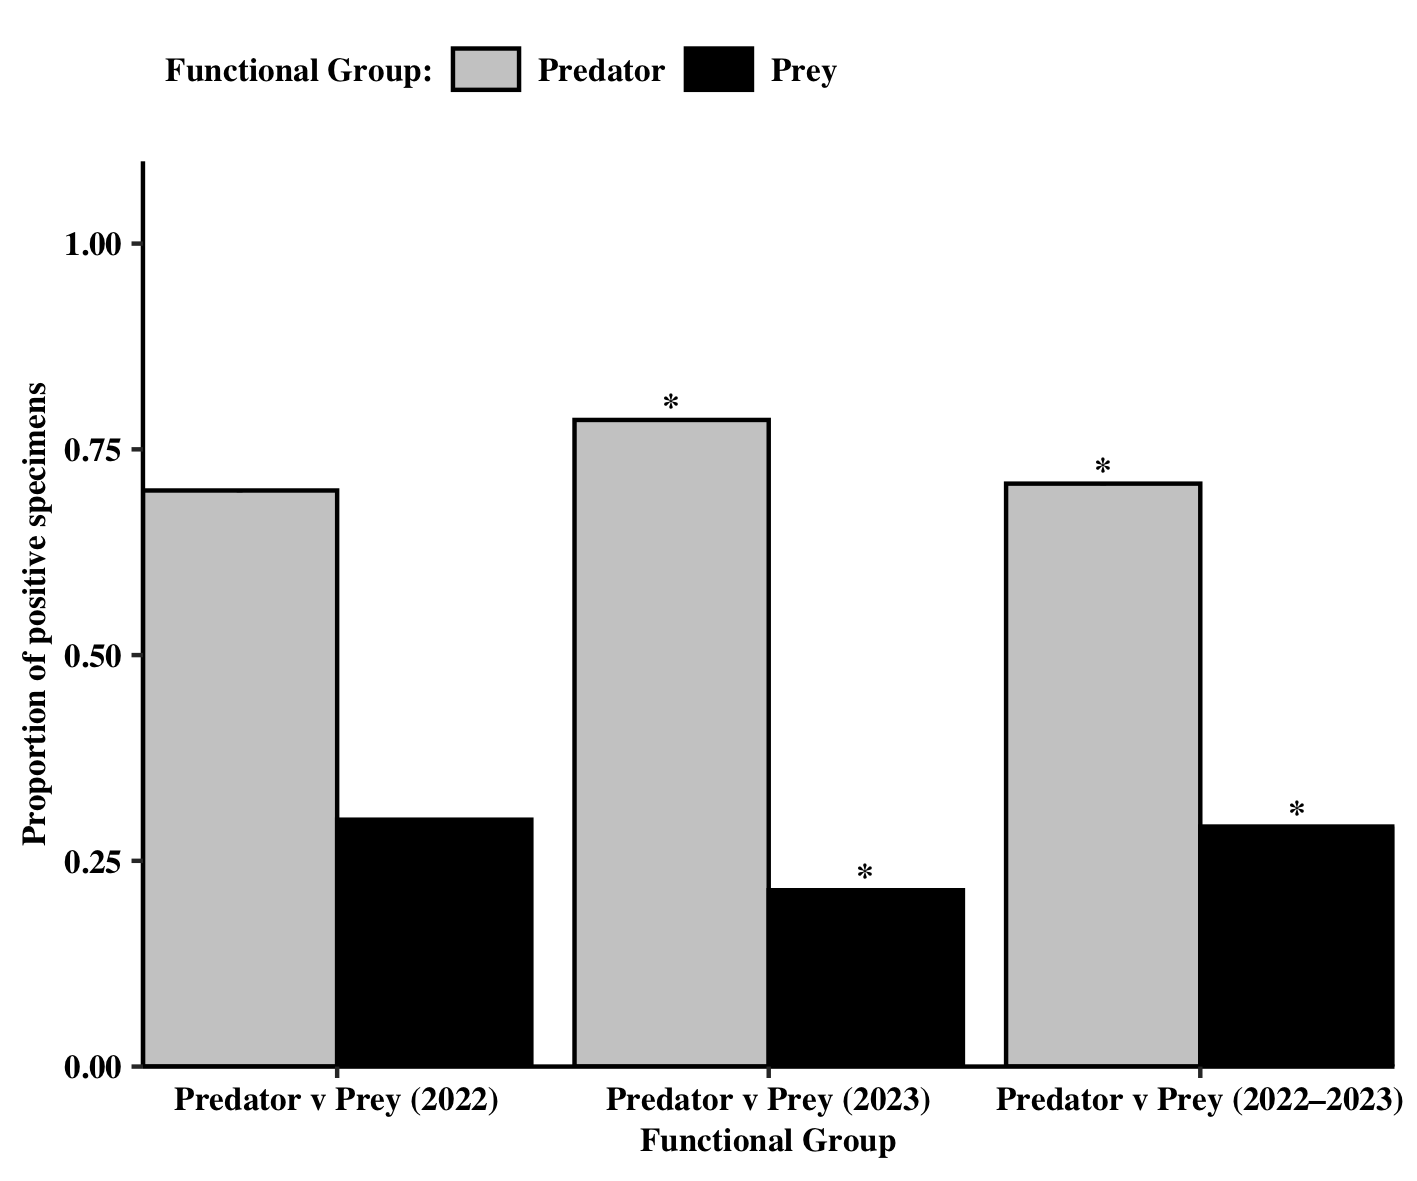
Of the specimens that were positive, arthropod type (Predator vs. Prey) was found to significantly influence the proportion of positive samples found (χ2 = 4.17, df = 1, P = 0.0412). A significant predator:prey ratio of 2.4:1 was observed across the two-year sampling period (Figure 6). When looking at each year individually, only in 2023 did arthropod type influence the number of positive samples (χ2 = 4.57, df = 1, P = 0.0325). The proportion of positive predator samples was significantly higher than that of pests.
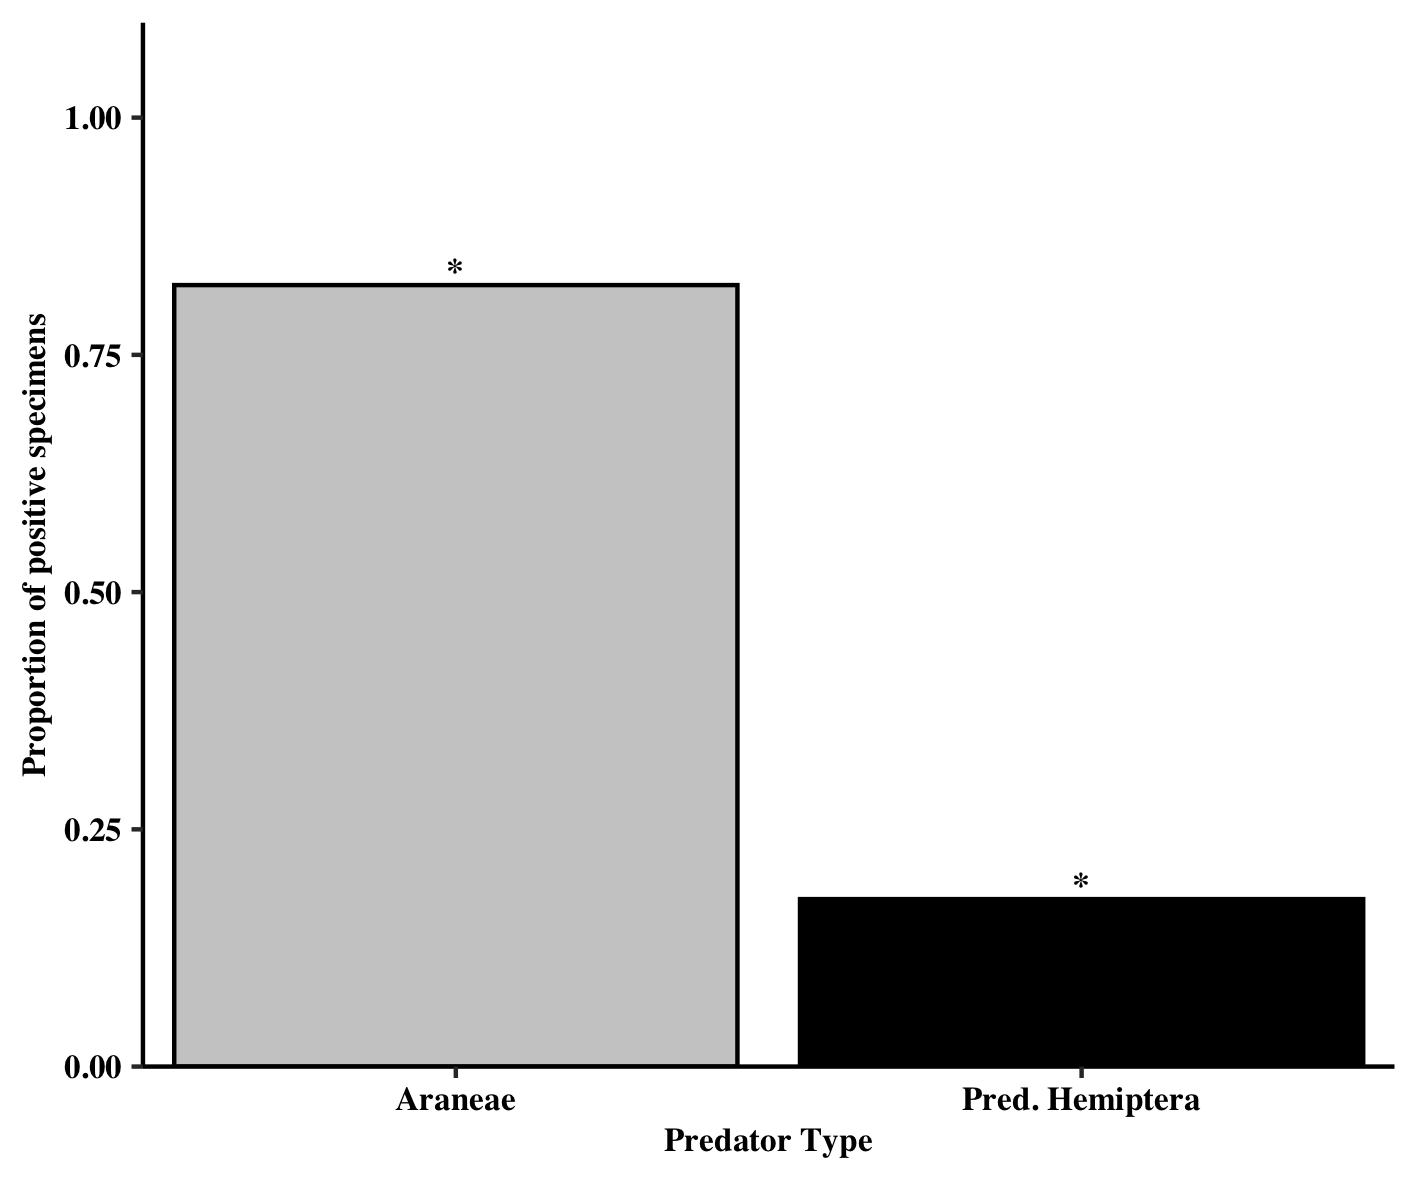
Of the predator specimens that moved, all came from one of two groups, Araneae and predaceous Hemiptera (i.e., Anthocoridae, Geocoris spp.). The type of predator (Araneae vs. Pred. Hemiptera) was also found to affect the proportion of positive specimens (χ2 = 7.12, df = 1, P = 0.0076). Significantly more Araneae were found to have moved into soybean relative to predaceous hemipterans (4.7:1 ratio) (Figure 7).
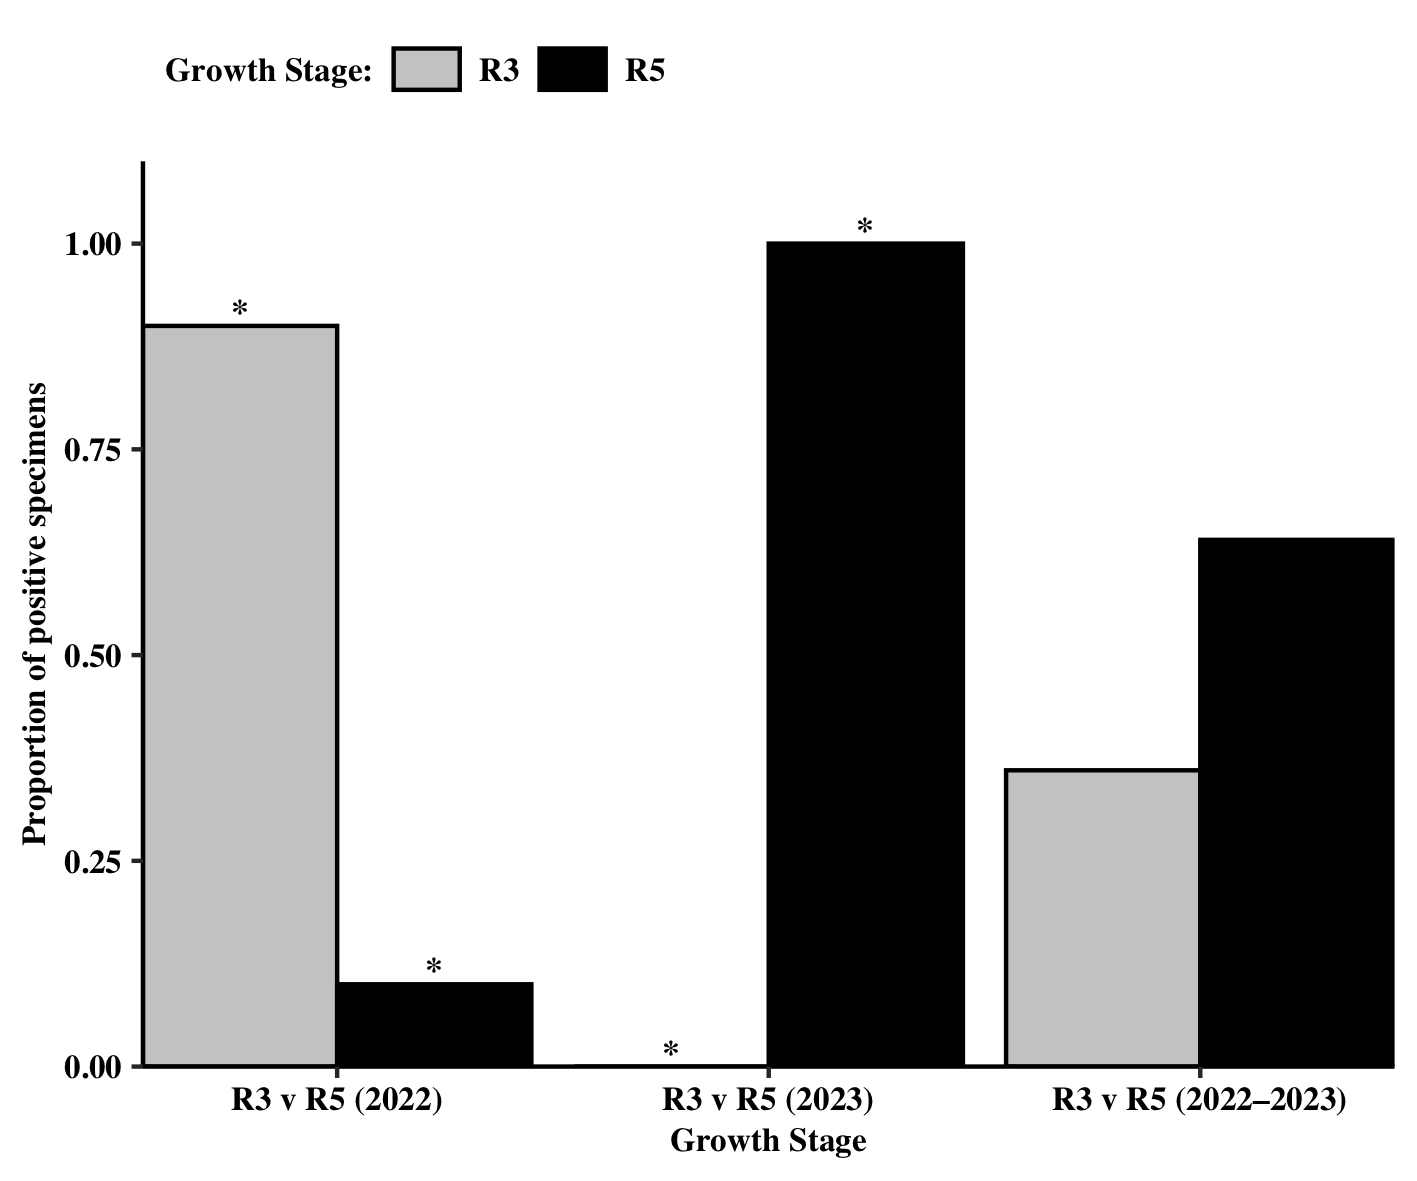
Over the two-year sampling period, the soybean growth stage at which sampling took place (R2/R3 vs R5/R6) was not found to influence the proportion of positive specimens, However, when looking at each sampling year individually, a significant growth stage effect was found (Growth Stage 2022: χ2 = 6.40, df = 1, P = 0.0114; Growth Stage 2023: χ2 = 15.00, df = 1, P = 0.0001). In 2022, more positive specimens were found to have moved during the R2/R3 growth stage relative to the R5/R6 growth stage (Figure 8). Conversely, the proportion of specimens that moved during the R5/R6 growth stage in 2023 was significantly higher than those who moved at the R2/R3 stage.
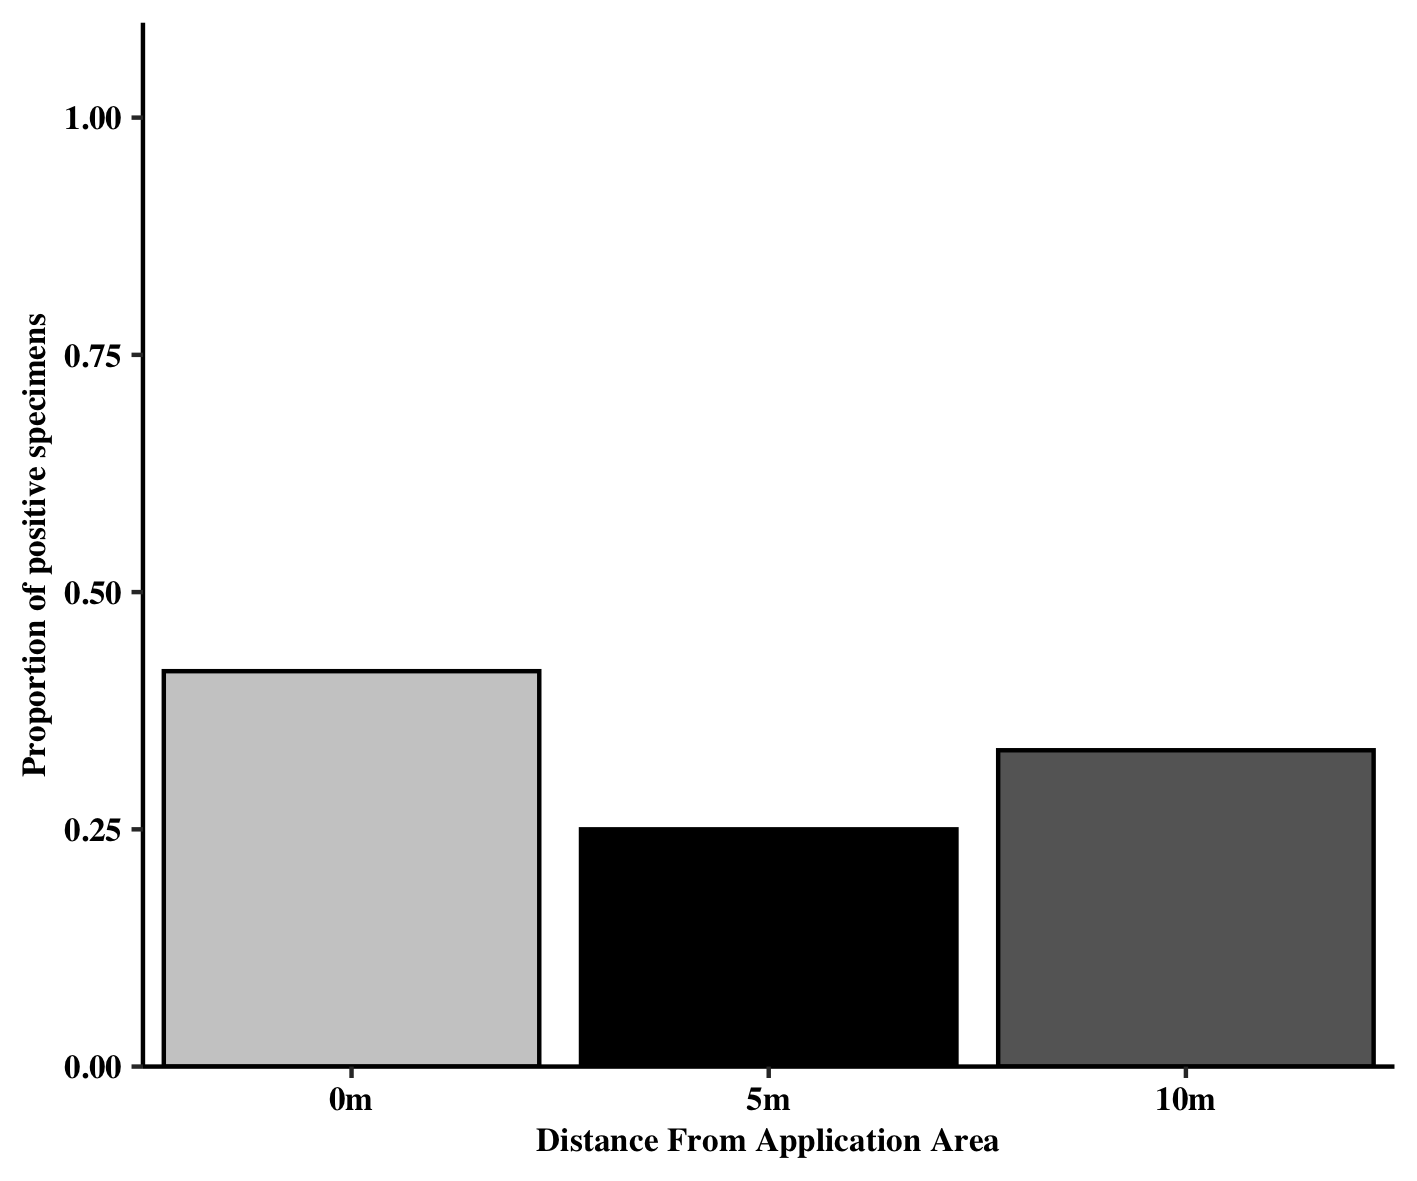
Specimens were collected at three different distances (0 m vs 5 m vs 10 m) from the marked conservation planting on transects moving into the adjacent soybean field. Assessment of whether the distance from the marked area impacted the proportion of positive specimens revealed no effect.
The lack of specimens deemed to have positively moved into soybean from the adjacent conservation plantings may suggest that although these areas harbor predators and pests, conservation planting may act as sinks. Alternatively, the lack of positive results may have been caused by the frequency and timing of applications in this study. Results from Objective 1 suggest that numbers of predators and pests are more abundant earlier in the year. The timing of our applications at R2/R3 and R5/R6 may have been too late to observe any movement. Additionally, the number of applications (two) may be too infrequent to sufficiently observe movement. Although movement was minimal, the majority of the specimens that moved came from predator groups. This may indicate that conservation plantings do provide some migration of natural enemy population into adjacent crops like soybean.
Educational & Outreach Activities
Participation summary:
This research was highlighted in a SARE web article (See products) in 2022. Results from this project will be presented at upcoming entomological and Louisiana grower meetings.
Project Outcomes
Soybean growers in Louisiana rely heavily on the use of chemical control tactics for pest management. With the negative impacts on agroecosystem and the beneficial species that reside in these systems becoming more apparent, there is a need for more sustainable management tactics. Results from this study suggest that use of the Conservation Stewardship Program may benefit soybean growers in Louisiana. High abundances of predator groups (i.e., Araneae, Formicidae, and predacious Hemiptera) were observed at all of the sampled sites in this project. Additionally, certain soybean pest groups (i.e., Pentatomidae) were found in some of the areas, but these were observed in smaller abundances relative to natural enemy groups. Across the two-year sampling period, arthropod groups were more numerous in these plantings earlier in the season compared to later. This potentially indicates their movement from the conservation planting into the adjacent soybean. Unfortunately, only a small amount of specimens were deemed positive by the mark-and-capture technique. Of the specimens that were positive, significantly more were predator species. This suggests that natural enemies comprise the majority of individuals that do move from these conservation plantings into adjacent soybean. Although we did not look at the natural enemy abundance in these areas relative to those not planted next conservation plantings, one of the growers we collaborated with did state he noticed higher numbers of natural enemies in his soybean crop. Future studies should look into whether the use of the Conservation Stewardship plantings do increase natural enemy abundances in adjacent cropping systems.
The integration of certain alternative management tactics like conservation biological control into large scale field crop production can be challenging due multiple factors, including risk and the lack of immediate observable returns. Part of why we looked at the Conservation Stewardship Program was because growers are already enrolled in the program and have already adopted these conservation tactics. We believe that with this program the integration of more sustainable agriculture is possible, especially after some our observations in this project. We were amazed at the abundance of potentially beneficial species (i.e., natural enemies) that were present in some of these areas. The best part was that many of these areas required very little maintenance over the course of the project period. Our opinions have definitely changed about the potential integration of certain tactics into integrative pest management plans in soybean production systems. Related projects and collaborations looking at the benefits of the conservation plantings will continue into the future.