Final report for GS21-246
Project Information
Broccoli is a high-value specialty crop that has increased production in recent years within the southeastern U.S. Considered a cold specialty crop, broccoli is very sensitive to the current scenario of climate change. In the southeastern U.S., the weather variability makes broccoli cultivar yield and time to maturity more difficult to predict, creating challenges to crop management practices for broccoli growers and affecting crop yield. The objective of this project was to develop a crop model that simulates broccoli growth and yield for common cultivars grown in the southeastern U.S. and to evaluate the effects of the weather variability of subtropical conditions of the southeastern U.S. on broccoli growth and yield by submitting the proposed crop model to different weather scenarios. Field experiments were conducted during the spring and fall seasons of two consecutive years. Experiments were conducted at the E.V. Smith Research and Extension Center of Auburn University in Shorter, AL, and in collaborator growers. Field trials evaluated the following broccoli cultivars: Emerald Crown, Eastern Crown, Castle Dome, Green Magic, Gipsy, Belstar, and Imperial. Results indicated that daily air temperature (i.e., heat stress) was the main weather parameter affecting broccoli yield. Regardless of cultivar, broccoli grown during the spring growing seasons had lower yields compared to broccoli grown during the fall. This was mostly due to favorable daily air temperature in the fall. However, results indicated that cultivar selection should consider not only yield potential in an individual season but also uniformity of yield across growing seasons, and cultivars Castle Dome, Eastern Crown, and Emerald Crown were consistently among the top-yielding cultivars in both seasons. The developed broccoli crop model had a high accuracy in simulating broccoli total yield (R2=0.85), which had an average prediction yield of 16,000 lb/acre, regardless of the growing season. Ultimately, a cumulative probability analysis of predicted broccoli total yield ranged from 8,000 lb/acre to 18,800 lb/acre, in which broccoli production had a 100% chance of having a yield of 8,000 lb/acre. The cumulative probability of yield had a median probability (50%) of having a yield of 14,000 lb/acre and a low (10%) probability of a yield of 18.800 lb/acre. In conclusion, results from our project confirmed that broccoli grown during the fall season has an increased likelihood of higher yields than broccoli grown in the spring due to favorable daily air temperatures during this period. Consequently, growers must properly determine planting dates and cultivar maturity to achieve potential yields.
The objective of this project was to develop a crop model that simulates broccoli growth and yield for common cultivars grown in the southeastern U.S. and to evaluate the effects of the weather variability of subtropical conditions of the southeastern U.S. on broccoli growth and yield by submitting the proposed crop model to different weather scenarios.
Research
Field experiments
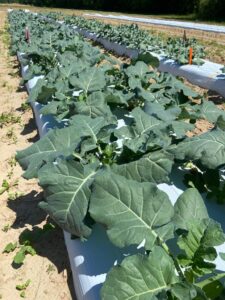
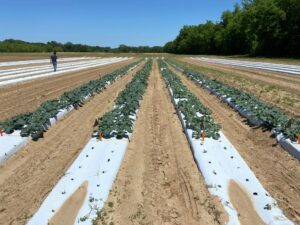
Field experiments were conducted during the spring and fall seasons of 2021 and 2022 in the E.V. Smith Research and Extension Center from Auburn University, Shorter, AL. In 2021, field experiments were conducted from March 21 to June 12 during the spring and September 9 to December 16 during the fall. In 2022, broccoli growing seasons were from March 13 to May 31 in the spring and September 25 to December 15 in the fall. For all growing seasons, we have used 7 broccoli cultivars, classified among those most grown in the southeastern U.S., which were arranged in a complete randomized block design with 4 replications. Broccoli cultivars were Emerald Crown, Eastern Crown, Castle Dome, Green Magic, Gipsy, Belstar, and Imperial.
Soil in the experimental area was classified as loamy sandy with low water holding capacity. Climate of the region was classified as a subtropical climate according to the Koppen climate classification. Both soil and climate conditions are representative of most broccoli fields in the southeastern U.S., while crop management practices followed the Alabama Cooperative Extension System recommendations, so crop stresses were controlled as much as possible.
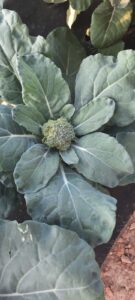
During field experiments daily maximum and minimum air temperature, and rainfall events were monitored using a weather station installed on-site. Weekly monitoring of crop canopy was conducted to define broccoli crop development, such as vegetative stage, flowering, head formation, and maturity. Plant samples were collected weekly for evaluation of LAI and biomass accumulation. Each sample was comprised of two representative plants of each plot. Plants were split into leaves, stems, and heads. The fresh weight of each plant tissue was recorded. The LAI was measured using a Plant Analyzer (LAI-3100C, LI-COR, Inc., Lincoln, NE.). Subsequently, samples were oven-dried at 150 °F for constant weight, and dry weight was recorded. Ultimately, broccoli heads were harvested at maturity, and total weight was recorded. Broccoli heads were also measured for head height and width.
Broccoli crop model
Our broccoli crop model was created using an adaptation of the approach proposed by Carranza et al. (2008), in which cultivar coefficients and experimental and weather data were used as input for the model evaluation. Particularly, field experiment data from both the spring and fall of 2021 were used for model calibration, while data from the spring and fall of 2022 were used for model validation. Ultimately, model performance was evaluated by comparing simulated and observed data, where a Pearson correlation was calculated between the predicted and observed yield values from 2022, confirming the model's accuracy in predicting yield based on daily air temperature data.
The proposed broccoli crop model simulated daily biomass accumulation, on a day-by-day basis, calculating biomass using daily air temperature (Tmax and Tmin), growing degree days (GDD), and calculating yield using a harvest index (HI) estimated from the field experimental data.
After the broccoli crop model evaluation, it was imposed to long-term weather simulations, in which a bootstrap resampling method was used allowing us to create a weather variability where daily temperature changed for a period of 20 years. This method estimated the distribution by repeated sampling with replacement from the original dataset. The bootstrap method equation is:
where is the estimate of the statistic of interest (e.g., mean temperature or GDD); B is the number of resampling conducted; is the statistic calculated from each resampled dataset.
After simulating historical daily air temperature using the bootstrap function, the 20 years of data generated calculated the daily GDD (equation 2); subsequently, it predicted biomass accumulation using a second-degree regression analysis, as expressed in equation 3.
The GDD was calculated using the standard equation:
Where Tmax and Tmin are the daily maximum and minimum air temperatures, and Tbase is the base air temperature (50F)
where Y is the predicted yield; X1, X2, X3 are the independent variables (biomass accumulation, HI, and daily air temperature, respectively); 𝑎 is the intercept; b, c e d are the linear coefficients; e, f e g are the quadratic coefficients.
Ultimately, broccoli total yield was calculated by multiplying the total biomass by the HI, which represents the proportion of total biomass accumulation that is allocated to the economic yield (e.g., heads of broccoli). For this simulation, an HI value ranging from 0.45 to 0.55 was used based on previous field trials.
Statistical analysis
All statistical analyses, simulations, and model adjustments were conducted using the R Studio software (version 4.0.2), RStudio (RStudio Team 2020, Boston, MA, USA). Particularly, field experimental data was analyzed using linear mixed techniques, where all response variables were analyzed using cultivar within year and season as fixed effects. Blocks within each year and season were considered a random effect. When the F value of the analysis of variance was significant, least-square means comparisons were performed using Tukey’s Honest Significant Difference Test (p < 0.05). In addition, a multivariate analysis was performed, where the dissimilarity among all response variables was measured by the Euclidean distance and presented as a cluster analysis, built based on a hierarchical unweighted pair-group method using arithmetic averages. Ultimately, all data were submitted to a principal component analysis (PCA) to verify the contribution of all variable responses to the construction of the principal components. A correlation-based network analysis was also performed using Pearson’s method.
Weather conditions impact on broccoli production
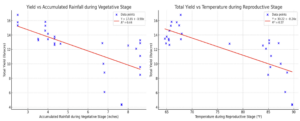
Multiple linear regression analysis indicated that accumulated rainfall during the vegetative stage of crop development had significant negative effect on broccoli total yield. Figure 1 illustrates this relationship, where a strong negative linear trend between accumulated rainfall and yield is clear. Similarly, maximum daily air temperature during the reproductive stage was negatively correlated with broccoli total yield. Elevated temperatures during this stage had a negative effect on yield (Figure 1).
The impact of heat stress on biomass accumulation, consequently, on head width and head height, which are indicators of head quality, were also evaluated (Figure 2). Our regression models were statistically significant for the impact of heat stress on biomass accumulation, and figure 2 shows the clear impact it had, in which biomass accumulation reduced with the increase in heat stress. Contrarily, biomass accumulation and head width had a significant positive correlation.
Figure 1. Correlation between broccoli total yield and accumulated rainfall during the vegetative stage (left) and between total yield and maximum daily air temperature (right) during the reproductive stage for broccoli grown in spring and fall seasons of 2021 and 2022.
Figure 2. Correlation between head stress and biomass accumulation (left), head width and biomass accumulation (center), and between heat stress and biomass accumulation (right) for broccoli grown in spring and fall seasons of 2021 and 2022.
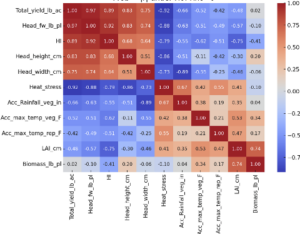
Correlation analysis provided insights between the relationship between total yield and agronomic or environmental factors. The strongest positive correlations with yield were identified for head fresh weight per plant (r=0.97), in which the heavier the heads the higher was total yield, and for head height (r=0.83) and head width (r=0.75), in which larger heads lead to higher total yield. Results that confirm the importance of head size on broccoli productivity.
Contrarily, the following factors negatively impacted broccoli total yield: heat stress (r=−0.92), accumulated rainfall during the vegetative stage (r=−0.66), and daily maximum air temperature at reproductive stage (r=−0.75). This was previously stated but can also be seen in figure 3 that shows a correlation matrix for all variable responses evaluated.
Figure 3. Correlation matrix for all variable responses evaluated for broccoli grown in spring and fall seasons of 2021 and 2022.
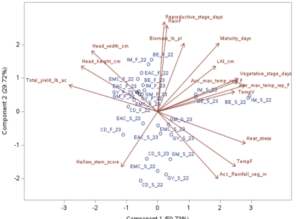
The Principal Component Analysis (PCA) was conducted to identify patterns and cases where variables are not independent. Figure 4 shows the outcome of the PCA analysis, in which the first principal component (Component 1) accounted for 50.73% of the variance, while the second component (Component 2) explained 29.72%. Together, these two components capture 80.45% of the total variability in the dataset.
As expected, the PCA indicated that broccoli total yield was strongly influenced by head width and head height, which are positively correlated with each other, emphasizing that larger head size plays a critical role in increasing total yield. Contrarily, environmental factors, such as heat stress and excessive rainfall during the vegetative stage, showed the clear negative impact on yield, indicating that minimizing these factors is essential for optimizing productivity.
The analysis also shows that biomass and leaf area index are associated with longer maturity days and extended vegetative stages, suggesting that while these factors contribute to overall biomass accumulation, they do not necessarily lead to higher total yield. This highlights a potential trade-off between vegetative growth and yield. Finally, extremes daily air temperatures during both vegetative and reproductive stages negatively influence yield, aligning with other environmental stress factors like heat stress, as previously stated.
Figure 4. Principal component analysis using all dataset collected during broccoli productoin in spring and fall seasons of 2021 and 2022.
Broccoli cultivar selection
Table 1 shows the impact of year and season on total yield of broccoli cultivars, while it is statistically comparing the total yield of cultivars within each season. Broccoli yield varied significantly across both years and seasons. The average total yield among cultivars in 2022 was 14,612 lb/ac in the fall season and 8,330 lb/ac in the spring season. In 2023, the fall season had an average yield of 14,239 lb/ac, while the spring season had an average yield of 11,376 lb/ac. In general, results suggested that fall season consistently had higher yields compared to spring season in both years, 2021 and 2022.
In the spring of 2022, significant differences were measured among cultivars, and cultivars Castle Dome (12,882 lb/ac) and Eastern Crown (11,741 lb/ac) had the highest yields. Cultivar Belstar (4,329lb/ac) had the lowest yield. In the fall of 2022, there were no significant differences among the cultivars. In the spring of 2022, significant differences were also measure among cultivars. Emerald Crown (13,271 lb/ac), Eastern Crown (12,872 lb/ac), and Castle Dome (12,551 lb/ac) had the highest yields. Cultivars Green Magic (12,103 lb/ac) and Gipsy (11,113 lb/ac) had a slightly lower yield compared to the top three cultivars. Cultivar Belstar (9,699 lb/ac) had a significantly lower yield than the top-yielding cultivars, and cultivar Imperial (8,023 lb/ac) had the lowest yield. Similarly to 2021, there were no significant differences in yield among cultivars in the fall of 2022.
Overall, there were favorable environmental conditions in the fall compared to the spring, indicating that broccoli grown during the fall season has more uniform yields than those grown during the spring, regardless of cultivar. Results indicated that cultivar selection should consider not only yield potential in an individual season but also uniformity of yield across growing seasons, and cultivars Castle Dome, Eastern Crown, and Emerald Crown were consistently among the top-yielding cultivars in both seasons. Particularly, there is still a need for adaptive management practices that account for seasonal rainfall and air temperature fluctuations to optimize broccoli yield. This is mostly due to the impact of heat stress and excessive rainfall during the vegetative stage, which were the most detrimental factors to broccoli total yield.
Table 1. Main effect of broccoli cultivar on total yield (lb/acre) within year (i.e., 2022 and 2023) and growing season (i.e., spring and fall).
|
|
Year |
||||||||
|
Cultivar |
2022 |
2023 |
|||||||
|
Spring |
Fall |
Spring |
Fall |
||||||
|
Castle Dome |
12,8824 |
a |
15,7798 |
a |
12,551 |
a |
14,618 |
a |
|
|
Eastern Crown |
11,7416 |
a |
15,3493 |
a |
12,872 |
a |
15,299 |
a |
|
|
Emerald Crown |
10,0303 |
ab |
16,7964 |
a |
13,271 |
a |
15,834 |
a |
|
|
Green Magic |
8,80472 |
abc |
13,2868 |
a |
12,103 |
ab |
13,783 |
a |
|
|
Gipsy |
6,11582 |
bc |
13,4635 |
a |
11,113 |
abc |
13,783 |
a |
|
|
Imperial |
4,40827 |
bc |
13,4201 |
a |
8,023 |
c |
12,854 |
a |
|
|
Belstar |
4,32986 |
c |
14,1885 |
a |
9,699 |
bc |
13,500 |
a |
|
The Broccoli Crop Model Performance
In general, the broccoli crop model evaluation, which includes model calibration and validation, had a R2 of 0.85 for broccoli total yield when observed data was compared to simulated data. This result indicated that 85% of the variation in broccoli total yield can be explained by the factors included in the model (i.e., air temperature). This confirms the reliability of the model in predicting yield under different environmental conditions. The remaining variation (15%) was most likely due to agricultural factors not included in the model, such as soil moisture levels or nutrient availability and others.
Therefore, our broccoli crop model did show to be an accurate tool addressing the impact of weather variability on broccoli production. Particularly, to address the impact of daily air temperature, which has been a challenge for growers when determining planting dates.
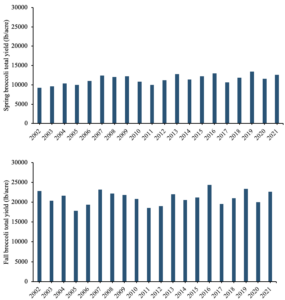
Once submitted to the seasonal analysis, using the 20 years of modified daily air temperature as different weather conditions, the broccoli crop model had a strong correlation between broccoli yield and daily air temperature. Figure 5 shows the broccoli total yield along the 20 years for the spring and fall growing seasons. The optimal growing conditions for broccoli were identified as temperatures ranged between 20°C and 25°C, with GDD accumulation between 600 and 900 units. The model predicted an average yield of 16,000 lb/acre, under this ideal condition, which was consistent with field observations in years with favorable temperature. In contrast, the model predicted lower yields when daily air temperature were lower than the optimum and GDD accumulated only 600 units. During these periods, biomass accumulation was slow, and the model forecasted yields in the range of 10,000 lb/acre. Nevertheless, it was the heat stress caused by high daily air temperatures that affected broccoli yield the most. Particularly, when temperatures exceeded 30°C, the model predicted yield reductions of 40%, and yields were as low as 8,000 lb/acre. This reduction can be attributed to the physiological effects of heat stress, where energy that would typically go toward biomass accumulation is instead used for crop maintenance and heat adaptation.
Figure 5. Simulated broccoli total yield for spring (top) and fall (bottom) growing seasons along of 20 years of weather variability.
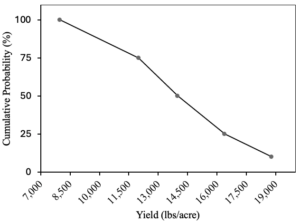
The cumulative probability of yield occurrence was calculated using the spring and fall growing seasons along the 20 years of data and it is shown in figure 6, where the distribution is ordered from the smallest to the largest value and plotted against equal increments of cumulative probability. Cumulative probability indicates that likelihood of a specific yield occurs, in other words, it is a probabilistic understanding of expected outcome under different temperature conditions.
Figure 6. Cumulative probability distribution calculated using the simulated broccoli total yield for the spring and fall seasons.
Yield values in the cumulative probability analysis ranged from 8,000 lb/acre to 18,800 lb/acre, in which broccoli production had 100% of chance of having a yield of 8,000 lb/acre. The cumulative probability of yield had a median probability (50%) of having yield of 14,000 lb/acre and low (10%) probability of yields of 18.800 lb/acre. Results highlight the potential for high yield in optimal temperature conditions but also indicate that less favorable conditions, such as heat stress, can inhibit biomass accumulation and reduce final yield.
Overall, the cumulative probability analysis provided insight into the variability and distribution of broccoli yield over 20 years of simulated data. Results confirmed field experiment observation and broccoli grown during the fall season have increased likelihood of higher yields than broccoli grown in the spring due to favorable daily air temperatures during this period. Consequently, growers must properly determine planting dates and cultivar maturity to achieve potential yields.
Educational & Outreach Activities
Participation summary:
Field experiments conducted in the fall of 2021 and spring of 2022 evaluated the performance of different broccoli cultivars for the environmental conditions of Alabama. Field experiments were conducted in the E.V. Smith Research and Extension Center and two collaborator growers. Data for the model development was collected and analyzed. Since the beginning of the project, individual consultations with growers were provided (14), two peer-review articles, focused on cultivar performance in spring and fall seasons as well as use of crop models account for weather variability for broccoli production, are under development for publication in the journals of the American Society of Horticultural Science (ASHS), two on-farm demonstration trials were conducted, two webinar were produced, reaching more than 200 growers and 22 extension people, and two newsletter articles were published.
Overall, field experiments were a success, data has been properly collected and analyzed. Results were shared with growers, and we do not anticipate any problem with having our peer review manuscripts published.
Project Outcomes
At the onset of our project, broccoli production in the southeastern U.S. was not as spread as it currently is. The specific challenges associated with its cultivation remained poorly understood but our research highlighted critical factors related to weather conditions that growers must consider when growing broccoli in this region. Notably, growers in Alabama have expressed a desire to expand broccoli production; however, further investigation into effective crop management practices is essential to support this emerging industry. For instance, managing nitrogen fertilizer in sandy soils poses significant challenges during periods of rainfall. In general, our study has enhanced the understanding of the impact of weather variability on broccoli production, but additional support is still necessary to sustain the growth of this industry.


