Final report for GS22-265
Project Information
One of the main grower's concerns every year is the completion of the chilling hour requirement for peach cultivars. During the spring season, peach growers face the challenge of making decisions about the occurrence of freeze events and the possibility of potential damage to the growing peach crops. The understanding of the physiological aspects of the crops and the interaction with events such as dormancy, growth cycle transitions, phenology, and growth development is a key determinant for planning and executing management practices. The goal of this study was to support peach growers with a phenological approach to best management practices. To determine the time required to reach bud break, and to determine the connection between cold and heat accumulation for peach development three peach cultivars (Prunus persica (L.), including Harvester, Redglobe, and Rubyprince were evaluated. Five samples of branch segments with base, mid-section, and Apex buds were collected for every cultivar on different dates, to follow the progression of chill accumulation- dormancy, bud break, and transitions of phenological stages. We evaluated under laboratory conditions the progression and development of floral and vegetative buds, coming from Chilton Alabama for different dates starting from September 2022 until March 2023. Among the cultivars evaluated, Harvester was the earliest cultivar in bud breaks followed by Rubyprince and Redglobe respectively. In our study, we characterized a total of seven stages for each cultivar based on the peach growth stages in Alabama. We assessed the dynamics of floral and vegetative budbreaks on approximately 1570 buds over two seasons. Out of these, 817 buds did not reach dormancy release due to insufficient chilling hours. In the first season (2021–2022), 173 floral buds reached the budbreak stage, with 46 of them completing the full bloom stage. In the second season (2022–2023), 342 buds reached the full bloom stage out of 580 recorded budbreaks. For the first season, the last sample of floral buds from the 'Harvester' and 'Red Globe' cultivars came from the field with 985 chilling hours accumulated until 18 February 2022. These buds reached budbreak, ensuring successive flower development. Similarly, 'Rubyprince' exhibited successful floral development in buds that accumulated 898 chilling hours. In the second season, most buds reached the full bloom stage with a previous accumulation of chilling hours ranging from 740 to 792 until 24 February 2023. These results highlight the importance of sufficient chilling accumulation for both budbreak and floral development stages leading up to the full bloom stage
- To determine the timing in dormancy and phenological stages transitions in selected peach cultivars for management practices recommendations.
- To analyze the influence of climate variability on phenological stages for selected peach cultivars under Alabama conditions.
Cooperators
- (Educator and Researcher)
- (Educator and Researcher)
- (Educator)
- (Educator and Researcher)
Research
Materials and methods:
Phenological stages transition
Five samples of dormant shoots were collected from ten-year-old peach trees of three commercial peach cultivars (Harvester, Redglobe, and Rubyprince), weekly starting - in late fall (September 23, 2022), to early Spring (March 3, 2023). Samples were taken from Chilton Research & Extension Center located at 120 County Road 756 Clanton, Alabama (32°55’14” N; 86°40’20” W) at 204 meters a.s. Samples were placed in plastic Ziploc bags to prevent drying out and transported in an ice cooler. Once in the laboratory, shoots were placed in beakers with 200 ml of water and activated carbon to prevent bacterial growth. The experiment took place under laboratory conditions. Observations were done daily to identify the time necessary in the transition between the stages to identify the transition among phenological stages (From Green Calyx until petal fall). Data were recorded in an Excel database for later analysis using the S.A.S program version 9.4.
Chilling and Heat requirements
To determine the chilling requirements needed in the dormancy release, four different chilling models, the Weinberger model, the modified Weinberger model, the Utah model, and the Dynamic model, were used during the season 2022–2023.
Weinberger Model
This model determines the accumulation of effective chilling hours at temperatures lower than 7.2 °C. Thus, one hour below this temperature represents one chilling hour. The chilling requirement (CR) was estimated as the sum of chill hours (CHs) using the following Equation (2) (Chandler, 1942; Weinberger, 1950; Miranda et al., 2013).
(1)
where CH = Chill Hour; T = temperature; °C = degree Celsius.
Modified Weinberger
This model uses a range of temperatures between 0 °C and 7.2 °C, therefore, one hour between that range will represent 1.0 chilling hours (Equation (3)) (Eggert, 1951; Razavi et al., 2011).
- hour between 0°C and 7.2°C = 1.0 chill hours (2)
Utah Model
This model considers that the effective accumulation of chilling units is possible due to the permanence of the floral buds in a range of 2.5 and 12.5 °C for 1 h. The Utah model includes relative chilling and negative chilling accumulation. It determines that temperatures below 0 °C have a null effect on the accumulation of chill hours, and those temperatures above 16°C have negative chill accumulation (Chhetri et al., 2018; Richardson et al., 1974).
Dynamic Model
The Dynamic model estimates chill portions using the maximum effectiveness of chilling hours at 6 °C and the null effect when the temperature is equal to −2 ◦C and 14 °C. This model considers that the effect of the high temperatures depends on the duration, cycle length, and level (Erez et al., 1979; Fishman et al., 1987; Erez et al., 1990; Luedeling et al., 2009; Chhetri et al., 2018). The Chilling portions were estimated using an Excel format (Glozer, 2016).
Growing Degree Days
To determine the heat requirements necessary in the development of floral buds, the Growing Degree Days were used (HR) in terms of thermal time (TT) and were determined as the accumulation of the difference between the daily average temperature (Ti ) above the base temperature (Tb) (Richardson et al; 1974; Pulido et al., 2008) (Equation (1)).
TT is the thermal time, accumulated from the first day (i) of September (2022) until the day when dormancy release occurred (n), Tb of 4.5°C was used for the calculation of the thermal time (Citadin et al., 2001; Atagul et al., 2022; Łysiak and Szot, 2023; Cifuentes-Carvajal et al.,2023).
TT =∑_(i=1)^n〖(Ti-Tb)〗 (3)
Influence of climate variability on phenological stages
Data collected included the number of days needed in the floral progression and climate information such as air temperature. We used temperature records that include 2022, and 2023 years from the Chilton Research and Extension Center and previous records for 2021 and 2022. Hourly temperatures were calculated using the simple accumulated hours <7.2 °C model to calculate chilling accumulation. Once samples reached the dormancy release, remained in the laboratory under the same temperature conditions. Daily observations were done to record the floral bud stages. Each stage was determined in terms of days and heat requirements using Growing Degree Days. The bud stages identified were as follows: Green calyx or budbreak, Inch Green, Pink, First Bloom, Full Bloom, and petal fall, described as the moment when petals fall off easily (Hortan and Johnson, 2005).
Results and discussion
Phenological stages transition
We evaluated a total of 1,258 buds including floral and vegetative buds through daily observations from three commercial peach cultivars, which come from 23 sampling dates from Chilton AL, starting on September 2022 until March 2023. In total, it was observed that only 884 bud breaks occurred distributed as 584 floral bud breaks, and 300 vegetative bud breaks. Harvester was the earliest cultivar in bud breaks followed by Rubyprince and Redglobe respectively (Table 1). For the season 2022 - 2023 bud breaks started on January 2, 2023, and finished on March 20, 2023.
Table 1. Total bud breaks per cultivar and the early, late, and average date of bud breaks (BB).
|
Cultivars |
Vegetative BB |
Floral BB |
E. Date |
L. Date |
A. Date |
|
Harvester |
109 |
251 |
1/2/2023 |
3/20/2023 |
3/1/2023 |
|
Redglobe |
118 |
161 |
1/17/2023 |
3/19/2023 |
2/26/2023 |
|
Rubyprince |
73 |
172 |
1/9/2023 |
3/19/2023 |
2/26/2022 |
|
Total Veg. & Floral BB |
300 584 |
||||
We used statistical procedures to establish correlations between variables such as bud position, bud type, and the days to reach the dormancy release among cultivars. Regarding the dormancy releases in floral buds, there were significant differences between the Harvester and Redglobe cultivars (p < 0.05), but there were no differences between Harvester-Rubyprince and Redglobe-Rubyprince as shown in Table 2.
Table 2. P-values for the comparison among peach cultivars.
|
Differences of Cultivar Least Squares Means |
|||||||
|
Cultivar |
Cultivar |
Estimate |
Standard Error |
DF |
t Value |
Pr > |t| |
Adj P |
|
Harvester |
Redglobe |
-5.9658 |
1.8312 |
579 |
-3.26 |
0.0012 |
0.0034 |
|
Harvester |
Rubyprince |
-1.4584 |
1.7818 |
579 |
-0.82 |
0.4134 |
0.6917 |
|
Redglobe |
Rubyprince |
4.5074 |
1.9846 |
579 |
2.27 |
0.0235 |
0.0607 |
Significant differences between the Apex and Base positions in floral bud breaks were found (p < 0.05), while Apex-Mid and Base-Mid positions were not significant Table 3.
Table 3. P -values for the comparison between bud positions (A: Apex, M: Mid, and B: Base).
|
Differences of Bud_position Least Squares Means |
|||||||
|
Bud_position |
Bud_position |
Estimate |
Standard Error |
DF |
t Value |
Pr > |t| |
Adj P |
|
A |
B |
-7.5366 |
2.0236 |
579 |
-3.72 |
0.0002 |
0.0006 |
|
A |
M |
-3.2902 |
1.6825 |
579 |
-1.96 |
0.0510 |
0.1243 |
|
B |
M |
4.2464 |
2.0091 |
579 |
2.11 |
0.0350 |
0.0880 |
Furthermore, the interaction between Cultivar and bud type was significant as Table 4 shows.
Table 4. P values for cultivars, bud position, bud type, and the interaction between cultivars and bud type.
|
Type III Tests of Fixed Effects |
||||
|
Effect |
Num DF |
Den DF |
F Value |
Pr > F |
|
Cultivar |
2 |
876 |
8.63 |
0.0002 |
|
Bud_position |
2 |
876 |
14.52 |
<.0001 |
|
Type_bud |
1 |
876 |
38.58 |
<.0001 |
|
Cultivar*Type_bud |
2 |
876 |
3.12 |
0.0446 |
The frequency of floral and vegetative bud breaks was determined as the number of dormancy releases through time for each cultivar (Fig. 1).
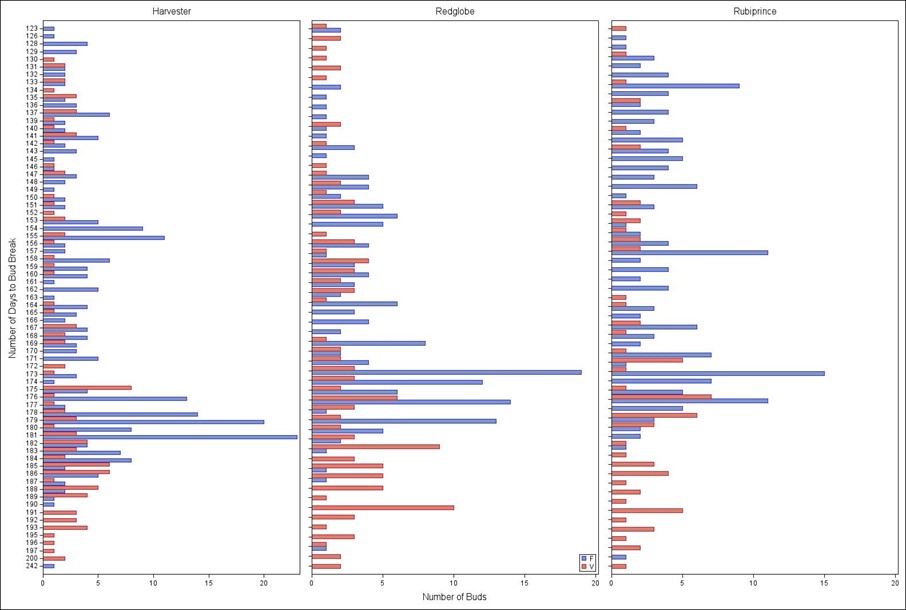
Harvester was the cultivar with the highest frequency of floral breaks followed by Redglobe and Rubyprince. Most of the floral and vegetative bud breaks were observed during late February and early March 2023, considering that the initial date of the experiment was September 1, 2022. The days with the highest frequency of bud breaks are shown in Table 5.
Table 5. Summary of the days (From September 1 until bud break date) with the highest frequency of dormancy releases.
|
Cultivars |
Most frequent day in floral bud breaks |
Most frequent day in vegetative bud breaks |
|
Harvester |
181 |
175 |
|
Redglobe |
178 |
192 |
|
Rubyprince |
178 |
181 |
The total chilling hours were calculated for each of the cultivars during the earliest, late and average floral dormancy release period (Table 6).
A minimum of 466 and a maximum of 864 chilling hours were accumulated for all the cultivars evaluated, ranging from the earliest until the latest bud breaks. The calculation of heat requirements for all stages is still in progress.
Table 6. Total chilling hours accumulated during the dormancy release.
|
Floral bud breaks and chilling accumulation |
||||
|
Cultivar |
Bud break date |
Days bud break |
Chilling hours |
|
|
Harvester |
Early |
1/2/2023 |
123 |
466 |
|
Mean |
3/1/2023 |
181 |
816 |
|
|
Late |
3/10/2023 |
190 |
816 |
|
|
Redglobe |
Early |
1/17/2023 |
138 |
580 |
|
Mean |
2/26/2023 |
178 |
816 |
|
|
Late |
3/16/2023 |
196 |
864 |
|
|
Rubyprince |
Early |
1/15/2023 |
136 |
571 |
|
Mean |
2/26/2023 |
178 |
816 |
|
|
Late |
3/6/2023 |
186 |
816 |
|
Heat and Chilling Requirements
A significant high correlation among all the chilling models was found for the season evaluated; GDD was negatively correlated with all the chill accumulation models (Table 7). These results suggest that any of the models can be used for chill accumulation combined with GDD.
Table 7. Pearson correlation coefficients for chilling and GDD models for 2022-2023 years.
|
Season 2022-2023 |
|||||
|
Weinberger M. |
1 |
0.99571 |
0.93185 |
0.99379 |
-0.24014 |
|
<.0001 |
<.0001 |
<.0001 |
0.0001 |
||
|
Modify W. |
0.99571 |
1 |
0.94573 |
0.99825 |
-0.22346 |
|
<.0001 |
<.0001 |
<.0001 |
0.0004 |
||
|
Utah |
0.93185 |
0.94573 |
1 |
0.95211 |
-0.13096 |
|
<.0001 |
<.0001 |
<.0001 |
0.0389 |
||
|
Dynamic |
0.99379 |
0.99825 |
0.95211 |
1 |
-0.20826 |
|
<.0001 |
<.0001 |
<.0001 |
0.0009 |
||
|
GDD |
-0.24014 |
-0.22346 |
-0.13096 |
-0.20826 |
1 |
|
0.0001 |
0.0004 |
0.0389 |
0.0009 |
|
|
Model Integration for Chill and Heat Requirements
Using 3D graphs the chill and heat requirements were combined to evaluate the distribution of budbreaks in the vegetative and floral buds. An example of the Weinberger model is presented as a result (Figure 2), these 3D graphs explained the negative correlation found between chilling and heat models. Therefore, while the chilling requirements increased the heat requirements were less, and vice versa, thus the percentage of budbreak was in function of this correlation, and this tendency was observed for both bud types.
Influence of climate variability on phenological stages
Once the budbreak stage was determined for each cultivar, the floral stages were characterized for the cultivars evaluated (Figure 4), according to the classification described for peach growth stages in Alabama and Southeastern Peach Growers’ Handbook (Hortan and Johnson, 2005, Coneva, 2022). The evaluation of chilling requirement in a progressive methodology allowed analyze the effect of the different winter scenarios simulated in this experiment on the progression of floral bud. For the period evaluated (2022-2023), most of the buds reached the full bloom stage with a previous chilling accumulation in a range of 740 to 792 chilling hours, which confirm the relevance of the completion of chilling requirements for the floral progression until full bloom stage. Rubyprince’ was the cultivar with the best performance regarding to the progression of the stages including the full bloom. Most of the buds that reached the full bloom stage came from ‘Rubyprince’ cultivar.
Thermal requirements
In terms of heat requirements, the floral bud progression in the cultivars assessed needed between 425.5 to 777 GDD. Pink, first bloom, full bloom, and petal fall were the stages with the highest demand of GDD. Once samples reached the budbreak, they needed between 25 to 28 days during the season assessed. ‘Rubyprince’ was the most delayed cultivar in the floral progression, followed by ‘Harvester’ and ‘Red Globe’.
Table 1. Floral bud progression in terms of GDD and days for each cultivar and season.
|
Cultivar |
Stage |
Season 2022-2023 |
|
|
GDD required |
Days required |
||
|
Harvester |
Budbreak |
1744.4 - 1993.4 |
123 - 190 |
|
Red Globe |
1794.3 - 2104.4 |
138 - 196 |
|
|
Rubyprince |
1757.3 - 1994.5 |
136 - 186 |
|
|
Harvester |
Inch Green |
18.5 - 92.5 |
1 - 5 |
|
Red Globe |
18.5 - 74 |
1 - 4 |
|
|
Rubyprince |
18.5 - 74 |
1 -4 |
|
|
Harvester |
Pink |
18.5 - 129.5 |
1 - 7 |
|
Red Globe |
18.5 - 129.5 |
1 -7 |
|
|
Rubyprince |
18.5 - 129.5 |
1 - 7 |
|
|
Harvester |
First Bloom |
18.5 - 148 |
1 - 8 |
|
Red Globe |
18.5 - 129.5 |
1 - 7 |
|
|
Rubyprince |
18.5 - 148 |
1 - 8 |
|
|
Harvester |
Full Bloom |
18.5 - 148 |
1 - 8 |
|
Red Globe |
18.5 - 129.5 |
1 - 7 |
|
|
Rubyprince |
18.5 - 148 |
1 - 8 |
|
|
Harvester |
Petal Fall |
37 - 240.5 |
2 - 13 |
|
Red Globe |
37 - 222 |
2 - 12 |
|
|
Rubyprince
|
18.5 - 277.5 |
1 - 15 |
|
Educational & Outreach Activities
Participation summary:
EDUCATIONAL AND OUTREACH ACTIVITIES
As part of the educational development and dissemination of the present project participation in several academic events, has been taking place. An oral presentation titled “ End of dormancy determination, bud break, and the transition of floral bud progression for three peach cultivars Prunus persica (L)” was given at the Southeastern Professional Fruit Workers Conference, on November 14-16, 2022, hosted by the UF/IFAS Research and Education Center, University of Florida. The audience consists of undergraduate, Master's, and Ph.D. students as well as, USDA scientists and stakeholders, staff from Clemson, Florida, Georgia, Rutgers, and Auburn University were part of the audience.
During the 2023 year, we have participated in events such as an oral presentation called “Influence of intermittent temperature in peach bloom phenology”, in the 2023 ASHS Southern Region Annual Meeting, which took place in Oklahoma, on February 3.
Every year Auburn University promotes the dissemination of student research projects where the research based on sciences, arts, and other professional programs is presented through a symposium of Student and Faculty Research on March 28, 2023. A poster presentation titled “Understanding dormancy release in peach flower buds (Prunus persica L.)” was performed.
In the same way, we took part in the Alabama Peach Growers meetings for this year hosted by the extension team at Chilton Research & Extension Center, where growers and researchers were gathered around the different production challenges. Attendance and participation for the “Peach Production Meeting” on January 18, 2023, and on March 22, 2023, this last was about “Mating Disruption Pheromones for Control of Peach Tree Borer.
We participated in the 2023 ASHS (American Society for Horticultural Science) Annual Conference with an oral presentation called “Modeling the Effect of Temperature Variation on Peach Dormancy Release” and the poster competition, with the title “Evaluation of Floral Progression in Three Peach Cultivars Prunus persica (L), which took place at Orlando, FL on July 31- August 04.
Project Outcomes
Supporting decision-making for farmers at the local level, this project has allowed the evaluation under laboratory conditions of three commercial peach cultivars, understanding the transition of phenological states from dormancy to petal fall, as an initial stage of fruit development. This is associated with the weather conditions of Chilton Alabama as the largest producer of peaches in Alabama.
The development of the different phases of the project has allowed the learning of peach physiology with a focus on production, needs, and challenges of the growers as well as the requirements of the consumers. Also, the articulation of knowledge between different disciplines and stakeholders. As part of a fruit physiology laboratory, this project has brought knowledge and development of skills in sampling collection, experimental design, statistical analysis, phenological transition monitoring, and the analysis of climate information. One of the major challenges for the execution of this project has been the construction, processing, and analysis of databases and mathematical models that have been used as a methodology. Also, it is important to mention the pedagogical skills acquired in information dissemination as well as the writing of results and technical documents.