Final report for GS23-290
Project Information
Blueberry farms in the southeastern United States have a high potential for water and nutrient leaching. In other crops, high planting densities have been shown to improve water and nutrient uptake efficiency and reduce nutrient losses. This project aimed to improve the sustainability of blueberry farms by determining the optimum number of plants per unit area to optimize nutrient use efficiency (NUE) and water use efficiency (WUE). Plants of two southern highbush blueberry varieties (‘Optimus’ and ‘Meadowlark’) were planted in early March of 2024 at low- (1,383 plants/Acre), standard- (1,936 plants/Acre), and high-planting density (3,227 plants/Acre) in an experimental field at the UF Plant Science Research and Education Unit in Citra, FL. Plant size (height, east-west and north-south canopy diameters), vertically projected leaf area, yield, fruit quality were measured and compared between density treatments for the first year of establishment. A subset of plants was destructively harvested a year after planting. NUE and WUE were calculated using plant biomass relative to water and fertilizer inputs. Progress and results from this project were disseminated through standard (field days), and emerging outlets (social media). This study provided insight about how planting density affects NUE and WUE in southern highbush blueberry farms for growers to make informed decisions that improve the sustainability of blueberry production.
The goal of this project was to improve the sustainability of blueberry farms by determining the ideal planting density that results in the optimization of nutrient and water use efficiency. Specific objectives are:
Objective 1: Evaluate NUE and WUE in blueberry plants grown at different planting densities.
Objective 2: Disseminate research findings among growers, extension educators, and scientists.
Research
Previous studies evaluated high-density blueberry plantings for the sheer purpose of generating greater yields per unit area and earlier economic returns (Lyrene and Williamson 1997; Strik and Buller 2005). However, identifying the optimum planting density in blueberries may also improve input use efficiency and minimize environmental impacts. Currently, more than 50% of water applied to blueberries grown in pine bark amended sandy soils is leached. This also results in leaching of nutrients like nitrogen and phosphorus (Bandaranayake et al. 2020) that can severely contaminate water bodies. This project aims to enhance the environmental sustainability of blueberry farms by optimizing planting density to improve water and nutrient use efficiency.
Objective 1: Evaluate NUE and WUE in blueberry plants grown at different planting densities.
Plant availability was limited in the Fall of 2023, therefore, the planting date for this experiment was postponed. As a result, southern highbush blueberry ‘Optimus’ and ‘Meadowlark’ were planted on March 4th, 2024 at the Plant Science Research and Education Unit in Citra, FL (lat. 29°24'20.9"N, long. 82°08'26.6"W). Plants were grown in raised beds made with pine bark and native soil (Arredondo soil series Ultisol). Plants were spaced according to three planting density treatments: 18 (high; 3,227 plants/Acre), 30 (standard; 1,936 plants/Acre), and 42 inches apart (low; 1,383 plants/Acre), and were maintained using standard practices for the deciduous blueberry production system throughout the experiment (Phillips et al. 2020; Phillips and Williamson 2020).
There were four 7-plant replications per spacing x cultivar combination. Two randomly selected plants from each replication were selected for data collection on plant size, leaf area, yield, and fruit quality. Plant size measurements were initiated in April 2024 and conducted at six-month intervals through April 2025. Plant height was measured from the base to the top of the canopy using a measuring tape (Stanley®, Black and Decker Inc., New Britain, CT, U.S.A.), excluding any vigorous shoots extending beyond the general canopy level. Canopy diameters were measured parallel and perpendicular to the plant row.
Due to the small plant size, reliable light interception measurements using a Line Quantum Sensor (LI-191R, LI-COR Biosciences, Lincoln, NE, U.S.A.) were not feasible. Instead, vertically projected leaf area (VPLA) was recorded at the same frequency as plant size, and was used as a proxy for canopy light interception. Previous studies have shown that leaf area is positively correlated with canopy light interception (Rosati et al., 2001; Fila and Sartorato, 2011). Overhead pictures from each data plant were taken approximately 1 meter above each data plant using a smartphone camera (iPhone 11, 12 MP, Apple Inc., Cupertino, CA, U.S.A.). Projected leaf area was then determined using ImageJ software (version 1.51w; Schneider et al., 2012)
Plants were harvested weekly from mid-April to mid-May 2025. For each harvest, the amount of fruit was weighed on a benchtop scale and summed for total yield per plant. Because the plants were still young, they did not produce enough fruit in this initial season for fruit-quality analyses.
At the peak of the season (i.e., early May), one randomly selected plant per replication was dug up for a destructive harvest. Each plant was separated into its organs: new leaves, mature leaves, canes, and roots to measure dry biomass. Dried tissue samples were then sent to Waters Agricultural Laboratories (Camilla, GA) for analysis of nitrogen (N), phosphorus (P), and potassium (K), which were used for NUE calculation. Biomass of harvested plant organs and fertilization records data were used to determine NUE and WUE as follows:
NUE = (total nutrient in harvested plant organ/total fertilization)*100
WUE = (total biomass/total irrigation)
Objective 2: Disseminate research findings among growers, extension educators, and scientists.
To secure the transfer of information from this project to growers, collaborators, stakeholders, etc., we published an article with preliminary results in The Blueberry News (Link). We also hosted a field tour as part of the 2026 Spring Field Day of the Florida Blueberry Growers Association. Finally, progress and results from this research have been published as social media posts in LinkedIn. At the time of writing this report, we are preparing an extension publication at UF/IFAS EDIS that will be submitted for peer review before the end of the year.
During the first year of establishment, plant size appeared to be genotype-dependent, with ‘Optimus’ SHB developing larger plants than ‘Meadowlark’ SHB across all planting densities. Plant size in ‘Meadowlark’ SHB was unaffected by planting density. In contrast, ‘Optimus’ SHB plants in the high-density treatment were approximately 25 % shorter than those growing in the standard (std), and developed approximately 30 % smaller canopies than those plants at low and std planting densities (Figure 1).
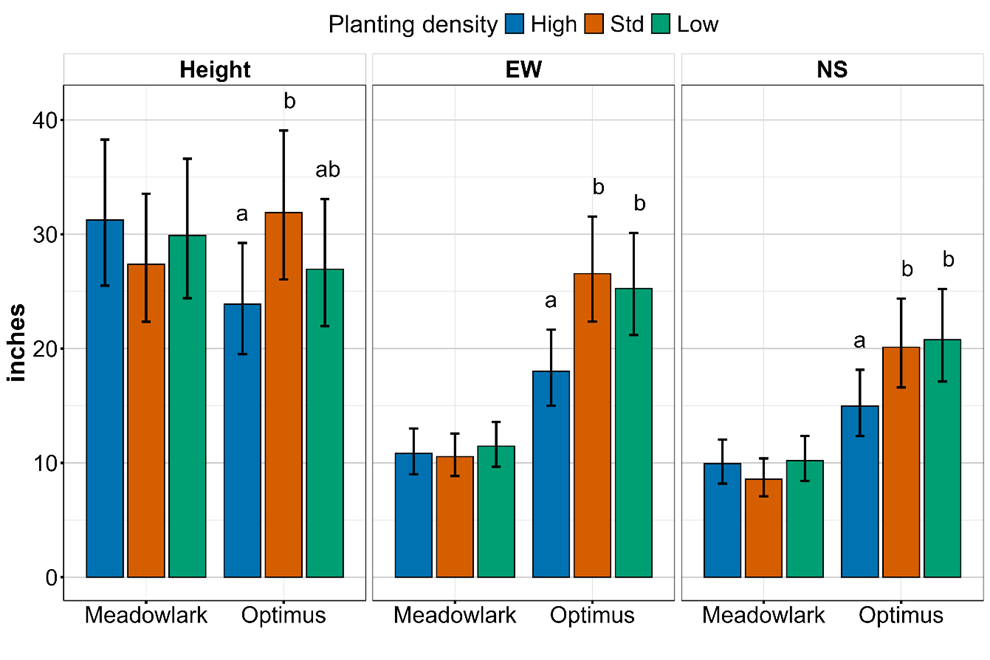
Figure 1. Plant height, east-west (EW) and north-south (NS) canopy diameters of southern highbush blueberry across different plant density treatments. Means within the same genotype with no letter in common are significantly different (Fisher’s LSD; α = 0.05)
‘Optimus’ SHB plants exhibited higher VPLA than ‘Meadowlark’ SHB plants likely reflecting the canopy diameter differences observed in Figure 1. In ‘Meadowlark’ SHB, VPLA did not vary between treatments during the first year of establishment (Figure 2). In contrast, ‘Optimus’ SHB plants in the std- and low-density treatments had significantly higher VPLA in October 2024, although these differences disappeared later in the production season, and VPLA became similar across all treatments (Figure 2). ‘Optimus’ SHB is characterized by a vigorous, spreading canopy, while ‘Meadowlark’ SHB tends to develop a more upright and compact canopy. At higher planting densities, limited space constrained growth in ‘Optimus’ SHB, but ‘Meadowlark’ was largely unaffected, achieving VPLA values similar to ‘Optimus’ SHB (Figure 2). Physical space enables a plant to create and develop shapes by differentially controlling their growth (Prusinkiewicz and Barbier de Reuille 2010). This warrants further investigation as plants continue to develop and reach maturity.
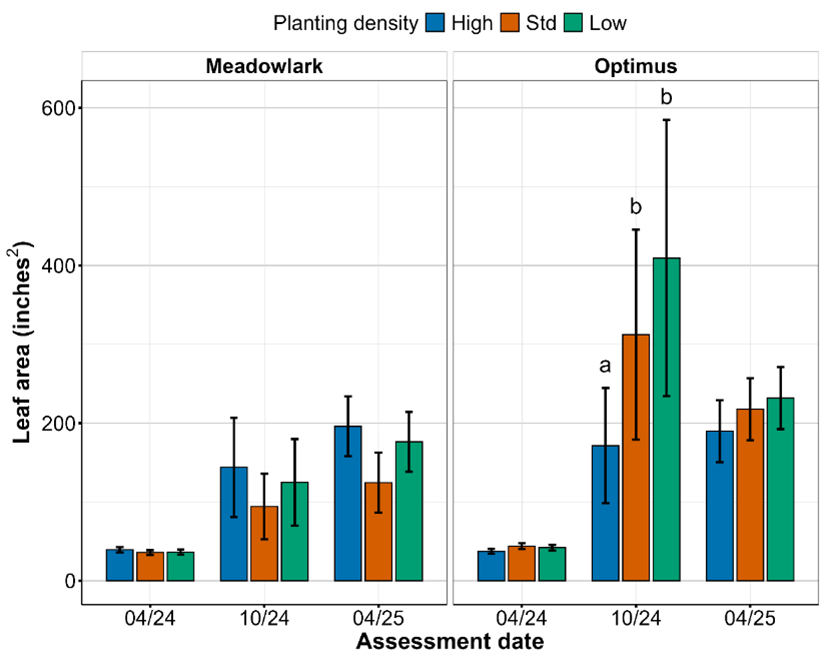
Figure 2. Vertically projected leaf area of ‘Optimus’ and ‘Meadowlark’ southern highbush blueberry across different plant density treatments throughout the first year of establishment. Means within the same assessment date with no letter in common are significantly different (Fisher’s LSD; α = 0.05).
Planting density did not significantly affect yield during the first year of establishment. Yield differences were primarily attributed to cultivar performance, with ‘Optimus’ SHB producing higher yields than ‘Meadowlark’ SHB. Nevertheless, as plants continue to grow, changes in yield and in other important traits are expected especially as plants approach maturity (3-5 years old).
We measured WUE by looking at how much biomass the plants produced for every unit of water they received. Our assessment does not consider water inputs from precipitation. Instead we focused only on irrigation water. WUE was similar across all planting densities for each genotype. However, ‘Optimus’ plants exhibited greater WUE than ‘Meadowlark’ (Figure 3) in all treatments except the high-density treatment, consistent with the VPLA patterns described above. Previous studies suggest that smaller-canopy plants at higher densities develop more efficient light-intercepting structures, maximizing total photosynthesis and supporting higher yields and growth (Anthony et al. 2020). Whether this advantage persists as blueberry plants mature and dense canopies limit lower-light penetration remains to be investigated.
In both genotypes, most of the biomass went into cane growth rather than fruit or leaves (Figure 4).
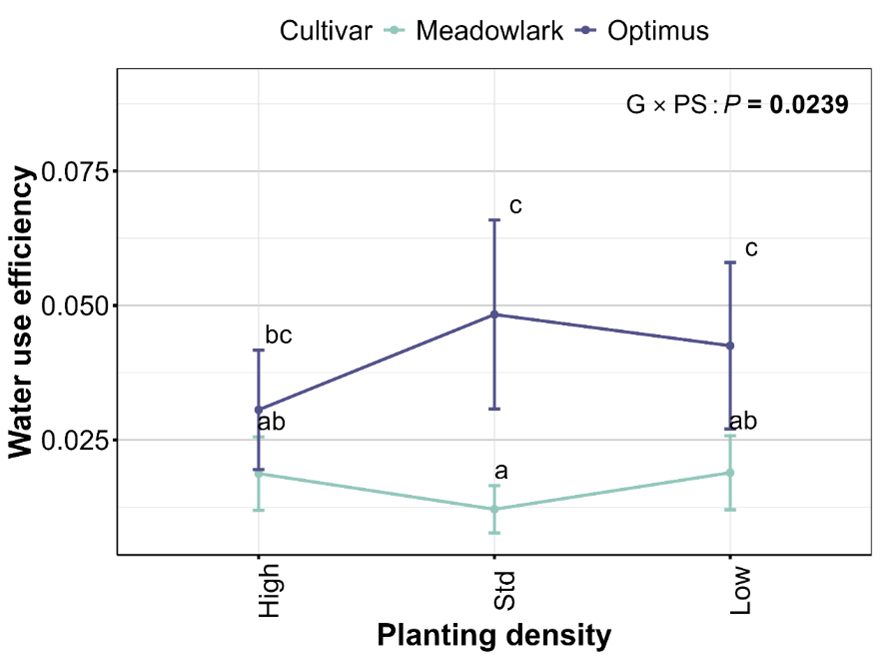
Figure 3. Water use efficiency (g DW L-1 irrigation water) across planting density treatments of southern highbush blueberry plants in Florida. Means with no letter in common are significantly different (Tukey HSD; α = 0.05). G = genotype; PS = planting density.
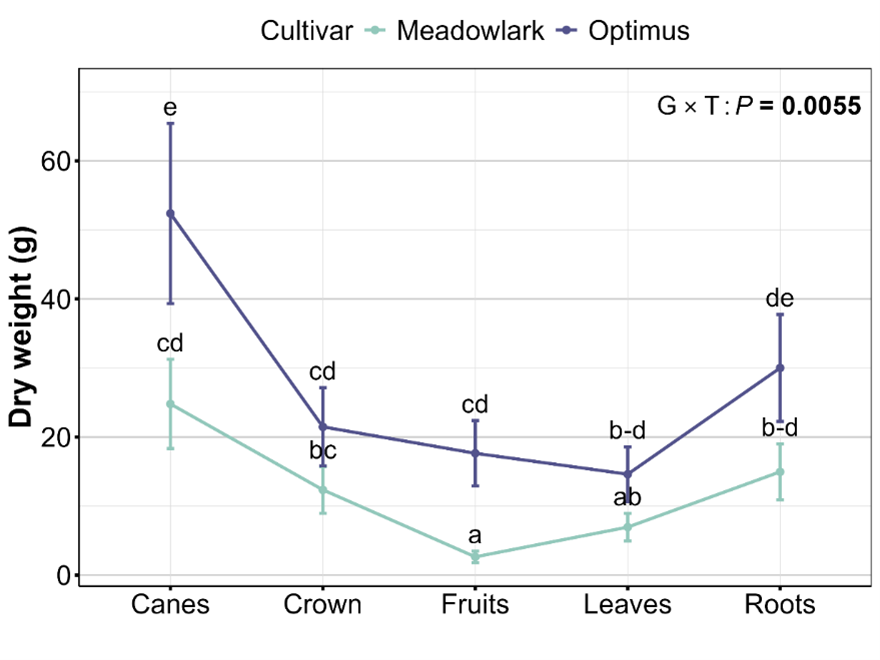
Figure 4. Dry weight of different plant organs of southern highbush blueberry plants during the first year of establishment. Means with no letter in common are significantly different (Tukey HSD; α = 0.05). G = genotype; T = plant organ.
‘Optimus’ SHB plants exhibited higher N, P and K use efficiency than ‘Meadowlark’ SHB at the standard planting density (Figure 6). Within the same genotype, ‘Optimus’ exhibited similar nutrient use efficiency across the distinct planting density treatments, although a slight decline was observed at the low-density treatment. On the other hand, ‘Meadowlark’ SHB plants exhibited highest nutrient use efficiency at high planting density than at standard- and low-density treatments (Figure 5).
Higher planting densities in other crops exhibited improved rhizosphere conditions (e.g., root activity, microbial abundance and diversity, and nutrient cycling), which can indirectly enhance nitrogen uptake (Wu et al. 2024). Although we did not measure soil physical or chemical properties in this study, the more uniform canopy coverage at higher densities may have contributed to improved soil conditions, including reduced water loss by evapotranspiration thereby enhancing nutrient uptake (Figure 5). Because each genotype develops differently, further research is needed to determine how long the benefits of a uniform canopy persist, when they begin to diminish, and how they influence other key traits such as yield and fruit quality. While WUE differences were primarily driven by genotype during the first year of establishment, future results may change as plants grow and compete more intensely for resources like water. Understanding these dynamics can guide planting strategies that support strong growth from establishment through maturity.
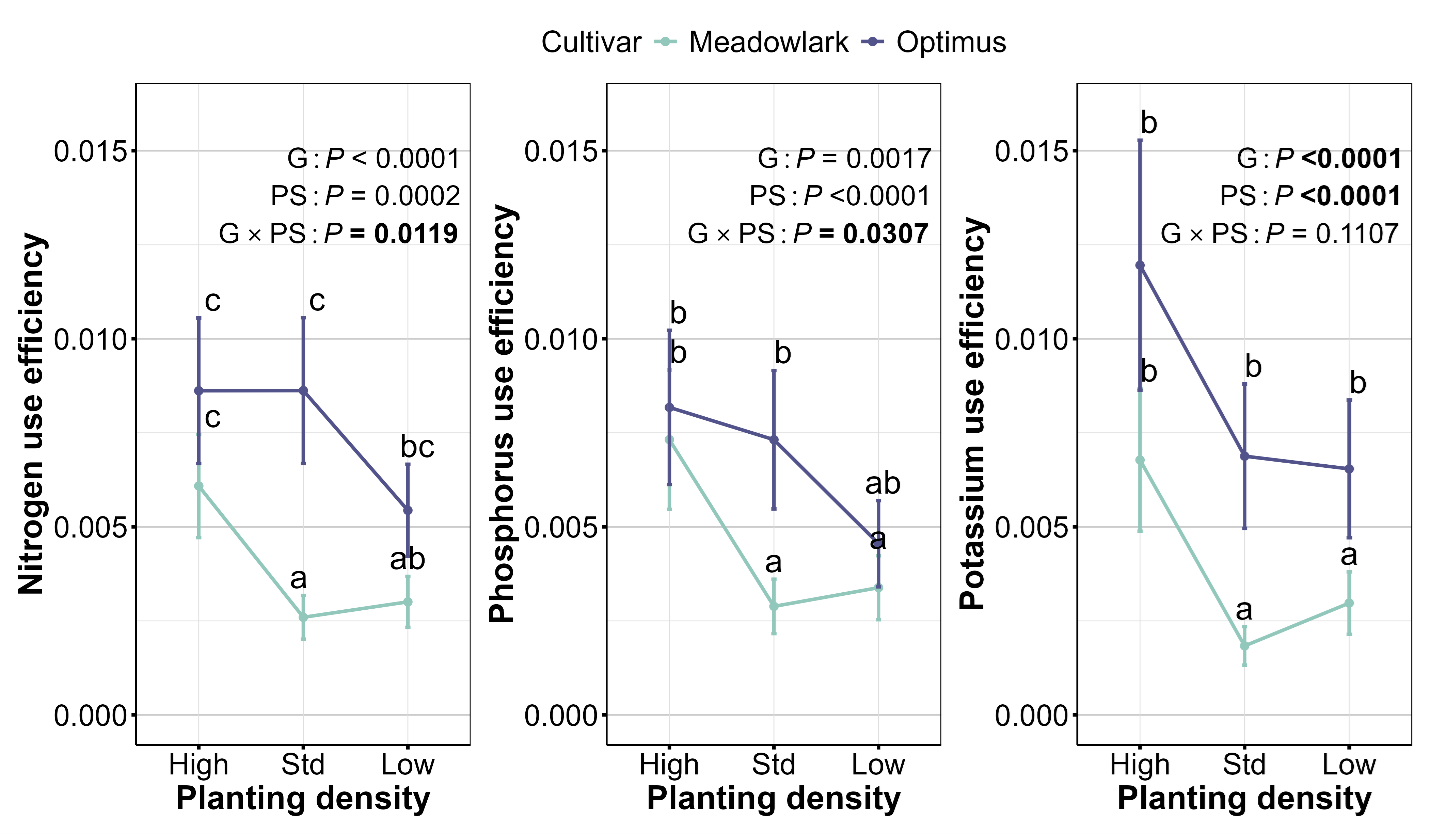
Figure 5. Nitrogen (left), phosphorus (middle) and potassium (right) use efficiency of southern highbush blueberry plants at different planting densities. Means with no letter in common are significantly different (Tukey HSD; α = 0.05). G = genotype, PS = planting density.
Educational & Outreach Activities
Participation summary:
Field tour as part of the 2026 Spring Field Day of the Florida Blueberry Growers Association.
Social media updates in LinkedIn
Project Outcomes
High-density planting can enhance land-use efficiency but may limit growth in vigorous genotypes such as ‘Optimus’ southern highbush blueberry, even during the early stages of development. Evaluating plant growth through maturity is essential to fully understand the effects of planting density on genotype performance (e.g., yield potential, fruit quality, harvest efficiency, etc.) and its interaction with the environment. This information is critical for developing genotype-specific spacing recommendations that help growers optimize resource use and potentially maximize long-term productivity.