Final report for GS23-295
Project Information
Irrigation can be a short-term solution to water scarcity. For many areas of the world, long-term irrigation use can be unsustainable for cotton agriculture. Cotton typically has some drought tolerance; however, the inability to easily phenotype the root system architecture (RSA) has resulted in elite cultivars with reduced growth and plasticity in root systems. To explore cotton’s phenotypic variation of RSA in the germplasm, 660 accessions from around the globe were narrowed down to 200 accessions for RSA phenotyping analysis. Four seed companies each contributed three of their elite cultivars to this research. The accessions were simultaneously grown in the greenhouse and field locations. The greenhouse evaluated baseline RSA under well-watered conditions. The field tested the accessions under drought stress and compared the RSA of seven accessions. The rainfed condition of West Texas during the 2024 summer season allowed sufficient drought stress to affect most of the accessions significantly. A minimum of fifteen accessions had no significant difference between the irrigated and rainfed conditions. Many accessions also had a more robust RSA with higher root length, greater root-to-shoot ratio, and finer average diameter. A pattern of thicker primary root diameter, but finer lateral roots, performed better under drought conditions, along with a higher root length and a higher root-to-shoot ratio, which contributed to performing better under drought conditions. Using the phenotypic data of this study will allow for genetic associations to be completed, and identification of potential genes involved in the RSA will help future research and breeders develop cotton accessions that can integrate the benefits of an increased RSA for drought tolerance.
Objective 1)
Identify a subset of Upland cotton accessions (175-200) and elite commercial cultivars (15) by selecting from the 600 accessions grown in the greenhouse.
Objective 2)
a) Evaluate the root system architecture (RSA) of the diverse germplasm using an image-based root phenotyping platform under controlled greenhouse conditions. The plants will be grown in the greenhouse for about 2 weeks before scanning their RSA with the scanner and software program. b) Select a subset of the five most promising and the five least promising of the exotic accessions in addition to the control and elite cultivars for contrast. To evaluate the RSA traits, under well-watered and water-deficient treatments in field conditions, three replications will be under irrigated conditions, and the other will be rainfed only.
Objective 3)
Based on the 1st year’s findings, lines with contrasting RSA will be further explored to identify QTLs or genomic loci using advanced genomic tools (GWAS) and additional field experiments to identify novel genes for optimizing the cotton RSA for enhanced water capture and efficiency.
Objective 4)
Working to understand the mechanisms by which the RSA and root water uptake function at deep soil layers and shallow zones. Investigate water movement from soil to roots in relation to cotton’s variation of traits.
Research
Objective 1: Identification of Accessions
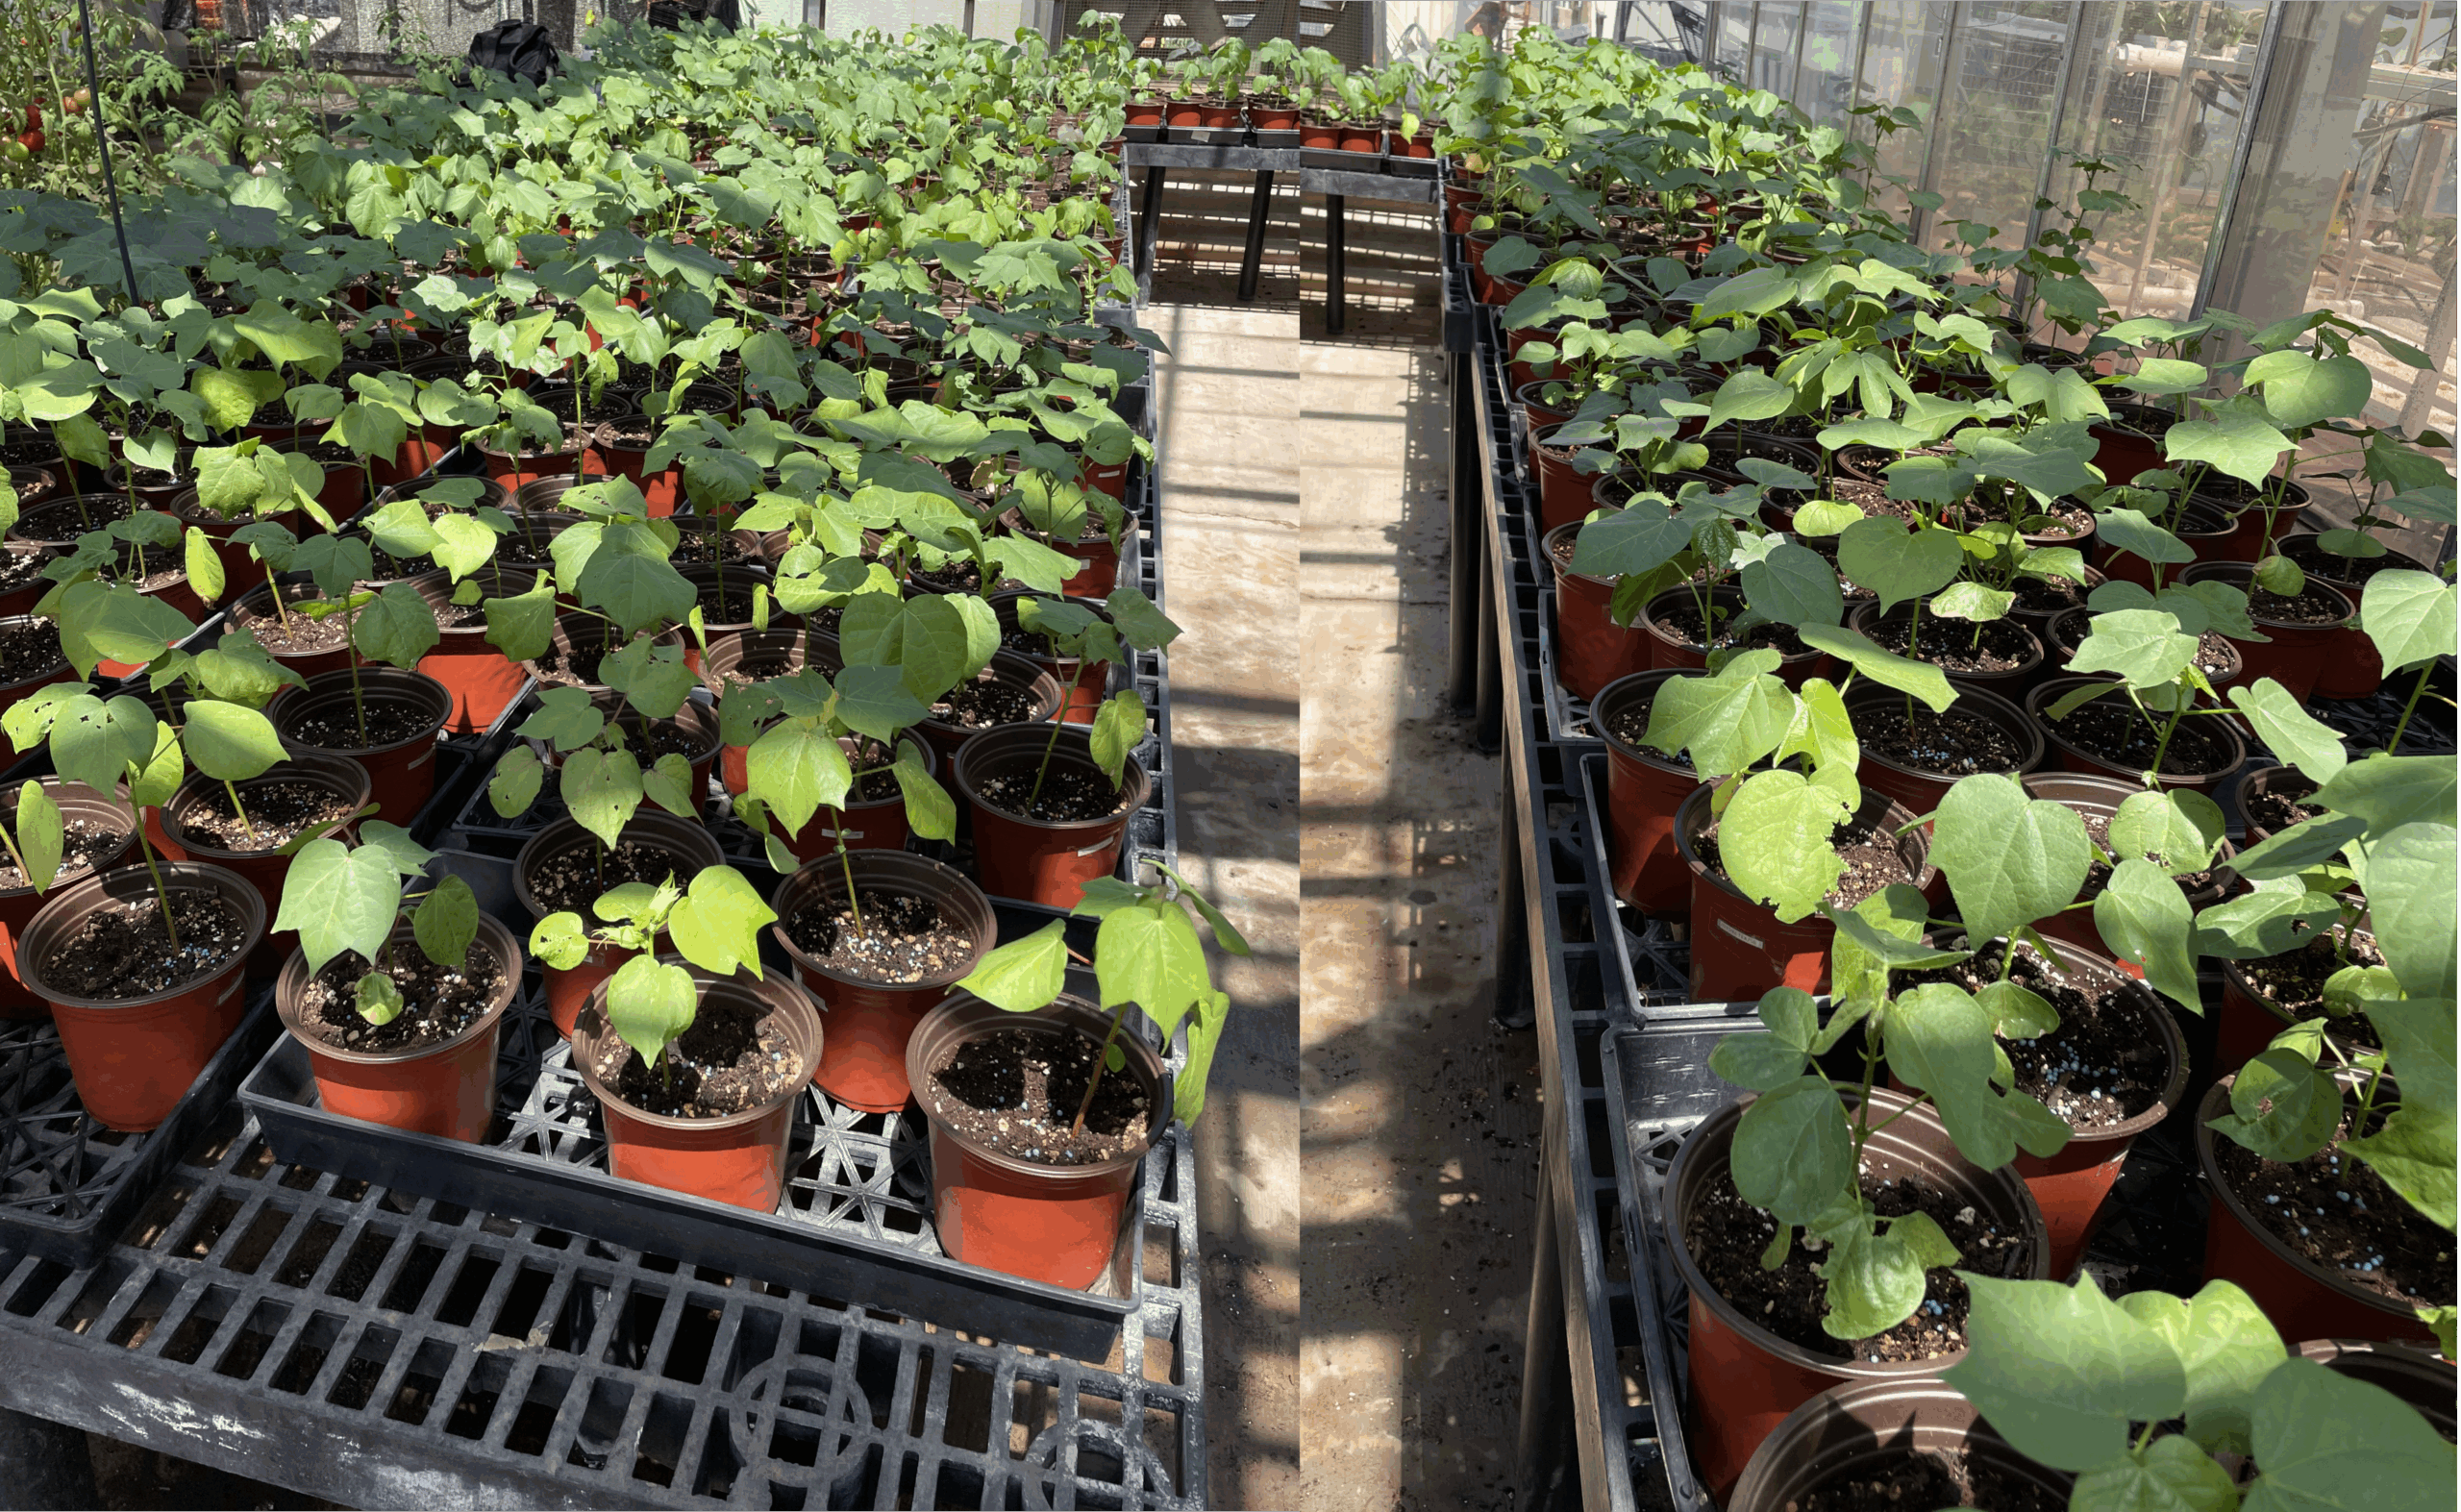
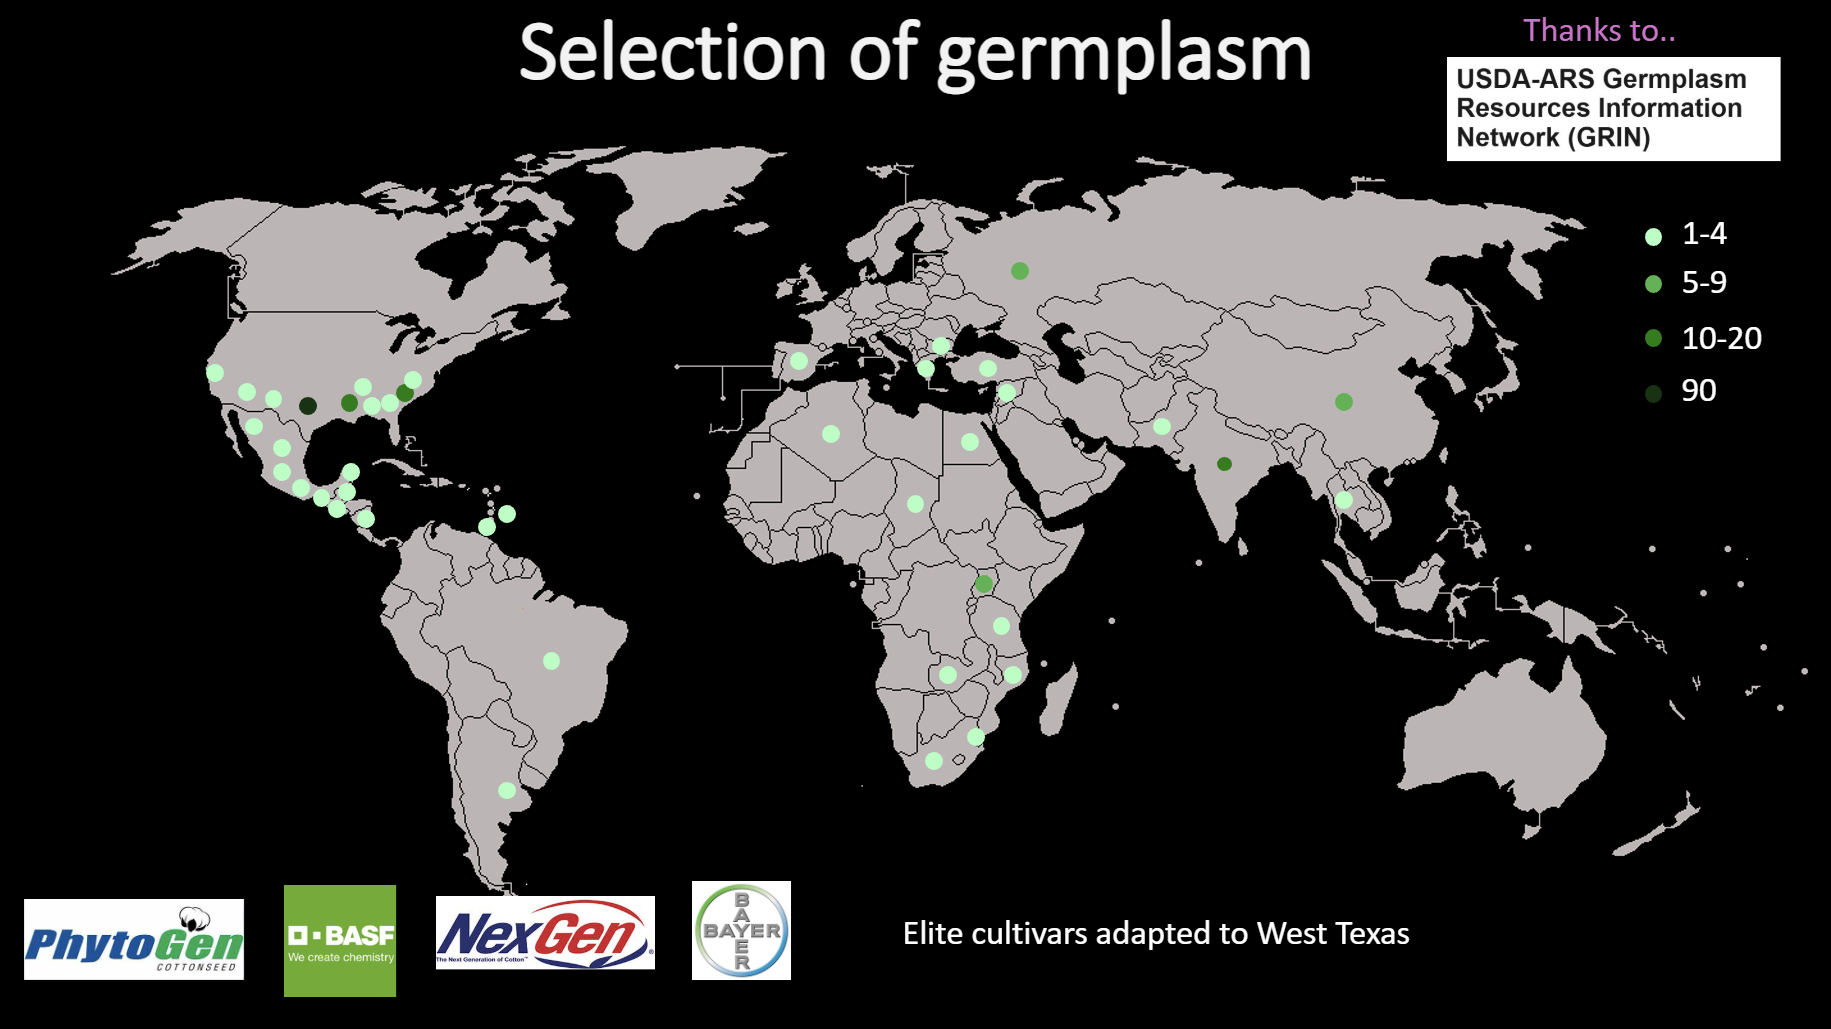
A total of 663 cotton accessions were obtained from the GRIN database, representing global diversity. Of these, 560 germinated successfully under greenhouse conditions (Fig. 1). The germplasm included accessions from Africa, Asia, the Caribbean, and the Americas, ensuring broad genetic representation. Approximately 250 accessions flowered in the West Texas field conditions, and DNA from 282 accessions was successfully genotyped. From these, 198 accessions were selected based on phenotypic variability, origin, and adaptability. Twelve elite cultivars from Bayer, NexGen, BASF, and Phytogen, along with two reference cultivars (TM1 and Coker 312), were added to form a working panel of 212 accessions (Figs. 2–3). This subset provided a balanced population for assessing root variation and drought adaptation.

Objective 2: Evaluation of Root System Architecture (RSA)
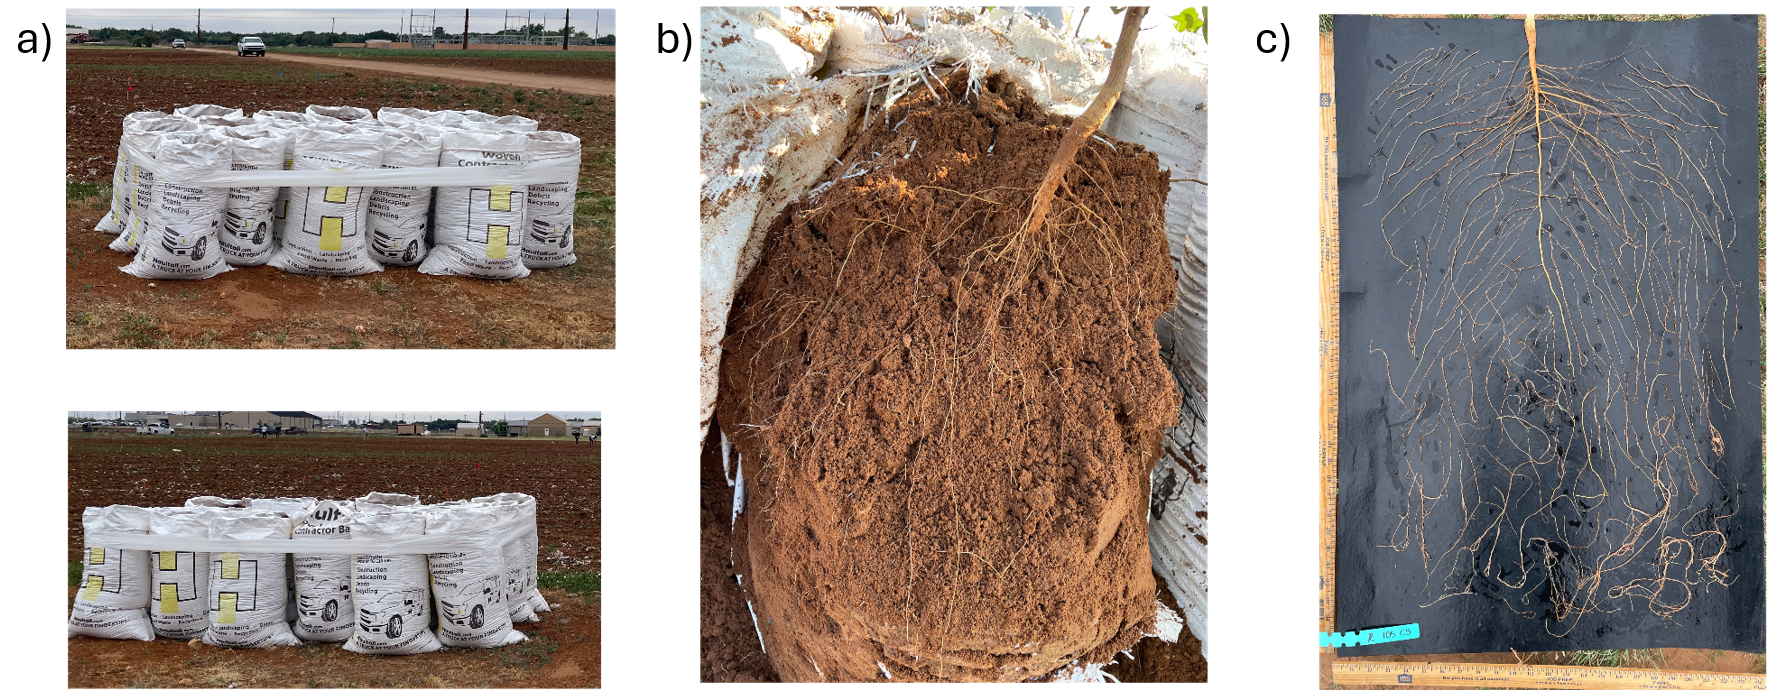
The RSA evaluation experiment was conducted at the Horticultural Greenhouse facility on the Texas Tech University campus. During the experiment, the temperature in the greenhouse ranged from 15°C at night (10 hours) up to 43°C during the day (14 hours). Topsoil from Quaker Research Farm was transported to the greenhouse to fill 2-gallon bags. Three replications of each of the 212 accessions, totaling 636 bags, were arranged in a completely randomized design (Fig. 4a). Because the bags had varying water capacities at the start, 24 hours before sowing, each bag was watered until saturated, then left to dry to reach field capacity. Five seeds were planted in each bag and allowed to germinate to the cotyledon stage before being thinned down to one plant per bag. The greenhouse space was limited, so completing more than three replications was not feasible. Therefore, this experiment served as a baseline, with no treatment, to compare the germplasm’s RSA phenotypic variability. From this data, the contrasting accessions with low and high RSA can be selected to narrow down the selection for additional stress treatment testing in future experiments.
Plants were extracted by washing and collecting the roots. About 10-20 minutes before extraction, the trays were filled with water to let the bags become saturated. This was to allow the soil to be less compacted and reduce the roots' tendency to cling to clumps of soil. (Fig. 4b). The shoot and all roots were stored in a Ziploc baggie filled with 50% ethanol and placed at 4°C until they could be imaged (Fig. 4c).

Plants from the greenhouse were imaged using an Epson Perfection V850 scanner to obtain high-resolution images. These were analyzed with the WinRhizo software (Fig. 5). Parameters that WinRhizo software calculated for root imaging included the following: region area, region width, region height, soil volume, total root length, root projected area, root surface area, shoot surface area, average diameter, length per volume, number of tips, number of forks, and number of crosses. During scanning, the roots were placed in a tray with a thin layer of water, which allowed them to separate for imaging. The young roots were manipulated by manually separating them and moving them apart to reduce overlap. With some roots breaking off, we were unable to accurately calculate the lateral root branching number, forks, tips, and crossing, but were able to collect all the other parameters.

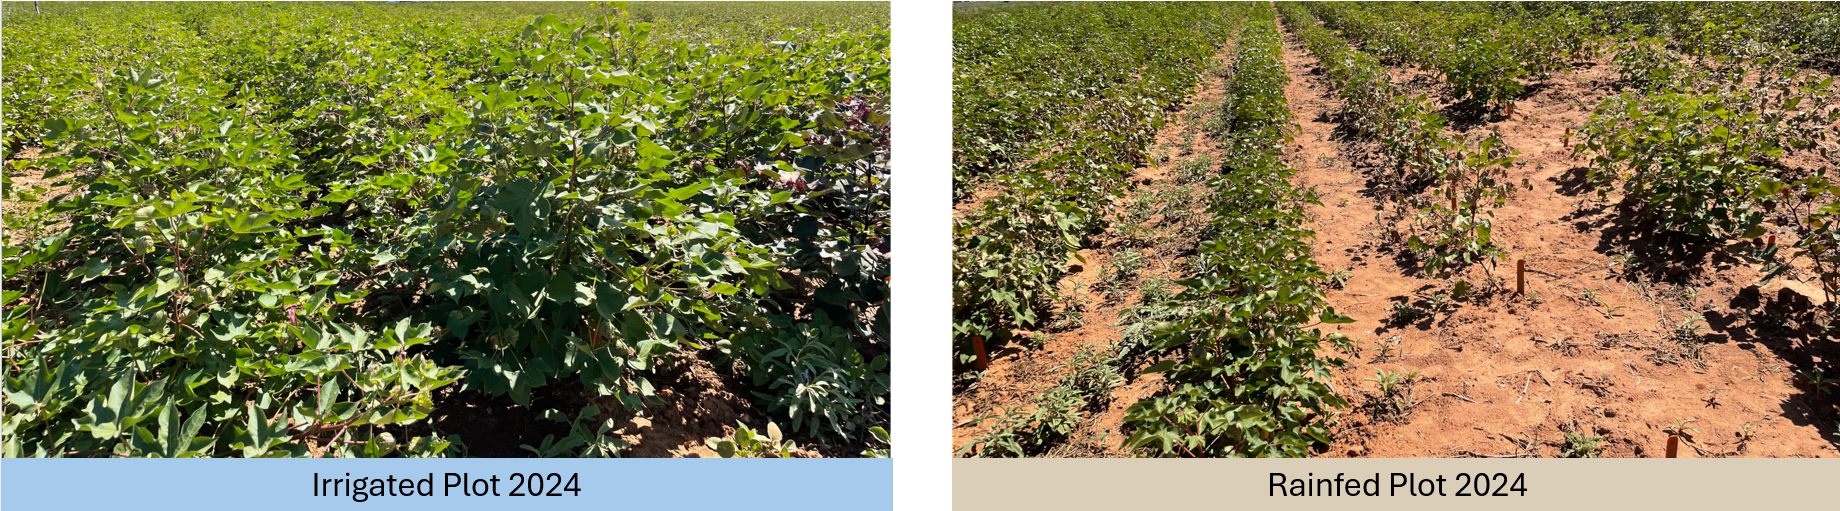
Simultaneously, as these 212 accessions were growing in the greenhouse, they were also growing in field trials under both irrigated and rainfed conditions (Fig. 6). Weeding was periodically completed manually throughout the season. Phenotypes collected this season included plant height, shoot biomass, number of bolls, average boll mass, and leaf nutrient analysis by X-ray fluorescence (XRF) spectroscopy.
Objective 3: Genotyping and Genome-Wide Association Study (GWAS)
Young leaves stored at -80°C were transferred to liquid nitrogen, then leaf-holed punched into a 96-well plate sitting in liquid nitrogen. The plate was lyophilized for 72 hours before being shipped to SGS North America Company in South Dakota for DNA extraction and 18K SNP array analysis, producing 14,911 informative markers after filtering (Fig. 7). The GWAS was conducted using the Genomic Association and Prediction Integrated Tool (GAPIT) version 3, which employed the Bayesian information and Linkage-disequilibrium Iteratively Nested Keyway (BLINK) model in R and RStudio.

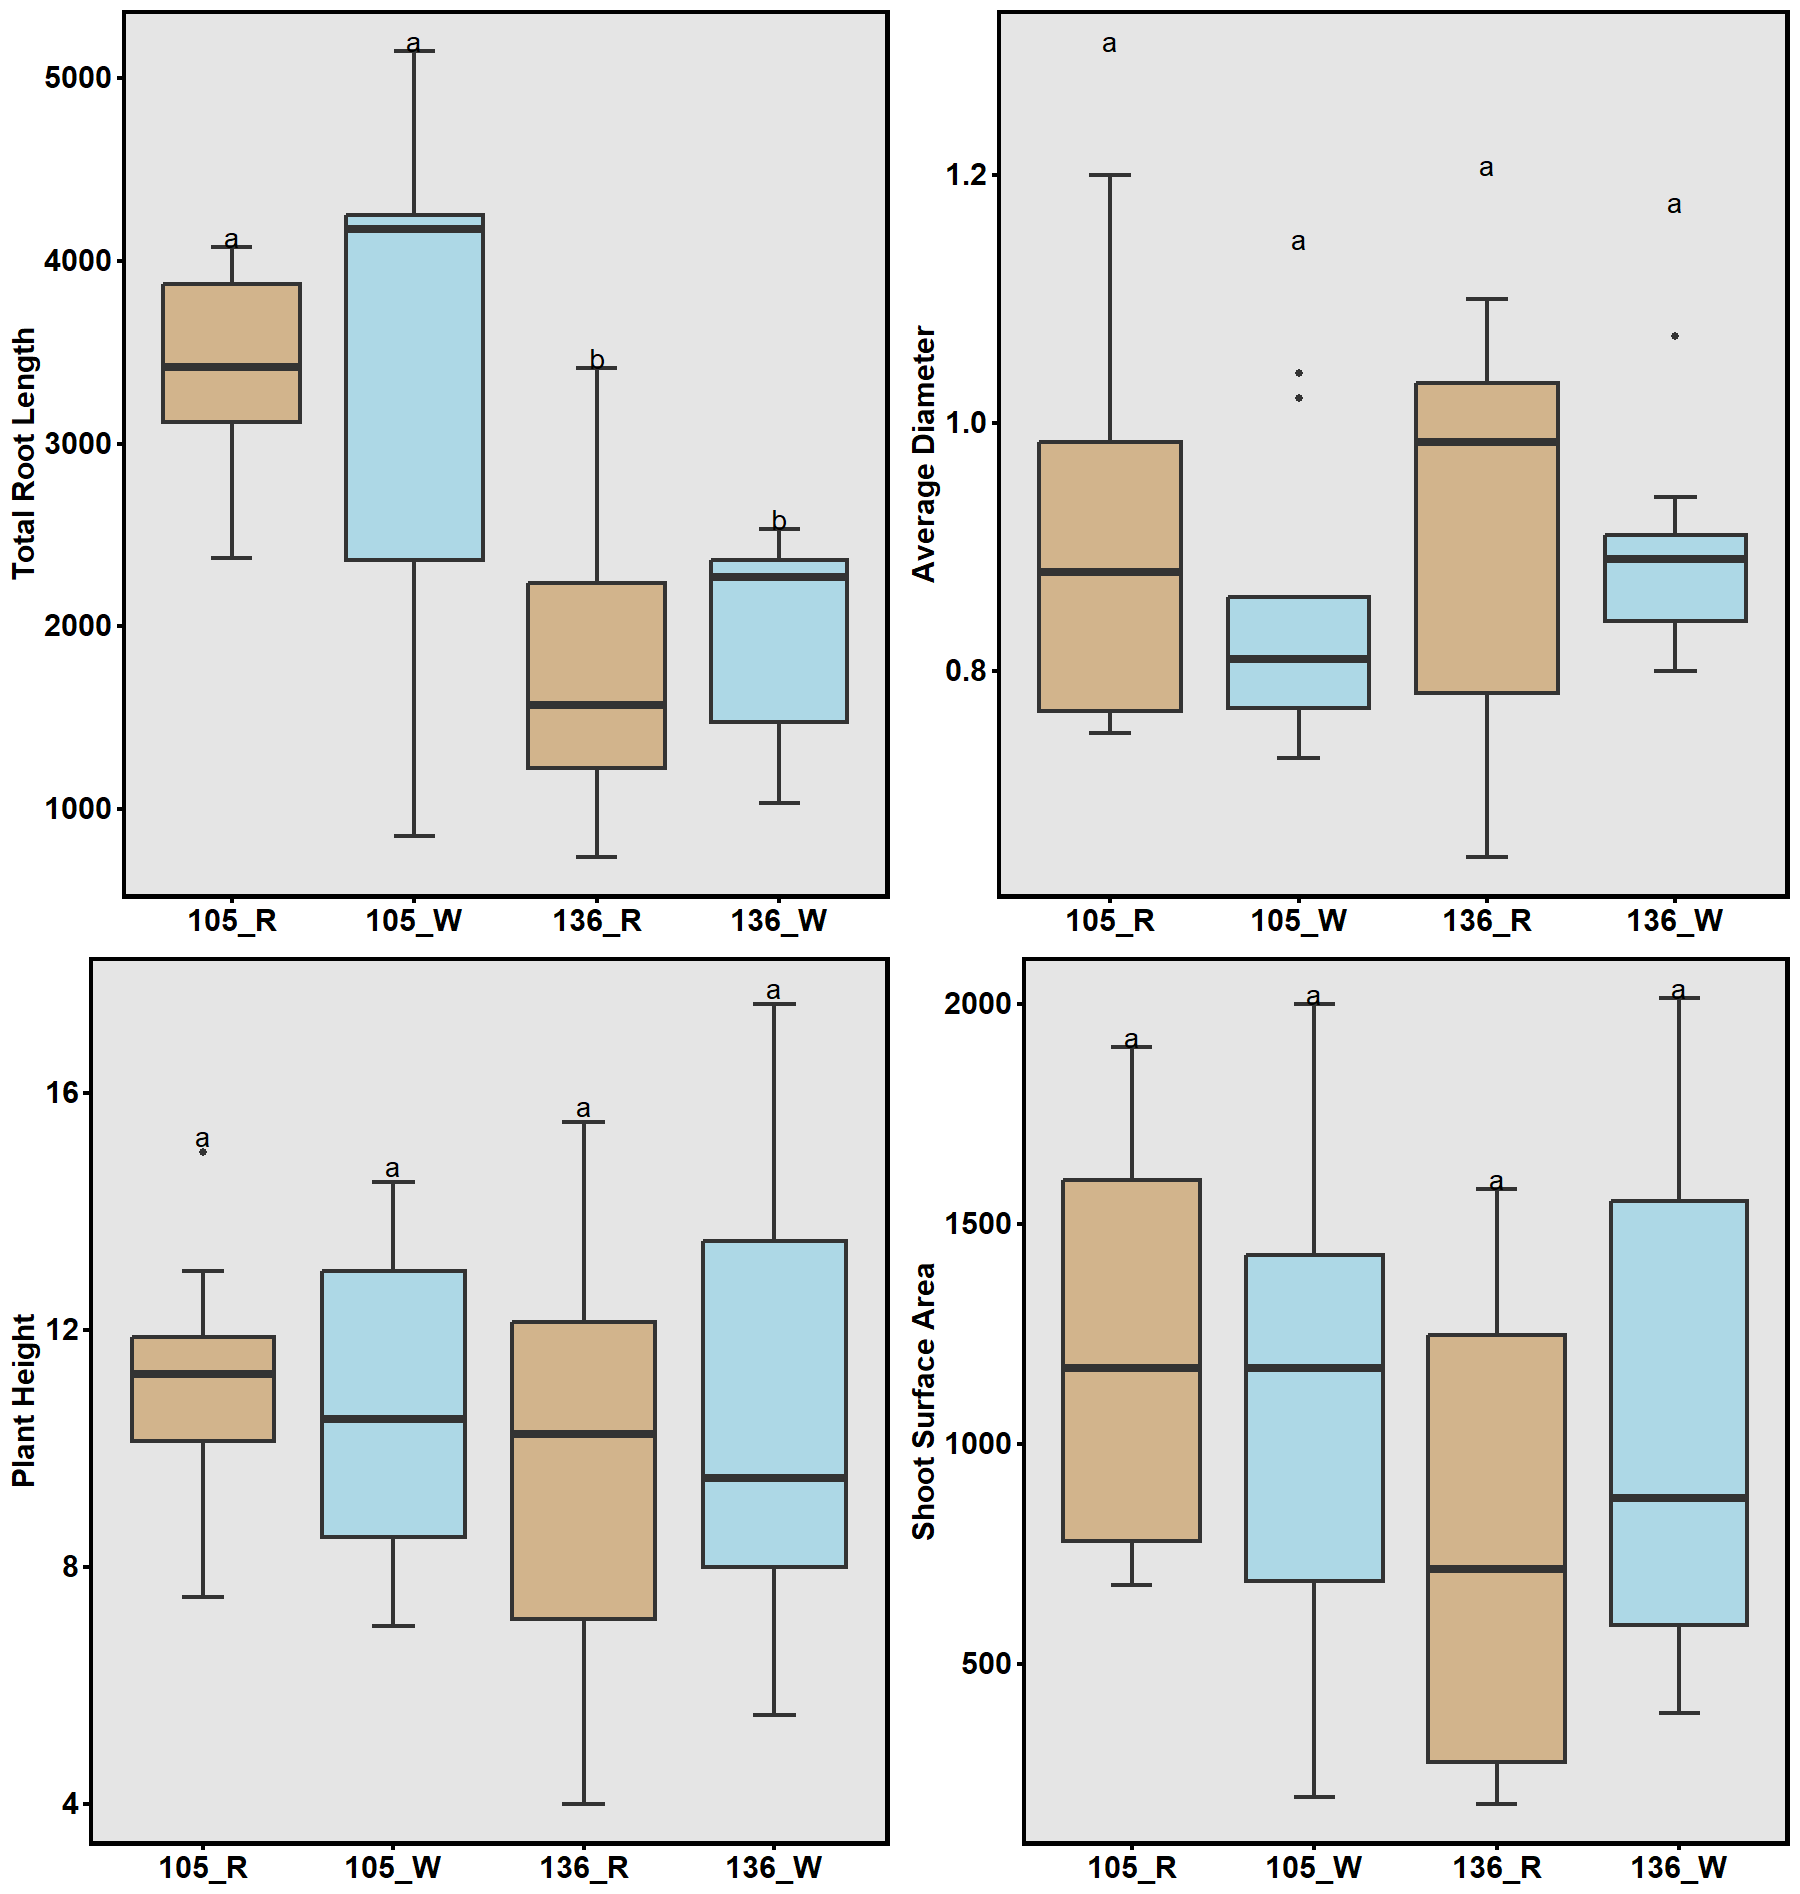
In a complementary field experiment using above-ground soil columns (contractor bags; Fig. 8a), two lines with contrasting haplotype groups associated with total root length (TRL) were identified from the previous GWAS and were compared. Accessions carrying CC alleles (#105) exhibited significantly greater total root length than those with TT alleles (#136) in the greenhouse experiment. The bag is approximately 33 inches tall and 18 inches in diameter. The soil used in the bags was collected from the Quaker Research Farm, the same location as the field trial. The plants grew for 10 weeks and 12 weeks, respectively.
Objective 4: Soil Moisture and Water Movement Analysis
An Aqua Spy sensor was drilled into the ground to measure soil moisture content at depths up to 4 feet, every 15 minutes. This gave us clues about the impact of rainwater on soil moisture at different soil depths. Additionally, it could identify the impact of irrigation on moisture content and the impact of plant root water uptake on moisture content at varying depths. One sensor was placed in the middle of the irrigated plot, and the other in the middle of the rainfed plot.
Objective 2: Evaluation of the Root System Architecture (RSA)
In the 2-gallon bag experiment in the greenhouse, total root length ranged from 150 cm to 1000 cm (Fig. 9). Accessions from African and South American origins generally showed more extensive RSA than Caribbean accessions. Most elite cultivars also fall in the middle of the distribution. This could imply potential for root improvement from accessions from Africa, Asia, and Central and South America. Correlation analysis indicated strong relationships among shoot biomass, root length, and root surface area (Fig. 10), underscoring the importance of balanced root–shoot allocation for drought adaptation.


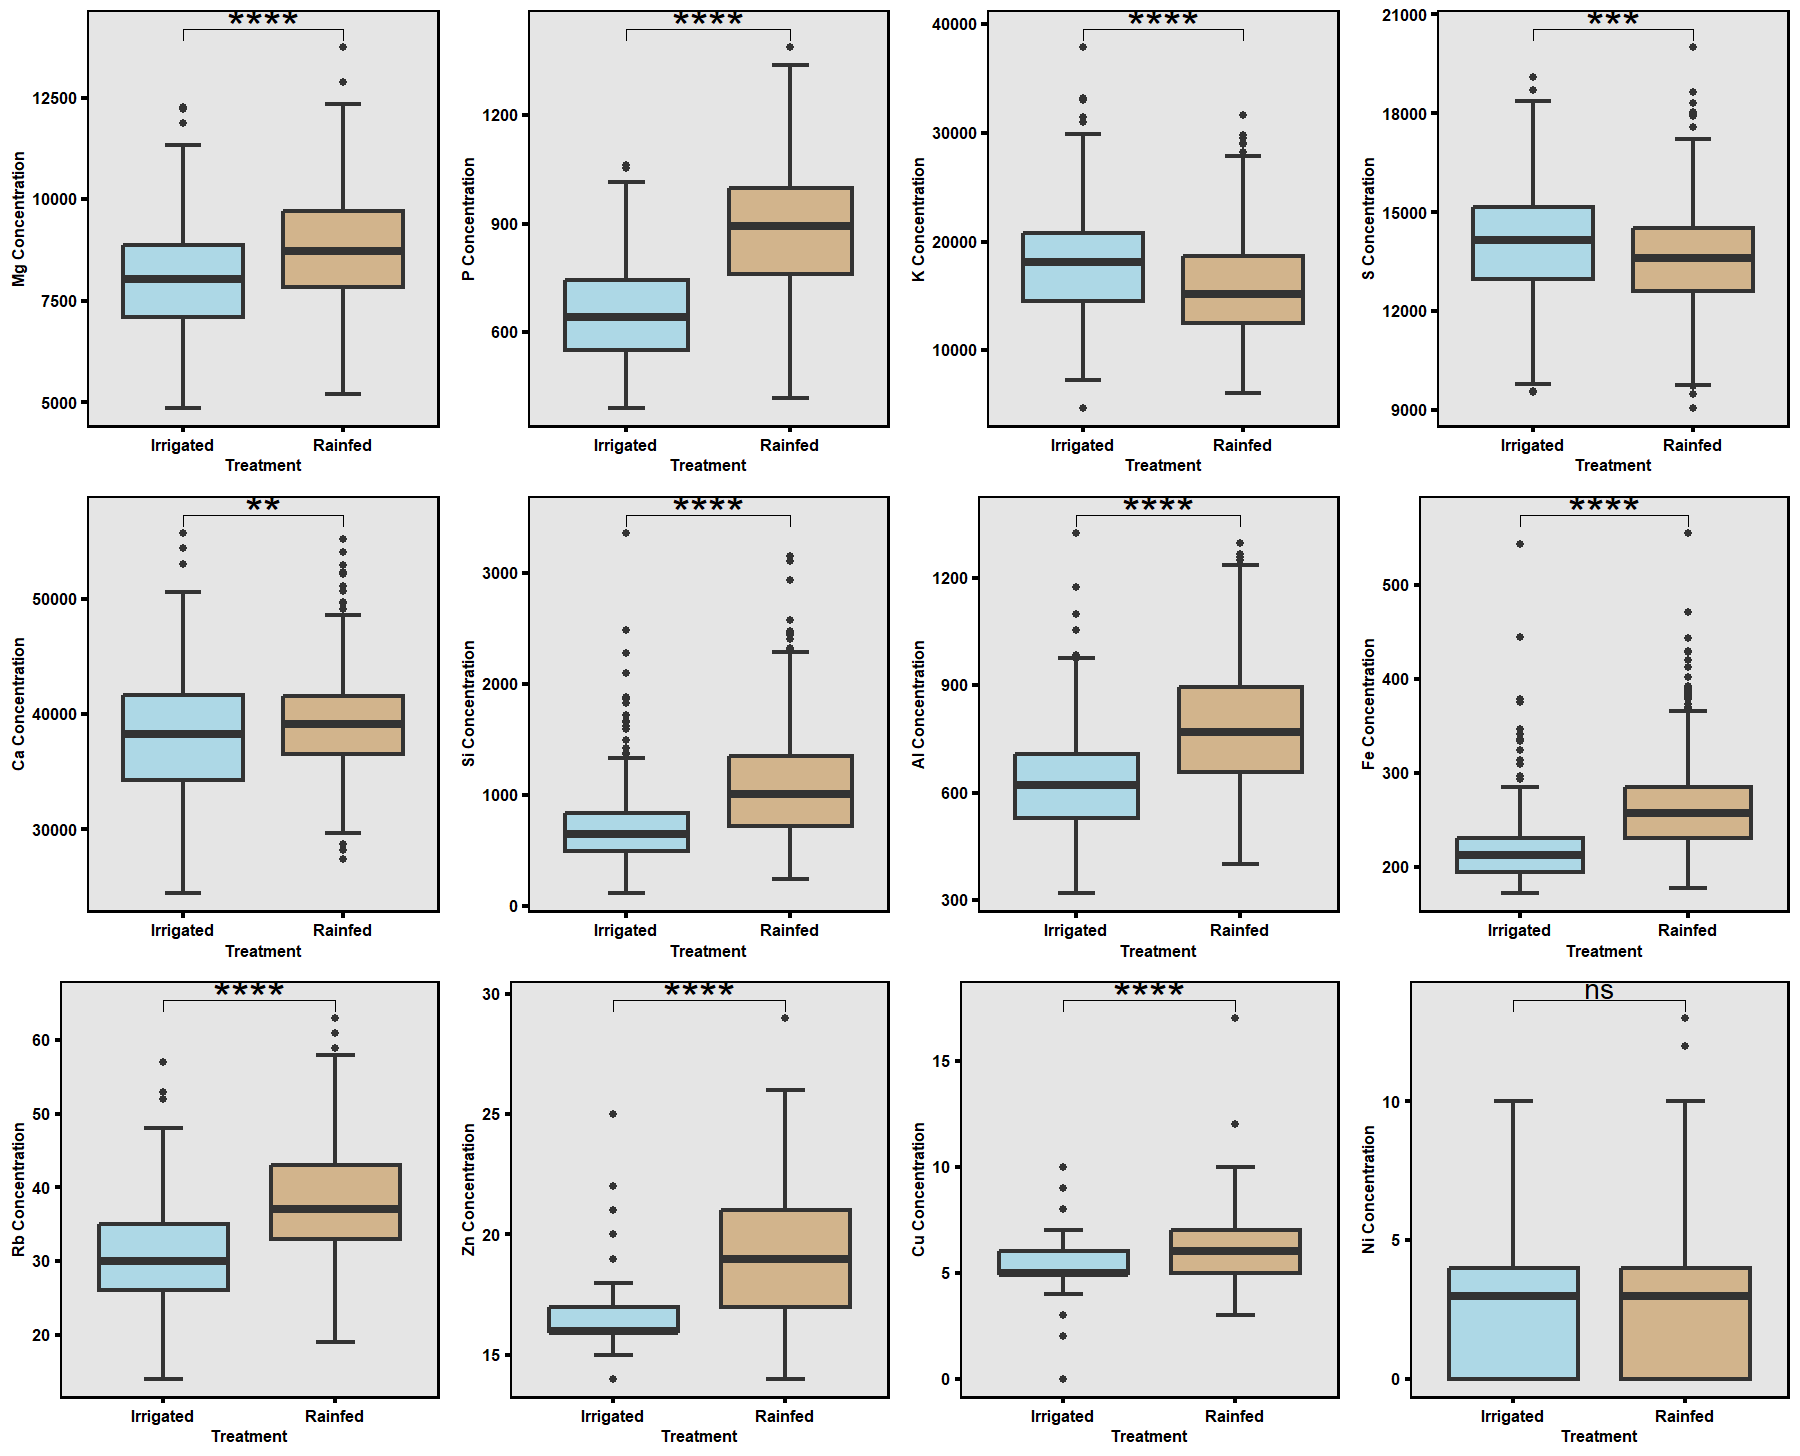
Based on greenhouse results, contrasting high- and low-RSA lines were selected for field testing (Fig. 11). The 2024 field trials, under both irrigated and rainfed conditions (Fig. 6), revealed that drought significantly reduced overall plant growth, root biomass, and boll yield. However, several accessions exhibited resilience by maintaining root structure and yield under rainfed conditions (Fig. 12). Leaf nutrient analysis showed significant differences between treatments for major elements except nickel (Ni), with magnesium (Mg) and silicon (Si) showing possible roles in stress adaptation (Figs. 13–14). These results emphasize that accessions with deeper and finer RSA structures maintained nutrient uptake efficiency under limited moisture.


Objective 3: Genotyping and Genome-Wide Association Study (GWAS)
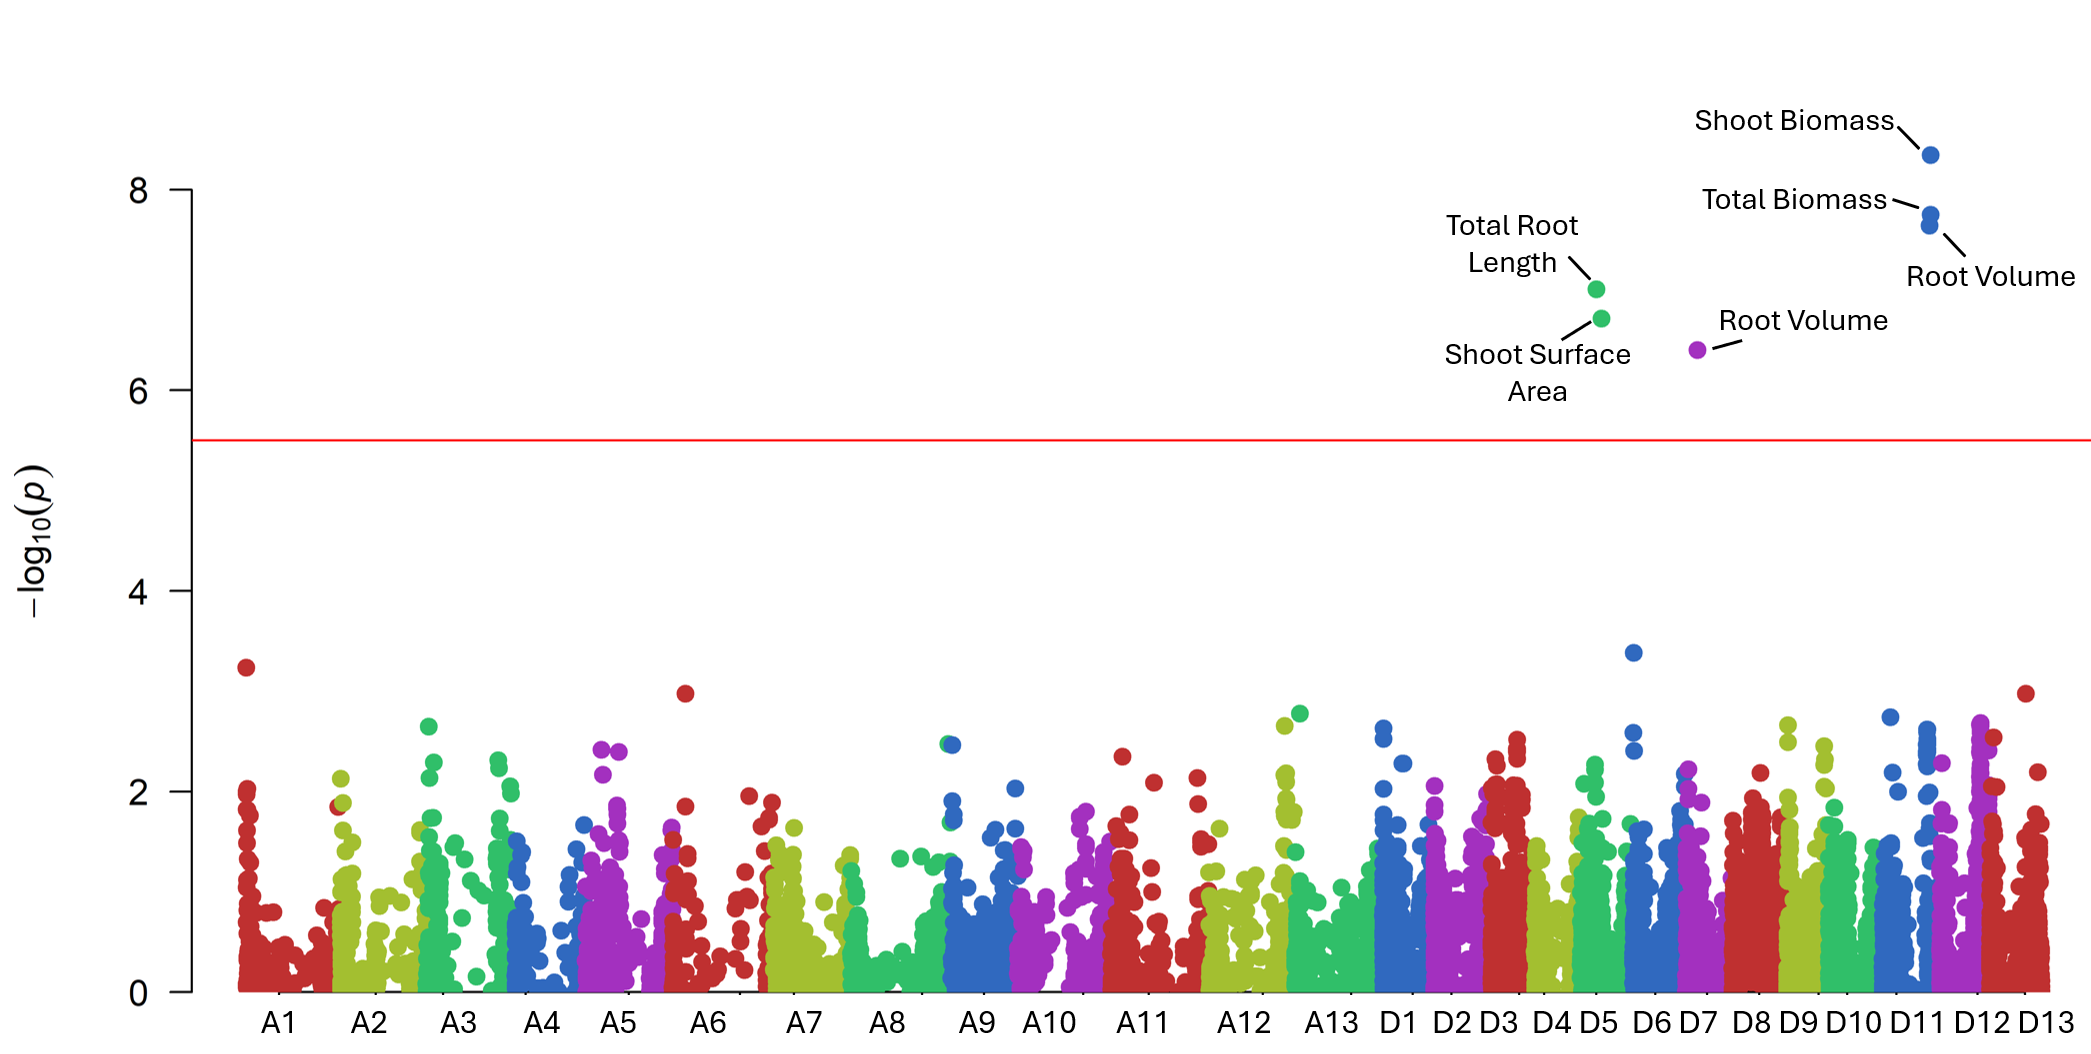
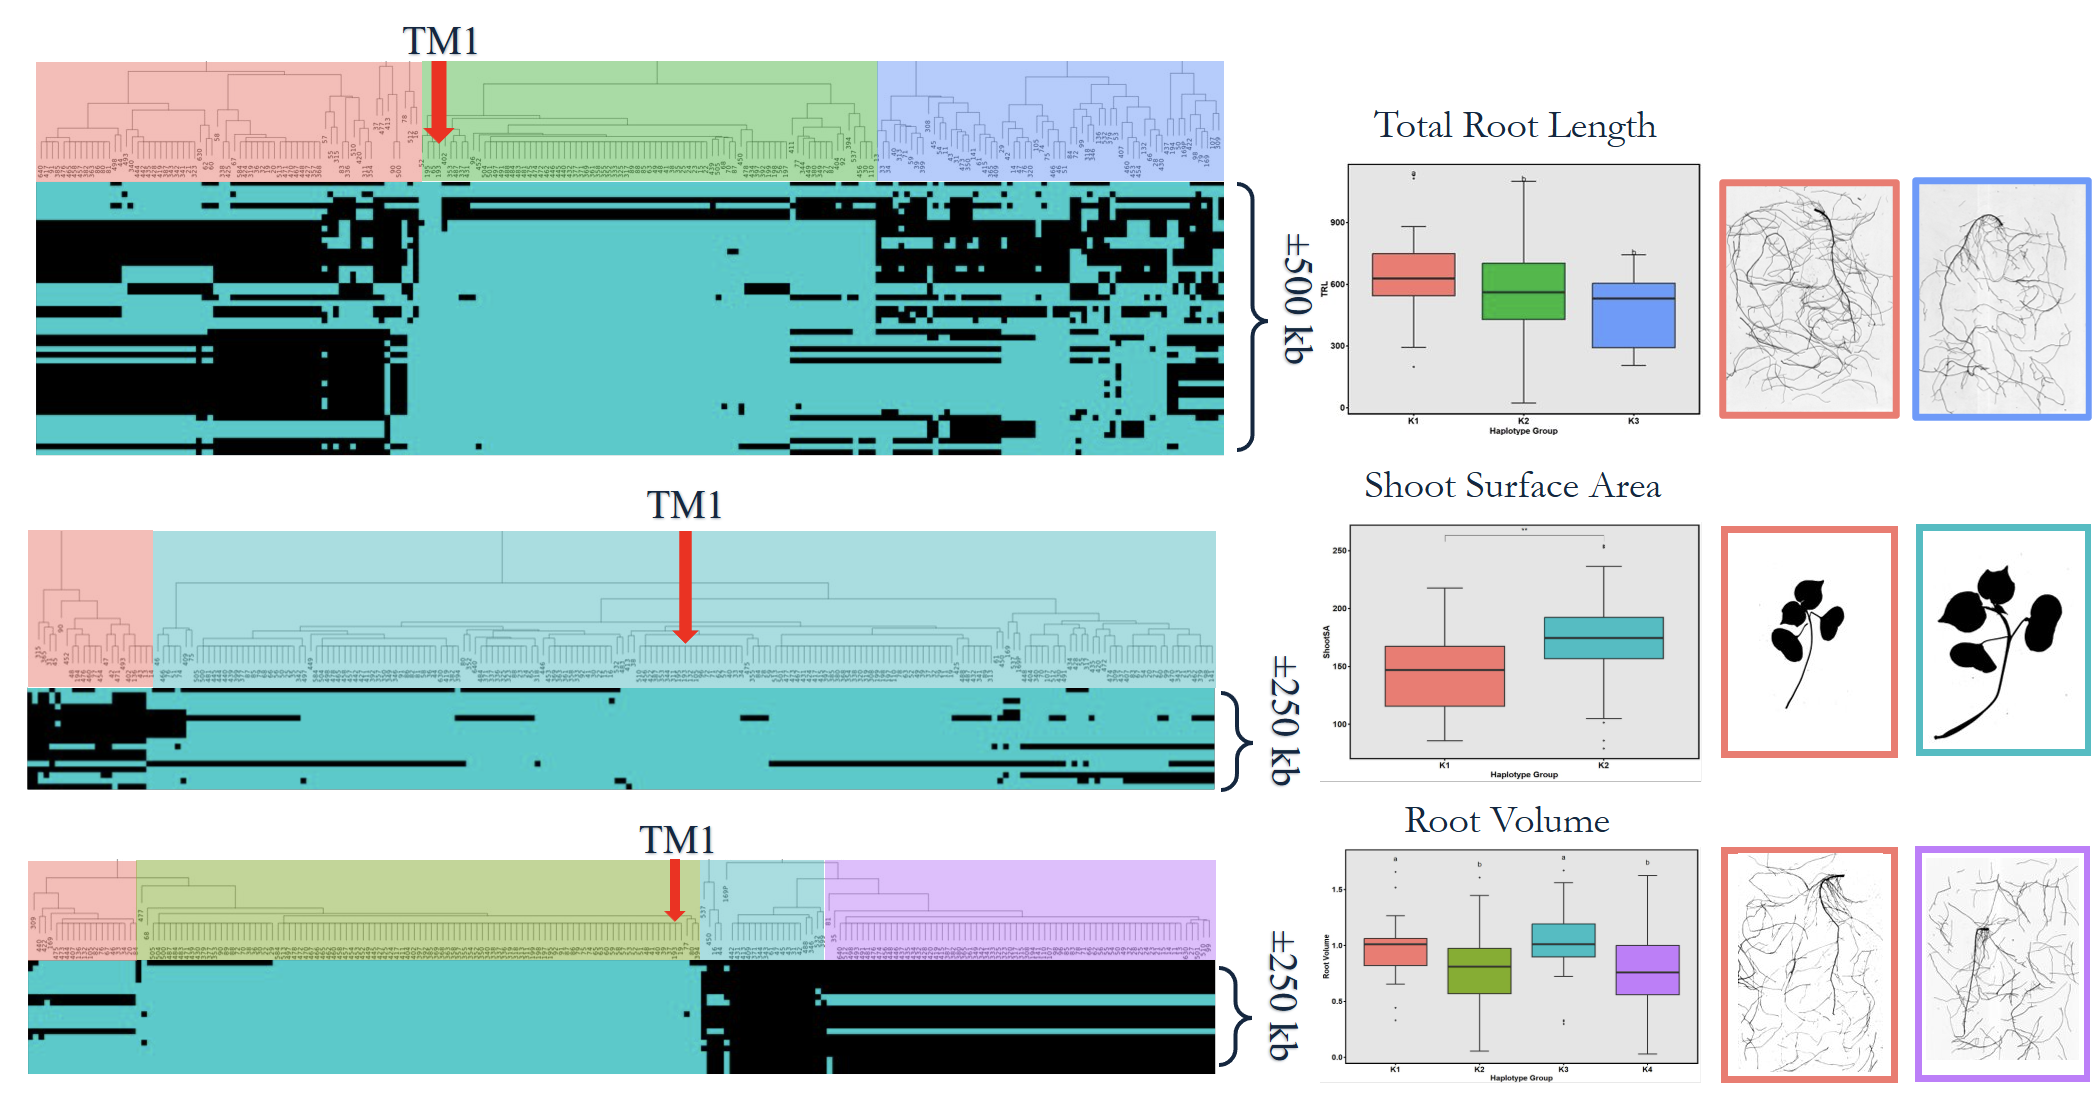
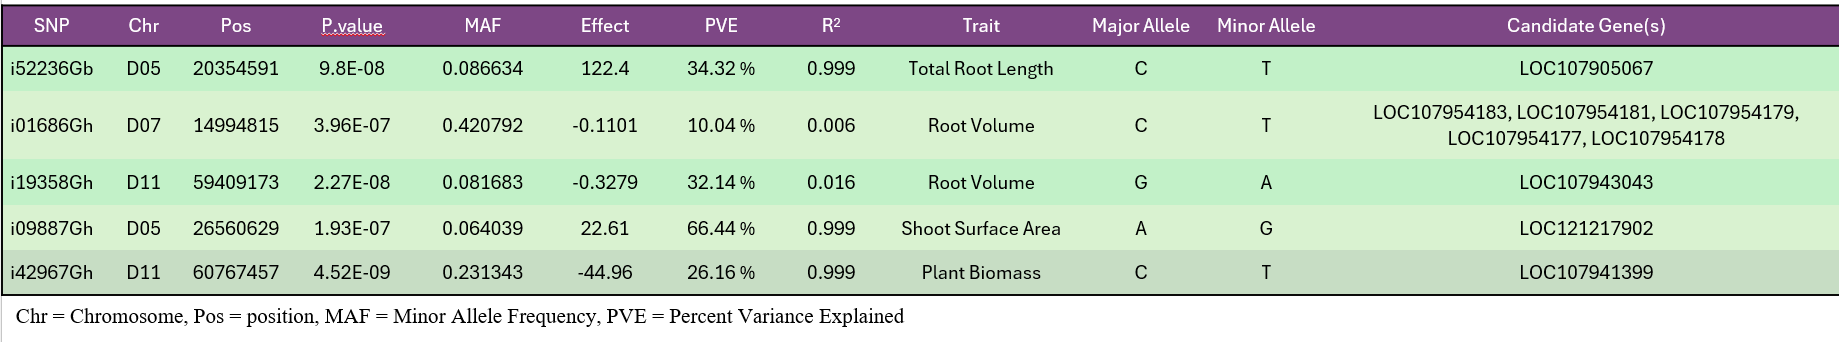
High-quality DNA from 282 accessions underwent genotyping using an 18K SNP array, producing 14,911 informative markers after filtering (Fig. 7). GWAS using the BLINK model identified six significant loci linked to RSA and shoot-related traits (Fig. 15). These loci explained moderate phenotypic variance and were associated with total root length, root volume, and shoot surface area (Fig. 16). Candidate genes in these regions (Table 1) included regulators of root elongation, auxin signaling, and water uptake. Field and greenhouse data integration confirmed consistent trends between genotypic and phenotypic variation.
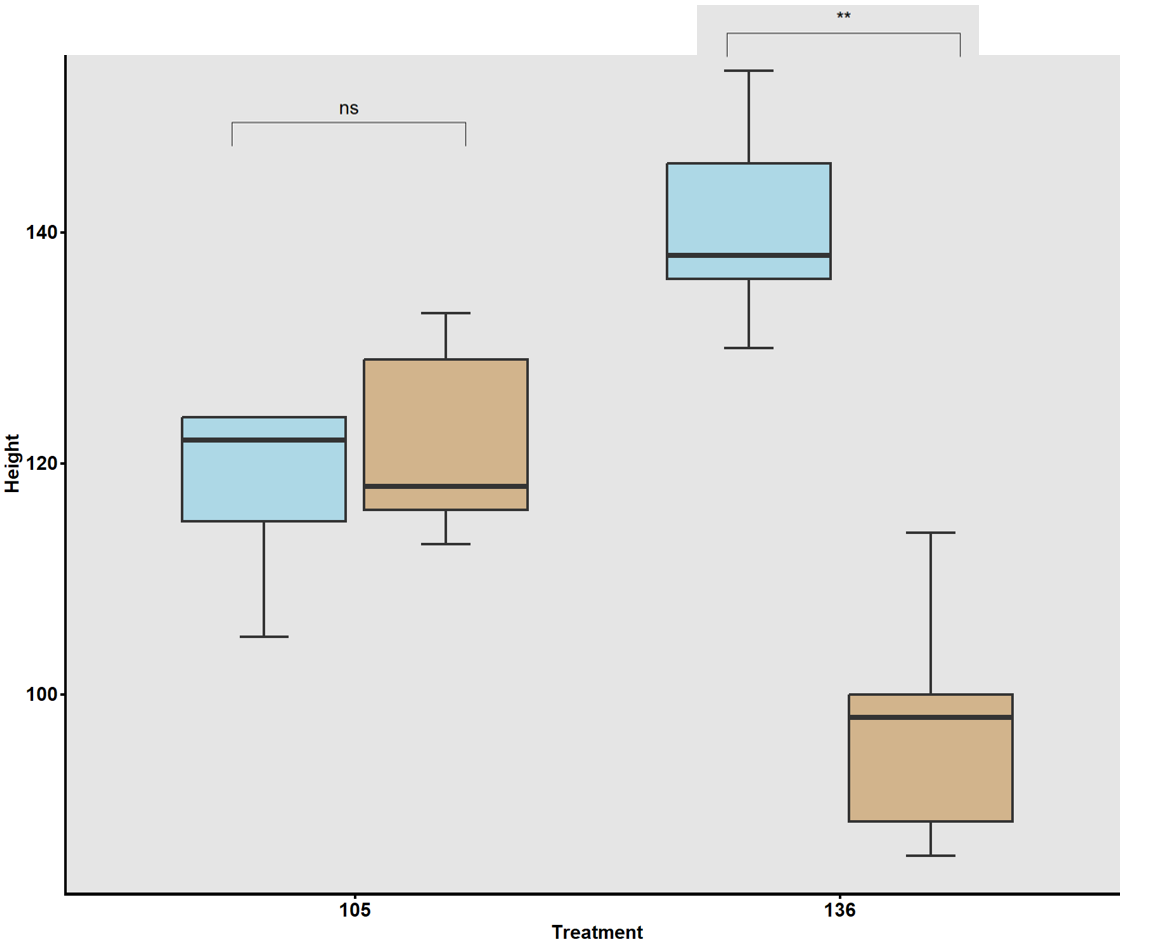
To validate GWAS findings, contrasting haplotypes were evaluated in 2025 using soil column experiments (Fig. 8). Accessions #105 (CC allele) and #136 (TT allele) displayed distinct RSA patterns: #105 had greater total root length and superior performance under both irrigated and rainfed conditions (Fig. 17), while #136 had shorter roots and reduced plant height under drought stress (Fig. 18). These validations confirmed a genetic basis for RSA-related drought tolerance.
Objective 4: Soil Moisture and Water Movement Analysis
Aqua Spy sensors were installed in both irrigated and rainfed plots to monitor real-time soil moisture up to 48 inches (Fig. 19). Data collected at 15-minute intervals showed that rain events primarily affected upper soil layers (4–8 inches), while irrigation influenced deeper layers (8–12 inches). After irrigation ceased, moisture profiles between treatments converged, indicating that plants actively depleted subsurface moisture. These results correspond with field RSA data showing deeper root penetration and efficient water uptake in drought-tolerant accessions.

Overall Findings and Integration
Across 2024–2025, cotton accessions demonstrated broad phenotypic plasticity and genotype × environment interactions. Rainfall differences between seasons provided a natural contrast for evaluating drought response (Fig. 20–22).
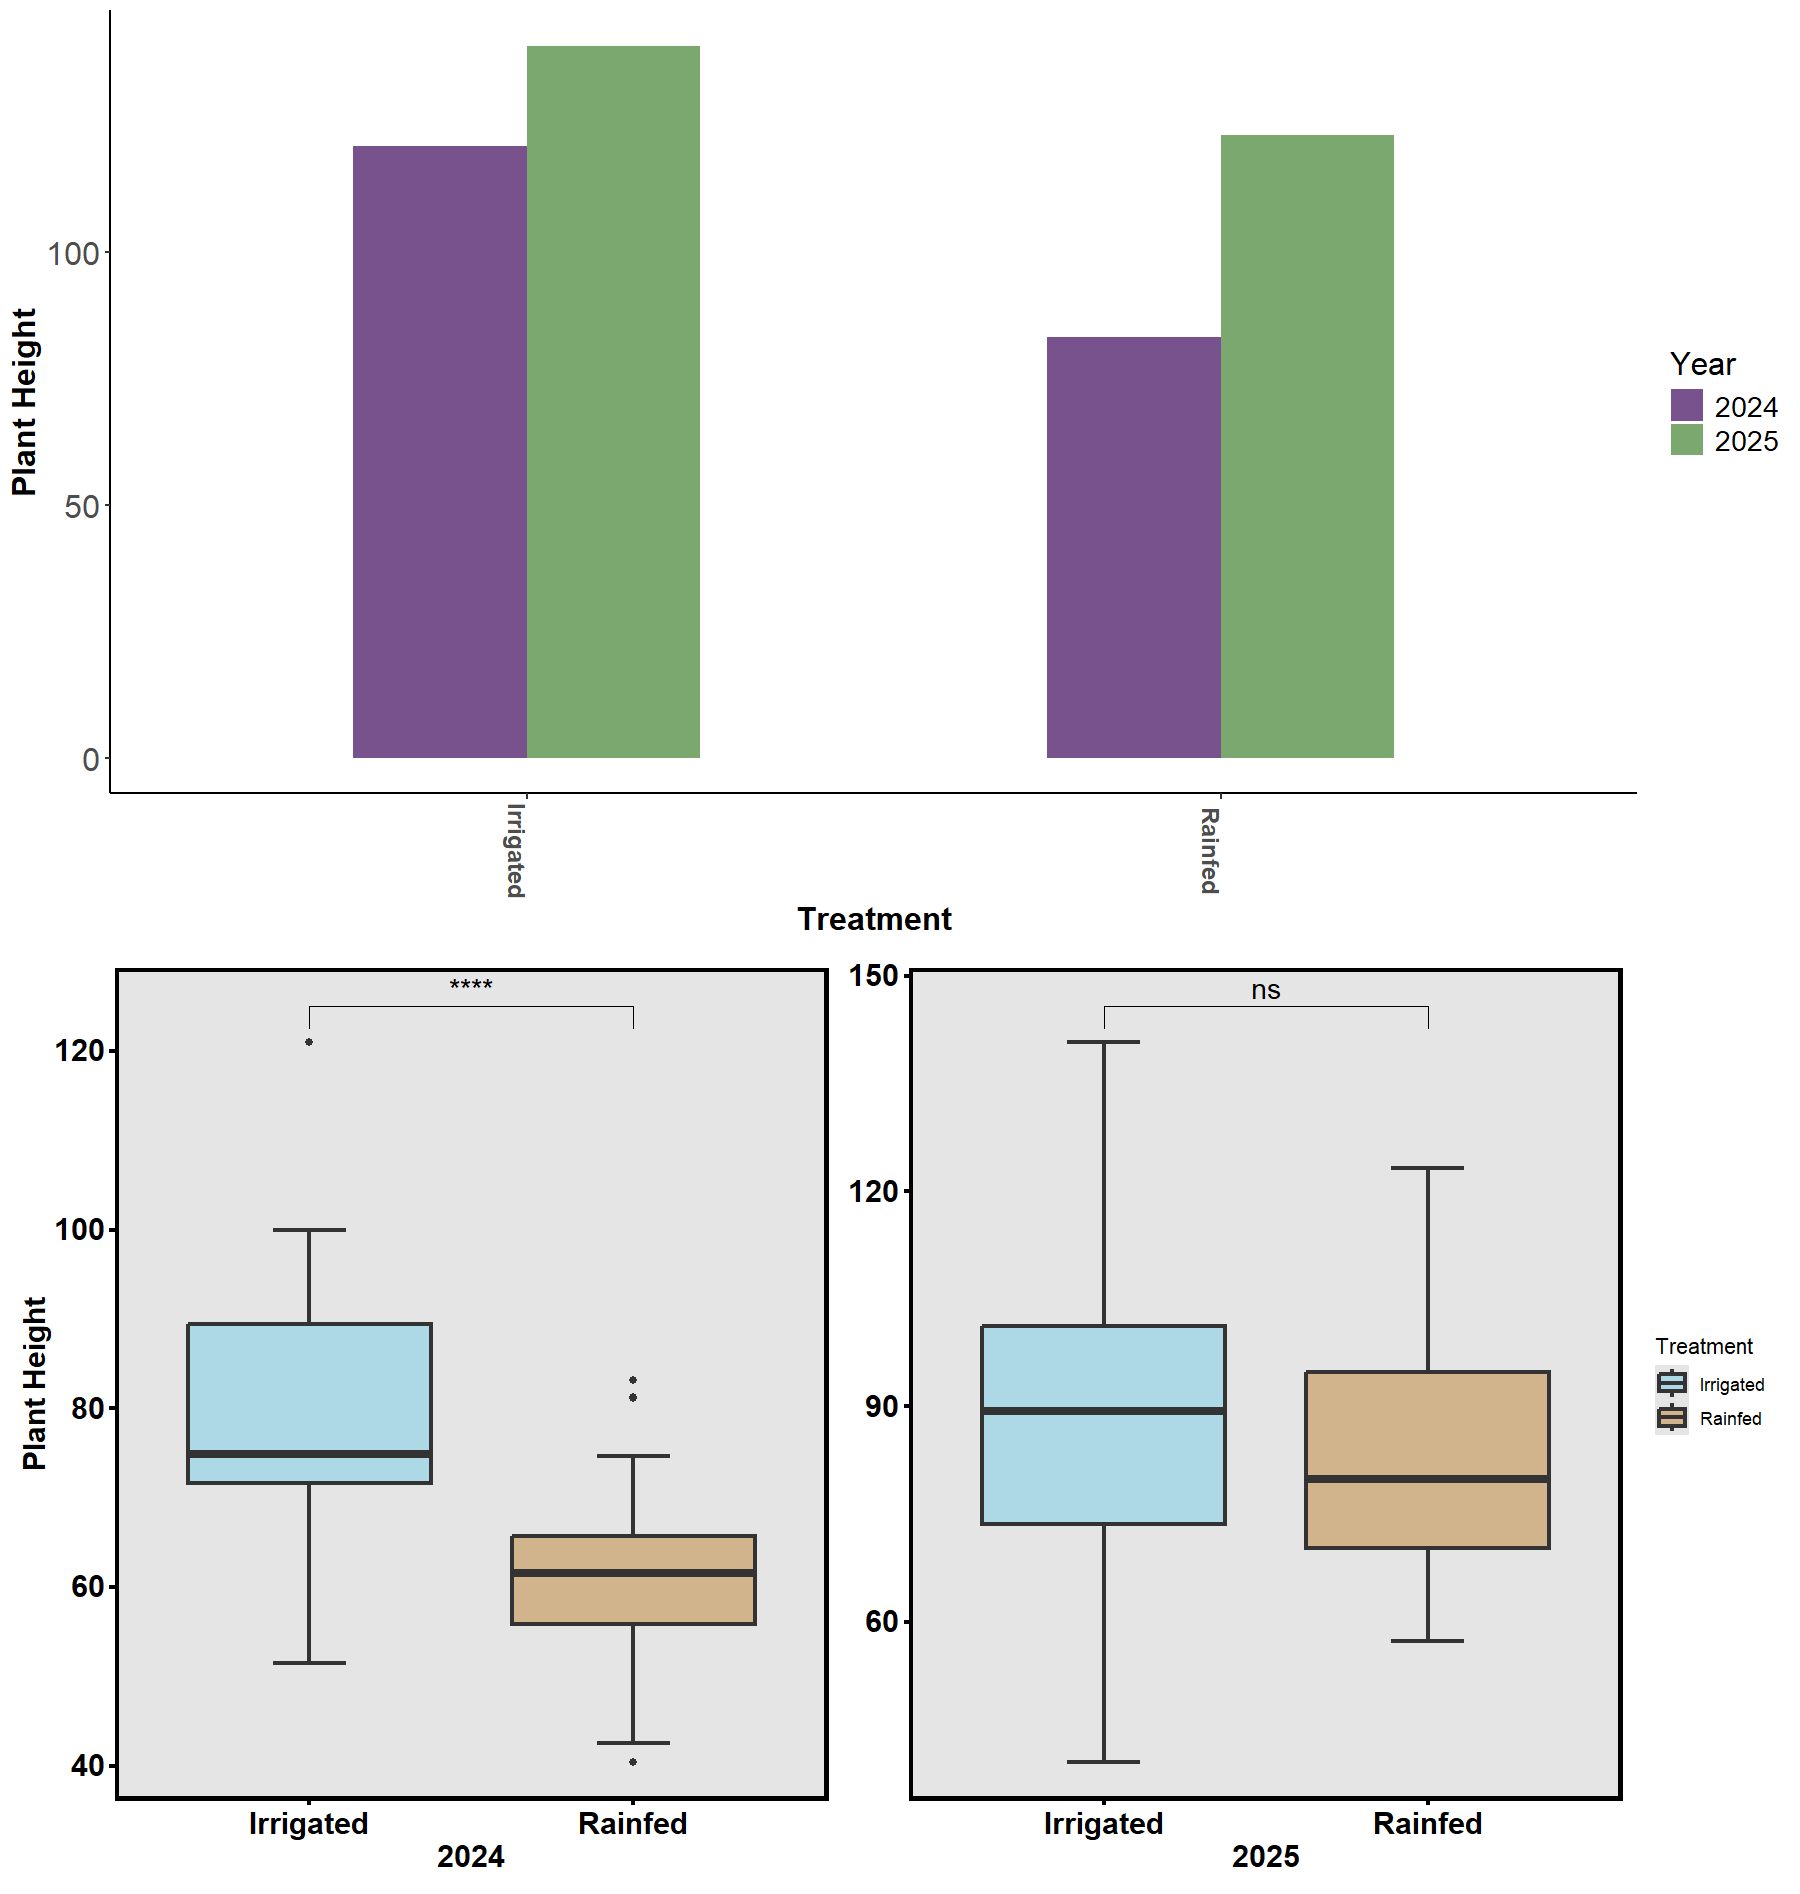


Despite environmental variability, accessions with thicker taproots and finer lateral roots consistently showed better drought resilience. Physiological assessments using the Li-Cor 600 Porometer/Fluorometer revealed differences in photosystem efficiency (PhiPSII; Figs. 23–24), suggesting that root traits interact with photosynthetic and stomatal responses to determine overall plant performance. The combination of genetic, physiological, and soil moisture data has established a foundation for predictive modeling of cotton drought responses.


Conclusion
This research provides a comprehensive understanding of the variability in root system architecture of upland cotton and its role in water uptake under drought. The integration of phenotyping, field evaluation, soil monitoring, and genomic analysis identified key accessions and genomic loci linked to improved RSA. These findings will enable breeding programs to target deeper, finer, and more efficient root systems for enhanced drought tolerance. Data resources generated through this project, including phenotypic, genotypic, and soil datasets, will be made available to support further genetic improvement of cotton cultivars adapted to water-limited environments.
Educational & Outreach Activities
Participation summary:
Presented my research at the 10th Annual Water College in January 2024. Farmers, sponsors, and educators were present at the event of over 200 hundred people.
Lamb, M. L. (2024, January 24). Optimizing cotton's root system to improve response to water-deficit stress [PowerPoint slides]. Institute of Genomics for Crop Abiotic Stress Tolerance, Texas Tech University. https://texastechuniversity-my.sharepoint.com/:p:/g/personal/miclamb_ttu_edu/Ede1MWpL2SxNu8MjQb-bWEYBcdg5L-_jzAUcg3wI-n_O8Q?e=dWC8qk&nav=eyJzSWQiOjI1NiwiY0lkIjoxMDk4NTcyMjJ9
Presented at the Agricultural Water Sustainability Summit, Lubbock, Texas, on August 9, 2024, a few hundred farmers, ranchers, and agricultural professionals attended the conference. My presentation was on the last day, towards the end of the conference, so only 12 people were present for my presentation.
I presented at the Beltwide National Cotton Conference on January 16, 2025, at the Center New Orleans, Louisianna. Although thousands of farmers/ranchers and agricultural professionals participated, around 50 were in attendance for my presentation.
Presented my field research at the Quaker Farm Field Day August 2024 with around 25 farmers, or Agricultural professionals
Project Outcomes
Suppose we can better understand the roots, how they relate to shoot traits, and the genetic relationships within root systems. It will save future generations time, labor, and money by enabling them to develop their crops with a better understanding of Root System Architecture (RSA). Because it is tough to view the roots to know what traits are being bred for and what root traits will be beneficial or not in different abiotic stresses, this project's goal is to gain additional understanding of methods of how to assess the RSA and also do it in an economically inexpensive way to better our understanding of the genetic mechanisms of the RSA.
The data suggest that cotton germplasm shows significant variation in RSA traits, and some accessions are more tolerant of drought than others. There could be strategies that involve altering the root system during drought stress to help the plant endure drought periods without suffering as much yield loss. By comparing the results of this study, we can select accessions with desirable RSA traits for further study and application in future breeding programs. Further analysis of GWAS results to better understand the potential genes that play a role in those traits will also help determine how to optimize the traits for drought tolerance. For example, in these experiments, accessions 132, 184, 80, and a few others that show promise of drought tolerance, as well as those that show drought sensitivity, can be narrowed down for more focused experimentation that can lead to even greater understanding of RSA's role in drought tolerance in cotton. With the goal of developing markers for RSA in cotton for breeders to be able to utilize some marker-assisted breeding for root traits.
We are still learning as we continue our progress on these experiments since beginning in September 2023. We have been learning how much work is required to learn something new, and also how much knowledge from so many other people is needed to build on each other. I am impressed by the time and effort required to understand even a single portion of a crop's systems. Let alone thinking about how all the systems within the crop and at each level of agriculture work together is mind-blowing. It is exciting to continue learning about all aspects of improving sustainable agriculture, and we hope to continue uncovering new insights to better serve society and agricultural partners.