Final Report for GW15-015
Project Information
The number of community supported agriculture (CSA) farms has grown since the model was first introduced in the United States nearly 30 years ago. However, current academic literature lacks specific studies that provide an in-depth analysis of a market for CSA shares over time. The purpose of this study was to provide a comprehensive overview of the supply and demand for CSA shares in the greater Fairbanks area through extensive data gathering of local production and farm statistics.
The research provides a narrative of how the market has developed and changed over time. Hedonic models provide real estimates of implicit prices paid for specific attributes of CSA shares in the market. A choice experiment and intercept surveys determined consumer preferences for CSA shares. Overall, the results of this research indicate that CSA farms are becoming more prevalent in the greater Fairbanks area and offer a growing number of consumers a diverse basket of vegetables over the short Alaskan growing season. Based on statistics gathered from the demand analysis, farmers in the region could increase revenues and capture a larger share of the market for produce in the greater Fairbanks area through increased marketing and more flexible share options. Other findings include attributes of the share which historically command a higher price including: increased number of weeks, additional products available for purchase, and tailoring shares to specific types of vegetables.
Introduction
The study area for the project is the Tanana Valley of Alaska, which includes the city of Fairbanks. As a state, Alaska is one of the most remote and isolated places in the United States. As a result, it faces a greater risk of food insecurity and potential for food shortages than more developed parts of the United States. As noted in Kaiser’s (2011) study, access to local food decreases the risk of food insecurity. Increasing access to local food will increase food security in the region which could have impacts on socio-economic outcomes for citizens. Completing a study on a source of local food in a rural environment such as Alaska will provide a baseline for both the supply and demand markets for local agriculture and provide data to help grow the market.
Broadly, this research explored the market for CSA shares in the region. The research answered baseline questions about the market such as: when did the first farm offer CSA shares? Or how many CSA farms are in operation today? Another goal of the research was to answer farmer and community member questions on the potential demand for CSA shares. Broadly, the research aimed to provide an overview of the CSA shares in the study area and their impact on the local economy. It will also serve as a reference point for comparison to other communities.
To better understand the relationship between CSA share attributes and price, a hedonic pricing model was estimated. CSA shares in the community vary drastically based on: share composition, length, pickup time, and location. These differences create differences in share price. A hedonic price model determines implicit prices for these characteristics which then might be helpful for farmers as they consider share pricing and offerings. Results from this analysis suggest large implicit price gains from extending the season (even just a week) and limiting the number of varieties included in the share.
Along with the hedonic model, an in-depth consumer survey was conducted. The survey included a choice experiment which was designed to determine the preferences and willingness to pay for CSA shares. The surveys also gathered information about general purchasing preferences, trends, and knowledge of CSA farms in the community. This information can then be used by farmers to direct marketing efforts and tailor the composition of future CSA shares.
1) To assess the relative contribution of CSA farms to local food production and the economy. The research will also identify constraints on production. This information will be used to determine factors which correlate with higher revenues and increased production.
- Farmer surveys: researchers will work with farmers in the area to gather all available information on production costs and farm yields. This will include cost details on sunk and variable costs, as well as quantity and variety of vegetable produced.
- Input-output/multiplier effects: given the availability of cost and output data, an input-output model will be constructed to provide another measure of the impact of agriculture on the economy.
- Case studies of long-standing farms: case studies of long-standing farms will be used to create a narrative. Case studies will provide a way to present qualitative knowledge gained from farmers. One topic will be to identify factors they attribute to success.
2) To provide an analysis of the demand for CSA shares. This research will help farmers plan and tailor their share to consumers’ preferences.
- Member and non-member surveys: current members will be surveyed to identify attributes of the CSA model they value. Non-members will be asked questions to identify reasons why they are not involved with a CSA farm. The survey features questions to draw out factors that are correlated with membership.
- Choice experiment: researchers will survey both members and non-members to identify what attributes of CSAs they most prefer. This experiment will also ask consumers their willingness to pay for a CSA membership.
3) To disseminate and provide research results in a way that is accessible and useful for farmers, academic researchers, and the public. Research findings will be presented at conferences and submitted to academic journals. Farmers will have access to findings through formal reports, visuals, a presentation, and handouts. Report summaries as well, as worksheets used for cost analyses, will be made available to potential farmers and the public. Results will be presented to the community at large.
Research
To achieve the study objectives, researchers met with all CSA farmers in the region. A contact list of farmers was gathered through word-of-mouth interactions with farmers and individuals involved with the local Farmers’ Market, through the University of Alaska Co-operative Extension, online databases of CSA farms in Alaska, as well as reading news articles about gardening and local farms. When first contacted, farmers were given a brief introduction to the project and asked to participate in an interview. During the interview process, farmers completed worksheets which were used to obtain information about share price, pickup time and location, length of season, varieties in share, distribution of recipes, farming methods, and availability of additional products for purchase through their farm. In addition, information on production methods and farm characteristics were also gathered. This information was then used to identify the number of farms which had operated in the market from 1997-2014, number of shares sold by year, yearly share price, industry costs, and revenues. A thorough analysis of costs and revenues were used to complete an input-output (I-O) analysis for the market of CSA shares for the region.
In 2014, 12 farms offered CSA shares in the community (see figure 1). Of the 12 farms in the community, 10 participated in the research which represents 83% of the market. This data represents nearly the entire market for CSAs the in greater Fairbanks area of Alaska since the first CSA farm offered shares in 1997. Along with current producers, attempts were made to contact farmers who have used the CSA model in the past but are no longer in operation, as well as, farmers who are considering using the model in the future. Due to data gathering techniques and participation of farms, this is the most complete market analysis of CSA farms in the region.
In addition to the farm data described above, consumer demand and preference data was gathered using intercept and emailed surveys. The survey was delivered through an online, secure survey platform so that it could be completed on personal computers or in-person on touchscreen tablets. The survey asked questions about current and past CSA membership, produce expenditures, opinions on local agriculture, socio-demographic information, and preferences for CSA shares (through a choice experiment).
The survey was designed to target two groups of people in the community; those who have been or currently are members of local CSA farms and non-members. A representative sample of non-members was elicited through surveying at the four major grocery stores in the greater Fairbanks area. Unlike other communities, these four grocery stores are virtually the only place to purchase grocery items and food (outside of restaurants) in the area. Researchers surveyed two days at each grocery store (one weekday and one weekend). Survey times were distributed across a morning (8am-10am), afternoon (2pm-4pm), and evening (6pm-8pm) time slot to ensure an unbiased sample of shoppers. The survey was delivered via touchscreen tablets. This allowed researchers to interact with survey respondents and answer questions if they arose (See Figure 2). In total, 221 surveys were completed in person. Respondents also had the option to complete the survey on their personal computers at their leisure. Of the 124 emails sent out to potential participants, 59 people responded via the emailed survey [response rate= 48%].
In order to capture CSA members in the sample, researchers worked closely with farmers to distribute the survey. In some cases, farmers released email addresses of past and current CSA members. In other cases, farmers were reluctant to release potentially sensitive information about their customers. Given that the market for local agriculture is predicated on close relationships with farmers and consumers, it is understandable that farmers may be hesitant to release their customer list. In this case, researchers worked with farmers to draft introductory emails and the farmer sent out a link to the survey. Personal identification numbers were used to ensure that participants did not take the survey more than once. To date, 67 members (17% of all CSA members) took the survey for a total sample size of 347.
The survey asked respondents various questions about their knowledge and participation history in CSA farms. While CSA membership was the focus of the research, in order to assess the market for local produce and potential market for CSA farms, questions addressing produce purchasing habits and thoughts on local agriculture were also included. These questions provided information on spending on produce per week, frequent locations of produce purchases, and knowledge of local farms and potential for growth of local agriculture. Combined with socio-demographic information, these statistics provided an accurate overview of the market for CSA shares in the community as well as identified trends in produce purchasing.
1) Supply analysis
The supply analysis sought to gather basic statistics and information about how the market for CSA shares in the region has changed over time. Through the methods outlined above, basic descriptive statistics are found in Table 1. Farms offering CSA shares are small, confined by the short growing season in Alaska, yet continue to offer a wide variety of produce in each share. The number of shares offered by the farm is consistent with previous studies (Lass et al, 2003). However, the real share price for this community is lower than other studies which cite share prices of $563.28/season (Lass et al, 2003). This study also considers the number of varieties present in each share. With a shorter growing season in Alaska, it is important to capture the selection of produce offered in each share and determine if the offering changed over time.
In the last 10 years, the number of farms offering CSA shares has increased from five farms to a maximum of 12 farms in 2014. In 1997, the first farm in the area began offering CSA shares. From 2005 to 2014, the number of farms offering CSA shares more than doubled. As a result, there was a large increase in the number of shares available to consumers. In nine years, the number of CSA shares has increased from 97 in 2005 to 386 in 2014, an increase of 297%. It is important to note that each share feeds multiple people. Farmers generally estimate that a full share will feed a family of four. Therefore, it is conceivable that these CSA shares are actually feeding closer to 1,544 households. * Real share price converted to 2015 dollars.
While the number of households subscribing to CSA shares increased over the last nine years, the real price for a CSA share was relatively constant and did not show an increase over time. In 2014, the average share price was $422.06. In general, farmers indicated that in the first few years they offered the share at a lower price for fear that they might be offering an inferior product. However, with new farms entering the market almost every year, the average price remains relatively stable. In fact, since 2011, share price has steadily decreased (see figure 3). This is likely due to farms starting to offer half shares at a lower price.
While generalizations about costs and revenues cannot be garnered from the dataset, the revenue per acre was calculated and can be used to compare this study area to other farms in the United States. Excluding an outlier and scaling to one acre, the average revenue per acre is $20,272. This is substantially higher than the average return per acre ($4,658.47) reported in Lass et al (2003)[1]. In addition, this figure is substantially higher than the estimates of revenue per acre for corn in Minnesota (769.90/acre) or soybeans (478.88/acre)[2] (Thiesse, 2014). However, farms are still not reporting high profits or generating high returns on investments or markups from operating costs. This is due to increased costs of production from operating in a geographically isolated and high latitude environment. In addition, the farms are small operations which do not benefit from economies of scale.
The research attempted to gather data that would allow researchers to make generalizable statements about the cost of farming in this region. However, there was a large range in cost and revenue information. As an example, in 2014, median yearly costs were $27,000 and median profits were $4,222.00. Yet, average profit was $13,403.55. The data also showed that farm revenue was highly correlated (0.75) with the number of years in operation. A correlation of 0.75, suggests that as the farmer gains experience in the market—and on the land—they are able to increase revenues.
These figures provide the first overview of the market for CSA shares in this region. They are useful for comparison to other study areas and provide context for future study and recommendations for growth. Overwhelmingly, the market for CSA shares is not similar to other areas researched. While this presents innumerable challenges for farmers, gathering baseline information for a study area which is unique will help future researchers and community members as the market for CSA shares changes.
2) Input-output model
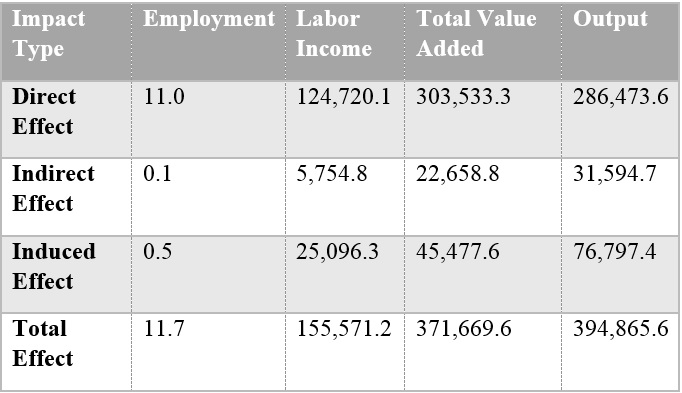
Input-output modeling takes information on sales of an industry and, based on multipliers defined for the region, shows how that sale money circulates from the producer to the surrounding community. It can be thought of as showing the impact of the industry to the community, or, in this case, showing how locally spent dollars stay within the community to have impacts on other industries and the local economy. In 2014, total industry sales for CSA farmers were $284,519.52. This includes only vegetable sales and does not differentiate between CSA shares and other vegetable sales including sales to restaurants, markets, and consumers. The model was adjusted for this particular region with specific values entered for employment (11 employees), employee compensation (1,749.26 on average), and proprietor income ($13,403.55 on average). These figures are averages based on information from nine farms. At a basic level, this research was able to show average income for seasonal workers and average farmer income (profit) are lower than averages cited in academic literature. Based on conversations with farmers, a short growing season explains part of the difference but food production in this area is a small operation. Almost all farmers have another source of income either through a second or seasonal job, and/or another source of income within their household.
Based on this analysis, CSA farms had a direct impact within the community of $258,473 in 2014 (Table 2). The total effect was $394,865.6—an increase of 66%. The indirect effect ($31,594.7) is the impact on labor, employment, and total value added on the CSA farmers purchasing supplies to grow the produce. The induced effect of $76,797.4 is the impact of wages on the surrounding economy. While the industry is small, this research found evidence to support that spending money on local growers does have an impact in the local economy and due to the isolated location, a large percentage of the money stays within the community.
Demand within the community and preferences for CSA shares was evaluated through a hedonic price model and survey of CSA members. Researching the determinants of CSA share price will determine market dynamics and identify ways for small, local farmers to capture a larger corner of the market, arguably increasing yearly revenues simply by tailoring marketing and the CSA model to better fit consumer preferences. The hedonic approach assumes that price differentials for a heterogenous good sold in a single market are driven by differences in the attributes of that good. In this instance, price differences in CSA shares across farms are driven by differences in share characteristics. The variables included in the hedonic model were full share versus half share delineation, number of weeks of produce provided, number of varieties of produce included in a share, pickup location, organic certification, and a set of variables which capture share composition by type of produce, i.e. leafy green vegetables, squash, or herbs (see table 3).
The hedonic pricing model was used to discern which specific attributes had a statistically significant impact on share price. First-stage hedonic analysis observes and record attributes of goods and final market prices and can determine implicit prices of goods to estimate a demand equation based on attributes defined in the model (Taylor, 2003). CSA shares display different attributes and preferences across farms. Furthermore, the hedonic approach provides a useful way to analyze consumer preferences for different attributes using observed market transactions. The hedonic model used in this analysis can be seen in equation 1.
The model above was estimated using the data gathered from interviews with farmers and data gathered from farmer worksheets. The most useful information from this section for farmers are the implicit price estimates. The implicit price shows the contribution of that attribute to the share price. The most relevant findings are presented below (see table 4).
The implicit price difference between full and half shares suggests that half shares, while nominally less expensive, are more expensive if considering the per-vegetable or per pick-up cost of the share.
- Not all vegetables are equally valued in a share. The largest implicit prices were found with shares that included herbs, squash, and green vegetables. The implicit price difference was negligible for high temperature produce—despite their increased cost of production—and negative for root vegetables.
- Each additional week of produce is valued at $81.29. This number shows that consumers are interested in purchasing as much local produce as possible and prefer farms with longer seasons. This finding suggest that farmers should explore using row covers or increasing their greenhouse space in order to increase the length of their season.
- Shares with additional pick-up days and times are priced lower in the market.
- In this market, certified organic CSA shares cost less than not certified shares. This finding suggests that in this market, the certified organic labeling does not command a higher price. Given the small sample size and unique surveying location, suggesting that organic certification is not valued by consumers would be inaccurate.
- As farmers increase the number of varieties in the share, implicit share price drops. While the actual implicit price is small ($2.70), it does show that there might be a cost for increasing the number of varieties. Some farmers note that they are not as adventurous or risky with their crop selection in order to cater to the customer. This implicit price decrease might highlight that increased variety is going to include more vegetables or obscure herbs that people do not enjoy or know how to prepare. It might be in the farmer’s best interest to focus on producing more popular varieties.
4) Surveys and choice experiment
As described in the methods section, researchers distributed a survey to members and non-members. Choice experiments are useful because they force respondents to choose between hypothetical (although theoretically real) choice bundles. Effectively, the choice experiment uses respondent’s stated preferences to model preferences where the hedonic model used market data. The variables included in the model can be seen in table 5.
When specifying the choice experiment, the price variable was truncated to range from $350-$650. This was for the simplification of the model, but also corresponds to real prices in the market for CSA shares. These numbers were chosen based on extensive research of the current market for CSA shares in the community and through communication with farmers. The choice experiment required the dependent variable (PRICE) to range from $350 to $650. This range was based on the current CSA share price in the market. Arguably, censoring the dependent variable excludes some observations. As a result a normal OLS model was used to analyze inconsistent parameter estimates (Cameron and Trivedi, 2009). In order to gain consistent parameter estimates, a tobit model was used. A tobit model provides consistent parameter estimates in cases where the dependent variable is only observed over a specific range. Attributes of the winning combination (hypothetical share) are coded as dichotomous variables (0 or 1), which represents, based on price, the respondents most preferred CSA share.
The average winning price for the respondent was $446.68, which is only .8% higher than $443.06—the current average price for a CSA share. A distribution of the price of the winning CSA bundle identified by participants is described in figure 4. When considering willingness-to-pay of members and non-members, on average members were willing-to-pay $453.13 and non-members were willing-to-pay $444.73. A two tailed t-test of means shows that reported member willingness-to-pay is not statistically significantly different than non-member willingness-to-pay (T=-0.88 P=.378).
Additional findings included the following:
- Consumer’s willingness-to-pay is higher when they have a choice in the produce they receive. While most CSA shares do not give the member any choice in the produce they receive, some CSAs now offer additional purchasing options (such as weekly flowers, herbs, or tomatoes). Other CSAs have a set offering and then allow members to choose between a few vegetables each week based on availability. Consumers prefer having these options to a set bundle every week.
- Consumers prefer shares with vegetables grown in row covers or greenhouses (tomatoes, peppers, some herbs, etc.) to just field vegetables and will pay more for shares with produce grown in a greenhouse. Given Alaska’s northern climate, investing in greenhouse space is costly for farmers. However, this research shows that consumers value the high-temperature produce.
- Consumers will pay more for CSA shares that last 16 or 18 weeks compared to 14 weeks. While 18 weeks is not feasible for most growers, this research suggests that extending the season as long as possible is preferable to consumers. From a farmer’s perspective, this could include using a greenhouse or row covers to extend the season. Moreover, farmers could add varieties to include early season greens and herbs as well as late season root vegetables and hearty greens to ensure that members receive more weeks of produce.
- When considering pick-up day, consumers indicated that they would pay more for a weekend pickup day or the option of two pick-up days (one weekend and one weekday) compared to one weekday pickup time. Consumers would pay less for having the share delivered.
In addition to the information gathered above, the project gathered information on socio-demographics of CSA members, preferences for CSA shares, and reasons why individuals are not currently CSA members. The most relevant findings from this section of the study include:
- Non-members are largely unaware of CSA farms and local production. When asked if they knew what it meant to belong to a CSA farm, only 41% of non-members answered yes. When pressed further, only 8% of non-members correctly identified that 11-15 farms in the area offer CSA shares. Consequently, farmers have an opportunity to increase outreach and marketing efforts to educate these consumers. With increased awareness, these consumers might then join the CSA or purchase other products from the farm.
- The survey asked participants if they would be interested in joining a CSA farm in the future. In total, 62% of members suggested they would renew their membership and 22% of non-members said they would join. The respondents who answered that they would not join a CSA next year or were undecided about future membership were then asked their reasons for not joining a CSA or why they might sign up. Most participants (43%) indicated that cost was a limiting factor to them joining a CSA. Other answers included: other (18%), too much produce (9%), no choice in produce (10%), or traveling/not in the area (11%). Almost all participants who selected “other” reason cited personal gardening or local food production as a reason for not joining a CSA.
- This study determined that members surveyed spent $49.80 each week during the summer on produce where non-members indicated that they spent $57.00 on average (see figure 5).
A two tailed t-test of means shows that reported member household spending on produce is not different than non-member produce purchases (t statistic=-1.48 P=.14). This suggests that members and non-members spend the same amount of money each week on produce.
These additional findings show that while the knowledge of CSA shares and local produce purchasing options may be limited, increased marketing and education efforts might be incredibly beneficial for increasing customers to any given farm. From an economic perspective, this suggests that demand is not satiated and the market for local produce will continue to grow. Also, while cost is a major factor in the decision to join a CSA, this concern is largely unfounded. This is supported by respondent’s reported per-week produce expenditure and compared to the average cost of a CSA share. Efforts to educate the public on the true costs of local produce could motivate some non-members to purchase a share.
While the most farmers are satisfied with the traditional CSA model, this research shows ways that farmers could increase membership to capture more residents of the area or change their current method and command a higher price. Some of the findings are contradictory to academic literature and hopefully will provide farmers and future researchers information on the current market and potential directions for improvement and growth.
5) Results
Results were made available through formal and informal presentations and availability of written documents. The research was at academic and community presentations with visual aids available for future use and for those who were not able to attend. Worksheets and handouts designed to gather data are also readily available. These could assist farmers and researchers in gathering additional data or supplemental years for future analysis. Other reports and written dissemination information is available to the public, farmers, and future researchers. As written in the proposal, a large part of this project was providing a starting point for characterizing the market for local produce in the region. By researching CSAs and the demand for CSAs, future studies can build on the techniques and knowledge garnered to date. Ensuring that this information is readily available and publicized within the community was important.
[1] Average income from CSA $33,541, average acre 7.2
[2] Inflated to 2014 dollars.
- Equation 1
- Table 1: Market for CSA shares in the Tanana Valley of Alaska (greater Fairbanks Area)
- Table 3: Descriptive statistics of variables on the market for CSA share in the Tanana Valley of Alaska (greater Fairbanks Area) from 1997-2014.
- Table 4: Implicit prices for CSA shares based on farms in the Tanana Valley (greater Fairbanks area) from 1997-2014.
- Figure 3: Real price for CSA share in the Tanana Valley (greater Fairbanks area) from 2005-2014.
Research outcomes
Education and Outreach
Participation summary:
As indicated in the objectives, disseminating the results of the research was an important component to the study. A website was created to store and provide access for those interested in the research. The website features: updates to the project, copies of the surveys, copies of the worksheets and interview questions for farmers, all presentations delivered, and written dissemination material. Additional links to published academic articles as well as other written material can be found on the website as it becomes available.
The research was presented at two national conferences and two community presentations. The national conferences included the National Value Added Agriculture Conference in Austin, TX (May 2015) and the Western International Western Economic Association International Conference in Honolulu, HI (July 2015). The two community presentations included the thesis presentation during the defense and a community presentation hosted by a local organization. These presentations afforded the opportunity to frame the project for different audiences and tease out relevant findings for each group.
All material produced from this project can be found at: http://tananavalleycsas.wordpress.com.