Final report for GW17-021
Project Information
This study takes a systems perspective to evaluate the effects of diversifying organic crop rotations with quinoa. Agroecological parameters that directly and indirectly affect the sustainability of organic cropping systems are being measured. By conducting integrated on-farm research and educational outreach, this project will fill critical knowledge gaps regarding dryland organic crop rotations, including the introduction of quinoa.
Objective 1: Evaluate the agronomic performance of the cropping sequences of each treatment
Sub-objective 1a: Quantify crop productivity and quality
Sub-objective 1b: Determine abundance and diversity of insect pests and their natural enemies
Sub-objective 1c: Evaluate weed populations and management strategies
Objective 2: Assess soil chemical, physical, and biological properties under each treatment
Sub-objective 2a: Track soil fertility and related properties throughout the crop sequence treatments
Sub-objective 2b: Quantify colonization and carryover of AMF in crops/soil throughout the sequences
Objective 3: Measure the economic performance of the different organic quinoa and grain cropping sequence treatments
Objective 4: Disseminate project information to producers, consumers, extension agents, and students through field days, extension bulletins, webinars, and meetings
Cooperators
Research
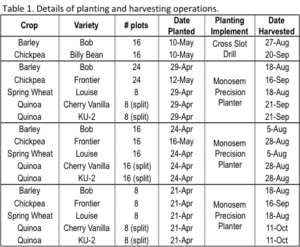
Objective 1a: Quantify crop productivity and quality. Crops were planted and harvested as described in Table 1. Field preparation consisted of using an undercutter (sweep) to terminate alfalfa, and in later years light disking and rotary harrowing to prepare the seedbed for planting. Yields were calculated at the end of each growing season from a plot combine harvesting a strip from the center of each plot. Appropriate quality analyses were performed for each crop.
Objective 1b: Determine population densities of pests (aphids and lygus bugs) and their natural enemies. Insects were collected from all plots 2-3 times each growing season (only 2 sampling times in 2015 because of a short growing season). Insects from each collection were sorted and counted.
Objective 2a: Assess status and change of soil quality and fertility. Soil samples were taken from all plots of Entry 1 in spring 2013 (10 May) and subjected to each of the analyses described in the proposal, including a complete fertility analysis, N mineralization potential, microbial biomass by fumigation extraction (soluble C and N) and respiration methods, and particle size analysis of the top 30 cm (0-10 cm and 10-30 cm). Inorganic N content of the soil profile to 1.5 m was also extracted. Post-harvest samples were taken in fall 2013 and extractions performed to evaluate inorganic N levels. We also analyzed aggregate size distribution on fall soil samples. This additional analysis (not in original proposal) was added based on observations from local producers about possible soil structure change following quinoa cultivation. We continued evaluation of aggregate size distribution of soils in each plot after each year of the crop rotation.
In 2014 the second entry of the rotation sequence began, bringing the total to 96 plots. Surface (0-10 and 10-30 cm) soil samples taken from Entry 2 in spring of 2014 were sent to Soiltest Farm Consultants for the complete fertility analysis. Additionally, all of the fertility and biological tests described above were performed on soil samples from all 96 plots. Subsurface soil sampling to 1.5m was analyzed for inorganic nutrient content. Post-harvest soil samples were also taken from the surface 30 cm and subjected to inorganic N extraction and analysis of aggregate-size distribution.
Soil sampling was performed again in spring 2015; all plots were sampled to a depth of 1.5 m for accounting of inorganic N in the soil profile. Subsamples from the surface (0-10 and 10-30 cm) were also analyzed for P content, N mineralization potential, microbial biomass C & N, and respiration incubations, as performed each year. Post harvest samples were taken from the surface 30 cm and are being analyzed for inorganic nitrogen and aggregate size distribution.
Soil sampling in spring 2016 and subsequent analyses were completed as in previous years. Subsamples from Entry 1 were sent to Soiltest for the comprehensive soil fertility testing, as that entry set of plots completed the full 3-year sequence testing.
The final soil sampling of Entry 2 plots occurred in Spring 2017. Subsamples were sent to Soiltest Farm consultants for the comprehensive fertility testing. All laboratory analyses are complete, but data is still being analyzed.
Objective 2b: Evaluate and quantify colonization of AMF. Root samples for all crops were collected from all Entry 1 plots (n = 40) in 2014 at the time of peak vegetation before crop maturity (July). Roots were processed as described in the proposal and visual counts of colonization of AMF were performed. The process was repeated for all plots in 2015 (n = 88) and 2016 (n = 40). Preliminary data from 2015 and 2016 show positive colonization of AMF in quinoa roots, but lower compared to other crops.
Objective 3: Measure the economic performance of the different farming systems. Data, such as input costs, equipment used, time required for each field operation, and crop prices were collected to create enterprise budgets that will determine the profitability of each treatment (rotation sequence).
Objective 4: Disseminate our findings to farmers, agricultural professionals, consumers, and research and extension agencies. Our activities towards objective 6 are described in the “Outreach & Education Activities” section.
The results from this project are still in preparation. The final results will be shared in poster format on the project’s webpage when complete. Here we will share some of the preliminary results from objectives 1 and 3, regarding the yield and economic performance of the crop rotation treatments during this experiment.
Crop Yields
Over the course of the study, barley, chickpea, quinoa, and spring wheat yields averaged 2552, 544, 104, and 2402 kg ha-1 respectively. These average barley, chickpea, and wheat yields were 68%, 35%, and 71% of the county averages for these crops during the same period, and around 30% of quinoa grown conventionally nearby.
Barley yields were significantly affected by treatment and by the treatment x entry interaction (P<0.0001). Higher average yields were observed for barley grown in year two of the cropping sequence compared to year one of the sequence (following chickpea compared to following alfalfa). The treatment x entry significance is likely driven by the very different weather years in 2015 versus 2016 (year 3 for Entry I and Entry II, respectively), which contributed to the very high barley yields in 2016. There was not a significant difference between barley yields following wheat or quinoa (year 3 of the sequence).
Chickpea yields were significantly affected by treatment (P=0.0001) and treatment x entry interaction (P=0.0010). These differences, however, appear to be driven mostly by the differing weather across growing seasons, as there are no consistent trends for yield by sequence years or by previous crop. Specifically, 2015 was a very bad year for chickpeas, with some plots having a complete crop failure (zero yield).
Wheat yields varied significantly by treatment (P=0.0036) and treatment x entry (P=0.0002). This was driven largely by the high wheat yields in 2016. That year also resulted in significantly higher wheat yields following barley than the yields of wheat following chickpea. However, that trend did not appear in year 3 of entry I, where there were no significant differences in wheat yields across treatments, and the highest yields for wheat were observed in year 2 of the rotation (2014 for entry I).
Quinoa yields differed significantly by treatment (P=0.009), entry (P=0.040), and treatment x entry (P=0.0005). The significant differences are largely driven by differences in growing seasons (again, the weather in 2015 was detrimental to quinoa yields), however; there was a consistent trend of average quinoa yields being slightly higher when following barley than when following chickpea.
Grouping the treatments as quinoa-inclusive (BCQ, BQC, CBQ, and CQB) or wheat-inclusive, comparisons can be made for the overall yield (total yield from the 3-year crop sequence treatments). For both the quinoa and wheat groups, there were significant effects of treatment (P<0.0001, P<0.0001) and treatment x entry interaction (P<0.0001, P=0.012). In both groups, there were no significant differences in yield between the treatments for entry I. In entry II, the treatment CQB had the highest yields (due to 2016 high barley yields) (Figure 1a). Treatment CBQ was the next highest yielding treatment in the quinoa group. In entry II for the wheat group, treatments beginning with chickpea (CBW and CWB) yielded significantly more than the treatments beginning with barley (Figure 1b).
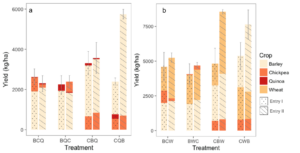
Figure 1. Overall yields for the sequence treatments, by crop for both entries; (a) shows treatments with quinoa, (b) shows treatments with wheat.
Economics
Treatment and the treatment x entry interaction were significant for sales (P<0.0001, P= 0.013), net returns over variable costs (P<0.0001, P=0.007), and returns to total costs (P<0.0001, P=0.004) for the 3-year treatment sequences.
The highest sales value in both entries was from treatments CWB, which averaged $1033 ha-1 in sales over the 3-year period. However in both entries, that treatment was not significantly different from the second and third highest treatments, CBW and CQB, with averages sales of $964 and $783 ha-1 respectively. The lowest sales came from BCQ in both entries, averaging $467 ha-1 for the sequence.
Net returns followed similar trends. Both net returns over variable costs and returns to total costs in both entries were highest for treatments CWB and CBW (averaging $639 and $566 ha-1, respectively). In Entry II CQB remained the third-highest (and not significantly different) treatment for net returns, but in Entry I there were fewer differences and only the lowest returning treatment, BCQ, statistically differed from the higher returning treatments.
The economic returns also allow us to make comparisons of the quinoa-inclusive treatments to the wheat-inclusive treatments. Net returns were significantly higher in wheat treatments than in quinoa treatments (average $223 ha-1 higher). There was also a significant difference in net returns when the 3-year sequences began with barley versus beginning with chickpea. The chickpea-started sequences averaged $296 ha-1 higher net returns.
Operating costs were equal within each crop in a given year. The largest differences in operating (input) costs came from the cost of seed. Chickpea was the most expensive seed, and with the exception of 2014, growing chickpeas resulted in negative returns to operating costs. Establishment years (2013 and 2014 for Entry I and Entry II, respectively) had higher operating costs due to more tillage passes (terminating alfalfa) prior to planting in those years.
Table 2.Table 2. Sales and net returns of the 3-year sequence treatments. Letters indicate significant differences (using Tukey’s HSD adjustment for pairwise comparisons) between treatments within each entry.

These treatment sequences were not designed to be the only part of this cropping system. The alfalfa phase of the crop rotation is important for soil building, weed control, and the economic returns. Organic alfalfa sales, especially in recent yields, fetch a high premium. Using average yields from this field, enterprise budgets were calculated for the entire 7-year rotation (one year of alfalfa establishment and three years of alfalfa sales plus the three year sequence treatments). These budgets show that the organic cropping system, in many cases, can be as or more profitable than the net returns to variable costs of a typical conventional rotation for this area averaged over the same 7-year period (Figure 2).
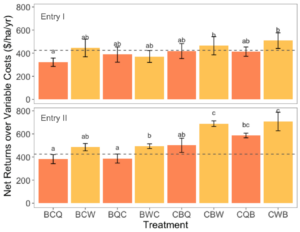
Figure 2. Net returns of 7-year rotations with alfalfa, as compared to conventional regional average. Letters indicate significant differences (using Tukey’s HSD adjustment for pairwise comparisons) between treatments within each entry. Dotted line represents the average net returns of the same 7-year period of a typical conventional rotation for this area of winter wheat - spring barley - chickpea and county average yields.
Research outcomes
Education and Outreach
Participation summary:
We utilized of a number of opportunities to communicate with farmers, agricultural professionals, and research and extension agencies about this project.
Multiple field tours of our research plots have been given to interested parties, including Zach Wailand (Dharma Ridge Farms, Quilicine, WA), Ian Clark (Clark Family Farms, Pullman, WA), and a group of 6 company leaders from Lundberg Family Farms (Chico, CA). Drs. Murphy and Carpenter-Boggs and Ms. Wieme shared information from this project at the Eggert Family Organic Farm Field day in July 2014, which highlighted quinoa research for the region.
This project was featured in two more field days during the summer 2015. Ms. Wieme presented on this project during a Tilth Producer’s farm walk at the Zakarison Partnership, which included a tour of the research plots for the 33 attendees. Ms. Wieme also presented on this project (again, including a field tour of the plots), with additional focus on the AMF component, during a Soil Biology Workshop (“One-day University”) led by Dr. Carpenter-Boggs and organized by Tilth Producers of Washington, which boasted 28 participants.
Ms. Wieme gave a presentation and field tour to representatives from High Mowing Organic Seeds in 2016. Additionally, Dr. Reganold and Ms. Wieme gave interviews and demonstrations at the field site as part of an upcoming film documentary examining various agricultural practices (organic, no-till, and conventional) in the United States. The company conducting the interviews and producing the film is IFA MEDIA from Taipei, Taiwan and Bangkok, Thailand, with the film being directed by Yen-Ming Lai (Spencer) of Public TV Service in Taipei, Taiwan.
Ongoing outreach continues through our project webpage, which features the project description, links to the research team biographies, photos of the field site, announcements/events, and links to other relevant websites and information. The webpage can be found at: http://csanr.wsu.edu/organic-quinoa-production/