Final report for GW17-040
Project Information
Economic efficiency of cattle production is threatened by high feed and input costs (Meyer and Gunn 2015). To improve profitability and transition to reduced reliance on transported harvested feeds, many cow-calf producers have adopted management strategies involving dormant season grazing (Adams et al. 1996). The primary goal in a forage-based livestock production system is to obtain optimal animal performance while effectively utilizing the forage resource base. Dormant range forage is deficient in nutrients and may result in decreased performance (Krysl and Hess 1993, Bowman et al. 1995, Mulliniks et al. 2013). Providing protein supplements to grazing beef cattle during times of low forage quality can improve animal performance and provide increased economic returns (Lusby et al. 1967, Bowman et al. 1995, DelCurto et al. 2000, Bodine et al. 2001). However, supplementation strategies assume that all animals consume a targeted quantity of supplement, which ignores variation of supplement intake by individual animals (Bowman and Sowell 1997). Deviation from the targeted consumption of supplement can have strong effects on animal nutirent status (Bowman and Sowell 1997). Effectiveness of supplementation programs on grazing cattle performance have been inconsistent (DelCurto et al., 1990). This inconsistency may be due to variation in supplement intake by individual cows, often influenced by social dominance associated with age class within the herd (Wagnon, 1965; Friend and Polan, 1974).
Winter grazing typically exposes cattle to periods of severe cold which increases energy expenditure to maintain homeothermy (Webster, 1970, 1971). In addition, at cold temperatures wind induces a higher metabolic rate and heat production (Webster, 1970; Christopherson et al., 1979). Thus, winter conditions can have considerable economic impact on the energetic efficiency of cattle production on rangelands (Webster, 1970). Potential changes in energetic requirements to maintain homeothermy could alter supplement intake during winter months.
The spatial component of herbivory is a central aspect of domestic livestock ecosystems, but has remained difficult to interpret (Coughenour 1991). Topography, thermal environments and forage resources, such as standing crop and nutritional quality, interact to determine space use (Malechek and Smith 1976, Jamieson and Hodgson 1979, Adams et al. 1986, Beaver and Olson 1997). Livestock age, experience, body weight and condition can also directly influence grazing behavior, distribution patterns and forage resource use (Holmes et al. 1961, Allden 1968, Langlands 1968, Allison 1985, Dunn et al. 1988, Walburger et al. 2009). Furthermore, supplementation alters the nutrient status of grazing livestock, which can have strong influences on grazing behavior (Allison 1985, Adams et al. 1986). The act of supplementation alone can change grazing distribution on rangelands (Ares 1953) and daily grazing activities (Adams 1985), altering the distribution of vegetation use based on location of supplements. Thus, it is likely that grazing behavior may vary with protein supplement intake and/or cow age, body weight and condition in dormant-season grazing systems.
Although dormant forage tends to be more tolerant of grazing pressure (Holechek et al. 2004, Petersen et al. 2014), dormant season grazing has been shown to have detrimental effects on vegetation production and residual cover when improperly managed (Willms et al. 1986, Bullock et al. 1994, Holechek et al. 2004, Petersen et al. 2014). Removal of vegetation and litter cover through grazing, reduces soil organic matter, which can be detrimental to agroecosystem efficiency and soil productivity (Greene et al. 1994, Wander 2004). Additionally, vegetation composition and structural heterogeneity are key habitat characteristics that influence wildlife species diversity and ecosystem function (Christensen 1997, Wiens 1997, Bailey et al. 1998, Fuhlendorf and Engle 2001, Fuhlendorf et al. 2009). Habitat structural heterogeneity serves as a precursor to biological diversity at most levels of ecological organization and has been proposed as the foundation of conservation and ecosystem management (Christensen 1997, Wiens 1997, Fuhlendorf and Engle 2001). Western rangelands are inherently heterogeneous as vegetation composition and structure vary with topographic and edaphic features (Patten and Ellis 1995, Fuhlendorf and Smeins 1998, Fuhlendorf et al. 2006). However, protein supplementation can been used as a tool to alter grazing distribution to promote uniform utilization across the landscape (Bailey and Welling 1999). Livestock grazing management promoting uniform utilization can result in the homogenization of rangeland landscapes and an overall decline of ecosystem structure, function and biodiversity, which can have a profound effect on grassland wildlife habitat selection and demography (Dennis et al. 1998, Fuhlendorf and Engle 2001, Anderson 2006, Derner et al. 2009, Fuhlendorf et al. 2009, Hovick et al. 2015, López‐González et al. 2015). Thus, maintaining heterogeneity of vegetation composition and structure in rangelands is beneficial to wildlife habitat and ecological biodiversity (Fuhlendorf et al. 2006). However, little is known about the effects of crude protein supplementation on grazing behavior and its potential impacts on vegetation and rangeland sustainability (Schauer et al. 2005).
Information relating supplement intake cow age, body weight and condition to individual supplement intake, grazing distribution and behavior is lacking. Thus, the intent of this study was to evaluate (1) examine the effects of cow age and environmental conditions on individual supplement intake and cattle behavior, (2) the influence of supplement intake, age, body weight and condition on grazing activity and resource utilization by cattle, and (3) the influence of dormant season use on soil organic matter, residual vegetation cover, structure and heterogeneity. We expected dormant season grazing by supplemented livestock to have multi-faceted effects on agroecosystems in northern mixed grass prairies. System-level impacts are likely mediated by the provision of supplement, as well as, uncontrolled environmental conditions.
We expect dormant season grazing by supplemented livestock to have multi-faceted effects on agroecosystems in northern mixed grass prairies. Because supplementation affects the grazing behavior of cattle, system-level impacts are likely mediated by the provision of supplement as well as uncontrolled environmental conditions. Our specific objectives are to evaluate how supplementation during the dormant grazing season and animal age influences:
- Supplement intake and behavior. Winter grazing typically exposes cattle to periods of severe cold which increases energy expenditure to maintain homeothermy (Webster, 1970, 1971). Inconsistent results from supplementation may be due to variation in supplement intake by individual cows, often influenced by social dominance associated with age class within the herd (Wagnon, 1965; Friend and Polan, 1974). Therefore, we expect that both cow age and winter environmental conditions affect daily supplement intake, as well as, the variation in supplement intake. Data was collected the winter grazing season of 2016 through 2017.
- Cattle grazing behavior and performance. Altering an animal’s nutritional environment with the addition of supplement has a high potential to affect grazing distribution and behavior (Murden and Risenhoover 1993), as well as, weight gain and body condition. Therefore, we expect that supplementation will have effects on distribution of pasture use, time spent grazing and distance traveled with corresponding effects on weight and body condition. Data was collected the winter grazing season of 2016 through 2017.
- Vegetation use, production, and structure, and soil organic matter. Range condition is influenced by grazing behavior (Belsky and Blumenthal 1997); thus, we expect that differences in grazing behavior will have differential effects on vegetative and structural composition of rangelands. Data was collected summer of 2016 through 2017.
Our intentions are to further the understanding of dormant season grazing and supplementation effects on grazing behavior and rangeland condition, with the ultimate goal of facilitating the adoption of management strategies developed for long-term sustainability of agroecosystems.
Cooperators
Research
This study was conducted at the Thackeray Ranch (48° 21' N 109° 30' W), part of the Montana Agricultural Experiment Station located 21 km south of Havre, MT. Climate is characterized as semi-arid steppe with an average annual precipitation of 410 mm. Vegetation is dominated by Kentucky bluegrass (Poa pratensis L.), bluebunch wheatgrass (Pseudoregnaria spicata [Pursh] A. Love), and rough fescue (Festuca scabrella Torr.).
A commercial herd of bred cows (Angus, Angus × Simmental) ranging in age from 1- to 12-year-old grazed on a 329 ha rangeland pasture (~1.2 ha AUM-1) during 2 years (272 cows in the 1st year, and 302 cows in the 2nd year). The winter grazing season occurred from December 1, 2016 to January 12, 2017, and November 1, 2017 to December 31, 2017. All cattle had free-choice access to a 30% CP self-fed canola meal-based (35% as-fed basis) pelleted supplement with 25% salt to limit intake (Table 1.). The target daily intake was 0.91 kg/cow.
Sampling
We established seventy-five 30-m transects randomly within the study pasture. We measured vegetation production, canopy cover and visual obstruction readings (VOR) at six 0.1 m2 plots located every five meters along each transect. Soil core samples were taken at a depth of 20.32 cm at each of the six plot locations and composited by transect. Soil samples were placed in a forced air oven at 60°C for 48 hours, ground and analyzed in duplicate for soil organic matter using the basic loss by ignition method (Heiri et al. 2001). Canopy cover of plant functional groups (grass, forb, shrub), cover of bare ground and litter were estimated at each plot using the six cover class Daubenmire method (Daubenmire 1959). Ground cover of plant functional groups, bare ground and litter have all previously been found to influence the abundance and demography of grassland birds, who serve as indicator species for grassland ecosystems (Bock and Webb 1984, Skinner et al. 1984, Bradford et al. 1998, Derner et al. 2009). Visual obstruction readings were measured in four cardinal directions using a 1-meter Robel pole (Robel et al. 1970). Visual obstruction is typically correlated with aboveground biomass and represents a measure of the vertical structure and density of vegetation (Robel et al. 1970, Damiran et al. 2007). All measurements were taken pre- and post-grazing prior to spring green up to evaluate how relative resource utilization effects soil organic matter and residual vegetation structure across the pastures. Pre-grazing vegetation functional group production was estimated using the dry weight rank method and clipping each plot (Mannetje 1963, Dowhower et al. 2001). Clipped samples were placed in a forced air oven at 60°C for 48 hours and then weighed. Pre-grazing samples from each transect were composited by transect and ground to pass a 1-mm screen in a Wiley mill. Samples were then analyzed in duplicate for nitrogen (Leco CN-2000; Leco Corporation, St. Joseph, MI), and fiber (NDF and ADF; Ankom 200 Fiber Analyzer, Ankom Co., Fairport, NY) as indicators of vegetation quality.
Grazing activity was monitored with Lotek GPS collars (3300LR; Lotek Engineering, Newmarket, Ontario, Canada) containing head position sensors that record daily space use, as well as, timing and location of grazing activities (Turner et al. 2000, Ungar et al. 2005, Brosh et al. 2010). All cattle were assigned to one of six age classifications (1-yr-old, 2 & 3-yr-olds, 4 & 5-yr-olds, 6 & 7-yr-olds, and 8 & 9-yr-olds, and ≥ 10-yr-old) were stratified by bodyweight then randomly selected for GPS collars (5 collars/age class). Each individual animal was equipped with an electronic ID tag (Allflex USA, Inc., Dallas-Ft. Worth, TX) attached to the exterior of the left ear for the measurement of individual supplement intake using a SmartFeed Pro self-feeder system (C-Lock Inc., Rapid City, SD) which provided a total of 8 feeding stations. GPS data were used to evaluate the effects of age and supplement intake on animal grazing activity (Ungar et al. 2005, Brosh et al. 2010, Valente et al. 2013). Each collar was configured to record GPS positions at 15-minute intervals, and head position, vertical/horizontal movements at 5-minute intervals. Each collar stores the percentage of time the head position sensor registers in the down position for each sampling period. We then used the binary classification methods developed by Augustine and Derner (2013) to separate grazing from non-grazing activities to examine time spent grazing and cattle foraging distribution.
An Onset (Bourne, MA, USA) HOBO U30-NRC Weather Station placed near the supplement feeders and programmed to collect air temperature, relative humidity, and wind speed and direction data every 15 min for the entirety of the grazing period. Fine scale wind speed (30 m2 resolution) were predicted across all pastures using average daily wind measurements collected on site, ArcGIS spatial analyst tool, a digital elevation model at 30 m2 resolution, and WindNinja wind prediction software (Brooks 2012). In addition, HOBO Pendant® Temperature/Light Data Logger (Onset Computer Corporation, Bourne, MA) were deployed at each randomly-selected transect location within each pasture and programmed to collect fine-scale ambient temperature every 30 minutes. Fine-scale ambient air temperature was modeled using the collected temperature data set and generalized linear models to evaluate the effects of physical properties (e.g., aspect, elevation and slope) on fine-scale temperature of the pastures. Model results were used to create spatially-explicit predictions of temperature and wind conditions across the experimental pasture, which were used as covariates in subsequent resource utilization modeling.
All supplementation and water locations were located via handheld GPS (spatial error < 10 m). Using the spatial analysis tool in ArcGIS (Environmental Systems Research Institute, Redlands, CA) and a digital elevation model at 30 m2 resolution (USGS 2017), we created additional spatial covariate layers representing aspect, solar radiation, terrain ruggedness (calculated by taking the sum change in elevation between a grid cell and its eight neighboring cells; Riley 1999) and horizontal distance from supplement locations and water sources at 30 m2 resolution.
Statistical Analysis
To evaluate the effects cow age on average daily individual supplement intake, number of visits, visit length, intake rate, and CV of supplement intake all cattle were assigned to one of six age classifications (1-yr-old, 2 & 3-yr-olds, 4 & 5-yr-olds, 6 & 7-yr-olds, and 8 & 9-yr-olds, and ≥ 10-yr-old). Supplement intake variables were analyzed using ANOVA with a mixed model including age class, year, and the interaction of age class and year as fixed effects, and individual cow x age class as the random effect (R Core Team, 2017). Least square means were separated using the LSD method when P < 0.05.
Models were developed representing hypotheses examining the influence of environmental conditions and age on daily supplement intake. The variables considered as candidates for modeling included average daily temperature, average daily wind speed, age, and year. Cow was used as a random effect. Akaike’s Information Criterion adjusted for small sample sizes (AICc) was then used to evaluate support for competing models (Burnham and Anderson, 2002).
We evaluated the effects of cow age, supplement intake, body condition and weight on time spent grazing and distance traveled with generalized linear mixed models using individual animal as a random effect. We hypothesized that individual animal attributed could elicit one of three behavioral responses (linear, pseudothreshold, quadratic). Variables hypothesized to exhibit a pseudothreshold pattern were tested with asymptotic models by evaluating the natural log of the explanatory variable (ln[x + 0.001]; Dugger et al. 2005, McNew et al. 2015). We used AICc to evaluate support for competing models reflecting hypotheses about the effects of individual animal attributes on time spent grazing and distance traveled by cattle (Burnham and Anderson 2002). Models with ΔAICc ≤ 2 that differed from the top model by a single parameter were excluded if confidence intervals of parameter estimates overlapped 0 (ie., were non-informative; Arnold 2010). When multiple models were supported, we use model-averaged estimates of beta-coefficients ("MuMIn” package for R; Bartoń 2018). Model fit was then evaluated by calculating marginal and conditional r2 values for generalized linear mixed models (Nakagawa and Schielzeth 2013).
To model dormant season space use by cattle, individual GPS-collared cows were defined as the biological unit of interest in modeling grazing resource utilization within pastures. We quantified space use as a continuous, probabilistic variable and related to habitat covariates using multiple regression in a resource utilization function analysis (RUF; Marzluff et al. 2004, Winder et al. 2014). Resource utilization function methods quantify inter-animal variation in resource use and examines use as a probabilistic and continuous metric, allowing for an increase in sensitivity for detecting resource selection (Winder et al. 2014). Additionally, RUFs treat individual animals as the experimental unit, incorporating an individual’s entire distribution of use, independently, reducing errors associated with location estimation and focus on specific locations (Marzluff et al. 2004, Kertson and Marzluff 2010).
Due to cattle having a home range confined to the pasture management unit, GPS data were used to build resource utilization models on a third-order scale, defining animal movements and selection of environmental and vegetation conditions within each pasture (Johnson 1980). We used Geospatial Modeling Environment (Beyer 2010) to create a raster representing the specific utilization density distribution for the grazing locations of individuals in each pasture. Relative use values were bounded between 1 and 99, for each 30 m2 cell based off of the relative volume of utilization distribution in that cell (Marzluff et al. 2004). Environmental covariates expected to influence resource utilization included temperature, wind, solar radiation, distance to supplement and water (horizontal), elevation, terrain ruggedness and aspect, annual forage production and quality. Using the ‘raster’ function in R, environmental covariate and individual relative use rasters were stacked and converted to spatially explicit data files as input for the ruf.fit package (Kertson and Marzluff 2010). Individual relative use values were log-transformed prior to modeling to meet the assumptions of multiple regression models. Using the ruf.fit package in R, resource utilization functions with standardized β coefficients were generated and evaluated for each individual to represent the influence of the environmental covariates on cattle resource utilization (Marzluff et al. 2004, Kertson et al. 2011).
To develop herd level inferences, we calculated mean standardized β coefficients and a variance that incorporated individual animal variation for each environmental factor (Marzluff et al. 2004). Standardized coefficients with 95% confidence intervals that do not overlap zero are considered significant predictors of space use (Marzluff et al. 2004, Winder et al. 2014). If a resource utilization coefficient is significantly different from zero, we inferred that resource use was greater or less than expected based on availability of the resource within the experimental pasture (Marzluff et al. 2004, Winder et al. 2014). For environmental factors eliciting a high level individual variability in habitat selection (herd level SE of standardized coefficients > 0.25), we evaluated the effects of age, supplement intake, body weight and condition on resource use relative to each habitat covariate with generalized linear models. We investigated three behavioral responses (linear, pseudothreshold, quadratic) related to individual animal attributes. We used Akaike’s Information Criterion adjusted for small sample sizes (AICc, Burnham and Anderson 2002) to evaluate support for competing models reflecting hypotheses about the effects of various animal attributes on relative use by cattle. Model fit was then evaluated by calculating a multiple r2 value for generalized linear models.
Typically, a primary step in RUF analyses is to overlay spatially-explicit utilization distributions of individuals (e.g., cattle) onto geo-referenced rasters representing spatially-explicit estimates of covariate values across the entire study area (Marzluff et al. 2004, Kertson and Marzluff 2010, Winder et al. 2014). Unfortunately, spatially-continuous estimates of vegetation composition, production and quality were not available at appropriate spatial resolution for our entire study area. Therefore, the relative resource use value for each individual was extracted at each transect location and paired with the corresponding vegetation measurements. To avoid overfitting our resource utilization models, we conducted a preliminary multicollinearity analysis to select uncorrelated (|r| > 0.6) variables that are ecologically relevant and feasible to measure ( Dormann et al. 2013). If two covariates were correlated, we fitted preliminary resource utilization models and evaluated relative support of each variable using AICc (Burnham and Anderson 2002); we retained the variable with more relative support for further modeling and discarded the correlated variable (Fieberg and Johnson 2015).
We evaluated the effects of vegetation (e.g., production, composition and quality) and cow age, body condition, and supplement intake (linear, pseudothreshold, or quadratic response) on relative use with generalized linear mixed models using individual animal as a random effect. We used AICc to evaluate support for competing models reflecting hypotheses about the effects of various vegetation and individual animal attributes on relative use by cattle (Burnham and Anderson 2002). Model fit was then evaluated by calculating marginal and conditional r2 values for generalized linear mixed models (Nakagawa and Schielzeth 2013).
To evaluate the effects of resource use by grazing cattle on soil organic matter, vegetation functional group cover and visual obstruction, we calculated the overall density of grazing locations within a 50 m radius of each transect location for both years. The effect of grazing location density on soil organic matter and vegetation measurements was derived by taking the differences of pre- post grazing measurements at each transect location for each year. The effects of grazing density on patch level heterogeneity of functional group vegetation cover and visual obstruction was obtained by subtracting the pre-grazing transect level standard deviation from the post-grazing standard deviation for both years. We then used an analysis of covariance (ANCOVA) with generalized linear models including year as a categorical variable, density of grazing locations as a continuous variable, and an interaction of density of grazing locations by year. Data were plotted and log-transformed if needed to satisfy assumptions of normality and homogeneity of variance. An alpha ≤ 0.05 was considered significant. All statistical analyses were performed in R (R Core Team 2017).
Supplement intake and behavior
The effects of age class on intake related variables displayed an age class by year interaction (P < 0.05), therefore, data is displayed for each year independently (Table 2.). Daily supplement intake, feeding time, and intake rate decreased linearly (P < 0.05) as age class increased in the 1st yr, while daily intake CV, and feeder visits per day had a quadratic (P < 0.01) response to age class. In yr 2, there was no effect (P > 0.09) of age class on daily intake or daily intake CV. Visits per day, and intake rate decreased (P < 0.01) linearly as age class increased, while feeding time increased (P < 0.01) linearly with increasing age class.
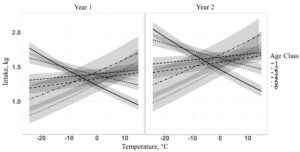
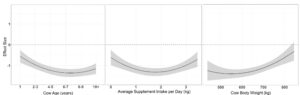
When evaluating the effects of environmental conditions and age class on supplement intake, we found a single top model containing year, temperature, and temperature by age class interaction received 100% of the AICc total weight (Table 3.). Our top model reveals that temperature interacts with age class, where young animals increase supplement intake as temperature decreases, while older animals decrease supplement intake as temperature decreases (Figure 1.). Year represented an additive effect where cows had higher average daily supplement intakes in yr 2 than in yr 1.
Grazing behavior and space use
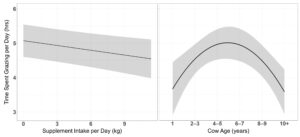
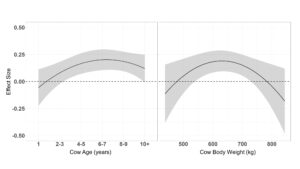
The effects of cow age, supplement intake body condition and weight on time spent grazing per day and distance traveled per day were evaluated for 58 cows grazing dormant season rangeland on the northern mixed grass prairie (29 cows/year). Time spent grazing per day models with quadratic effect of cow age received the 61% of the support among candidate models (Table 4.). Models containing supplement intake, body condition, body weight and an interaction of cow body condition by cow weight were also supported, however, the parameter estimates for cow body condition, body weight and the interaction of the cow body condition by cow weight may be non-informative as confidence intervals of the effect size overlap 0 ( β = 52.74 ± 64.39, β = 14.55 ± 17.11, β = −8.09 ± 9.95). Supplement intake was negatively associated with time spent grazing ( β = −0.05 ± 0.02) as cows decrease time spent grazing per day linearly with increasing supplement intake (Figure 2.) Age had a quadratic effect on time spent grazing ( β = 1.54 ± 0.46 + −0.22 ± 0.06), indicating that cows maximize time spent grazing at ages of 4 – 7 years (Figure 2.). The top model containing all supported variables among candidate models had a conditional r2 of 0.51; however, the marginal r2 was only 0.12 suggesting age, supplement intake, body weight and body condition only make up 24% of the individual variation associated with time spent grazing.
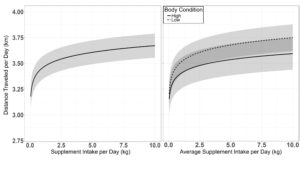
A single top model containing age and supplement intake received 40% of the relative support of the data when determining the effects of cow age, supplement intake, body condition and weight on distance traveled per day (Table 4.). Body condition, body weight and the interactions of body condition by supplement intake, age by body weight, and body condition by body weight were also supported, although the parameter estimates for age, cow body condition, body weight and the interaction of the cow body condition by body weight and cow age by body weight may be non-informative with confidence intervals of the effect size overlapping 0 ( β = −5.56 ± 4.18, β = −16.12 ± 20.28, β = −5.26 ± 5.30, β = 2.38 ± 3.14, β = 0.83 ± 0.66). Supplement intake had an asymptotic association with distance traveled per day ( β = 0.35 ± 0.09), indicating cows travel further when consuming larger quantities of supplement (Figure 3.). A supplement intake by body condition interaction was also supported ( β = −0.15 ± 0.05), where cow body condition had a larger effect on distance traveled per day at high levels of supplement intake (Figure 3.) The top model evaluating the effects on distance traveled had a conditional r2 of 0.26 with a marginal r2 of 0.18 suggesting age, supplement intake, body weight and body condition made up the majority of the individual variation associated with distance traveled per day.
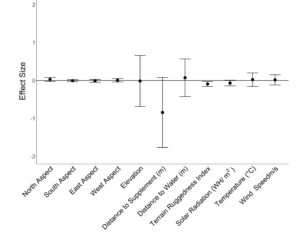
We estimated population-level grazing RUFs from 58 cattle (29/year) with an average of 910 ± 38 grazing locations per individual. Resource utilization by cattle grazing dormant season forage was negatively related to terrain ruggedness ( β = −0.09 ± 0.03; Figure 4.). Additionally, relative resource selection by cattle tended to decrease with distance from supplement ( β = −0.84 ± 0.45); however, individual variability in habitat selection resulted in confidence intervals overlapping 0 for the herd-level response (Figure 4.). Low values of relative use coefficients indicate aspect, elevation, distance from water, solar radiation, average temperature and wind speed had little influence on grazing space use at a population level. However, distance from supplement, distance from water, and elevation were highly variable among individuals as drivers of space use (Figure 4.). Therefore, we evaluated the relationship of individual cow attributes (age, body weight, body condition and average daily supplement intake) on resource utilization relative to distance to supplement, distance to water and elevation.
A single top model containing age, supplement intake and body weight received 57% of the relative support among candidate models when determining the effects of cow age, supplement intake, body condition and weight on resource utilization relative to distance from supplement (Table 5.). Age had a quadratic effect on resource utilization relative to distance from supplement ( β = −0.63 ± 0.15 + 0.07 ± 0.02), indicating that all ages of cattle select against distance from supplement with cows aging 6 – 7 most negatively associated (Figure 5.). Likewise, all average supplement intakes had a negative quadratic relationship associated with resource use relative to distance to supplement ( β = −0.78 ± 0.21 + 0.22 ± 0.58), with intakes ranging between 1.5 and 2 kg being the most negative (Figure 5.). Cow body weight also exhibited a quadratic relationship with resource utilization relative to distance from supplement ( β = −0.01 ± 0.01 + 0.001 ± 0.0001), as cattle weight increased the negative association between weight and distance from supplement decreased (Figure 5.).
Models containing a quadratic effect of age and body weight, and an asymptotic effect of supplement intake and an interaction of supplement intake by body weight were most supported among candidate models when determining the effects on cattle resource utilization relative to distance from water (Table 5.). However, supplement intake and the interaction of supplement intake by body weight may be non-informative as confidence intervals of the effect size overlap 0 ( β = 0.69 ± 1.97, β = −0.002 ± 0.007 + 0.001 ± 0.001). Age had a quadratic association with resource use relative to distance from water ( β = 0.22 ± 0.09 + −0.03 ± 0.01), where yearling through 3 yr-old cattle neither select grazing location for or against distance from water while cattle aging 6 – 7 select areas to positively select for grazing locations furthest from water. Cow body weight also elicited a quadratic effect on resource use relative to distance from water ( β = 0.01 ± 0.005 + −0.001 ± 0.0001), as the lightest and heaviest cattle neither selected for or against distance to water and cattle weighing between 600 and 700 kg positively selected for grazing locations away from water (Figure 6.).
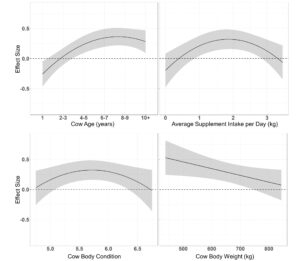
Resource use relative to elevation models containing a quadratic effect of age and supplement intake had 95% of the relative support among candidate models (Table 4.). Models containing a linear effect of body weight and a quadratic effect of body condition were also supported. Age had a quadratic association with resource use relative to elevation ( β = 0.41 ± 0.12 + −0.04 ± 0.02), where yearlings selected against elevation while older cattle selected grazing locations at higher elevations (Figure 7.). Average supplement intake per day had a quadratic effect on resource use relative to elevation ( β = 0.56 ± 0.16 + −0.15 ± 0.05), where cattle consuming 0 or 3 kg of supplement per day neither selected for or against elevation, as animals that consumed approximately 1.5 kg of supplement per day utilized higher elevation areas for grazing (Figure 7.). Cow body condition also elicited a quadratic association on resource utilization relative to elevation ( β = 3.81 ± 1.55 + −0.34 ± 0.14), where cows with body condition of 5.5 – 6 selected areas at higher elevations to graze (Figure 7.). Body weight negatively associated with resource use relative to elevation ( β = −0.001 ± 0.0005, where lighter weight cattle select for grazing locations at higher elevations than heavier weight cattle (Figure 7.).
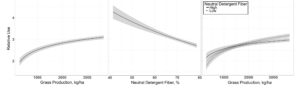
The relationship of vegetation composition, production, and quality, cow age, body condition, body weight, average daily supplement intake and relative resource utilization by cattle were evaluated for the 58 cows (29 cows/year) using pre-grazing vegetation conditions measured at 75 transect locations in the study area. Models containing grass production (kg/ha), neutral detergent fiber (%), and an interaction of grass production by neutral detergent fiber received 100% of the relative support among candidate models (Table 6.). Models containing crude protein (%) and an interaction of grass production by crude protein were also supported, however, may be non-informative as confidence intervals of the effect size overlap 0 ( β = 0.68 ± 1.67, β = −0.35 ± 0.18). Grass production had an asymptotic relationship with relative use ( β = 16.58 ± 3.25), where predicted relative use increased with grass production (Figure 8.). Neutral detergent fiber also displayed an asymptotic relationship with relative use ( β = 27.19 ± 6.03), where relative use decreased with increasing NDF (Figure 8.). However, NDF and grass production had an interaction ( β = −3.71 ± 0.77), where in areas of low grass production, high NDF values are selected, and high grass production areas low NDF values are selected (Figure 8.)
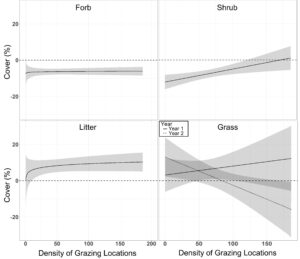
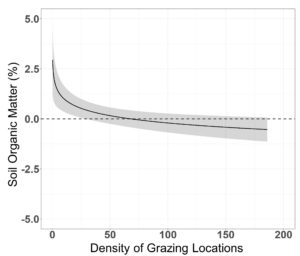
We found no grazing effects on pre-post differences in mean VOR, bare ground cover and residual cover of grass ( β = 0.001 ± 0.012, β = 0.003 ± 0.016, β = 0.05 ± 0.07; P > 0.22; Table 7.). However, pre-post differences in residual grass cover displayed a year by grazing pressure interaction ( β = −0.20 ± 0.09), where in year one grazing pressure had a slight positive effect on residual grass cover, while in year 2 grass cover was negatively associated with grazing pressure (Figure 9.). Residual cover of forbs displayed a positive asymptotic relationship with grazing pressure ( β = 1.04 ± 0.41), where very little grazing pressure reduced the overall negative effect of residual forb cover over the course of winter (Figure 9.). Ground cover of litter also had a positive asymptotic relationship with grazing pressure ( β = 3.06 ± 0.89), where increasing grazing pressure resulted in increased ground cover of litter (Figure 9.). Shrub cover had a positive linear association with grazing pressure ( β = 0.10 ± 0.03), where shrub cover was least impacted in areas with high grazing pressure. Soil organic matter displayed a negative asymptotic relationship with grazing pressure ( β = 0.37 ± 0.10), where soil organic matter decreased with increasing grazing pressure (Figure 10.). Visual obstruction reading, bare ground, litter cover and soil organic matter all displayed a significant year effect (P < 0.01; Table 7.). Soil organic matter increased 1.49 ± 0.23% in year one, while decreasing 1.06 ± 0.21% in year two (P < 0.01; Figure 11.). Bare ground decreased by 1.41 ± 0.43 after grazing in year one with no statistical difference in year two (1.32 ± 0.79%; Figure 11.). Conversely, litter cover increased 14.19 ± 2.22% in year one with no differences in year two (0.91 ± 1.33%; Figure 11.). Visual obstruction was decreased in both years, however, had a larger reduction in year two than year one (-7.96 ± 0.62 vs -5.94 ± 0.29; Figure 11.).
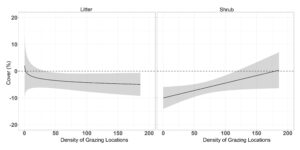
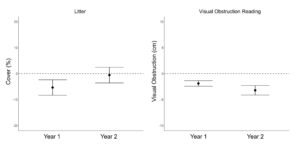
Density of grazing locations did not significantly alter the differences in transect level standard deviation of VOR, bare ground, or residual grass and forb cover ( β = 0.009 ± 0.009, β = −0.001 ± 0.021, β = −0.02 ± 0.03, β = 0.54 ± 0.39; P > 0.36; Table 8.). Difference in pre- post grazing standard deviation of litter had an asymptotic relationship with density of grazing locations ( β = 2.21 ± 0.74), whereas slight increasing density of grazing locations results in a reduction in the pasture level standard deviation of litter (Figure 12.). Shrub difference in pre- post grazing standard deviation had a positive linear relationship with density of grazing locations ( β = 0.08 ± 0.03), where transect level of the standard deviation of shrub cover was least impacted in areas with high grazing pressure (Figure 12.). Visual obstruction reading and litter cover difference in pre- post grazing standard deviation displayed a significant year effect (P < 0.02; Table 8.). Visual obstruction standard deviation was decreased in both years, with a larger reduction in transect standard deviation in year two than year one (-3.21 ± 0.46 vs -1.90 ± 0.27; Figure 13.). Pre- post grazing difference of litter standard deviation was decreased 5.36 ± 1.50 in year one with no differences in year two (−0.57 ± 1.52; Figure 13.).
|
Table 1. Supplement composition for cattle winter grazing rangeland in 2016 & 2017 at the Thackeray ranch, Havre MT (as-fed basis) |
|
|
CP1 |
30.00 % |
|
Crude fat |
1.00 % |
|
Crude fiber |
8.00 % |
|
Ca |
2.00 % |
|
P |
1.00 % |
|
Salt |
25.00 % |
|
K |
0.75 % |
|
Se |
1.5 ppm |
|
Vitamin A |
9,072 IU/kg |
|
Vitamin D |
907 IU/kg |
|
Vitamin E |
9 IU/kg |
|
19.9% non-protein N |
|
|
Table 2. Average daily supplement intake and behavior by age class for cattle winter grazing rangeland in 2016 & 2017 at the Thackeray ranch, Havre MT |
||||||||||
|
|
|
Age class |
|
P-values1 |
||||||
|
|
|
1 |
2 |
3 |
4 |
5 |
6 |
SEM |
Linear |
Quadratic |
|
Year 1 |
||||||||||
|
Daily intake, kg |
1.9 |
1.9 |
1.5 |
1.3 |
1.2 |
1.4 |
0.1 |
<0.01 |
0.11 |
|
|
Daily intake CV, % |
62.2 |
65.8 |
77.3 |
89.3 |
89.7 |
78.7 |
1.1 |
<0.01 |
<0.01 |
|
|
Visits per day |
7.0 |
5.5 |
3.9 |
3.4 |
3.0 |
3.7 |
0.3 |
<0.01 |
<0.01 |
|
|
Feeding time, min/d |
6.6 |
6.1 |
5.3 |
5.2 |
4.9 |
5.6 |
0.4 |
0.05 |
0.07 |
|
|
Intake rate, g/min |
343.5 |
371.2 |
332.6 |
310.0 |
322.3 |
312.2 |
12.8 |
0.02 |
0.92 |
|
|
Year 2 |
||||||||||
|
Daily intake, kg |
1.5 |
2.1 |
1.8 |
1.7 |
1.8 |
2.0 |
0.1 |
0.09 |
0.87 |
|
|
Daily intake CV, % |
70.8 |
61.4 |
70.6 |
71.0 |
69.7 |
71.6 |
1.0 |
0.19 |
0.52 |
|
|
Visits per day |
7.1 |
7.7 |
6.1 |
5.7 |
6.2 |
5.9 |
0.3 |
<0.01 |
0.31 |
|
|
Feeding time, min/d |
5.3 |
7.3 |
6.8 |
6.7 |
7.8 |
8.6 |
0.4 |
<0.01 |
0.94 |
|
|
|
Intake rate, g/min |
344.6 |
340.6 |
340.4 |
321.0 |
311.7 |
296.0 |
10.4 |
<0.01 |
0.37 |
|
1P-values for linear and quadratic effects of cow age class. |
||||||||||
|
Table 3. Model selection for models evaluating the effects of environmental conditions and age class on supplement intake for cattle winter grazing rangeland in 2016 & 2017 at the Thackeray ranch, Havre MT |
||||
|
Model1 |
K2 |
AICc3 |
ΔAICc4 |
Wi5 |
|
Year + temp x age class |
15 |
28,404.75 |
0.00 |
1.00 |
|
Year + temp x age class + wind speed |
16 |
28,417.86 |
13.12 |
0.00 |
|
Year + temp x age class + wind speed x age class |
21 |
28,452.34 |
47.59 |
0.00 |
|
Constant (null) |
3 |
28,646.06 |
241.31 |
0.00 |
|
1Cow is used as a random variable in all models. Only models with a Akaike weight (Wi) > than the null model are presented. |
||||
|
2K = number of parameters. 3Akaike’s information criterion adjusted for small sample size. 4Difference in Akaike’s information criterion adjusted for small sample size compared to the best model. 5Akaike weight. |
||||
|
Table 4. Model selection for models evaluating the effects of cow age, body condition and supplement intake on time spent grazing per day (hrs) and distance traveled per day (km) by cattle grazing dormant rangeland in 2016 – 2017 & 2017 – 2018 at the Northern Agricultural Research Center Thackeray ranch, Havre, MT |
||||||
|
Modelb |
Kc |
AICcd |
ΔAICce |
Wif |
r2mg |
r2ch |
|
Time Spent Grazing per Day |
|
|
|
|
|
|
|
Age2 + Supplement Intake +ln( Body Condition) × ln(Body Weight) |
9 |
10113.50 |
0.00 |
0.28 |
0.12 |
0.51 |
|
Age2 + ln( Body Condition) × ln(Body Weight) |
8 |
10113.53 |
0.03 |
0.28 |
0.11 |
0.51 |
|
ln( Body Condition) × ln(Body Weight) |
6 |
10115.92 |
2.42 |
0.08 |
0.02 |
0.51 |
|
Constant (null) |
3 |
10123.61 |
10.11 |
0.00 |
|
|
|
Distance Traveled per Day |
|
|
|
|
|
|
|
ln(Age) + ln(Supplement Intake) × ln(Body Condition) + ln(Body Condition) × ln(Body Weight) |
10 |
8643.6 |
0.00 |
0.40 |
0.18 |
0.26 |
|
ln(Age) + ln(Supplement Intake) × ln(Body Condition) |
7 |
8646.05 |
2.45 |
0.12 |
0.18 |
0.25 |
|
ln(Age) + ln(Supplement Intake) + ln(Body Condition) × ln(Body Weight) |
8 |
8646.16 |
2.56 |
0.11 |
0.18 |
0.26 |
|
ln(Age) × ln(Body Weight) + ln(Supplement Intake) × ln(Body Condition) |
9 |
8646.29 |
2.68 |
0.11 |
0.18 |
0.26 |
|
ln(Age) + ln(Supplement Intake) |
5 |
8647.31 |
3.71 |
0.06 |
0.17 |
0.25 |
|
ln(Age) + ln(Supplement Intake) × ln(Body Condition) + ln(Body Weight) |
8 |
8647.37 |
3.77 |
0.06 |
0.18 |
0.26 |
|
Constant (null) |
3 |
9027.40 |
383.80 |
0.00 |
|
|
|
aOnly models with Akaike weights (wi) ≥ 0.05 are presented except for the null model. |
|
|
||||
|
bCow is used as a random variable in all models. |
|
|
||||
|
cK = number of parameters. dAkaike’s information criterion adjusted for small sample size. eDifference in Akaike’s information criterion adjusted for small sample size compared to the best model. fAkaike weight. |
|
|
||||
|
gMarginal R2 |
|
|
||||
|
hConditional R2 |
|
|
||||
|
Table 5. Model selection for models evaluating the effects of cow age, body condition and supplement intake on the effect size of distance from supplement, distance from water and elevation from the RUF analysis of cattle grazing dormant rangeland in 2016 – 2017 & 2017 – 2018 at the Northern Agricultural Research Center Thackeray ranch, Havre, MT |
|||||
|
Modelb |
Kc |
AICcd |
ΔAICce |
Wif |
r2g |
|
Distance from Supplement |
|
|
|
|
|
|
Age2 + Supplement Intake2 + Body Weight2 |
8 |
60.74 |
0.00 |
0.57 |
0.45 |
|
Age2 + Supplement Intake2 + Body Weight2 + Body Condition2 |
10 |
63.01 |
2.27 |
0.18 |
0.48 |
|
Age2 + Body Condition2 + Age2 × Body Condition2 |
9 |
65.08 |
4.34 |
0.06 |
0.43 |
|
Constant (null) |
2 |
80.21 |
19.47 |
0.00 |
|
|
Distance from Water |
|
|
|
|
|
|
Age2 + ln(Supplement Intake) + Body Weight2 + Body Weight2 × ln(Supplement Intake) |
9 |
−4.25 |
0.00 |
0.21 |
0.41 |
|
Age2 + ln(Supplement Intake) + Body Weight2 |
7 |
−3.52 |
0.73 |
0.15 |
0.34 |
|
ln(Supplement Intake) + Body Weight2 + Body Weight2 × ln(Supplement Intake) |
7 |
−2.97 |
1.29 |
0.11 |
0.34 |
|
ln(Supplement Intake) + Body Weight2 |
5 |
−2.10 |
2.16 |
0.07 |
0.26 |
|
Age2 + ln(Supplement Intake) |
5 |
−2.02 |
2.23 |
0.07 |
0.26 |
|
Age2 + Body Weight2 |
6 |
−1.84 |
2.41 |
0.06 |
0.29 |
|
Constant (null) |
2 |
8.68 |
12.93 |
0.00 |
|
|
Elevation |
|
|
|
|
|
|
Age Class + ln(Supplement Intake) + ln(Body Weight) |
9 |
28.89 |
0.00 |
0.39 |
0.43 |
|
Age Class + ln(Supplement Intake) × ln(Body Weight) |
7 |
29.66 |
0.77 |
0.27 |
0.36 |
|
Age Class + ln(Supplement Intake) + ln(Body Condition) + ln(Body Weight) |
8 |
30.78 |
1.89 |
0.15 |
0.38 |
|
Constant (null) |
2 |
43.69 |
14.80 |
0.00 |
|
|
aOnly models with Akaike weights (wi) ≥ 0.05 are presented except for the null model. bCow is used as a random variable in all models. cK = number of parameters. dAkaike’s information criterion adjusted for small sample size. eDifference in Akaike’s information criterion adjusted for small sample size compared to the best model. fAkaike weight. gMultiple R2 |
|
||||
|
Table 6. Model selection for models evaluating the effects of vegetation quality and production, cow age, body condition, body weight and supplement intake on grazing resource utilization by cattle grazing dormant rangeland in 2016 – 2017 & 2017 – 2018 at the Northern Agricultural Research Center Thackeray ranch, Havre, MT |
||||||||||
|
Modelb |
Kc |
AICcd |
ΔAICce |
Wif |
r2mg |
r2ch |
||||
|
ln(Grass Production) × ln(Neutral Detergent Fiber) + ln(Grass Production) × ln(Crude Protein) |
8 |
12369.224 |
0.00 |
0.51 |
0.05 |
0.13 |
||||
|
ln(Grass Production) × ln(Neutral Detergent Fiber) + ln(Crude Protein) |
7 |
12369.31 |
0.07 |
0.49 |
0.05 |
0.13 |
||||
|
Constant (null) |
3 |
12582.92 |
213.68 |
0.00 |
|
|
||||
|
aOnly models with Akaike weights (wi) ≥ 0.05 are presented except for the null model. |
|
|
||||||||
|
bCow is used as a random variable in all models. |
|
|
||||||||
|
cK = number of parameters. dAkaike’s information criterion adjusted for small sample size. eDifference in Akaike’s information criterion adjusted for small sample size compared to the best model. fAkaike weight. |
|
|
||||||||
|
gMarginal R2 |
|
|
||||||||
|
hConditional R2 |
|
|
||||||||
|
Table 7. Pre- post differences in mean (± SE) visual obstruction, residual cover classifications and soil organic matter by year for cattle grazing dormant rangeland in 2016 – 2017 & 2017 – 2018 at the Northern Agricultural Research Center Thackeray ranch, Havre, MT |
|||||
|
P-Value |
|||||
|
Year 1 |
Year 2 |
Year |
Grazing Pressure |
Year × Grazing Pressure |
|
|
VORa, cm |
-5.94 ± 0.29 |
-7.96 ± 0.62 |
< 0.01 |
0.25 |
0.23 |
|
Bare Ground, % |
-1.41 ± 0.43 |
1.32 ± 0.79 |
< 0.01 |
0.64 |
0.49 |
|
Litter, % |
14.19 ± 2.22 |
0.91 ± 1.33 |
< 0.01 |
< 0.01 |
0.15 |
|
Grass, % |
5.95 ± 2.60 |
1.58 ± 2.96 |
0.26 |
0.22 |
0.03 |
|
Forb, % |
-6.42 ± 0.86 |
-6.78 ± 0.79 |
0.76 |
0.05 |
0.08 |
|
Shrub, % |
-8.22 ± 1.24 |
-7.29 ± 1.04 |
0.55 |
< 0.01 |
0.09 |
|
Soil Organic Matter, % |
1.49 ± 0.23 |
-1.06 ± 0.21 |
< 0.01 |
< 0.01 |
0.22 |
|
aVisual Obstruction Reading |
|||||
|
Table 8. Pre-post difference in heterogeneity (as indexed by differences in standard deviation ± SE) of visual obstruction and residual cover classifications by year for cattle grazing dormant rangeland in 2016 – 2017 & 2017 – 2018 at the Northern Agricultural Research Center Thackeray ranch, Havre, MT |
|||||
|
P-Value |
|||||
|
Year 1 |
Year 2 |
Year |
Grazing Pressure |
Year × Grazing Pressure |
|
|
VORa, cm |
-1.90 ± 0.27 |
-3.21 ± 0.46 |
0.02 |
0.63 |
0.36 |
|
Bare Ground, % |
-0.64 ± 0.57 |
1.53 ± 1.08 |
0.08 |
0.63 |
0.71 |
|
Litter, % |
-5.36 ± 1.50 |
-0.57 ± 1.52 |
0.02 |
0.01 |
0.20 |
|
Grass, % |
-0.77 ± 1.31 |
0.76 ± 1.28 |
0.41 |
0.41 |
0.74 |
|
Forb, % |
-5.03 ± 0.71 |
-5.72 ± 0.84 |
0.54 |
0.36 |
0.20 |
|
Shrub, % |
-5.93 ± 1.27 |
-7.13 ± 1.01 |
0.44 |
< 0.01 |
0.25 |
|
aVisual Obstruction Reading |
|||||

LITERATURE CITED:
Adams, D. 1985. Effect of time of supplementation on performance, forage intake and grazing behavior of yearling beef steers grazing Russian wild ryegrass in the fall. Journal of Animal Science 61:1037-1042.
Adams, D., T. Nelsen, W. Reynolds, and B. Knapp. 1986. Winter grazing activity and forage intake of range cows in the Northern Great Plains. Journal of Animal Science 62:1240-1246.
Adams, D. C., R. T. Clark, T. J. Klopfenstein, and J. D. Volesky. 1996. Matching the cow with forage resources. Rangelands:57-62.
Allden, W. 1968. Undernutrition of the Merino sheep and its sequelae. IV. Herbage consumption and utilization of feed for wool production followint growth restrictions imposed at two stages of early post-natal life in a Mediterranean environment. Australian Journal of Agricultural Research 19:997-1007.
Allison, C. D. 1985. Factors Affecting Forage Intake by Range Ruminants: A Review. Journal of Range Management 38:305-311.
Anderson, R. C. 2006. Evolution and origin of the Central Grassland of North America: climate, fire, and mammalian grazers. The Journal of the Torrey Botanical Society 133:626-647.
Ares, F. N. 1953. Better cattle distribution through the use of meal-salt mix. Journal of Range Management 6:341-346.
Arnold, T. W. 2010. Uninformative Parameters and Model Selection Using Akaike's Information Criterion. Journal of Wildlife Management 74:1175-1178.
Augustine, D. J., and J. D. Derner. 2013. Assessing herbivore foraging behavior with GPS collars in a semiarid grassland. Sensors (Basel) 13:3711-3723.
Bailey, D. W., B. Dumont, and M. F. Wallisdevries. 1998. Utilization of heterogeneous grasslands by domestic herbivores: theory to management. Pages 321-333 in Annales de Zootechnie.
Bailey, D. W., and G. R. Welling. 1999. Modification of cattle grazing distribution with dehydrated molasses supplement. Journal of Range Management 52:575-582.
Bartoń, K. 2018. MuMIn: Multi-model inference. Model selection and model averaging based on information criteria (AICc and alike). R Package Version 1.40.4.
Beaver, J., and B. Olson. 1997. Winter range use by cattle of different ages in southwestern Montana. Applied Animal Behaviour Science 51:1-13.
Beyer, H. L. 2010. Geospatial modelling environment. http://www.spatialecology.com/gme.
Bock, C. E., and B. Webb. 1984. Birds as grazing indicator species in southeastern Arizona. The Journal of Wildlife Management 48:1045-1049.
Bodine, T., H. Purvis, and D. Lalman. 2001. Effects of supplement type on animal performance, forage intake, digestion, and ruminal measurements of growing beef cattle. Journal of Animal Science 79:1041-1051.
Bowman, J., and B. Sowell. 1997. Delivery method and supplement consumption by grazing ruminants: a review. Journal of Animal Science 75:543-550.
Bowman, J., B. Sowell, and J. Paterson. 1995. Liquid supplementation for ruminants fed low-quality forage diets: a review. Animal feed science and technology 55:105-138.
Bradford, D. F., S. E. Franson, A. C. Neale, D. T. Heggem, G. R. Miller, and G. E. Canterbury. 1998. Bird species assemblages as indicators of biological integrity in Great Basin rangeland. Environmental Monitoring and Assessment 49:1-22.
Brooks, A. N. 2012. Modeling the Impact of Terrain on Wind Speed and Dry Particle Deposition Using WindNinja and ArcGIS Spatial Analyst.
Brosh, A., Z. Henkin, E. Ungar, A. Dolev, A. Shabtay, A. Orlov, Y. Yehuda, and Y. Aharoni. 2010. Energy cost of activities and locomotion of grazing cows: A repeated study in larger plots. Journal of Animal Science 88:315-323.
Bullock, J. M., B. C. Hill, and J. Silvertown. 1994. Tiller dynamics of two grasses responses to grazing, density and weather. Journal of Ecology 82:331-340.
Burnham, K. P., and D. R. Anderson. 2002. Model selection and multimodel inference: a practical information-theoretic approach. Springer Science & Business Media.
Christensen, N. L. 1997. Managing for heterogeneity and complexity on dynamic landscapes. Pages 167-186 The ecological basis of conservation. Springer.
Coughenour, M. B. 1991. Spatial components of plant-herbivore interactions in pastoral, ranching, and native ungulate ecosystems. Journal of Range Management 44:530-542.
Damiran, D., T. DelCurto, E. Darambazar, A. A. Clark, P. L. Kennedy, and R. Taylor. 2007. Visual obstruction: weight technique for estimating production on northwestern bunchgrass prairie rangelands. In: Proceedings of Western Section, American Society of Animal Sciences 58:225-228.
Daubenmire, R. 1959. A canopy-coverage method of vegetational analysis. Northwest Science 33:43-64.
DelCurto, T., B. Hess, J. Huston, and K. Olson. 2000. Optimum supplementation strategies for beef cattle consuming low-quality roughages in the western United States. Journal of Animal Science 77:1-16.
Dennis, P., M. Young, and I. Gordon. 1998. Distribution and abundance of small insects and arachnids in relation to structural heterogeneity of grazed, indigenous grasslands. Ecological Entomology 23:253-264.
Derner, J. D., W. K. Lauenroth, P. Stapp, and D. J. Augustine. 2009. Livestock as Ecosystem Engineers for Grassland Bird Habitat in the Western Great Plains of North America. Rangeland Ecology & Management 62:111-118.
Dormann, C. F., J. Elith, S. Bacher, C. Buchmann, G. Carl, G. Carré, J. R. G. Marquéz, B. Gruber, B. Lafourcade, and P. J. Leitão. 2013. Collinearity: a review of methods to deal with it and a simulation study evaluating their performance. Ecography 36:27-46.
Dowhower, S. L., W. R. Teague, R. J. Ansley, and W. E. Pinchak. 2001. Dry-weight-rank method assessment in heterogenous communities. Journal of Range Management:71-76.
Dugger, K. M., F. Wagner, R. G. Anthony, and G. S. Olson. 2005. The relationship between habitat characteristics and demographic performance of northern spotted owls in southern Oregon. The Condor 107:863-878.
Dunn, R., K. Havstad, and E. Ayers. 1988. Grazing behavior responses of rangeland beef cows to winter ambient temperatures and age. Applied Animal Behaviour Science 21:201-207.
Fieberg, J., and D. H. Johnson. 2015. MMI: Multimodel inference or models with management implications? The Journal of Wildlife Management.
Fuhlendorf, S. D., and D. M. Engle. 2001. Restoring heterogeneity on rangelands: Ecosystem management based on evolutionary grazing patterns. BioScience 51:625-632.
Fuhlendorf, S. D., D. M. Engle, J. Kerby, and R. Hamilton. 2009. Pyric herbivory: rewilding landscapes through the recoupling of fire and grazing. Conservation Biology 23:588-598.
Fuhlendorf, S. D., W. C. Harrell, D. M. Engle, R. G. Hamilton, C. A. Davis, and D. M. Leslie Jr. 2006. Should heterogeneity be the basis for conservation? Grassland bird response to fire and grazing. Ecological Applications 16:1706-1716.
Fuhlendorf, S. D., and F. E. Smeins. 1998. The influence of soil depth on plant species response to grazing within a semi-arid savanna. Plant Ecology 138:89-96.
Greene, R., P. Kinnell, and J. T. Wood. 1994. Role of plant cover and stock trampling on runoff and soil-erosion from semi-arid wooded rangelands. Soil Research 32:953-973.
Heiri, O., A. F. Lotter, and G. Lemcke. 2001. Loss on ignition as a method for estimating organic and carbonate content in sediments: reproducibility and comparability of results. Journal of paleolimnology 25:101-110.
Holechek, J. L., R. D. Pieper, and C. H. Herbel. 2004. Range management: Principles and practices. 5th edition. Chapter 8: Considerations concerning stocking rate. 216-254. Pearson Prentice Hall, New Jersey.
Holmes, W., J. Jones, and R. Drake-Brockman. 1961. The feed intake of grazing cattle. II. The influence of size of animal on feed intake. Animal Science 3:251-260.
Hovick, T. J., R. D. Elmore, S. D. Fuhlendorf, D. M. Engle, and R. G. Hamilton. 2015. Spatial heterogeneity increases diversity and stability in grassland bird communities. Ecological Applications 25:662-672.
Jamieson, W., and J. Hodgson. 1979. The effect of daily herbage allowance and sward characteristics upon the ingestive behaviour and herbage intake of calves under strip‐grazing management. Grass and Forage Science 34:261-271.
Johnson, D. H. 1980. The comparison of usage and availability measurements for evaluating resource preference. Ecology 61:65-71.
Kertson, B. N., and J. M. Marzluff. 2010. Improving studies of resource selection by understanding resource use. Environmental Conservation 38:18-27.
Kertson, B. N., R. D. Spencer, J. M. Marzluff, J. Hepinstall-Cymerman, and C. E. Grue. 2011. Cougar space use and movements in the wildland–urban landscape of western Washington. Ecological Applications 21:2866-2881.
Krysl, L. J., and B. W. Hess. 1993. Influence of supplementation on behavior of grazing cattle. J Anim Sci 71:2546-2555.
Langlands, J. 1968. The feed intake of grazing sheep differing in age, breed, previous nutrition and live weight. The Journal of Agricultural Science 71:167-172.
López‐González, C., S. J. Presley, A. Lozano, R. D. Stevens, and C. L. Higgins. 2015. Ecological biogeography of Mexican bats: the relative contributions of habitat heterogeneity, beta diversity, and environmental gradients to species richness and composition patterns. Ecography 38:261-272.
Lusby, K., D. Stephens, L. Knori, and R. Totusek. 1967. Forage intake of range cows as affected by breed and level of winter supplement. Oklahoma Agr. Exp. Sta. Res. Rep. MP-96:27-32.
Malechek, J. C., and B. M. Smith. 1976. Behavior of range cows in response to winter weather. Journal of Range Management:9-12.
Mannetje, L. 1963. The dry‐weight‐rank method for the botanical analysis of pasture. Grass and Forage Science 18:268-275.
Marzluff, J. M., J. J. Millspaugh, P. Hurvitz, and M. S. Handcock. 2004. Relating resources to a probabilistic measure of space use: forest fragments and Steller's jays. Ecology 85:1411-1427.
McNew, L. B., V. L. Winder, J. C. Pitman, and B. K. Sandercock. 2015. Alternative rangeland management strategies and the nesting ecology of Greater Prairie-Chickens. Rangeland Ecology & Management 68:298-304.
Meyer, A., and P. Gunn. 2015. Beef Species Symposium: Making more but using less: The future of the US beef industry with a reduced cow herd and the challenge to feed the United States and world. Journal of Animal Science 93:4223-4226.
Mulliniks, J., M. Kemp, R. Endecott, S. Cox, A. Roberts, R. Waterman, T. Geary, E. Scholljegerdes, and M. Petersen. 2013. Does β-hydroxybutyrate concentration influence conception date in young postpartum range beef cows? Journal of Animal Science 91:2902-2909.
Nakagawa, S., and H. Schielzeth. 2013. A general and simple method for obtaining R2 from generalized linear mixed‐effects models. Methods in Ecology and Evolution 4:133-142.
Patten, R. S., and J. E. Ellis. 1995. Patterns of species and community distributions related to environmental gradients in an arid tropical ecosystem. Vegetatio 117:69-79.
Petersen, C. A., J. J. Villalba, and F. D. Provenza. 2014. Influence of experience on browsing sagebrush by cattle and its impacts on plant community structure. Rangeland Ecology & Management 67:78-87.
R Core Team. 2017. R: A language and environment for statistical computing. R Foundation for Statistical Computing: Vienna, Austria. Available at: http://www.R-project.org/.
Riley, S. J. 1999. Index that quantifies topographic heterogeneity. intermountain Journal of sciences 5:23-27.
Robel, R., J. Briggs, A. Dayton, and L. Hulbert. 1970. Relationships between visual obstruction measurements and weight of grassland vegetation. Journal of Range Management:295-297.
Schauer, C. S., D. W. Bohnert, D. C. Ganskopp, C. J. Richards, and S. J. Falck. 2005. Influence of protein supplementation frequency on cows consuming low-quality forage: performance, grazing behavior, and variation in supplement intake. J Anim Sci 83:1715-1725.
Skinner, R. M., T. S. Baskett, and M. D. Blenden. 1984. Bird habitat on Missouri prairies.
Turner, L., M. Udal, B. Larson, and S. Shearer. 2000. Monitoring cattle behavior and pasture use with GPS and GIS. Canadian Journal of Animal Science 80:405-413.
Ungar, E. D., Z. Henkin, M. Gutman, A. Dolev, A. Genizi, and D. Ganskopp. 2005. Inference of animal activity from GPS collar data on free-ranging cattle. Rangeland Ecology & Management 58:256-266.
USGS. The National Map, 2017, 3DEP products and services: The National Map, 3D Elevation Program Web page, accessed 05/13/2017 at https://nationalmap.gov/3DEP/3dep_prodserv.html.
Valente, E., M. Paulino, E. Detmann, S. Valadares Filho, M. Chizzotti, A. Silva, and I. Maciel. 2013. Grazing Behavior and Locomotion of Young Bulls Receiving Different Nutritional Plans in a Tropical Pasture. Asian-Australasian journal of animal sciences 26:1717.
Walburger, K. J., M. Wells, M. Vavra, T. DelCurto, B. Johnson, and P. Coe. 2009. Influence of cow age on grazing distribution in a mixed-conifer forest. Rangeland Ecology & Management 62:290-296.
Wander, M. 2004. Soil organic matter fractions and their relevance to soil function. Soil organic matter in sustainable agriculture. CRC Press, Boca Raton, FL:67-102.
Wiens, J. A. 1997. The emerging role of patchiness in conservation biology. Pages 93-107 The ecological basis of conservation. Springer.
Willms, W., S. Smoliak, and A. Bailey. 1986. Herbage production following litter removal on Alberta native grasslands. Journal of Range Management:536-540.
Winder, V., L. McNew, A. Gregory, L. Hunt, S. Wisely, and B. K. Sandercock. 2014. Space use by female Greater Prairie-Chickens in response to wind energy development. Ecosphere 5:art3.
Research outcomes
Education and Outreach
Participation summary:
The objectives of our research proposal and preliminary results from the supplement and intake control system, SmartFeed Pro self-feeder (C-Lock Inc., Rapid City, SD), have been featured in several presentations and meetings across Montana: The Northern Ag Research Center (NARC) Advisory Committee meeting, NARC Field Day, Montana Nutrition Conference, the Stillwater Range Association, Montana Stock Growers mid-year meetings, Montana State University Extension Agent Training, and the Crazy Mountains Livestock Association Meetings. There have been 2 accepted Western Section of American Society of Animal Science proceeding papers from this project that will be presented at the annual meetings in Bend, OR June of 2018. Additionally, photographs of our research cattle using the equipment specifically designed for our research project are featured on the C-Lock inc. website, advertised as the world’s most portable feed intake and supplement control system.