Final report for GW18-179
Project Information
Nitrogen (N) fertilizer is generally the largest input cost for farmers in the Northern Great Plains. Despite this fact, scientists, producers, and their advisors have failed to develop a system for determining areas of fields that are more or less susceptible to N loss. Moreover, warming temperatures are projected to increase the fraction of precipitation delivered as rain versus snow, which in turn could affect spatiotemporal variability in N loss processes such as leaching. Leaching losses alone can account for up to one-third of typical fertilizer rates in shallow and variable soils. Subfield-scale changes in surface (0-20 cm) soil water extractable N (WEN) during the winter months (September to April), henceforth overwinter N changes (ONCs), were spatially characterized based on high-resolution (5 cm) imagery of wheat in Central Montana. By restricting the period of inquiry to the months between September and April, contributions of N loss processes such as denitrification and crop uptake were minimized or eliminated. No fertilizers were applied during this time. Restricting the study area to a 0.4-ha subfield encompassing a strong gradient in thickness of fine-textured soil (zf; a major control on N leaching per Sigler et al. [2020]), allowed for spatial estimates of overwinter leaching, given that mineralization (estimated by enzyme assays and in situ microbial activity) did not vary with zf in the current study. It is therefore suggested that differences in N leaching were largely responsible for the ONCs observed, while mineralization and denitrification were relatively unchanged across the study area. Spatially interpolated ONCs ranged from -9.4 kg ha-1 to +17.8 kg ha-1 and averaged 1.1 ± 3.1 kg ha-1 (± SD) following wheat during the 2019-2020 winter. Standard deviations of spatially interpolated 2019-2020 ONCs were not as large as observed single-year ONCs (6.9 and 8.1 kg ha-1), while observed single-year ONCs were greater than the year-to-year standard deviation (4.5 kg ha-1), suggesting ONC spatial variability is at least as large as ONC inter-annual variability in shallow and variable soils. ONC variability was driven by large fall WEN standard deviations (4.4 and 6.7 kg ha-1), with comparatively low standard deviations observed in spring WEN (1.8 and 3.7 kg ha-1). A negative relationship (p = 0.0278) between fall WEN and zf analyzed across years suggests that mitigating N loss overwinter is matter of optimizing crop uptake during the growing season. It was estimated that 14.5 ± 3.4 kg N ha-1 was left ‘stranded’ in the top 20 cm of the profile in fall 2019. Results indicate strong potential for spatially and temporally explicit management strategies (e.g., variable rate seeding and/or fertilizer application, split application) to optimize crop uptake, minimize residual soil N, and mitigate N loss overwinter. Climate warming trends identified in the current study are likely to disproportionately inflate year-to-year variability in ONC, given that warming should occur uniformly across small areas (0.4-ha) and surface soil temperatures do not vary with zf (p = 0.8232). It is also possible that warming trends will shorten the leaching season such that temporally explicit management strategies (e.g., split fertilizer application) will hold less potential for N loss mitigation in the future. In a warmer climate with more precipitation being delivered as rain versus snow, it may become more important for farmers to avoid high soil N concentrations when crop uptake is minimal or absent. However, this window is likely to shorten as air temperatures increase, freezing temperatures in mid-to-late spring become less frequent, and growing seasons lengthen. More work is needed to explore these complex feedbacks under field conditions.
1. Quantify subfield-scale variability in ONCs toward improved precision ag methods such as
variable rate fertilizer application.
2. Develop a model to predict ONCs and to notify farmers when large ONCs are likely to have
occurred in order to minimize economic and environmental injuries resulting from uninformed
fertilizer management decisions.
3. Demonstrate to farmers the economic and environmental benefits of soil testing and the
implications of changing precipitation and temperature patterns for N management practices.
Cooperators
- (Educator and Researcher)
- (Educator and Researcher)
- (Educator and Researcher)
- (Educator and Researcher)
- (Educator and Researcher)
Research
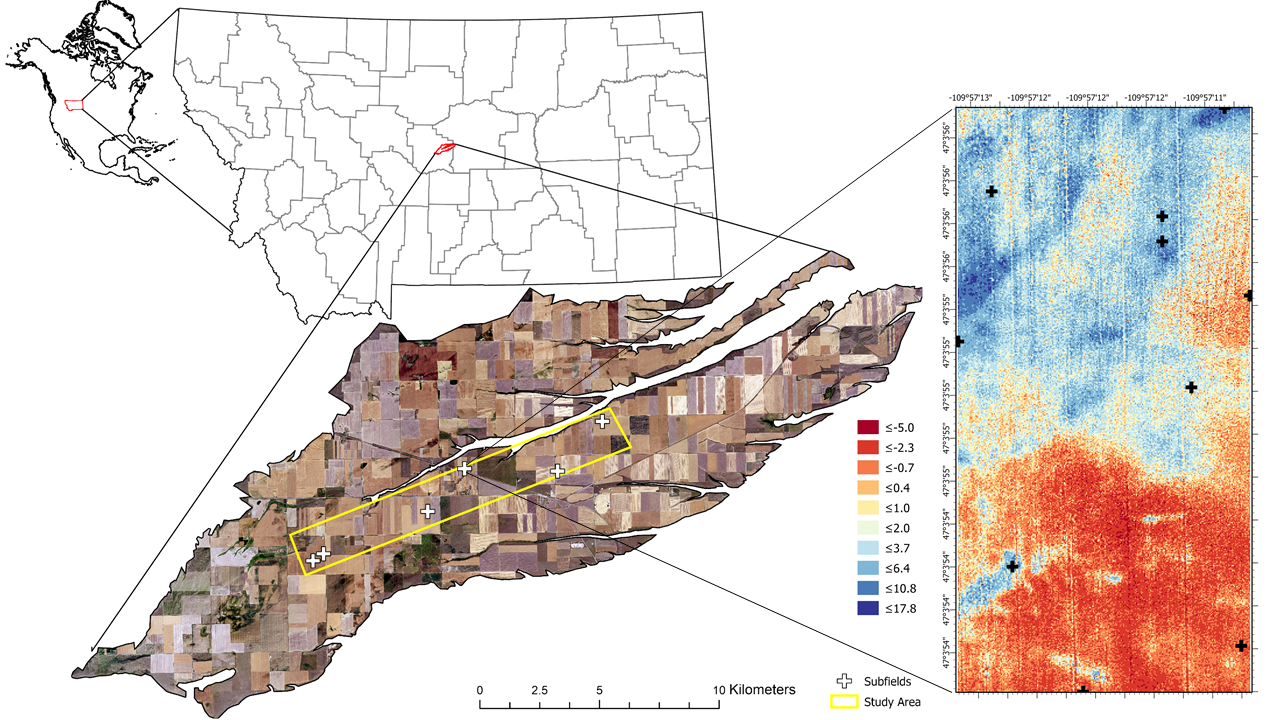
A transect of the Moccasin Terrace in central Montana (Figure 1), capturing a gradient in aquifer thickness, was the original study area for this project. Aquifer thickness, determined by depth to an impermeable shale layer on the terrace, was hypothesized in past work (Sigler et al., 2018) to be a control on N leaching, given the increased likelihood of overland flow versus deep percolation where the aquifer is thin and limited in storage capacity. Six agricultural fields along this transect under various phases of wheat-based crop rotations were targeted, and within each field, a 0.4-ha subfield capturing a steep soil thickness (zf) gradient was identified. Within each subfield, 12 fully randomized, georeferenced points were assigned as soil monitoring locations. A subset of these monitoring locations were sampled to a depth of 20 cm for water extractable N (WEN), β-glucosaminidase (NAG), and β-glucosidase (BG) in September 2018, April 2019, September 2019, and April 2020.
The maximum depth of a soil coring tube at 3 MPa of down pressure was used to estimate thickness of fine-textured soil (zf). Unfortunately, this method proved inaccurate when sample sizes were small, i.e., only when zf was sampled greater than three times under varying soil moisture conditions did the method provide a reasonable estimate of zf. This determination was validated with regression analysis of zf and the spectral index NDVI derived from well-timed aerial images (National Agricultural Imagery Program; NAIP). Past work (Sigler et al., 2020) has shown zf to be linearly correlated with NAIP NDVI images of cereal crops acquired near 50% senescence, provided zf is less than 55 cm deep. In the current study, no such relationship existed where zf was sampled under dry conditions less than four times. This finding, coupled with large differences in management factors across fields, led to the exclusion of 5 out of 6 subfields from the final analysis. For example, even when crop rotations did align across fields, differences in field accessibility related to aquifer thickness (i.e., fields overlying aquifers with large storage capacity became accessible much earlier in spring, thought to be related to increased precipitation partitioning to deep percolation as opposed to overland flow in these areas) contributed to large differences in seeding dates, which prevented similarly timed NAIP images from accurately predicting zf across subfields.
At the one subfield where zf was characterized with certainty (henceforth, the study area), empirical Bayesian kriging with regression (EBKr) based on zf observations and NDVI from multiple aerial images, including those acquired via NAIP, Sentinel 2, and an unmanned aerial vehicle (UAV), confirmed accuracy of the probing method. EBKr was also conducted with NDVI from a UAV-mounted multispectral sensor and WEN observations from fall 2019. Six auto-closing soil respiration (SR) chambers (CFLUX-1) were deployed in the study area to capture a zf gradient and were kept operational throughout the winter of 2019-2020. To determine aboveground biomass (AGB) at each of the monitoring locations (within 1 m), a known area of spring wheat was hand-clipped in 2019 and 2020 to within 5 cm of the soil surface just prior to grain harvest.
Statistical analysis
In the first modelling approach (Table 1a), zf, year, and a zf x year interaction term were designated as fixed effects to determine their effect on fall WEN, NAG, BG, and AGB. Significant zf x year interactions were not detected for any response variable, and therefore justification was provided for dropping interaction terms from the model and reanalyzing in a second approach (Table 1b) as mixed effects models, with zf as a fixed effect and year as a random effect. Years were also analyzed separately for each response variable, using a simple linear regression approach (Table 2).
An additional mixed model tested effects of zf on SR, where extracted NDVI of UAV imagery at corresponding chamber locations (a proxy for zf) was the fixed effect, and sample date was the random effect (Table 1). An additional model was constructed to test whether effects of zf on WEN were dependent on season (i.e., fall vs. spring). Here, WEN was the response variable, while zf, season (fall 2019 and spring 2020), and a zf x season interaction term were designated as fixed effects.
Climate analyses in this report were based on daily minimum air temperatures measured inside a Stevenson screen located 1 km from the study area. Temperature data were collected by staff of the Central Agricultural Research Center (CARC) in Judith Basin, Montana from 1911-2020. To assess long term trends in warming, three linear regression models were constructed: 1) annual average daily minimum air temperatures were averaged by crop year (September through August) and regressed against crop year (1912-2020; Table 3a); 2) annual minimum temperatures were aggregated by and regressed against crop year (1912-2020; Table 3b); and 3) date of the last freezing temperature in spring was aggregated by and regressed against calendar year (1911-2020; Table 3c). In the latter model, August 1 (DOY = 213) was designated as a threshold date after which observed freezing temperatures were excluded from the analysis.
Analyzed across years, WEN declined significantly (p = 0.0278) with increasing zf, while effects of year were somewhat less important (p = 0.0525; Table 1). A significant zf x year interaction was not detected (p = 0.4306). The zf x year interaction term was therefore dropped from the model and year was designated as a random effect in a subsequent mixed effects model. After accounting for random effects of year, residual WEN was shown to significantly (p = 0.0257) decline with increasing zf at a rate of 0.17 kg ha-1 cm-1. However, when years were analyzed separately (Table 2), it was clear that the zf-WEN relationship broke down in the drier of the two years, despite the fact that the slope of the regression line did not change statistically. Specifically, in the relatively dry 2018 growing season, zf had no significant effect on fall WEN (p = 0.4090), while in the much wetter 2019 growing season, zf had highly a highly significant effect (p = 0.0028). Not surprisingly, average fall WEN was arithmetically lower in 2019 (29.3 kg ha-1) compared to 2018 (35.6 kg ha-1), likely owing to increased crop uptake under wetter conditions.
Table 1. P-values for individual effect terms in linear regressions of response variables (WEN = water extractable N; AGB = above-ground biomass; BG = β-glucosidase; NAG = β-glucosaminidase; SR = soil respiration) against thickness of fine-textured soil (zf). In the first modelling approach (a), all terms were treated as fixed effects, while in the second approach (b), the zf x year interaction term was dropped and year (sample date for SR) was designated as a random effect.
|
Modelling Approach |
Explanatory Variable |
Response Variable |
||||
|
WEN |
AGB |
BG |
NAG |
SR |
||
|
(a) |
zf |
0.0278 |
<0.0001 |
0.7315 |
0.105 |
- |
|
year |
0.0525 |
0.0002 |
0.0249 |
0.108 |
- |
|
|
zf x year |
0.4306 |
0.7561 |
0.3957 |
0.115 |
- |
|
|
(b) |
zf |
0.0257 |
<0.0001 |
0.7295 |
0.1205 |
0.1525 |
No significant effects of zf on BG, NAG, or SR were detected when analyzed across years (Table 1), although effects on BG were nearly significant in 2019 (p = 0.0831). With this lone exception, fall BG, fall NAG, and overwinter SR were unrelated to zf. Results suggest processes other than those that are microbially-mediated (e.g., mineralization, denitrification) were responsible for the observed differences in WEN along the zf gradient. The 2019 fall WEN-zf trend is opposite (R = -0.83) of what would be expected if leaching drove the differences, since shallow soils have been shown to leach more versus less N (John et al., 2017; Sigler et al., 2020). These findings, in combination with that of a highly significant (p < 0.0001), year-independent (p = 0.7561), and positive (R = 0.76) relationship between zf and above-ground biomass, suggest that crop uptake, or the lack thereof, largely drove differences in fall WEN across the zf gradient. Specifically, it is hypothesized that depletion of soil water early in the growing season ‘stranded’ large quantities of N in the top 20 cm of the profile where soils were shallow, while greater storage in deeper soils allowed crops to forage N more efficiently and for longer, driving down N concentrations in the top 20 cm relative to nearby shallow soils under the same management. This is a promising finding, as it suggest that spatial optimization of N uptake could eliminate or minimize overwinter leaching and its adverse effects on soil health (e.g., acidification) and water quality.
Table 2. Coefficient of determination (R2), slope, p-value and residual standard error (SE) for linear regressions of response variables (WEN = water extractable N; AGB = above-ground biomass; BG = β-glucosidase; NAG = β-glucosaminidase; SR = soil respiration) against thickness of fine-textured soil (zf ), grouped by year. SE is in units of kg ha-1 (WEN, AGB), mg p-nitrophenol kg-1h-1 (BG, NAG), and g m-2 hr-1 (SR).
|
Response Variable |
year 1 |
year 2 |
||||||
|
R2 |
slope |
p-value |
SE |
R2 |
slope |
p-value |
SE |
|
|
WEN |
0.09 |
-0.12 |
0.4090 |
6.6 |
0.69 |
-0.23 |
0.0028 |
2.7 |
|
AGB |
0.74 |
47 |
0.0014 |
490 |
0.80 |
52 |
0.0005 |
457 |
|
BG |
0.01 |
0.24 |
0.7900 |
43 |
0.33 |
-0.56 |
0.0831 |
14 |
|
NAG |
0.28 |
0.40 |
0.116 |
11 |
0.00 |
0.01 |
0.9320 |
3.3 |
|
SR |
0.02 |
-0.19 |
0.2171 |
0.04 | - |
- |
- |
- |
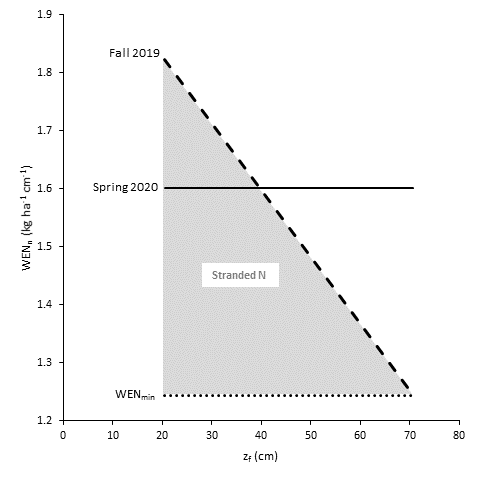
If it is assumed that spatially explicit management practices such as variable rate seeding and/or fertilizer application interact with zf to affect WEN, an estimate of the 'stranded N' that could be taken up by the crop with the implementation of these practices can be obtained using the following method. Fall WEN (kg ha-1) is first normalized to sample depth (20 cm) to obtain WENn (kg ha-1 cm-1). The minimum predicted WENn (WENmin) can be conceptualized as a theoretical minimum WENn across all zf values. WENmin can be derived from the same regression analyses as performed with 2019 WEN in Table 2 by evaluating the following WENn-zf regression equation:
Eq. 1: WENn = -0.01 * zf + 2.1
at the maximum observed zf (71 cm). Taking the integral of Eq. 1 and subtracting the integral of WENmin provides an estimate of WEN (kg ha-1) in the top 20 cm that the crop theoretically could have removed during the growing season had crop uptake been spatially optimized. By this method it was estimated that 14.5 ± 3.4 kg N ha-1 was left ‘stranded’ in the top 20 cm of the soil profile in 2019 (an unusually wet year), all of which could have been taken up by the crop if alternative management practices had been implemented (Figure 2).
The effects of zf on WEN were found to be dependent on season (p =0.0041) in the current study. Specifically, zf was related to WEN in fall 2019 but not in spring 2020. That the zf-WEN relationship broke down in spring 2020 (p = 0.3072) justifies the spatial modelling of overwinter N change by simply subtracting EBKr-predicted fall WEN from the mean spring WEN pixel-wise (Figure 1). By this method, apparent ONCs ranged from -9.4 kg ha-1 to +17.8 kg ha-1 and averaged 1.1 ± 3.1 kg ha-1 (± SD) following wheat during the 2019-2020 winter. Assuming N leaching alone drove differences in ONC, the top 20 cm of the shallowest soils (23 cm by EBKr; data not shown) lost 27.2 kg ha-1 more N to leaching than that of the deepest soils (102 cm by EBKr; data not shown). In other words, a 79 cm increase in soil depth was associated with a 27.2 kg ha-1 decline in leaching. John et al. (2017) reported a 17.4 kg ha-1 decline in leaching with a 60-cm increase in zf when averaged across cropping systems and years. Interestingly, the zf-normalized leaching rate in both studies was 0.3 kg ha-1 cm-1, despite the fact that John et al. (2017) sampled both surface and subsoils.
When soil N observations were subset to those taken within 1 km of the current study area, aggregated by year, and then averaged across years, data from Jones et al. (2011) showed ONCs averaged 1.5 ± 4.5 kg ha-1 following wheat in the same shallow and variable soils. The multi-year standard deviation from the subset of Jones et al. (2011) data was equivalent to the multi-year standard deviations reported here (4.5 kg ha-1) and much smaller than single-year ONC standard deviations assessed across zf (6.9 and 8.1 kg ha-1) in the current study, suggesting fine-scale spatial variability in ONC is at least as large as year-to-year variability in these soils.
Annual average daily minimum air temperatures were shown to have increased at a rate of 0.01 °C yr-1 from 1912-2020 (p = 0.0004; Table 3a), while annual minimum air temperatures increased at five times this rate over the same period (0.05 °C yr-1; p = 0.0014; Table 3b). Date of the last frost in spring has advanced earlier in the year since the beginning of record keeping at a rate of 0.13 days yr-1 (p = 0.0033; Table 3c).
Table 3. Coefficient of determination (R2), slope, p-value, and residual standard error (SE) for linear regressions of annual average daily minimum air temperature (Taad), minimum annual air temperature (Tmin), and date of the last frost in spring (DOYlfs) against crop or calendar year. SEs are in units of °C (Taad, Tabs) or Julian days (DOYlfs).
|
Model |
Response Variable |
Explanatory Variable |
R2 |
slope |
p-value |
SE |
|
(a) |
Taad |
Crop Year |
0.11 |
0.01 |
0.0004 |
0.92 |
|
(b) |
Tmin |
Crop Year |
0.09 |
0.05 |
0.0014 |
4.6 |
|
(c) |
DOYlfs |
Calendar Year |
0.08 |
-0.13 |
0.0033 |
14 |
That these regressions only explain 8-11% of the overall variability in the observed data (Table 3a-c) highlights the inherent challenges of climatic modelling and the uncertainty associated with climate-based decision support systems. Nonetheless, some general conclusions and hypotheses can be stated. Warming trends identified here are likely to inflate year-to-year variability in ONC without an appreciable difference in fine-scale (0.4 ha) spatial variability, given that warming is likely to occur uniformly across small areas and surface soil temperatures do not vary with zf (p = 0.8232, data not shown). It is also possible that warming trends will shorten the leaching season such that temporally explicit management strategies (e.g., split fertilizer application) will hold less potential for N loss mitigation in the future. Conversely, in a warmer climate with more precipitation being delivered as rain versus snow, it may become more important for farmers to avoid high soil N concentrations when crop uptake is minimal or absent. However, this window is likely to shorten as air temperatures increase, freezing temperatures in mid-to-late spring become less frequent, and growing seasons lengthen. More work is needed to investigate these feedbacks under field conditions.
References
John AA, Jones CA, Ewing SA, Sigler WA, Bekkerman A, Miller PR (2017) Fallow replacement and alternative nitrogen management for reducing nitrate leaching in a semiarid region. Nutr Cycl Agroecosyst. Volume pages. doi: 10.1007/s10705-017-9855-9
Jones CA, Chen C, McVay K, Stougaard B, Westcott M, Eckhoff J, Lenssen A, Weeding J, Greenwood M (2011) Measured and predicted temporal changes in soil nitrate-N levels from late summer to early spring in Montana. Western Nutrient Mgmt Conference. Vol 9
Sigler WA, Ewing SA, Jones CA, Payn RA, Brookshire ENJ, Klassen JK, Jackson-Smith D, Weissmann GS (2018) Connections among soil, ground, and surface water chemistries characterize nitrogen loss from an agricultural landscape in the upper Missouri River Basin. J Hydrol. 556, 247-261
Sigler WA., Ewing SA, Jones CA, Payn RA, Miller P, Maneta M (2020). Water and nitrate loss from dryland agricultural soils is controlled by management, soils, and weather. Agriculture, Ecosystems & Environment, 304, 107158.
Research outcomes
Education and Outreach
Participation summary:
Surface soil WEN and enzymatic activity were monitored at five commercial farms (Figure 1). Cooperating farmers initially assisted in site selection by providing historical crop rotation, fertility, and other management records of fields and subfields. Cooperators also revised and edited surveys designed to assess pre-existing knowledge of ONCs and climate predictions prior to distribution. These surveys were distributed in February 2019. One-on-one conversations with cooperators in-person and over the phone, as well as via email, were held on multiple occasions throughout the course of the project. The first discussions with potential cooperators occurred in October, 2018 and continued regularly throughout the project.
At the CARC summer field day in June 2019 (attendance = 72), a presentation was made summarizing results, study methods, and implications of early findings for local farming operations. Brochures were distributed as part of this presentation. Additionally, a presentation outlining the purpose and proposed methods of the experiment was given as part of the Department of Land Resources and Environmental Sciences (LRES) graduate seminar course on the campus of Montana State University (MSU), Bozeman, MT (Fordyce, 2019). A guest lecture was given to undergraduate juniors and seniors (attendance = 30) in an LRES Environmental Biogeochemistry course held in fall 2020. This work also led to hypotheses about nitrogen use efficiency of canola in shallow and variable soils that were presented to more than 80 canola farmers and industry members at the Pacific Northwest Canola Association Workshop in February 2021 (Fordyce, 2021 10:30 -26:30). Additionally, a public presentation at CARC’s annual ‘winter research roundup’ (expected attendance 60-70), as well as an MS thesis defense will be held in December 2021.
Two scholarly publications from this work are anticipated: one which estimates the N fertilizer savings from wheat replacement with field pea in comparison to those attained via spatial optimization of crop uptake, and another describing in detail the spatial modelling of residual soil N and ONC as outlined above. Remote Sensing (ISSN 2072-4292) and Agriculture, Ecosystems, & Environment (ISSN 0167-8809) are the primary target outlets for these papers. Informational handouts (e.g., Fertilizer Facts) and brochures will be made available at future CARC field days and winter research roundups, as well as other public events, to communicate major findings.