Final report for GW19-189
Project Information
Potato Virus Y: Testing New Potential Resistance Genes to an Enduring Threat to Potato Production
Potato Virus Y (PVY) is a major problem facing the Pacific Northwest potato industry. PVY infection in growers’ fields can lead to severe yield penalty and unmarketable tubers, which translate into significant economic losses. Spraying insecticides to control aphids, the primary vectors of PVY, or applying mineral oils to inhibit viral transmission have limited effectiveness due to the non-persistent nature of aphid transmission of PVY. A sustainable environmentally friendly solution to control PVY is the planting of potato varieties that are resistant to PVY. Many varieties grown in the western US are resistant to the ordinary strain of PVY. However, new recombinant strains that have become predominant in growers’ fields have defeated this strain-specific resistance. One major constraint to develop effective, long-term resistance against PVY is our lack of understanding of the strain-specific resistance mechanism used by some potato varieties to fight off PVY. This lack of knowledge also hinders our ability to understand how new PVY strains have broken existing resistance. Therefore, this project aims to shed light on the PVY-resistance mechanism and its breaking. Specifically, we propose to characterize the function of two genes that we hypothesize are crucial in the resistance response to PVY. This project has two objectives: (1) to evaluate the effect of disabling the targeted genes on the resistance to PVY, and (2) to analyze changes in gene expression in plants whose genes are disabled to identify network of genes involved in the resistance to PVY. Data from this project will help to better predict resistance failure and implement effective, sustainable anti-PVY strategies. Results from this project will be published in scientific journals and disseminated to stakeholders through extension publications and presentations at local extension events.
Through transcriptomics analyses, we have identified two candidate genes that we hypothesize are crucial in mounting the resistance response against PVY (Goyer et al 2015). In this project, we propose to determine the role of these genes, called PIP and MYC hereafter, in the resistance response and assess their potential use as resistance genes.
Objective #1: Evaluate the resistance response of potatoes whose PIP and MYC genes are disabled to three different PVY strains
Sub-objective #1: Evaluation of resistance during current season inoculation
The aim of this sub-objective is to determine resistance/susceptibility of plants whose PIP or MYC genes are disabled (i.e. knocked out) to inoculation with either of three PVY strains (N-Wilga, NTN, O) by monitoring leaf and tuber symptoms and by assessing the virus spread by PCR. The background variety of potato used to produce the disabled lines, Premier Russet, is resistant to PVYO but susceptible to other strains. Changes in the resistance response in the knockout lines compared to controls will provide evidence that these genes play some role in the establishment of the resistance response. This work should take about three months.
Sub-objective #2: Evaluation of resistance during secondary infection
The aim of this sub-objective is to assess resistance/susceptibility to seed-borne secondary infection of the virus. Tubers harvested in sub-objective #1 will be planted in pots and virus infection will be evaluated in foliage and tuber progeny. This work should take about three months.
Objective #2: Analyze changes in the overall gene expression in plants whose genes are disabled
The aim of this objective is to identify network of genes involved in the resistance response to PVY. For this, we will compare the foliage transcriptome of knockout and control lines in both PVY-inoculated and non-inoculated plants. This work should take about two months.
|
|
2019 Jul - Sep |
2019 Oct-Dec |
2020 Jan-Mar |
|
Obj 1, Sub-obj 1: Greenhouse planting, growing, sample collection, molecular characterization of PVY response. |
|
|
|
|
Obj 1, Sub-obj 2: Replanting of tubers and evaluation of secondary PVY infection. |
|
|
|
|
Obj 2: QuantSeq gene expression analysis of transgenic and non-modified plants challenged by PVYO. |
|
|
|
|
Publish and present results to conferences, communicate results to potato producers, breeders, and scientists. |
|
|
|
Cooperators
- (Researcher)
- - Producer
- - Technical Advisor
Research
This project involved three main stages:
- Make DNA constructs to overexpress, edit or silence two genes, namely PIP and MYC, and introduce them into Premier Russet
- Molecular characterization of regenerated plants (i.e. PCR genotyping and qPCR) to confirm that the genes are overexpressed, edited or silenced
- Test the resistance response of plants whose PIP or MYC genes are overexpressed, edited or silenced, to PVY inoculation.
During stages 1 and 2, we obtained Premier Russet plants that overexpress (i.e. produce more) or silence (i.e. produce less) PIP or MYC. We also attempted to edit plants using CRISPR (i.e. to completely kill those genes) but were only able to edit some alleles, not all four, so we focused stage 3 on plants that overexpress or silence PIP or MYC. During stage 3, we characterized the response of overexpressing and silencing plants to inoculation by three strains of PVY, O, NTN, and N-Wilga. We determined the presence/absence of Hypersensitive Response (HR) (i.e. a type of resistance), the onset of HR, the ability of the virus to spread systemically to leaves and tubers, and monitored symptoms on leaves and tubers. From these experiments, we made significant findings:
- First, we found that Premier Russet has a resistance gene (HR type) to PVY-N-Wilga. This result is important because it provides an additional source of resistance for breeding against the most dominant PVY strain in the Pacific Northwest.
- Second, we found that Premier Russet plants that overexpressed PIP develop clearly visible symptoms (rugose mosaic) starting 30 days post inoculation with PVY-NTN, while Premier Russet plants showed no or very mild symptoms when infected with PVY-NTN. These results are important for two reasons. First, they confirm our hypothesis that the PIP gene is involved in the plant/PVY interaction. Second, they open the possibility that the PIP peptide may be used in seed production fields to help identify and rogue infected plants that would not otherwise show any symptoms.
- Third, we found that Premier Russet plants that overexpressed MYC were able to reinforce the (HR) resistance to PVY-O and PVY-N-Wilga. These results are important because they indicate that modulating the expression of this gene could contribute to build stronger resistance to some PVY strains.
Activities or experiments conducted:
- DNA cloning
For each of the genes investigated in this project, namely PIP and MYC, we made three DNA constructs: one to overexpress the gene, one to edit (i.e. disrupt) the gene using CRISPR, and one to silence the gene using artificial microRNAs. The editing and silencing constructs achieve the same goal of knocking out (i.e. killing) the gene, but involve different technologies. We used both approaches to increase chances of successfully knocking out the genes.
- Plant transformation and regeneration
Each DNA construct was introduced into the variety Premier Russet that we are using as a model because of its resistance to PVY-O and susceptibility to other strains. The potato transformation process is illustrated in Figure 1. We regenerated 15 PIP and 4 MYC plants with the overexpression constructs, 14 PIP and 12 MYC plants with the CRISPR constructs, and 10 PIP and MYC plants with the silencing constructs.
3. Molecular characterization of overexpressing plants
First, we confirmed the presence of the DNA conructs in the genome of the regenerated plants by PCR. Results for PIP are shown in Figure 1. Similar results were obtained for MYC (not shown).
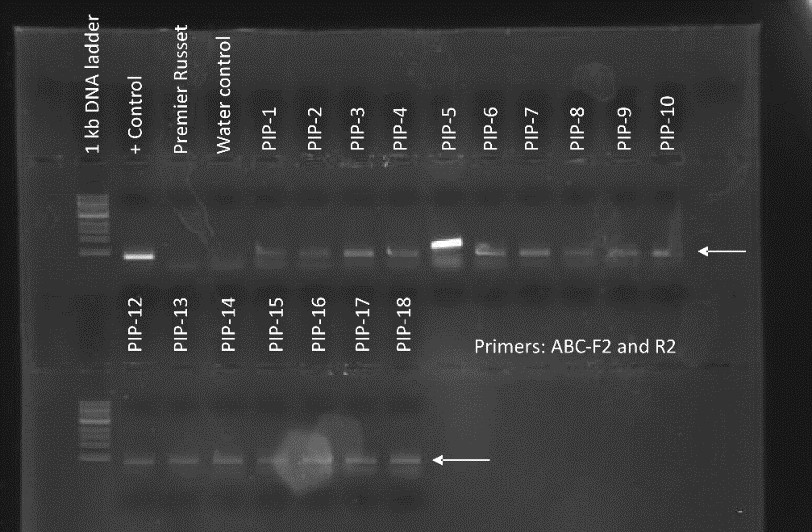
Figure 1. PCR genotyping of plants transformed with the PIP overexpression construct. All 17 PIP plants contained the DNA construct as shown by the presence of a PCR amplicon at ~500 bp. Premier Russet was used as a negative control. + Control is pure DNA plasmid used as positive control. Water control is a no template control.
Second, we used quantitative PCR (qPCR) to determine the level of expression of the PIP and MYC gene in the overexpressor lines. The PIP gene was overexpressed up to 18 times in the PIP lines (Figure 2, left panel). The MYC gene was overexpressed up to 800 times in the MYC lines (Figure 2, right panel). We selected three lines of each gene (PIP-1, PIP-8, PIP-14, and MYC-2.1, MYC-3.1, MYC-5.2) for analysis of resistance to PVY (see greenhouse experiment below).
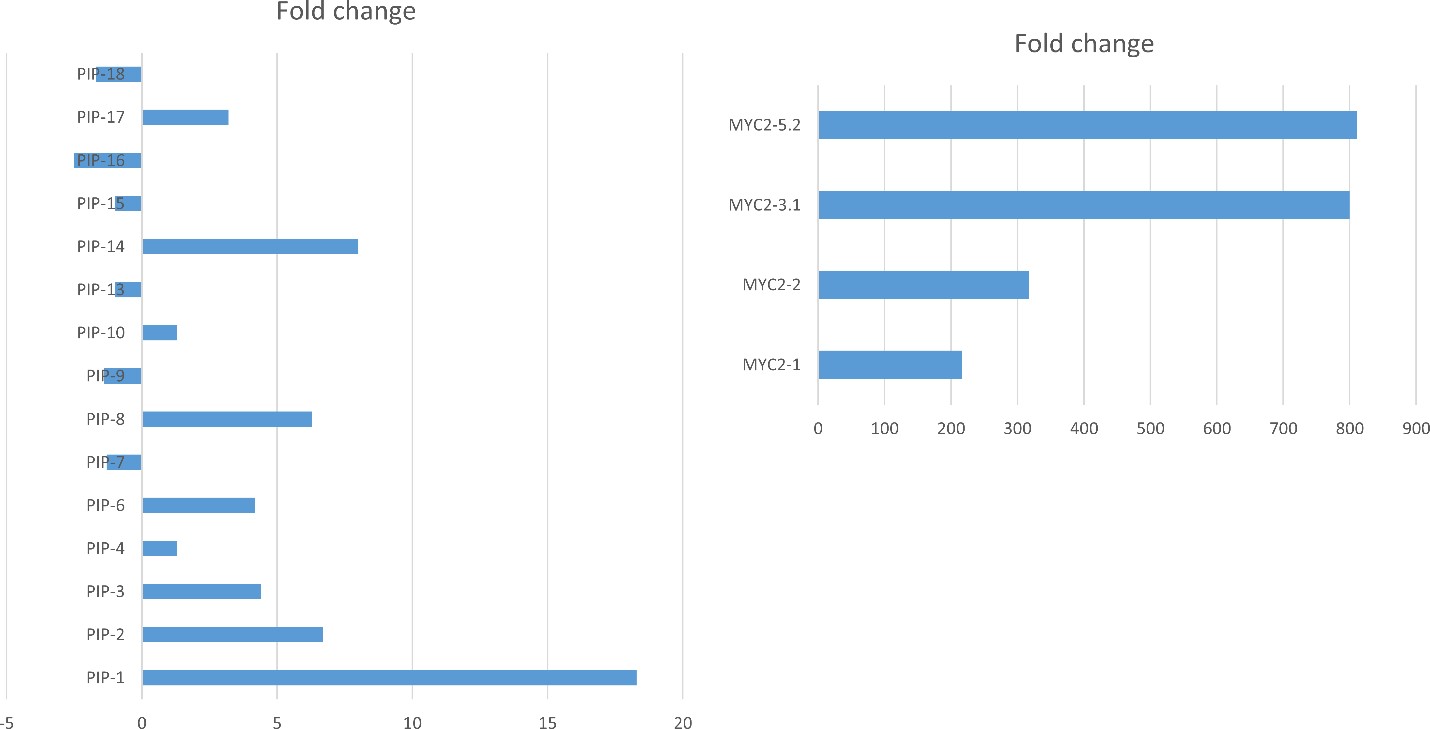
Figure 2. Quantitative RT-PCR of PIP (left panel) and MYC (right panel) overexpressor lines. Data indicate fold change compared to the control Premier Russet. Data are means of three biological repetitions. Gene expression was normalized to the housekeeping gene EF1α.
4.Molecular characterization of CRISPR-edited plants
First, we confirmed the presence of the DNA constructs in the genome of the regenerated plants by PCR. Results are shown in Figure 3.
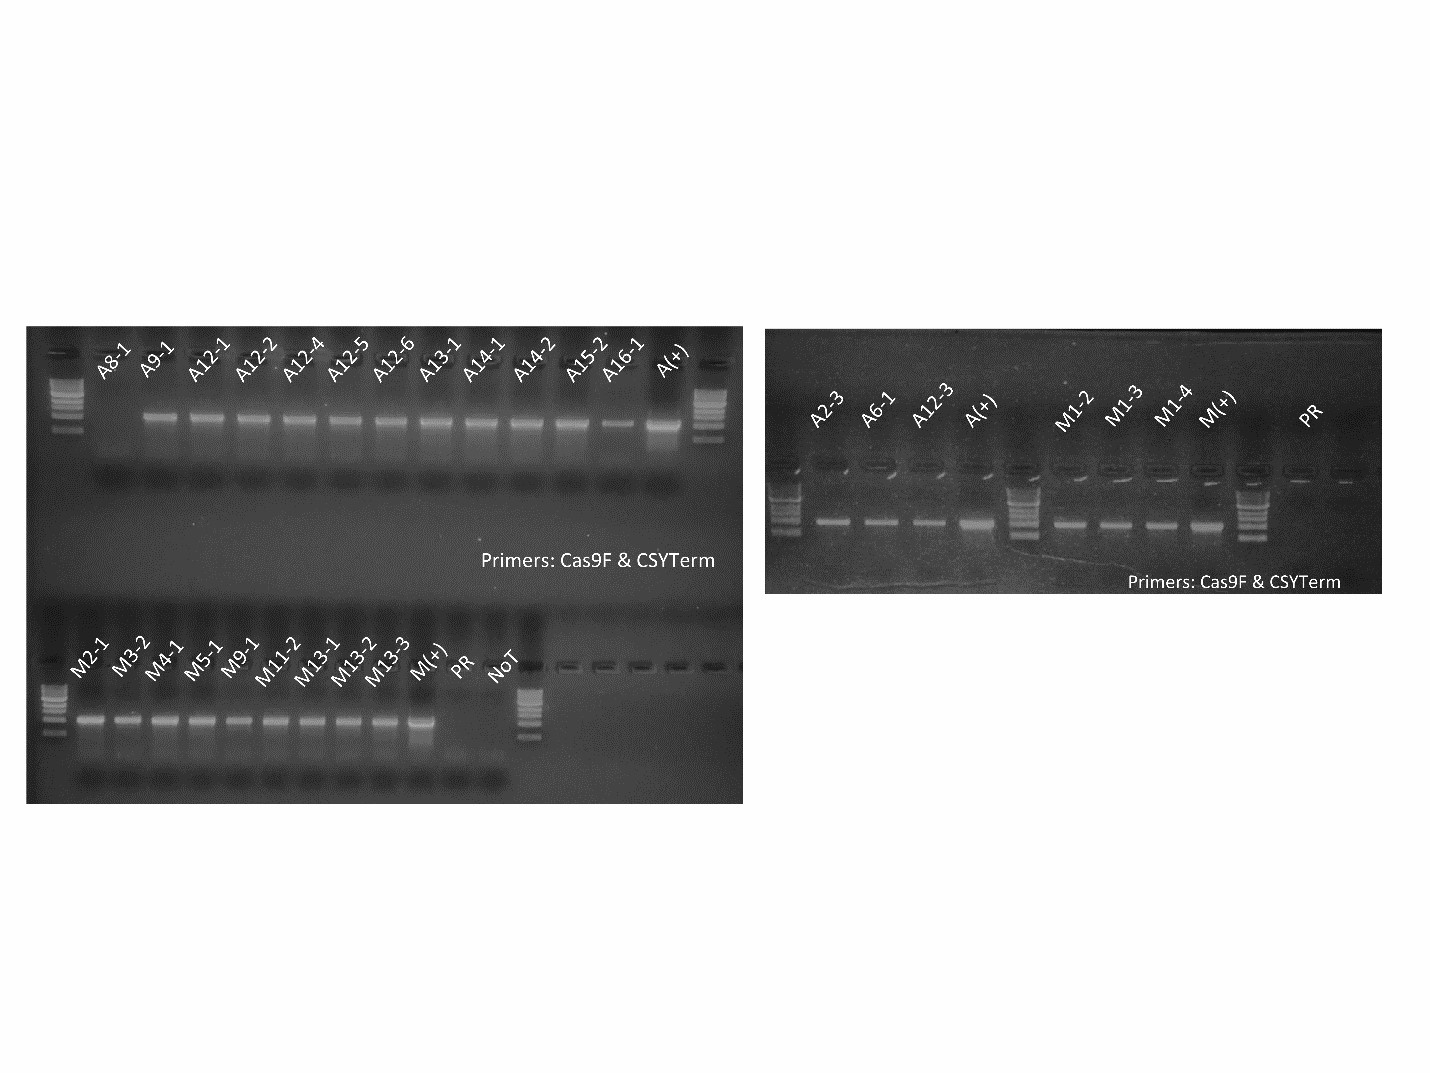
Figure 3. PCR genotyping of plants transformed with the CRISPR constructs. Samples labeled A and M are from plants transformed with the PIP and MYC CRISPR constructs, respectively. All but one PIP plants contained the DNA construct as shown by the presence of a PCR amplicon at ~1100 bp. All MYC plants contained the DNA construct as shown by the presence of a PCR amplicon at ~1100 bp. Premier Russet (PR) was used as a negative control. A(+) and M(+) are pure DNA plasmids used as positive controls. NoT is a no template control.
Next, we analyzed plants that contain the CRISPR constructs (see above) for editing signatures (e.g. deletion) in the PIP and MYC genes. Two guide RNA (gRNA) sequences were designed for each target gene. This was done to increase the probability of successful knockdown of the genes and to aid in genotyping. In the event of both gRNAs triggering simultaneous double strand breaks, a PCR-detectible deletion may occur. Further genotyping was done via enzyme digest approaches. In the case of PIP, one of the gRNA target sequences contains a BfaI restriction digest site at the predicted point of Cas9-mediated cleavage, so induced mutations at that site disrupt BfaI-mediated digestion. Edited alleles are identified by comparing BfaI digests of putative edited lines to that of an unedited control. For MYC, the gRNA target sites have no convenient restriction sites. Because of this, an assay using T7 Endonuclease 1 is performed to assess Cas9-mediated editing.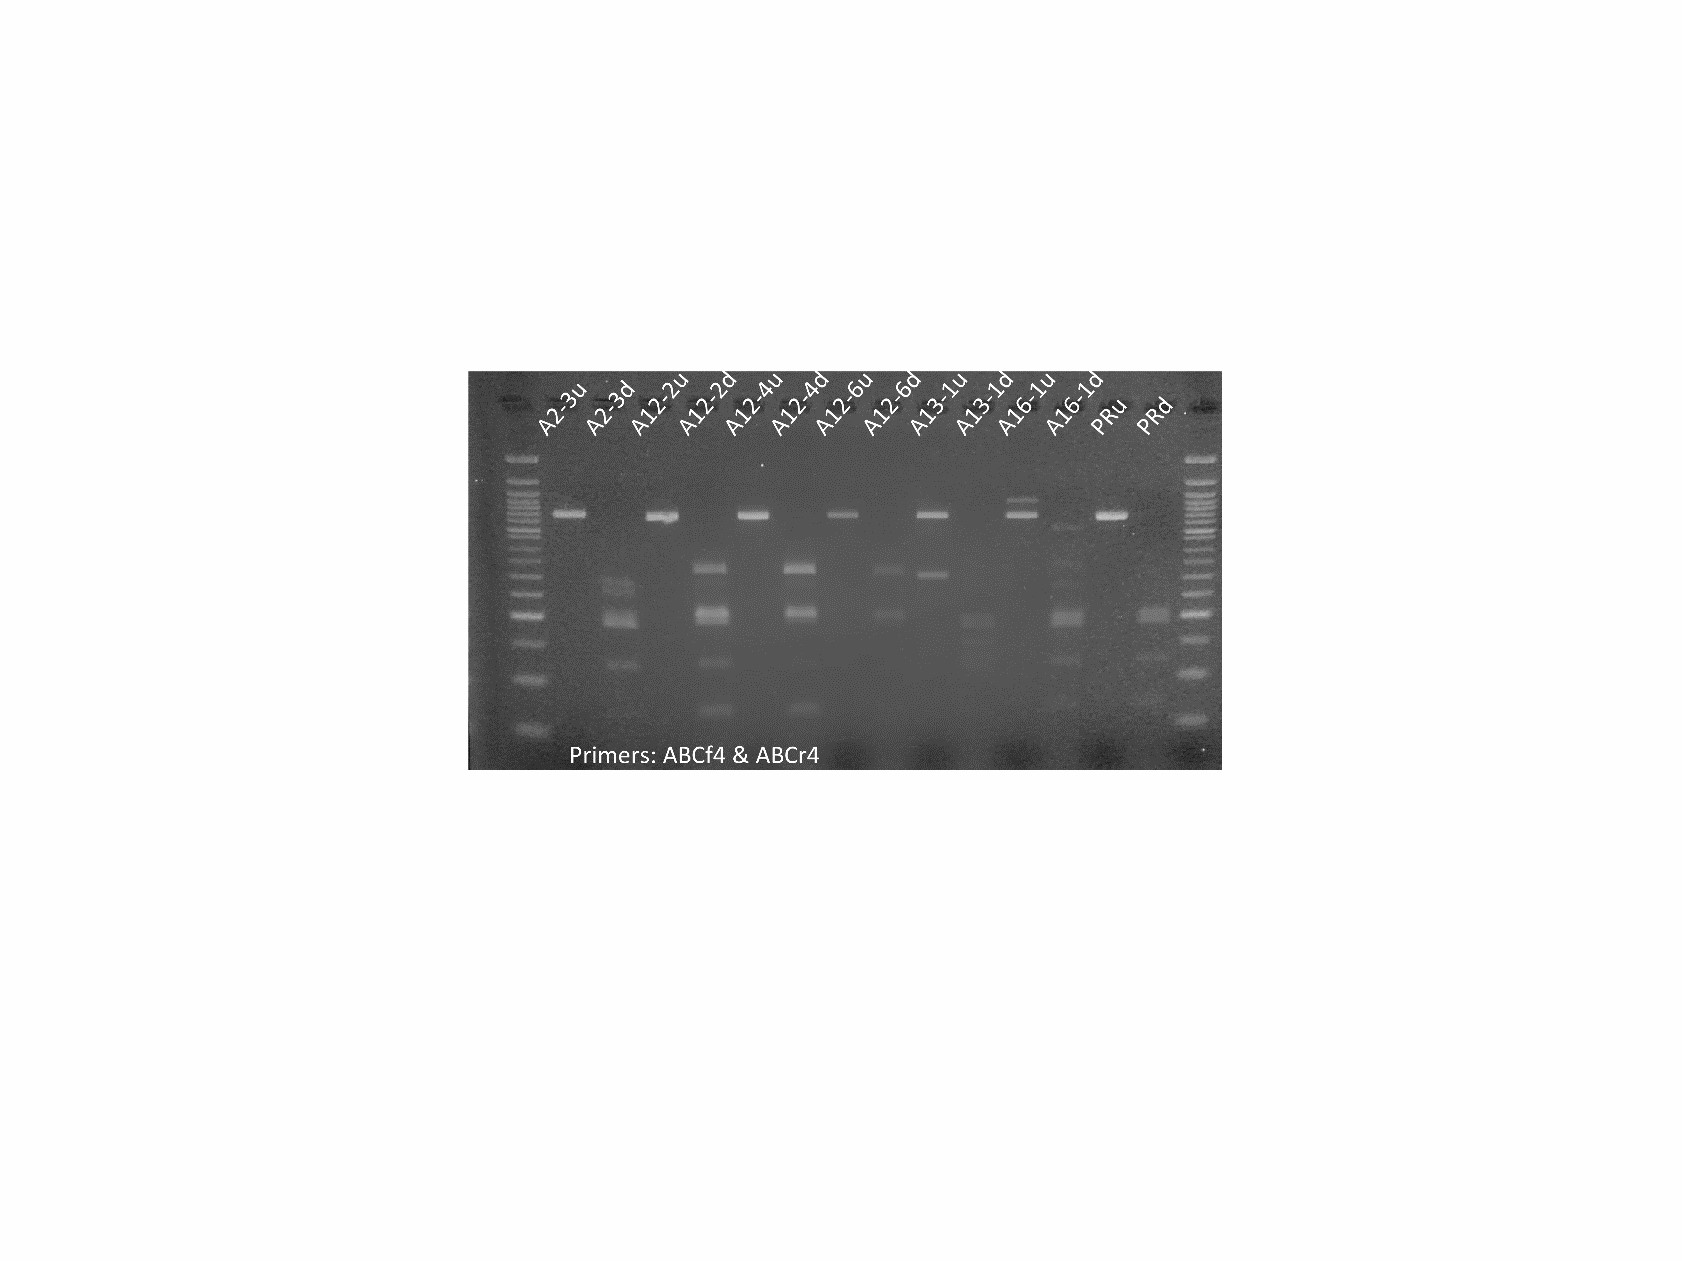

Figure 4. Molecular assays to determine editing in PIP and MYC plants. PCR products are amplified with primers flanking the targeted gene regions. For PIP lines (left panel), amplicons (lanes marked ‘u’) are treated with BfaI (lanes marked ‘d’) and the banding is compared to a Premier Russet control (PRu and PRd). All lines pictured above show differing banding patterns to that of the control in the digests, with lines A13-1 and A16-1 displaying indel mutations that are visible in the undigested lanes. For MYC lines (right panel), amplicons were treated with T7 Endonuclease 1 to assess the presence of edited alleles. The differences in banding between sample lanes and the control (PR) lane are interpreted as introduced mutations. Lines 1-3, 2-1, 3-2, and 11-2 are missing a ~200-bp band present in the control, lines 4-1, 5-1, 9-1, 11-2, and 13-1 appear to have an ~300-bp band that is not present in the control.
Because none of these lines were full knockouts (i.e. not all alleles had a mutation), we did not pursue this strategy. Instead, we focused on silenced plants described below.
5. Molecular characterization of silenced plants
First, we confirmed the presence of the DNA constructs in the genome of the regenerated plants by PCR. Results are shown in Figure 5.
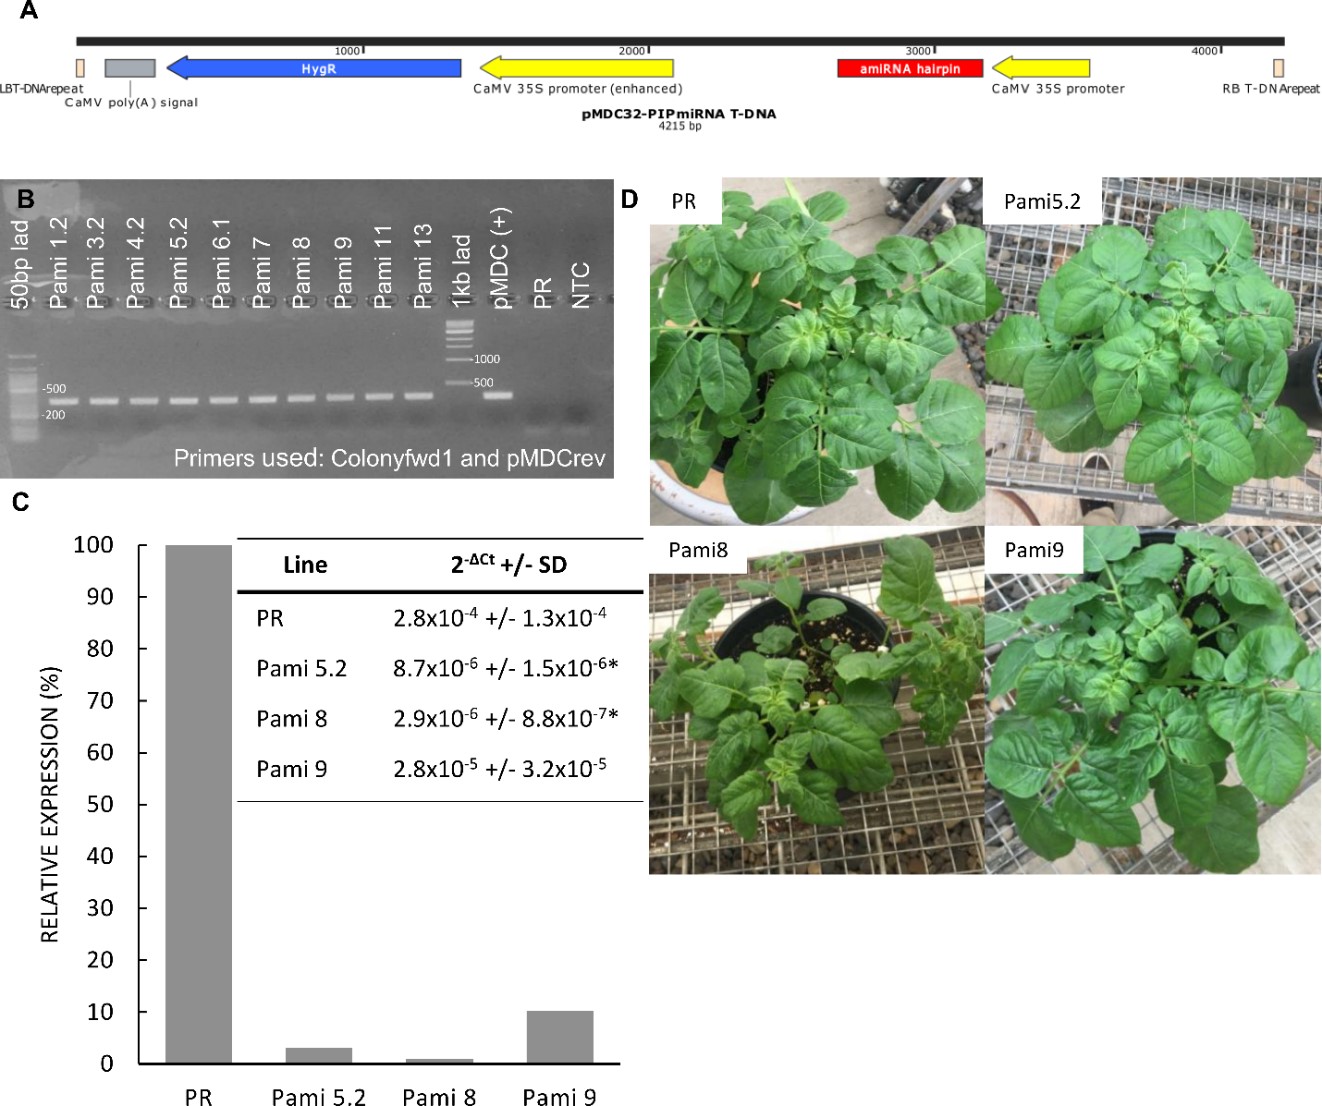
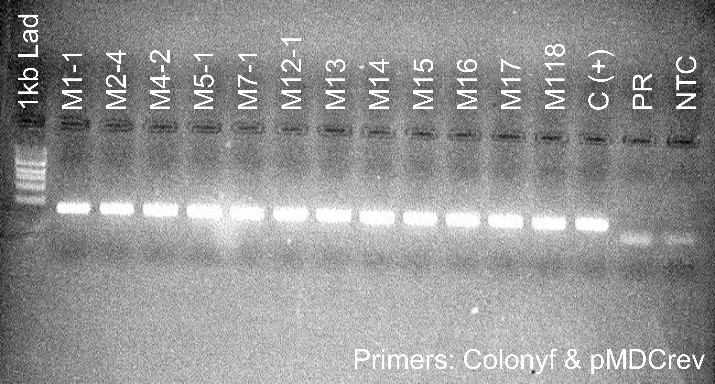
Figure 5. PCR genotyping of plants transformed with the silencing constructs. Samples labeled Pami and M are from plants transformed with the PIP and MYC silencing constructs, respectively. All plants contained the DNA construct as shown by the presence of a PCR amplicon at ~400 bp. Premier Russet (PR) was used as a negative control. pMDC(+) and C(+) are pure DNA plasmids used as positive controls. NTC is a no template control.
Second, we used qPCR to determine the level of expression of the PIP and MYC gene in the silencing lines. We found that PIP-silenced lines Pami5.2, Pami8, and Pami9 had lower PIP expression levels (<10%) than the control PR (Figure 5). We selected these lines for analysis of resistance to PVY (see greenhouse experiment below). Surprisingly, all the MYC lines had higher expression levels of MYC compared to the control (Table 1). Therefore, these lines were not studied further.
Table 1. Quantitative PCR results of putative StMYC2-silencing amiRNA lines.
| Line | Mean 2-∆Ct | S.D | Fold ChangeCompared to PR |
| PR | 3.20E-05 | 5.32E-06 | 1 |
| M1.1 | 0.00011 | 3.57E-05 | 3.52* |
| M2.4 | 0.00010 | 2.11E-05 | 31.08** |
| M4.2 | 0.00097 | 0.00041 | 30.36* |
| M5.1 | 5.25E-05 | 4.64E-05 | 1.64 |
| M7.1 | 0.00017 | 8.94E-05 | 5.21 |
| M12.1 | 0.00032 | 0.00011 | 10.00* |
| M14 | 0.00034 | 0.00015 | 10.44* |
| M17 | 0.00041 | 0.00029 | 12.64 |
| M18 | 0.00027 | 0.00019 | 8.34 |
6. PVY resistance test in the greenhouse
We grew PIP-overexpressing lines PIP-1, PIP-8, and PIP-14, MYC-overexpressing lines MYC-2.1, MYC-3.1, MYC-5.2, and PIP-silenced lines Pami5.2, Pami8, and Pami9 along with a Premier Russet control in a greenhouse to test resistance to PVY. During the time of the project, we were able to repeat the experiment with the overexpressor lines twice, while we did the experiment with PIP-silenced lines once. For each line, we had four treatments: (1) mock inoculation (healthy non-infected tobacco leaves were used as inoculum); (2) PVY-O (isolate Id); (3) PVY-NTN (isolate HR1); (4) PVY-N-Wilga (isolate N1). Each treatment was repeated six times (i.e. six plants per treatment per line). Plants were arranged in a split plot design.
- Premier Russet produces HR to PVY-O and PVY-N-Wilga
HR was clearly visible at 13 days post inoculation (dpi) as local lesions on leaves inoculated with PVY-O in Premier Russet (Figure 9), which is consistent with the known resistance of Premier Russet against PVY-O. No symptoms were observed when plants were inoculated with PVY-NTN, which is consistent with the lack of resistance of Premier Russet against this strain. Surprisingly, local lesions were also observed when leaves of Premier Russet were inoculated with PVY-N-Wilga, indicating that Premier Russet produces HR against this strain. Resistance of Premier Russet against PVY-N-Wilga has not been reported before, probably because it had never been tested. This result is important because it provides an additional source of resistance for breeding against the most dominant PVY strain in the Pacific Northwest.
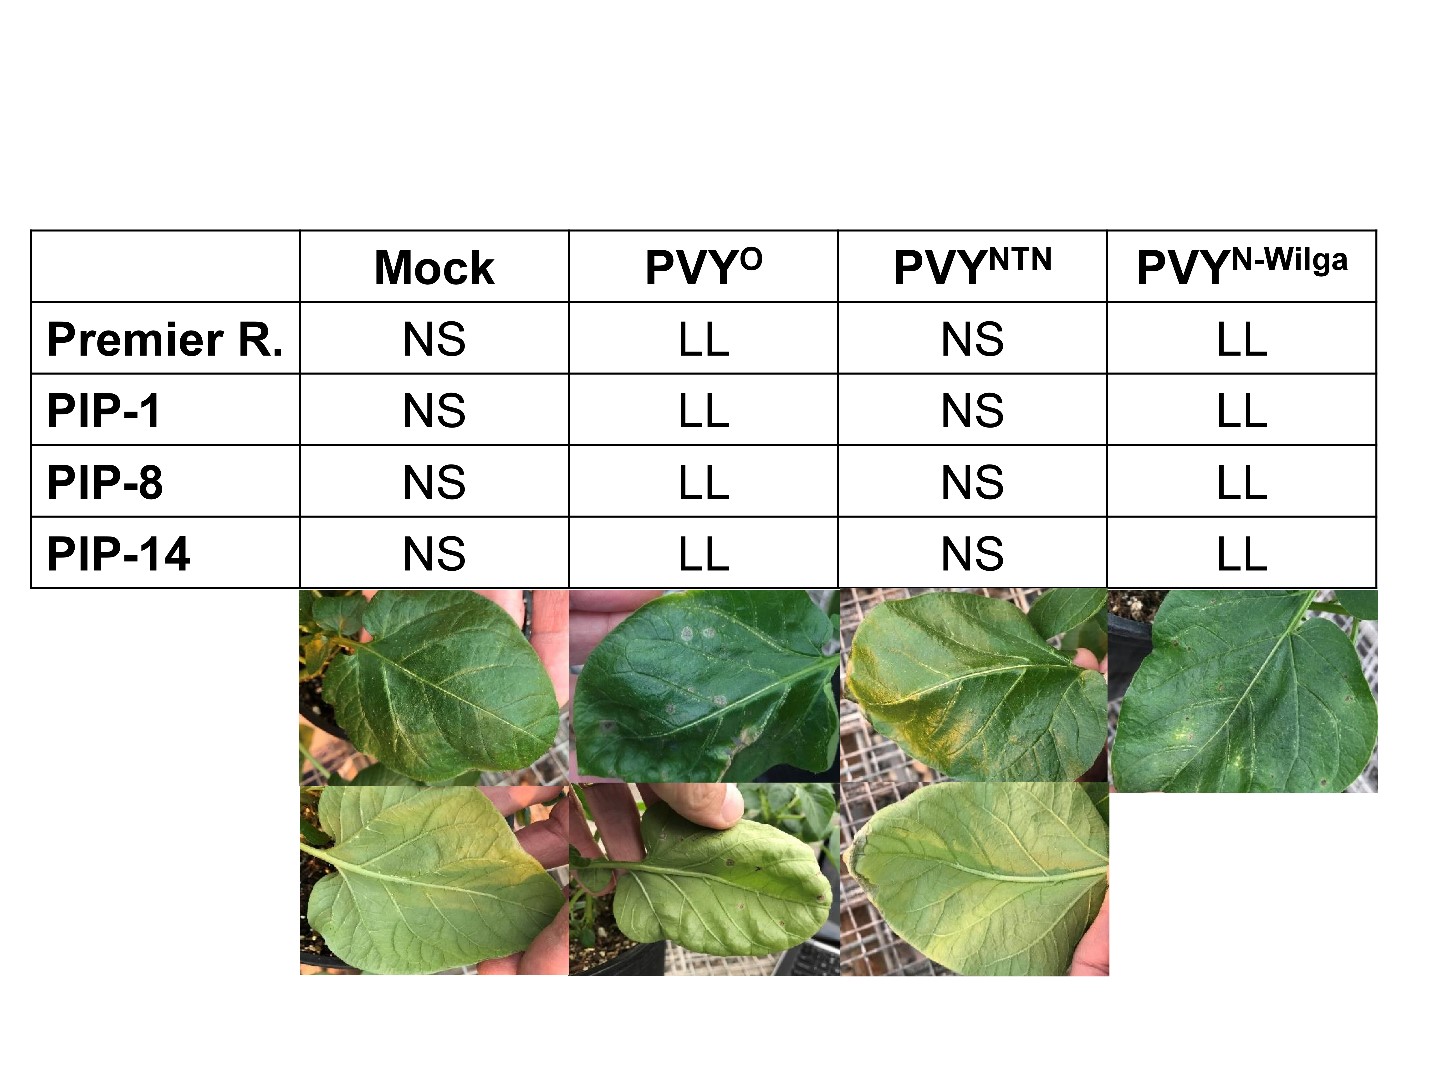
Figure 6. HR on leaves inoculated with PVY-O, PVY-NTN, PVY-N-Wilga, or a mock, 13 days post inoculation. Results are representative of six repetitions per treatment per line. Notice the local lesion (LL) on the upper and lower sides of leaves inoculated with PVY-O or PVY-N-Wilga, but no symptoms (NS) on the mock and PVY-NTN inoculated leaves.
2. Overexpression of PIP triggers the development of rugose mosaic in plants infected with PVY-NTN
In all experiments, we recorded:
- The number of plants that show local lesions and onset of local lesions on PVY-inoculated leaves (columns 3 and 4 in tables below). These lesions indicate that the plant produces HR;
- The number of plants that show symptoms and onset of symptoms on non-inoculated leaves (columns 5 and 6 in tables below);
- The number of plants where the virus was detected in foliage by PCR (column 7 in tables below);
- The number of plants where the virus was translocated from foliage to tubers as determined by PCR (column 8 in tables below).
Results are summarized in Tables 2 and 3 for the PIP-overexpressing lines (two independent experiments), and in Table 4 for the PIP-silencing line (one experiment).
As mentioned above, we observed local lesions in leaves inoculated with PVY-O and PVY-N-Wilga but not with PVY-NTN. We did not observe any major differences between PIP-overexpressing and PIP-silencing lines compared to the control, except a delay in the onset of HR in PIP-OE1 inoculated with PVY-N-Wilga (only in the first trial) (Table 2) and in Pami5.2 inoculated with PVY-O (Table 4).
With the exception of a few plants inoculated with PVY-N-Wilga and PVY-NTN displaying mild mosaic symptoms >56 days post inoculation in the first experiment (Table 2), we did not observe any typical PVY-related symptoms in Premier Russet inoculated with any PVY strains (Tables 2, 3, and 4). Interestingly, in all PIP overexpressor plants inoculated with PVY-NTN in the first experiment, and in at least half of the plants from lines PIP-1 and PIP-14 (the two lines that produce PIP in largest quantities) inoculated with PVY-NTN in the second experiment, we did observe clear rugose mosaic as early as 30 dpi (Tables 2 and 3, Figure 7). Symptoms worsened dramatically over the course of the experiment (Figure 10). These results are important for two reasons. First, they confirm our hypothesis that the PIP gene is involved in the plant/PVY interaction. Second, they open the possibility that the PIP peptide may be used in seed production fields to help identify and rogue infected plants that would not otherwise show any symptoms.
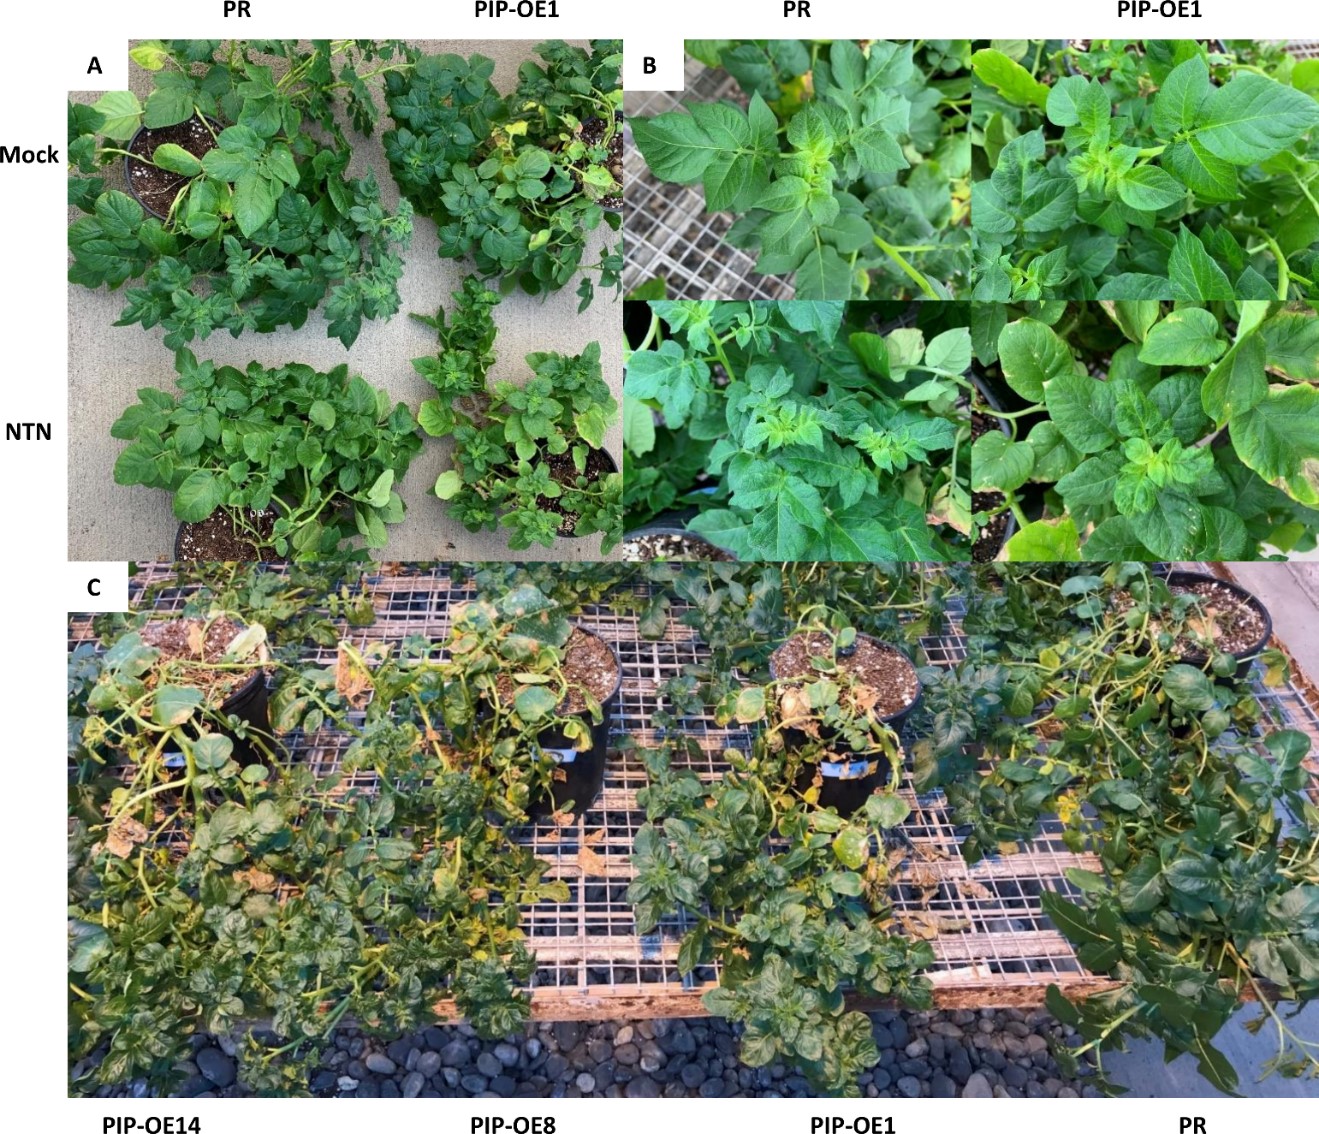
Figure 7. Symptoms of PIP-overexpressing lines compared to Premier Russet (PR) upon inoculation with PVYNTN. Symptoms including rugose mosaic, stunting, and chlorosis were clearly visible in PIP overexpressors infected with PVYNTN. A) Mock- and PVYNTN-inoculated PR and PIP-overexpressing line #1 (PIP-OE1) 44 days after inoculation. B) Close up images of canopy leaves of mock- and PVYNTN-inoculated PR and PIP-OE1 47 days after inoculation. C) Three independent PIP-overexpressing lines (PIP-OE14, PIP-OE8, and PIP-OE1) infected with PVYNTN showing clearly visible symptoms compared to a relatively asymptomatic PR control 69 days post inoculation.
The presence of local lesions in leaves inoculated with PVY-O or PVY-N-Wilga, which is indicative of HR, suggested that plants would be able to prevent the spread of the virus from point of inoculation to the rest of the plant, while plants inoculated with PVY-NTN would not because of the absence of HR. To verify this assumption, we used PCR to determine whether the virus spread systemically throughout the foliage and to tubers. As expected, we detected the virus in foliage of almost all plants inoculated with PVY-NTN and in most tubers (Tables 2, 3, and 4). On the contrary, a lower number of plants were systemically infected with PVY-O and PVY-N-Wilga compared to PVY-NTN. This was particularly obvious in the second experiment (Table 3), and, in the case of PVY-O, in the third experiment as well (Table 4). However, it should be noted that it was not always the case. Indeed, foliage of most plants inoculated with PVY-O and PVY-N-Wilga were fully infected in the first experiment (Table 2), although translocation to tubers was lower than with PVY-NTN-inoculated plants. Likewise, foliage of most plants inoculated with PVY-N-Wilga were fully infected in the third experiment (Table 4). These differences might be explained by variability in environmental conditions, i.e. HR is temperature-dependent (the resistance breaks at higher temperatures) and/or amount of virus present in the inoculum, i.e. the viral titer of the PVY inoculum affects the rate of PVY replication in host tissues. While we used a consistent ratio PVY-infected tobacco leaf/extraction buffer to prepare the inoculum, the titer of PVY was not determined. In addition, there was no significant differences in infection rates between overexpressing and silencing lines and Premier Russet, indicating that modulating PIP expression did not affect the ability of PVY to move systemically.
We harvested tubers from each plant and evaluated them for the presence of symptoms. We did not observe any major differences between inoculated and non-inoculated plants (Figure 8).
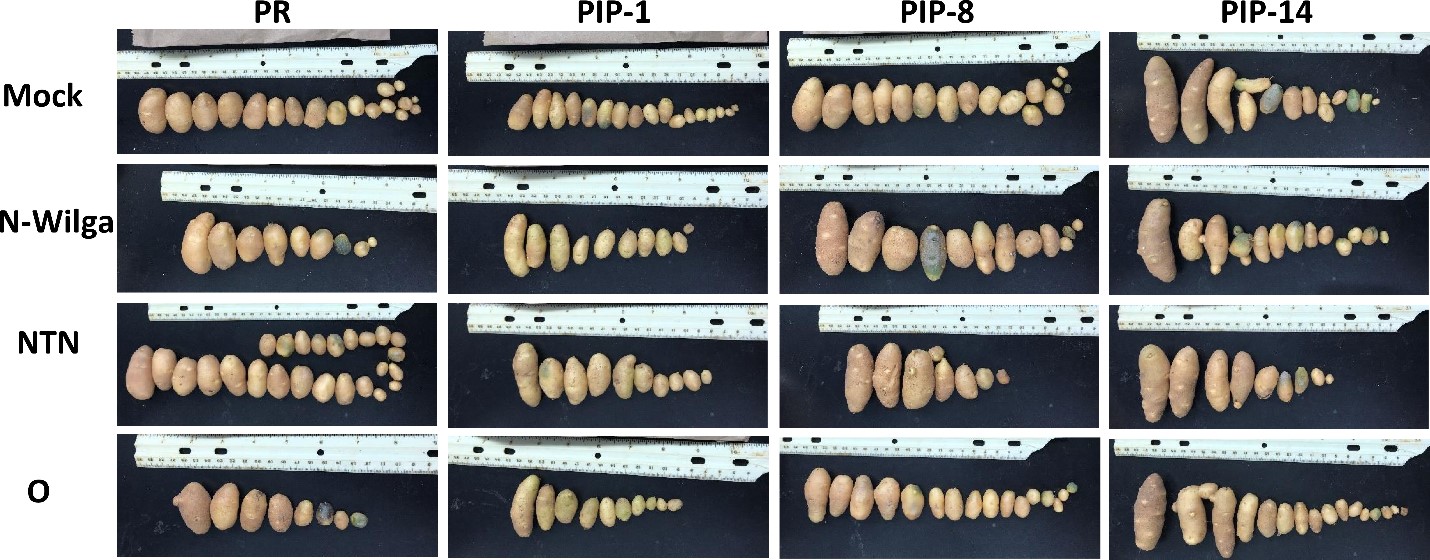
Figure 8. Tubers of Premier Russet (PR) and PIP overexpressors inoculated with PVY-O, PVY-NTN, or PVY-N-Wilga. Tubers were harvested three months after PVY-inoculation. Pictures are from one replicate and are representative of six replications.
Table 2. Rate and onset of hypersensitive response, symptom presentation, and PVY infection in Premier Russet and PIP-overexpressing lines in the first greenhouse experiment. Significant differences between overexpressors and PR are reported with asterisks according to a t-test for independent samples: * = p ≤ 0.05; ** = p ≤ 0.01. Treatment groups that showed no symptoms are indicated by ‘n.s’.
|
Potato Line |
PVY Treatment |
Number of plants displaying HRa |
Mean observed HR onset (dpi) +/- SEa |
Number of plants with systemic symptomsa |
Systemic symptom onset (dpi) +/- SEa |
Number of plants infected (in-season infection)b |
Number of plants infected (seedborne infection)c |
|
PR |
Mock |
0/6 |
n.s. |
0/6 |
n.s. |
0/6 |
0/6 |
|
|
PVYO |
5/6 |
15.6 +/- 2.1 |
0/6 |
n.s. |
6/6 |
3/6 |
|
|
PVYN-Wilga |
6/6 |
11.5 +/- 0.5 |
2/6 |
61.0 +/- 0 |
6/6 |
4/6 |
|
|
PVYNTN |
0/6 |
n.s. |
3/6 |
56.3 +/- 2.3 |
6/6 |
6/6 |
|
PIP-OE1 |
Mock |
0/6 |
n.s. |
0/6 |
n.s. |
0/6 |
0/6 |
|
|
PVYO |
5/6 |
17.6 +/- 1.4 |
0/6 |
n.s. |
4/6 |
1/6 |
|
|
PVYN-Wilga |
4/6 |
17.2 +/- 1.7** |
0/6 |
n.s.** |
6/6 |
1/5 |
|
|
PVYNTN |
0/6 |
n.s. |
6/6* |
30.5 +/- 2.0** |
6/6 |
5/6 |
|
PIP-OE8 |
Mock |
0/6 |
n.s. |
0/6 |
n.s. |
0/6 |
0/6 |
|
|
PVYO |
5/6 |
14.8 +/- 1.7 |
0/6 |
n.s. |
6/6 |
2/6 |
|
|
PVYN-Wilga |
6/6 |
13.2 +/- 1.2 |
3/6 |
71.3 +/- 2.3* |
6/6 |
2/6 |
|
|
PVYNTN |
0/6 |
n.s. |
6/6* |
32.0 +/- 1.9** |
6/6 |
5/6 |
|
PIP-OE14 |
Mock |
0/6 |
n.s. |
0/6 |
n.s. |
0/6 |
0/6 |
|
|
PVYO |
6/6 |
14.3 +/- 1.5 |
1/6 |
69.0 +/- 0* |
6/6 |
2/5 |
|
|
PVYN-Wilga |
6/6 |
11.0 +/- 0.6 |
2/6 |
61.0 +/- 0 |
6/6 |
4/6 |
|
|
PVYNTN |
0/6 |
n.s. |
6/6* |
30.5 +/- 2.0** |
6/6 |
6/6 |
|
|
|
|
|
|
|
|
|
a Plants were mechanically inoculated with PVY on foliage (i.e. in-season infection). HR was monitored on inoculated leaves. PVY symptoms evaluation and PVY detection were done on non-inoculated leaves.
b PVY detection was done by RT-PCR on foliage.
c Tubers were harvested, planted, and then tested for PVY infection by RT-PCR (i.e. seedborne infection) on foliage.
Table 3. Rate and onset of hypersensitive response, symptom presentation, and PVY infection in Premier Russet and PIP-overexpressing lines in the second greenhouse experiment. Significant differences between overexpressors and PR are reported with asterisks according to a t-test for independent samples: * = p ≤ 0.05; ** = p ≤ 0.01. Treatment groups that showed no symptoms are indicated by ‘n.s’.
|
Potato Line |
PVY Treatment |
Number of plants displaying HRa |
Mean observed HR onset (dpi) +/- SEa |
Number of plants with systemic symptomsa |
Systemic symptom onset (dpi) +/- SEa |
Number of plants infected (in-season Infection)b |
Number of plants infected (seedborne Infection)c |
|
PR |
Mock |
0/6 |
n.s. |
0/6 |
n.s. |
0/6 |
0/6 |
|
|
PVYO |
4/6 |
19.2 +/- 2.7 |
0/6 |
n.s. |
0/6 |
0/6 |
|
|
PVYN-Wilga |
5/6 |
12.6 +/- 0.4 |
0/6 |
n.s. |
1/6 |
0/6 |
|
|
PVYNTN |
0/6 |
n.s. |
0/6 |
n.s. |
2/6 |
2/5 |
|
PIP-OE1 |
Mock |
0/6 |
n.s. |
0/6 |
n.s. |
0/6 |
0/6 |
|
|
PVYO |
6/6 |
20.5 +/- 1.5 |
0/6 |
n.s. |
0/6 |
0/6 |
|
|
PVYN-Wilga |
6/6 |
17.2 +/- 2.2 |
0/6 |
n.s. |
1/6 |
0/5 |
|
|
PVYNTN |
0/6 |
n.s. |
3/6* |
48.0 +/- 0** |
5/6* |
5/6 |
|
PIP-OE8 |
Mock |
0/6 |
n.s. |
0/6 |
n.s. |
0/6 |
0/6 |
|
|
PVYO |
6/6 |
19.0 +/- 1.9 |
0/6 |
n.s. |
0/6 |
0/6 |
|
|
PVYN-Wilga |
6/6 |
15.5 +/- 2.5 |
0/6 |
n.s. |
0/6 |
0/6 |
|
|
PVYNTN |
0/6 |
n.s. |
0/6 |
n.s. |
6/6** |
6/6* |
|
PIP-OE14 |
Mock |
0/6 |
n.s. |
0/6 |
n.s. |
0/6 |
0/6 |
|
|
PVYO |
4/6 |
19.7 +/- 2.2 |
0/6 |
n.s. |
1/6 |
0/5 |
|
|
PVYN-Wilga |
5/6 |
11.4 +/- 0.4 |
0/6 |
n.s. |
2/6 |
1/5 |
|
|
PVYNTN |
0/6 |
n.s. |
5/6** |
35.8 +/- 6.4** |
5/6* |
3/6 |
a Plants were mechanically inoculated with PVY on foliage (i.e. in-season infection). HR was monitored on inoculated leaves. PVY symptoms evaluation and PVY detection were done on non-inoculated leaves.
b PVY detection was done by RT-PCR on foliage.
c Tubers were harvested from in-season infected plants, planted, and then tested for PVY infection by RT-PCR (i.e. seedborne infection) on foliage.
Table 4. Rate and onset of hypersensitive response, symptom presentation, and PVY infection in Premier Russet and PIP artificial microRNA (amiRNA) lines in a greenhouse experiment. Significant differences between amiRNA lines and PR are reported with asterisks according to a t-test for independent samples: * = p ≤ 0.05; ** = p ≤ 0.01. Treatment groups that showed no symptoms are indicated by ‘n.s’.
|
Potato Line |
PVY Treatment |
Number of plants displaying HRa |
Mean observed HR onset (dpi) +/- SEa |
Number of plants with systemic symptomsa |
Systemic symptom onset (dpi) +/- SEa |
Number of plants infectedb |
|
PR |
Mock |
0/6 |
n.s. |
0/6 |
n.s. |
0/6 |
|
|
PVYO |
4/6 |
9.5 +/- 1.4 |
0/6 |
n.s. |
0/6 |
|
|
PVYN-Wilga |
6/6 |
11.0 +/- 2.2 |
0/6 |
n.s. |
5/6 |
|
|
PVYNTN |
0/6 |
n.s. |
0/6 |
n.s. |
6/6 |
|
Pami 5.2 |
Mock |
0/6 |
n.s. |
0/6 |
n.s. |
0/6 |
|
|
PVYO |
4/6 |
14.0 +/- 1.1* |
0/6 |
n.s. |
0/6 |
|
|
PVYN-Wilga |
5/6 |
9.8 +/- 2.8 |
0/6 |
n.s. |
4/6 |
|
|
PVYNTN |
0/6 |
n.s. |
0/6 |
n.s. |
5/6 |
|
Pami 8 |
Mock |
0/6 |
n.s. |
0/6 |
n.s. |
0/6 |
|
|
PVYO |
4/6 |
15.0 +/- 2.9 |
0/6 |
n.s. |
0/6 |
|
|
PVYN-Wilga |
4/6 |
16.2 +/- 3.3 |
0/6 |
n.s. |
6/6 |
|
|
PVYNTN |
0/6 |
n.s. |
0/6 |
n.s. |
6/6 |
|
Pami 9 |
Mock |
0/6 |
n.s. |
0/6 |
n.s. |
0/6 |
|
|
PVYO |
5/6 |
13.6 +/- 3.2 |
0/6 |
n.s. |
0/6 |
|
|
PVYN-Wilga |
5/6 |
8.0 +/- 1.0 |
0/6 |
n.s. |
4/6 |
|
|
PVYNTN |
0/6 |
n.s. |
0/6 |
n.s. |
6/6 |
a Plants were mechanically inoculated with PVY on foliage (i.e. in-season infection). HR was monitored on inoculated leaves. PVY symptoms evaluation and PVY detection were done on non-inoculated leaves.
b PVY detection was done by RT-PCR on foliage.
3. Overexpression of MYC decreases the rate of infection with PVY-O and PVY-N-Wilga
The experiment with plants that overexpress MYC was done the same way than for PIP plants described above and was repeated twice (Tables 5 and 6). As illustrated above, HR was “leaky”. Indeed, most Premier Russet and MYC-overexpressing plants were systemically infected with all PVY strains. However, there was a notable exception. The MYC-overexpressing lines MYC-OE3.1 showed a decreased infection rate when inoculated with PVY-O or PVY-N-Wilga (there was no difference between line MYC-OE3.1 and control Premier Russet when plants were inoculated with PVY-NTN) (Tables 5 and 6). This line is the one that produces the most of the gene. Although plants use a plethora of molecular and biochemical mechanisms to prevent the spread of viruses (and other pathogens), callose deposition at plasmodesmata (i.e. pores that connect cell to cell) is known to prevent cell-to-cell movement. Therefore, we tested whether line MYC-OE3.1 accumulated more callose than Premier Russet control. In agreement with our hypothesis, MYC-OE3.1 plants had a higher number of callose spots than the control plants (Figure 9). This result indicates that the MYC gene is involved in the control of plant defense to PVY.
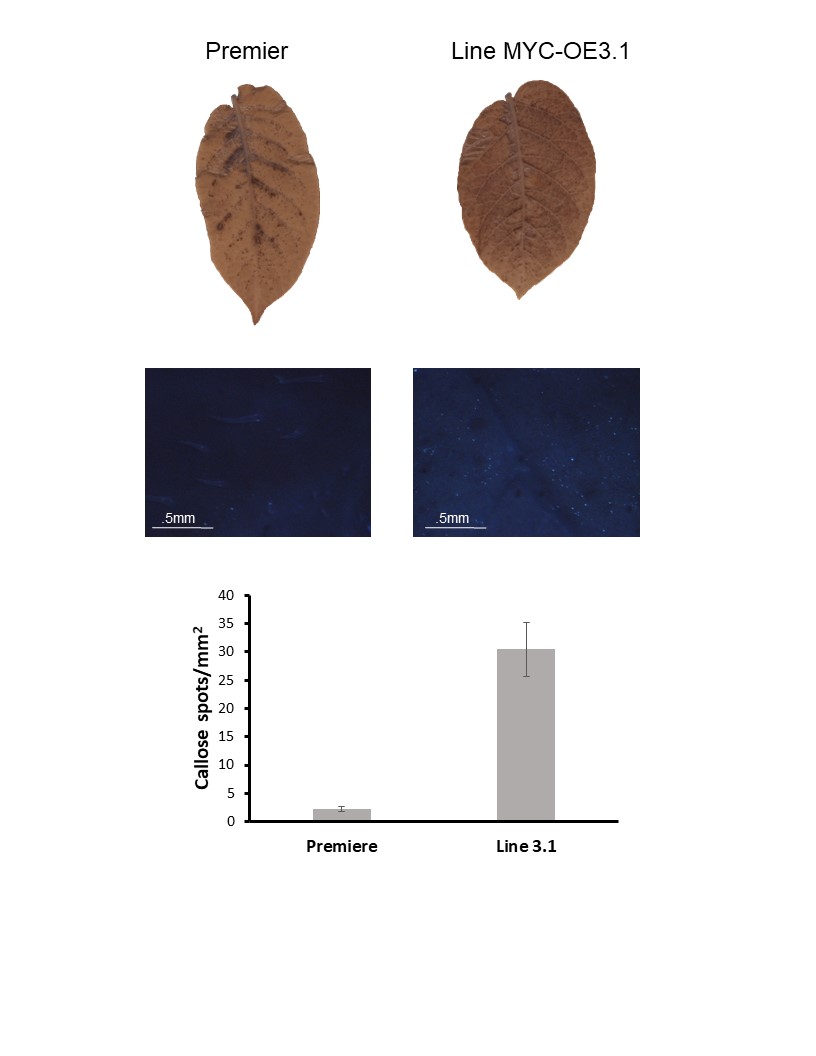
Figure 9. Callose deposition in leaves of Premier Russet and MYC-overexpressing line MYC-OE3.1.
Table 5. Rate and onset of hypersensitive response, symptom presentation, and PVY infection in Premier Russet and MYC-overexpressing lines in the first greenhouse experiment (November 2018). Significant differences between overexpressors and PR are reported with asterisks according to a t-test for independent samples: * = p ≤ 0.05; ** = p ≤ 0.01. Treatment groups that showed no symptoms are indicated by ‘n.s’.
|
Potato Line |
PVY Treatment |
Number of plants displaying HRa |
Mean observed HR onset (dpi) +/- SEa |
Number of plants with systemic symptomsa |
Systemic symptom onset (dpi) +/- SEa |
Number of plants infected (in-season infection)b |
Number of plants infected (seedborne infection)c |
|
PR |
Mock |
0/6 |
n.s. |
0/6 |
n.s. |
0/6 |
0/6 |
|
|
PVYO |
1/6 |
14 +/- 0 |
0/6 |
n.s. |
5/6 |
2/6 |
|
|
PVYN-Wilga |
5/6 |
13 +/- 2.1 |
0/6 |
n.s. |
6/6 |
4/6 |
|
|
PVYNTN |
0/6 |
n.s. |
0/6 |
n.s. |
6/6 |
6/6 |
|
MYC-OE2 |
Mock |
0/6 |
n.s. |
0/6 |
n.s. |
0/6 |
0/6 |
|
|
PVYO |
3/6 |
17.3 +/- 3.7 |
0/6 |
n.s. |
3/6 |
2/6 |
|
|
PVYN-Wilga |
4/6 |
13.8 +/- 2.6 |
0/6 |
n.s. |
5/6 |
4/5 |
|
|
PVYNTN |
0/6 |
n.s. |
0/6 |
n.s. |
6/6 |
5/5 |
|
MYC-OE3.1 |
Mock |
0/6 |
n.s. |
0/6 |
n.s. |
0/6 |
0/6 |
|
|
PVYO |
1/6 |
21 +/- 0 |
0/6 |
n.s. |
0/6** |
0/6 |
|
|
PVYN-Wilga |
4/6 |
12 +/- 1.2 |
0/6 |
n.s. |
1/6** |
1/6 |
|
|
PVYNTN |
0/6 |
n.s. |
0/6 |
n.s. |
6/6 |
6/6 |
|
MYC-OE5.2 |
Mock |
0/6 |
n.s. |
0/6 |
n.s. |
0/6 |
0/6 |
|
|
PVYO |
3/6 |
14 +/- 0 |
0/6 |
n.s. |
3/6 |
2/6 |
|
|
PVYN-Wilga |
6/6 |
11.3 +/- 0.8 |
0/6 |
n.s. |
6/6 |
2/6 |
|
|
PVYNTN |
0/6 |
n.s. |
0/6 |
n.s. |
6/6 |
3/4 |
|
|
|
|
|
|
|
|
|
a Plants were mechanically inoculated with PVY on foliage (i.e. in-season infection). HR was monitored on inoculated leaves. PVY symptoms evaluation and PVY detection were done on non-inoculated leaves.
b PVY detection was done by RT-PCR on foliage.
c Tubers were harvested, planted, and then tested for PVY infection by RT-PCR (i.e. seedborne infection) on foliage.
Table 6. Rate and onset of hypersensitive response, symptom presentation, and PVY infection in Premier Russet and MYC-overexpressing lines in the second greenhouse experiment (Fall 2019). Significant differences between overexpressors and PR are reported with asterisks according to a t-test for independent samples: * = p ≤ 0.05; ** = p ≤ 0.01. Treatment groups that showed no symptoms are indicated by ‘n.s’.
|
Potato Line |
PVY Treatment |
Number of plants displaying HRa |
Mean observed HR onset (dpi) +/- SEa |
Number of plants with systemic symptomsa |
Systemic symptom onset (dpi) +/- SEa |
Number of plants infected (in-season infection)b |
Number of plants infected (seedborne infection)c |
|
PR |
Mock |
0/6 |
n.d. |
0/6 |
n.s. |
0/6 |
n.d. |
|
|
PVYO |
2/6 |
n.d. |
0/6 |
n.s. |
6/6 |
n.d. |
|
|
PVYN-Wilga |
4/6 |
n.d. |
0/6 |
n.s. |
6/6 |
n.d. |
|
|
PVYNTN |
0/6 |
n.d. |
0/6 |
n.s. |
6/6 |
n.d. |
|
MYC-OE2 |
Mock |
0/6 |
n.d. |
0/6 |
n.s. |
0/6 |
n.d. |
|
|
PVYO |
0/6 |
n.d. |
0/6 |
n.s. |
5/6 |
n.d. |
|
|
PVYN-Wilga |
0/6 |
n.d. |
0/6 |
n.s. |
5/6 |
n.d. |
|
|
PVYNTN |
0/6 |
n.d. |
0/6 |
n.s. |
6/6 |
n.d. |
|
MYC-OE3.1 |
Mock |
0/6 |
n.d. |
0/6 |
n.s. |
0/6 |
n.d. |
|
|
PVYO |
4/6 |
n.d. |
0/6 |
n.s. |
1/6 |
n.d. |
|
|
PVYN-Wilga |
0/6 |
n.d. |
0/6 |
n.s. |
4/6 |
n.d. |
|
|
PVYNTN |
0/6 |
n.d. |
0/6 |
n.s. |
5/6 |
n.d. |
|
MYC-OE5.2 |
Mock |
0/6 |
n.d. |
0/6 |
n.s. |
0/6 |
n.d. |
|
|
PVYO |
2/6 |
n.d. |
0/6 |
n.s. |
5/6 |
n.d. |
|
|
PVYN-Wilga |
4/6 |
n.d. |
0/6 |
n.s. |
5/6 |
n.d. |
|
|
PVYNTN |
0/6 |
n.d. |
0/6 |
n.s. |
6/6 |
n.d. |
|
|
|
|
|
|
|
|
|
a Plants were mechanically inoculated with PVY on foliage (i.e. in-season infection). HR was monitored on inoculated leaves. PVY symptoms evaluation and PVY detection were done on non-inoculated leaves. n.d., Not Determined.
b PVY detection was done by RT-PCR on foliage.
c Not determined
Research outcomes
Education and Outreach
Participation summary:
Presentations:
Combest M, Goyer A (2019) Exploring Genes with the Potential to Help Out with the PVY Problem. 46th Annual Hermiston Farm Fair Seminars & Tradeshow. 4 Dec. Hermiston, OR. Oral Presentation.
Combest MM, Goyer A (2019) Characterization of a putative PAMP-induced secreted peptide in the hypersensitive response of potato to PVY. Annual Meeting of the American Society of Plant Biologists. San Jose, CA. 3-7 August. Poster Presentation.
Combest MM, Goyer A (2019) StbHLH94: A MYC2 family transcription factor associated with differential susceptibility to PVY in Potato. Annual Meeting of the American Society of Plant Biologists. San Jose, CA. 3-7 August. Poster Presentation.
Goyer A, Combest MM (2019) Characterization of a putative PAMP-induced secreted peptide in the hypersensitive response of potato to PVY. 103rd Annual Meeting of the Potato Association of America. Winnipeg, Canada. 28 July – 1 August. Oral Presentation.
Peer-reviewed Extension video:
Combest MM, Goyer A (2019) Tackling Potato Virus Y, a persistent problem in potato production. OSU Extension Catalog. EM 9257.
https://catalog.extension.oregonstate.edu/em9257
Peer-reviewed publications:
Max M. Combest, Moroz N, Tanaka K, Rogan C, Thura L, Anderson J, Rakotondrafara AM, and Goyer A. StPIP1, a predicted PAMP-induced peptide in potato, elicits plant defenses and is associated with disease symptom severity in a compatible interaction with potato virus Y. Submitted, under review.
Extension publications:
Combest MM, Goyer A. Could a small peptide help potato seed growers with potato virus Y? Potato Country. In preparation.