Final report for GW19-196
Project Information
Rangelands (e.g., grasslands, savanna, shrubland and woodland ecosystems) constitute ~50% of the Earth’s land surface and support the majority of the world’s livestock production. Rangelands also play integral roles in the global carbon, water, and nitrogen cycles and human health due to their extensive coverage. Many rangelands have undergone a shift from herbaceous plants to shrubs resulting in a decline of valuable livestock forage (e.g., perennial grasses). This phenomenon, known as “woody plant encroachment” or “shrub encroachment”, represents ecosystem degradation in arid and semi-arid regions and is typically accompanied by increases in bare soil and soil erosion. Efforts to limit shrub encroachment into rangelands include a variety of reactive brush management practices that remove or reduce the woody species via prescribed fire, mechanical, and/or herbicidal treatments. However, results of such actions are often short-lived and are seldom cost-effective or sustainable.
Instead of a reactive approach, preventative actions might be more ecologically sound and cost-effective for limiting shrub encroachment. I propose to develop SEEDS (Shrub Encroachment Early Detection System), a user-friendly tool (e.g., online application) that can be used as a first-step to promote preventative and proactive alternatives to reactive brush management. SEEDS will combine data from the literature and active research projects designed to understand how shrubs establish in grasslands with remote sensing and geospatial landscape-scale data sets to predict areas at risk for shrub encroachment. The goals for SEEDS are to (1) alert land managers, livestock producers, and citizen scientists to critical times and locations for inventory and monitoring for shrub invasion, (2) identify windows of opportunity for early intervention/brush management, and (3) assist in prioritization of shrub encroachment mitigation efforts at the scale of allotments/pastures.
The goal is to develop a SEEDS (Shrub Encroachment Early Detection System) framework for federal, state, and county land managers/rangeland specialists, ranchers, and the general public as a proactive and preventative measure to woody plant encroachment (WPE) to maximize the effectiveness of brush management strategies. Specific objectives are to:
(1) Compile published research on WPE to identify the primary drivers of and controls over woody plant establishment.
(2) Utilize existing remote sensing products and geospatial data (e.g., ecological site, soil type, depth to restrictive layer, precipitation, temperature, elevation, slope, etc.) to model WPE risk.
(3) Develop the SEEDS application.
- With model products from (2), perform statistical analyses and validation of spatially explicit WPE risk.
- Create functions that enable spatially explicit user input (e.g., land use, stocking rates, management unit boundaries, etc.) within a GIS (Geographic Information System).
- Link Objectives 1-3 within the SEEDS framework to predict when, where, and under what conditions a given pasture/allotment will be at risk for WPE.
(4) Test and refine the SEEDS algorithms to maximize their accuracy for predicting WPE risk.
Areas identified as being at high risk for WPE could then be subject to monitoring and plans made for preventative measures (e.g., prescribed fire) to be used before encroachment progresses to the point where more expensive, less effective approaches are necessitated.
Abbreviations used in this report are listed alphabetically in Appendix A
A comprehensive timeline is presented in a Gantt Chart. An Advisory Board meeting in Summer 2019 will consolidate, finalize, and develop SEEDS partnerships with federal and private land managers. The woody plant encroachment literature review will begin in Summer 2019 and run through Fall 2019 (Objective 1 Methods). DroughtView modifications, geospatial modeling, and user function construction for SEEDS (Objectives 2&3 Methods) will run from Fall 2019 through Fall 2020. As finalization of SEEDS infrastructure and design approaches, testing and refinement (Objective 4 Methods) will commence Summer 2020 through Winter 2020. Spring 2021 will be focused on incorporation of SEEDS into existing rangeland monitoring protocols, workshop material development and distribution, and scientific article drafting and submissions.
Cooperators
- - Technical Advisor (Researcher)
- - Technical Advisor (Educator and Researcher)
- - Technical Advisor
- - Technical Advisor (Educator and Researcher)
Research
Objective 1: Compile published research on Woody Plant Encroachment (WPE) to identify the primary drivers of and controls over WPE.
Published research was compiled using Clarivate Analytics Web of Science and Google Scholar. Search keywords included combinations of: “brush”, “shrub”, “manag*”, “encroach*”, “woody”, “control”, and “ecol*”. Information and variables pertaining to setting (vegetation, soil, climate, topography), management history (AUMs, grazing rotation), focal species (native status, demographics, encroachment history), and brush management undertakings (type, timing, success) were examined. Articles were stored and organized in a Mendeley Reference Manager database. A total of ~1400 articles were compiled. The leading biophysical drivers of and constraints to woody cover potential were hypothesized to be climate (seasonal and annual mean precipitation/temperature), soils (clay content and depth to restrictive layer), topography (slope inclination, slope aspect, elevation), and proximity to washes/arroyos. In addition to literature searches, multiple discussions during field days and tours (see Educational & Outreach Activities) with rancher/producers regarding their experiences with shrub encroachment were also utilized. Interesting patterns emerged from these discussions on shrub cover/recruitment differences between ecological sites, soil conditions, wet/drought years, and grazing management history and served to reinforce/refine findings from literature searches.
Objective 2: Utilize existing remote sensing products and geospatial data (e.g., ecological site, soil type, depth to restrictive layer, precipitation, temperature, elevation, slope, etc.) to model WPE risk.
Geospatial Data Compiling and Pre-processing
A total of 31 remote sensing and geospatial products relating to biophysical attributes have been compiled, georeferenced, and tied to the ~21,000-hectare Santa Rita Experimental Range (SRER) using ESRI ArcGIS Pro (version 2.4.1). The compiled biophysical variables include those related to climate (seasonal temperature and precipitation), soils (maximum clay content; depth to maximum clay content), topography (elevation; slope aspect/inclination), and hydrology (distance to channel/water). A select subset of model variables are presented in Figs. 1-3. All variables were scaled to 30 meters to match Landsat 8 resolution for use in final SEEDS model development as independent variables.
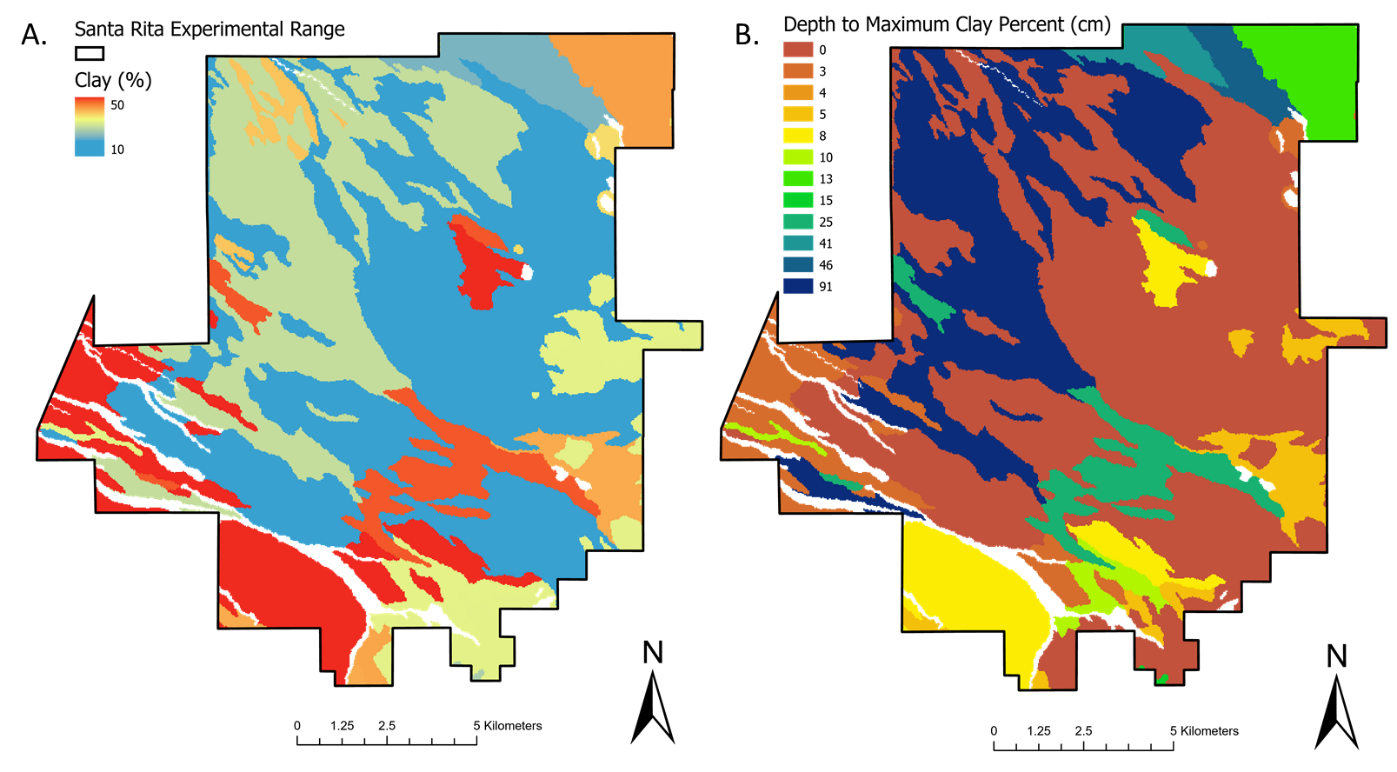
Figure 1. Maximum clay percentage over 1-m depth (A) and depth to maximum clay percentage (B) rasters (30-m resolution) developed using the NRCS gSSURGO database for the Santa Rita Experimental Range. Areas in white are sites lacking clay (e.g., sandy wash beds and rock outcrops).
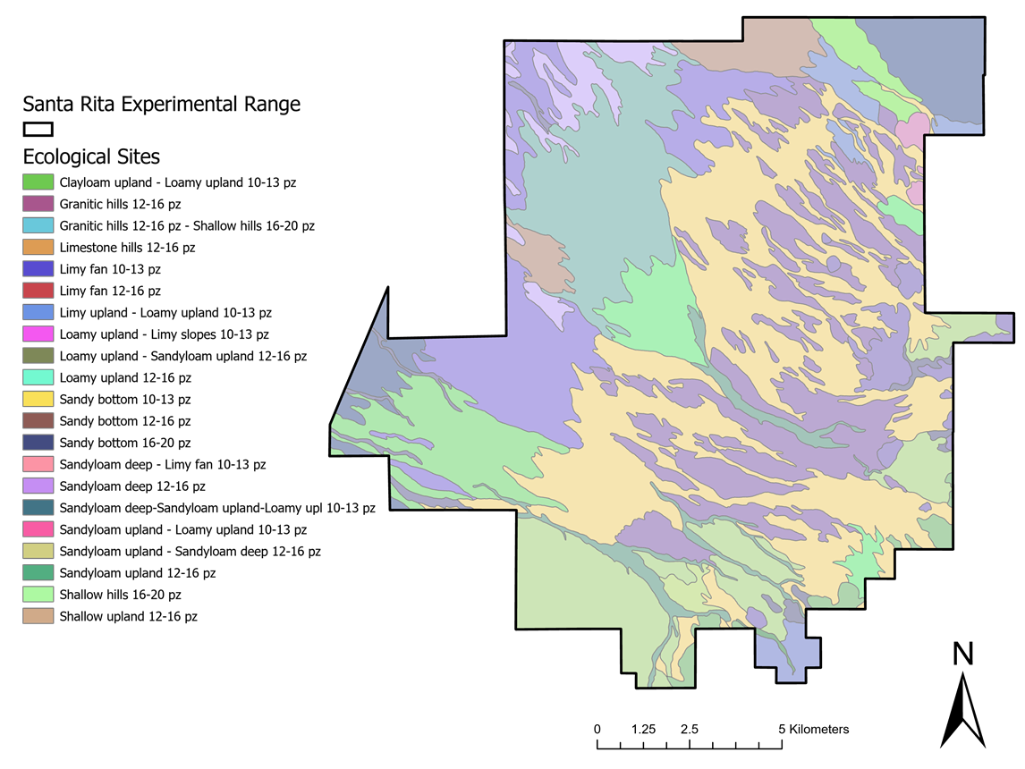
Figure 2. USDA NRCS Ecological sites on the Santa Rita Experimental Range (30-m raster; based on Breckenfeld and Robinett 1996).
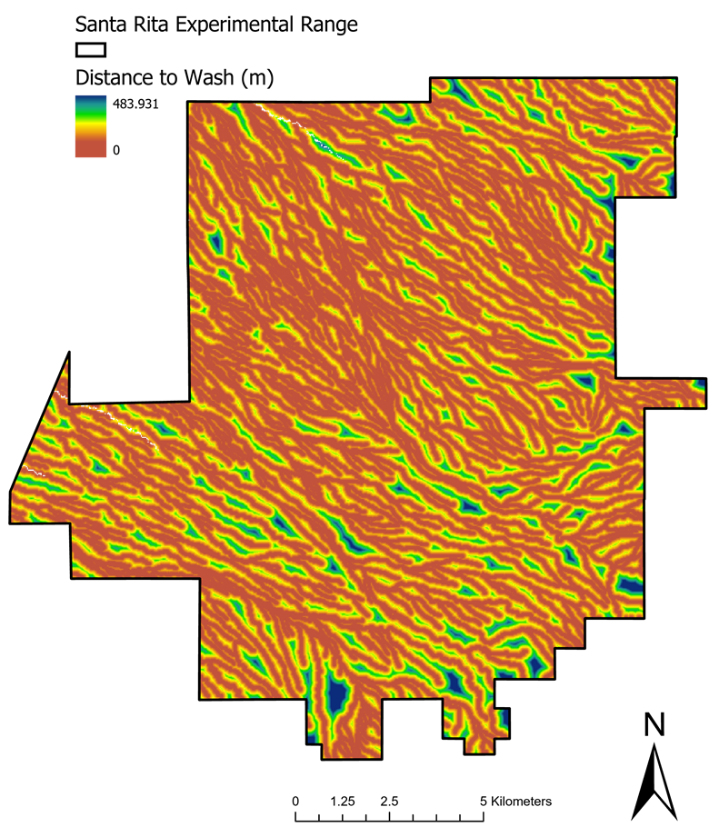
Figure 3. Distance from wash/arroyo for the Santa Rita Experimental Range calculated using the USGS National Hydrography Dataset. Calculations were based on Euclidean Distance and rasterized to 30-m scale.
Shrub Cover Imagery Classification
Shrub cover at a 30-m resolution was quantified and used to develop relationships with Landsat 8 Vegetation Indices (VIs). By relating shrub cover to Landsat 8 VIs, spatial/temporal changes in shrub cover could be quantified using historical Landsat imagery. These Landsat-based woody cover estimates were then used as the dependent variable in the SEEDS model. An Iso Cluster Unsupervised Classification (Memarsadeghi et al., 2007; Schowengerdt, 2007) was completed using USDA NAIP (National Agricultural Imagery Program) from July 2, 2015 with a spatial resolution of 1-m. The classification was performed using red, green, blue, and near infrared bands and a Canopy Height Model for shrub/woody plant detection. The classified image was evaluated using the true color NAIP imagery to detect the woody cover classes; remaining classes represented non-woody land cover. A majority filter was applied to the classified image to remove small and isolated pixels with a sensitivity of four neighboring cells. An accuracy assessment of the classified image was performed using independent orthorectified high-resolution (10-cm) imagery obtained from the National Ecological Observation Network (NEON) Airborne Observation Platform (AOP) August 20-28, 2017 mission. A total of 200 points (100 per woody and 100 per non-woody classes) were used for binomial classification accuracy assessment following McCoy (2005).
Landsat 8 Vegetation Indices and Shrub Cover Modeling
Shrub cover (%) was calculated using the classified 1-m NAIP image with a moving window (30 X 30 pixel) average to achieve a 30-m resolution and match the spatial resolution of the Landsat 8 imagery. Shrub cover on NAIP-derived 30-m raster was binned in 10% increments. The relationship between shrub cover and Landsat 8 VIs was then used to identify the biophysical variables most important for explaining the variation in site-specific woody cover. The VIs chosen for analysis were MSAVI (Modified Soil-Adjusted Vegetation Index) and NDVI (Normalized Difference Vegetation Index). The NAIP-derived % woody cover and each VI product were limited to the SRER boundary and sub-sampled (20 points per class for a total of 140 points) using an equally stratified random design. Point samples were split (i.e., 80% for training the models, 20% for testing and assessing model accuracy) in a cross-validation procedure. The relationship (e.g., linear, quadratic, polynomial, etc.) between NAIP-derived woody cover and Landsat 8 VI were explored for the best model fit. The resulting best-fit relationship was then used to quantify woody cover across the SRER.
Objective 3: Develop the SEEDS application.
a) With products from (2), perform statistical analyses and validation of spatially explicit WPE risk.
Landsat 8-based woody cover estimates (dependent variable) and the 31 biophysical rasters (independent variables) were sampled (n = 237,659 pixels) over the entire SRER. Stepwise regression, support vector machine, and random forest modeling algorithms were used to rank independent variable importance and assess model accuracy (e.g., Root Mean Square Error, R2, and Mean Absolute Error [excluding stepwise regression]) in predicting woody cover. Based on its superior accuracy, the random forest model-based shrub cover was used for calculating woody cover potential and WPE risk (i.e., the ratio of shrub cover estimated by the Enhanced Vegetation Index to potential woody cover). The WPE risk estimates were binned into 5 classes using Natural Breaks (Jenks, 1967), where areas with the lowest risk were class 1 and areas of highest-risk areas were class 5.
b) Create functions that enable spatially explicit user input (e.g., land use, stocking rates, management unit boundaries, etc.) within a GIS (Geographic Information System).
Additional collaborators (e.g., UArizona Communications and Cyber Technologies [CCT] and Rangelands Partnership joined the project in Year 2 to provide guidance, expertise and resources to better integrate the modeling work and development of the geospatial web application into a comprehensive extension and outreach framework. The collaboration enabled broader user/stakeholder involvement in the web application design and development (specifically web product mock-ups/wire-framing, testing, and creation) and helped ensure the web product would meet user expectations and functionalities necessary for decision-making.
Working with Rangelands Partnership, an outline of new Brush Management topic pages for the Rangelands Gateway website was created. The outline led to the development of 9 new webpages that include an introduction to brush management, a tools section, pages for specific treatments (e.g., chemical, mechanical, etc.), and a page dedicated to materials emerging from a 2018 Brush Management Workshop series. Since publishing the webpages on January 28th, 2022, the main topic page had been visited 614 times as of July 2022. A prototypic web decision support tool called “ShrubRisk”, is currently advertised and accessed via links on the main BM webpage and on the tool’s webpage. Collaborating with the CCT team of designers and web and application developers, ShrubRisk was guided and refined by user interviews of regional representatives from Altar Valley Conservation Alliance, Natural Resources Conservation Service, Bureau of Land Management, and Pima County, AZ Natural Resource Division. A text-based clustering of the terms, phrases, and functions used by the interviewees was compiled to summarize information and ensure that the toolkit contained data/information specifically requested by stakeholders. ShrubRisk attributes and variables include a geospatial oriented layout; toolbox of interactive and contextual layers; two base maps; 21 data layers; user drawn/uploaded shapes to add context; ShrubRisk WPE risk raster layer (SEEDS model) with a WPE risk analysis table output; “save state” capabilities (e.g., all interactions in the application can be saved and shared if desired); single view/swipe view for the ability to activate a second map to compare multiple data layers side-by-side; linked additional online resources (e.g., Rangelands Gateway, web tools, readings); extensive help documentation; and verified accessibility on all devices (e.g., responsive to all screen heights/widths on desktop and mobile devices). ShrubRisk was constructed using Nuxt/VueJS (e.g., frontend framework for routing, state management, and code organization/composition), Amazon Web Services (AWS) Amplify, and AWS Amplify Command Lines Interface. At this writing, ShrubRisk resides at https://shrubrisk.app. Long-term plans for ShrubRisk are to test the expansion of the SEEDS model to encompass regions beyond the Santa Rita Experimental Range, where shrub encroachment is of concern and brush management treatments are planned, notably to grasslands experiencing Pinyon-Juniper encroachment. It is anticipated that data and functionalities may continue to evolve as user input and feedback continues to be received by Rangelands Partnership and the CCT development team. Periodic updates will be provided to our stakeholders via Rangelands Partnership newsletters and email lists.
c) Link Objectives 1-3 within the SEEDS framework to predict when, where, and under what conditions a given pasture/allotment will be at risk for WPE.
Random forest model sensitivity was initially assessed by running the 2015 woody cover model on 2005 and 1995 Landsat NDVI data. This allowed for the comparison of the differences in potential woody cover values between multiple years. These years were chosen to allow for time-steps long enough (i) for detectable changes in woody cover to occur and (ii) to include a range of weather conditions (e.g., drought periods vs wet periods). Model sensitivity forward in time relative to a 2015 start-year was evaluated with 2020 Landsat imagery. Using 2020 Landsat imagery, the Sawmill Fire of 2017 on the SRER provided an additional test of the SEEDS/WPE risk framework sensitivity to fire as a brush management treatment.
Objective 4: Test and refine the SEEDS algorithms to maximize their accuracy for predicting WPE risk.
User functionality, testing and refinement of the SEEDS (Shrub Encroachment Early Detection System) model, now called “ShrubRisk (Objective 3b), were completed in Year 3. The random forest modeled woody cover for 2015 was validated using independent field data from long-term transects. A model-estimated vs field-observed woody cover root mean square error (RMSE) of 13.9% was calculated and found to be comparable to what has been reported for other satellite-based woody cover mapping studies (e.g., Xian et al. (2013) RMSE = 15.8% in Arizona). Variation in field transect measurement protocols, transect location, distribution, and orientation relative to estimated woody cover in raster cells may have contributed to the error (see the Results and Discussion section below for more details). The SEEDS/ShrubRisk model estimates are not definitively better or worse than field-based estimates provided the aforementioned error associated with transect measurements. Regional and local vegetation mapping efforts with random forest algorithms was found to be a valuable approach for land management applications (for example, the Rangelands Analysis Platform [Allred et al. (2021)]). Currently, SEEDS/ShrubRisk provides utility for proactive brush management planning as intended, but the approach in model development and variable selection used has opportunities for improvement in future iterations.
Landsat 8 Vegetation Indices and Woody Cover Modeling
Woody vs non-woody classification accuracy and error matrix for the 2015 NAIP imagery is provided in Table 1. A total of 140 sample points across 7 cover classes (20 points per class) were used to investigate the relationship between NAIP-derived woody cover (true color imagery example = Fig. 4A; Fig. 4B = derived woody cover) and Landsat 8 NDVI and MSAVI (Fig. 5). These indices were chosen due to their documented performance and application within arid/semi-arid ecosystems including the SRER (Huete & Jackson, 1987; Hueng et al., 2018; Holifield-Collins et al., 2015). The best-fit lines for both NDVI (RMSE = 7.89%, R2 = 0.8, p ≤ 0.001) and MSAVI (RMSE = 10.8%, R2 = 0.72, p ≤ 0.001) were quadradic, wherein shrub cover became asymptotic at ~70%. Areas with high cover were concentrated near washes and lower montane elevation zone. Landsat 8 NDVI was subsequently used for further modeling given its lower RMSE compared to MSAVI (Fig. 6). Furthermore, high-resolution NAIP imagery (Fig. 4A) availability is limited in time and space with a relatively short collection history compared to the moderate-resolution Landsat, which has been collected every 8 or 16 days since 1982. This flexibility in the Landsat dataset allowed for broader geographic applications of the final SEEDS model beyond the SRER and over longer time-periods. With a 7.9% woody cover error, the Landsat-based woody cover estimates are elevated slightly compared to the cover estimate obtained from classified imagery (Fig. 4B). However, high versus low woody cover areas were accurately modeled using only the Landsat 8 NDVI values.
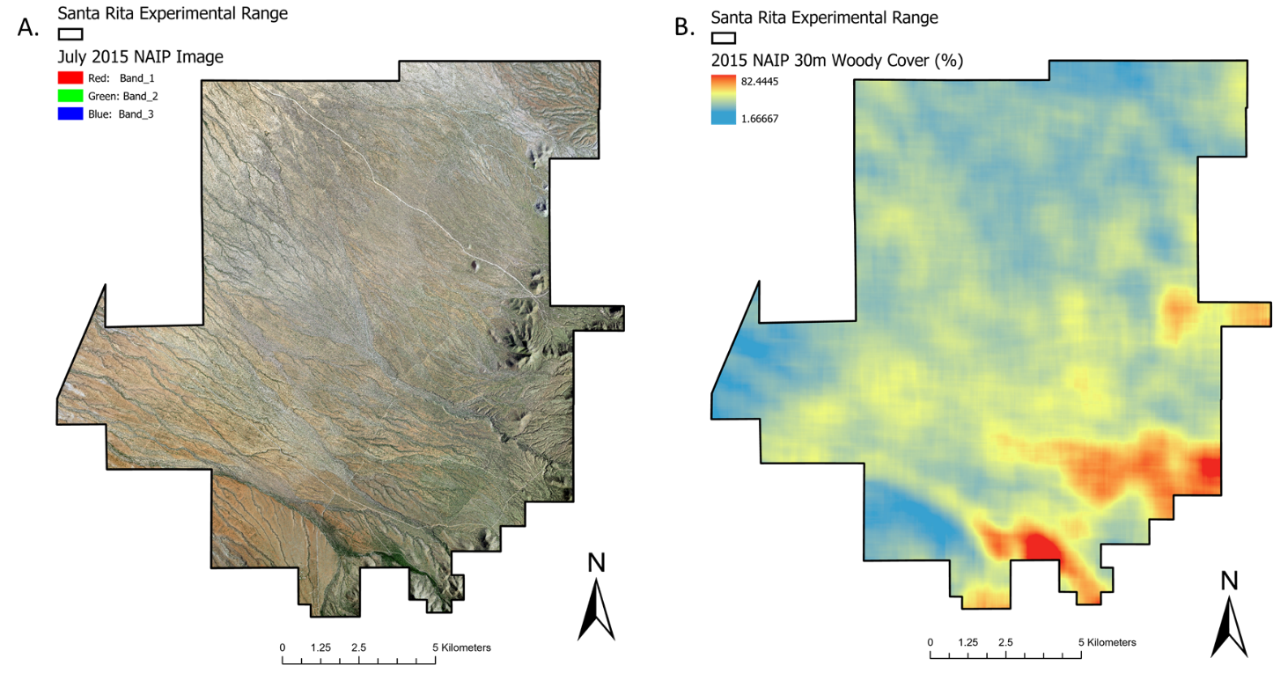
Figure 4. Natural color 1-m 2015 NAIP imagery (A) and resulting 30-m shrub cover (%) (B) raster-based shrub/non-shrub classifications. The shrub cover raster was used in conjunction with Landsat 8 vegetation indices (e.g., NDVI and MSAVI) to develop algorithms to quantify patterns of shrub cover on historical Landsat imagery.
Table 1. Error matrix accuracy assessment of the classification performed on July 2, 2015 NAIP images of the Santa Rita Experimental Range. The reference data for the accuracy assessment was the 2017 NEON Airborne Observation Platform imagery (10-cm spatial resolution).

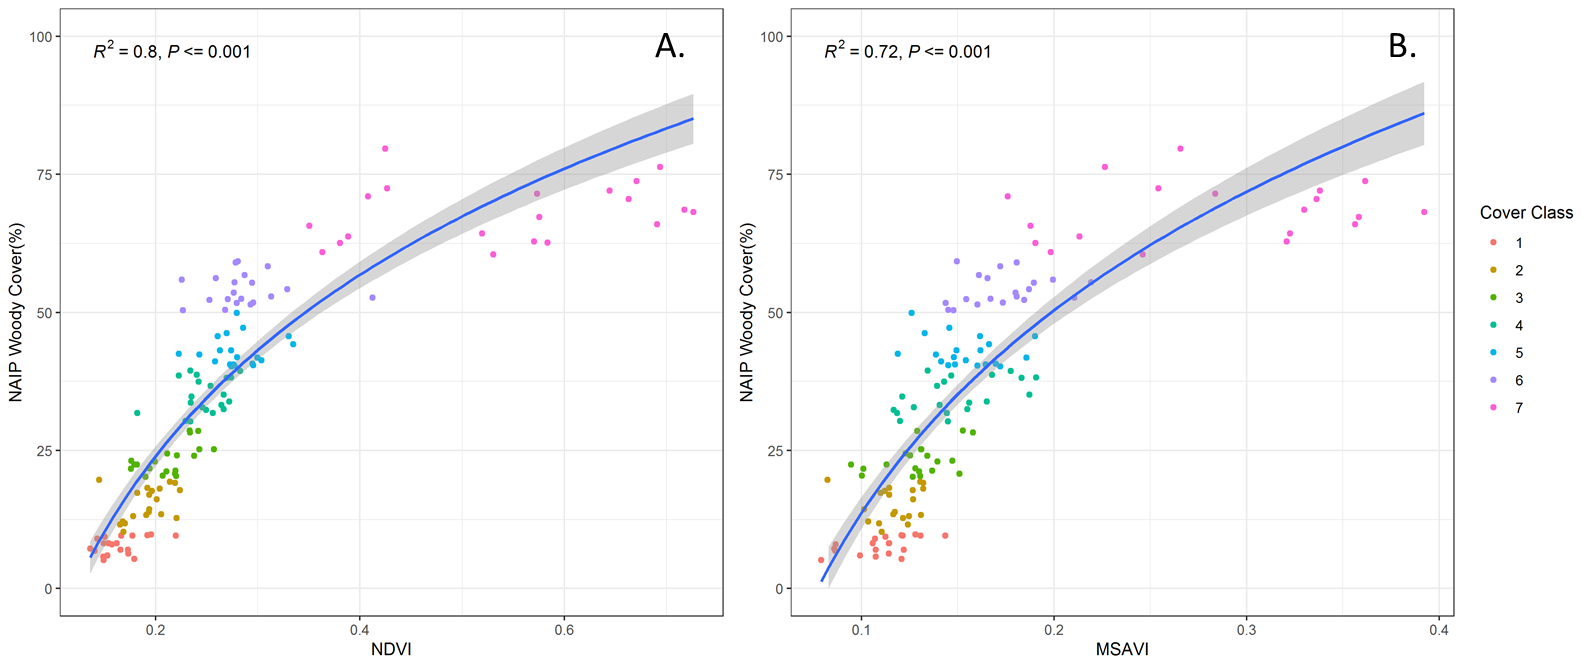
Figure 5. Classified USDA NAIP (National Agricultural Imagery Program) and Landsat 8 NDVI (Normalized Difference Vegetation Index) (A) and MSAVI (Modified Soil Adjusted Vegetation Index) quadratic regression (B). Points (n = 140) were equally stratified along 7 classes in 10% shrub cover increments for model development. The NDVI relationship was used for modeling woody cover across the Santa Rita Experimental Range (see Fig. 6).
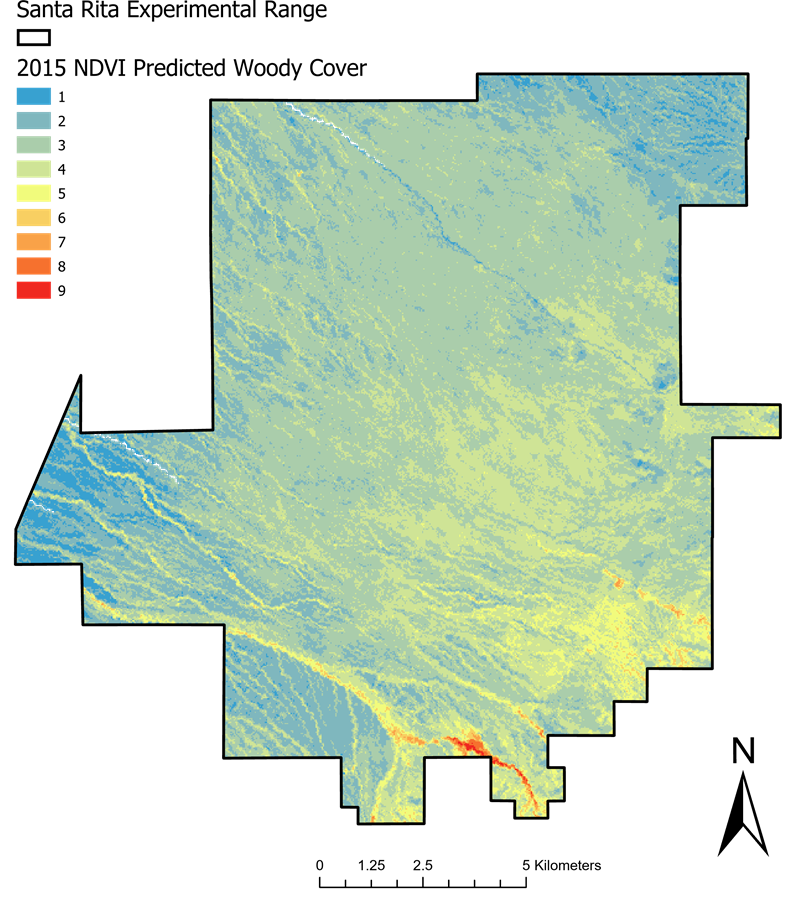
Figure 6. Classified woody cover in 2015 (9 cover classes in 10% increments) modeled using NAIP (National Agricultural Imagery Program) woody cover and Landsat 8 OLI NDVI (Normalized Difference Vegetation Index). The maximum and minimum percent woody cover values were 88% and 0%, respectively. The densely vegetated areas (e.g., washes and foothills) appear orange to dark red due to their high shrub cover. Blue areas are bare soil patches and/or Pleistocene aged surfaces with high clay content and low shrub cover (see also Fig. 1A).
Modeling Woody Cover Based on Biophysical Variable Importance
Landsat 8 NDVI values show patterns of shrub cover but do not provide insight into the biophysical/ecological variables that determine cover site potential. A total of 31 independent variables pertaining to seasonal and annual mean precipitation (PPT) and temperature (T), topography, soil characteristics, and ecological site were used in a stepwise regression, support vector machine (SVM), and random forest (RF) modeling procedures for determining 1) the best/most accurate variables governing woody cover potential; 2) the relative importance of the 31 biophysical variables potentially influencing maximum woody cover; and 3) the SEEDS/ShrubRisk model best suited to represent woody plant encroachment risk. A graphical comparison of the three models is shown in Fig. 7.
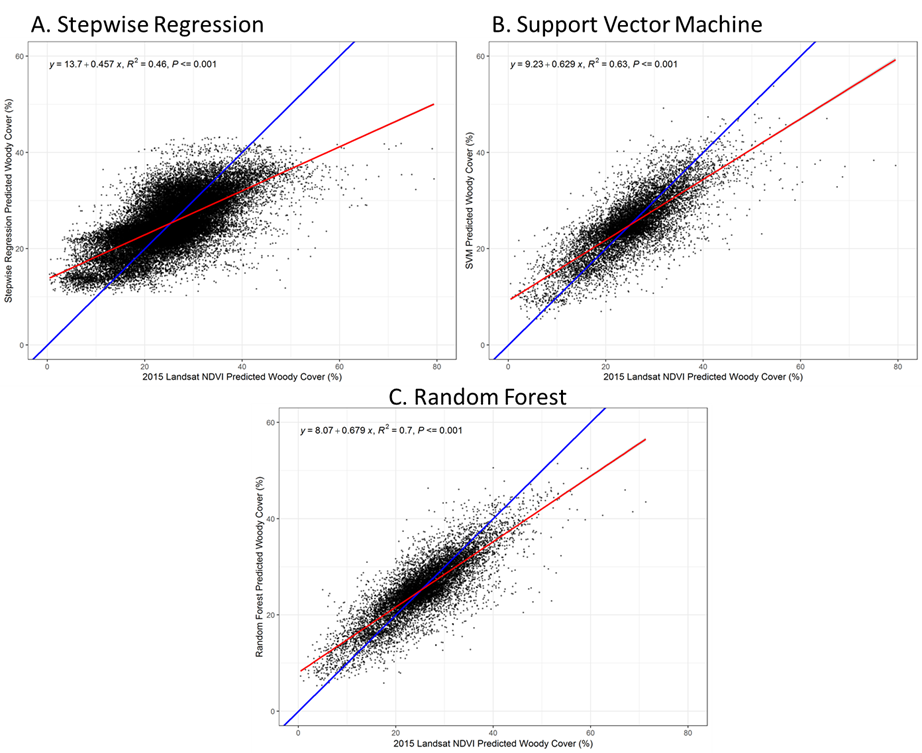
Figure 7. Stepwise regression (A), support vector machine (B), and random forest (C) woody cover model predictions versus 2015 Landsat NDVI-based woody cover for the Santa Rita Experimental Range. Per-pixel cross-validation (n = 45,839) was used for assessing each model’s prediction performance. Blue lines represent a 1:1 fit; red line is the linear regression of the actual fit.
The stepwise regression modeling (RMSE = 5.6%, R2 = 0.457) revealed 12 variables to be the most important: slope aspect; depth to restrictive layer/bedrock; soil clay content over 1-m depth; depth to maximum clay content; maximum 1980-2010 T; distance to the nearest wash; mean winter PPT; minimum spring and autumn T and maximum spring and summer T. Although the stepwise error was relatively low (RMSE = 5.6%), the prediction utility was poor (Fig. 7A), and the temperature variable/model variability was unconstrained as reflected in a low R2 (R2 = 0.46). The SVM model improved the overall model prediction errors (Mean Absolute Error [MAE] = 4.2%; RMSE = 5.5%) and accounted for more of variation (R2 = 0.63) compared to the stepwise regression model. The best modeling technique was found to be the 2015 random forest with the lowest modeling errors (MAE = 3.22%; RMSE = 4.2%), best fit (R2 = 0.70), and strongest prediction utility (Fig. 7C). The most important biophysical variables/predictors for determining woody cover potential, as determined via Gini Index of Impurity, were elevation, soil clay content, slope aspect, autumn PPT, winter PPT, slope inclination, and distance to the nearest wash (Fig. 8).
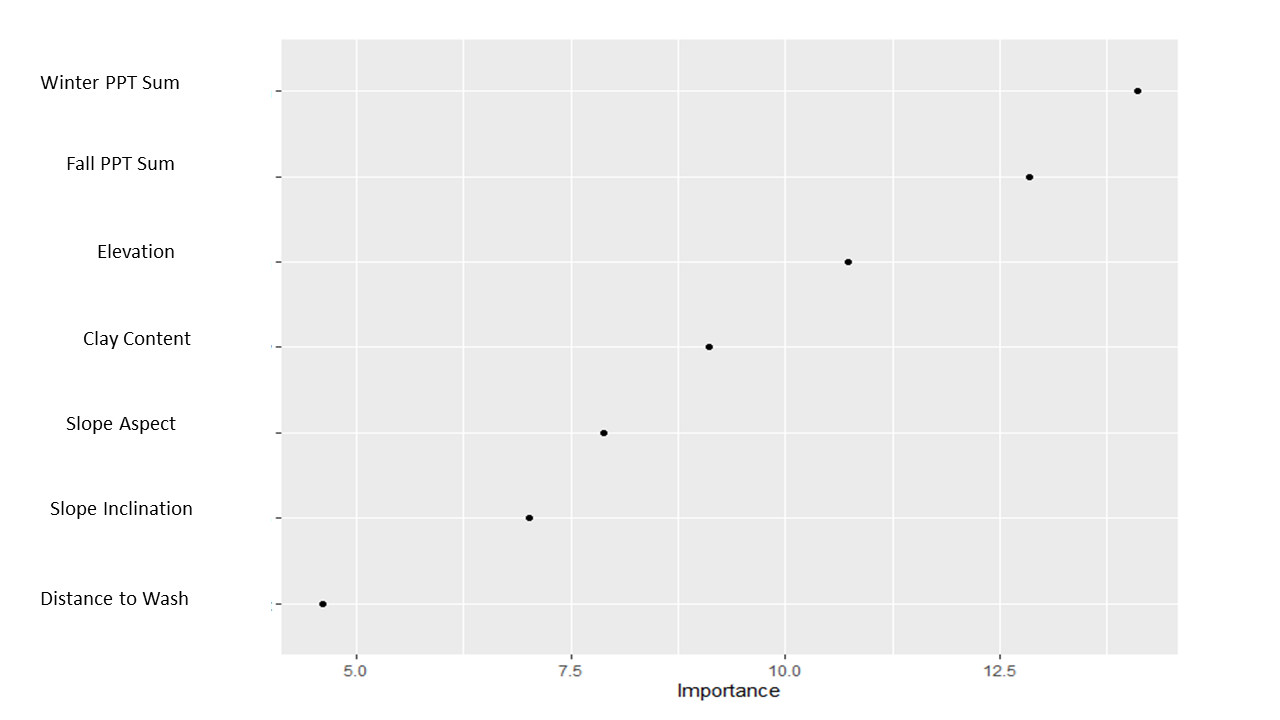
Figure 8. Gini Index of Impurity ranking of the importance of variables predicting woody cover on the Santa Rita Experimental Range.
Model Testing Back-in-Time
Using the same biogeophysical predictor variables as the 2015 random forest model (e.g., elevation, soil clay content, slope aspect, autumn PPT, winter PPT, slope inclination, and distance to the nearest wash), the 1995 RF regression model (Fig. 9A) had strong predictive power with a low error (RMSE = 3.93%) and a model variability constraint R2 of 0.74. The variable importance of the 1995 RF model vs the 2015 random forest model ranked elevation higher than autumn PPT and the importance of soil clay content was reduced compared to topographic variables (e.g., slope aspect and slope inclination). The differences in predictor variable importance are possibly due to PPT patterns (e.g., drought vs wet years) during the autumn and winter months across the SRER. Drought conditions can underestimate woody cover estimations based on Landsat VIs that are dependent on greenness to detect a vegetation signal. Alternatively, wet years with increased herbaceous and woody plant growth can make discerning the two cover types more difficult. The 2005 random forest model (Fig. 9B) also ranked topographic variables higher than the 2015 model, but its performance was still quite robust (RMSE = 2.64%, R2 = 0.76). The consistency in low error rates and greater amount of variance explained in the multiple random forest compared to that of SVMs or stepwise regression techniques models argues for their use in modelling woody cover.
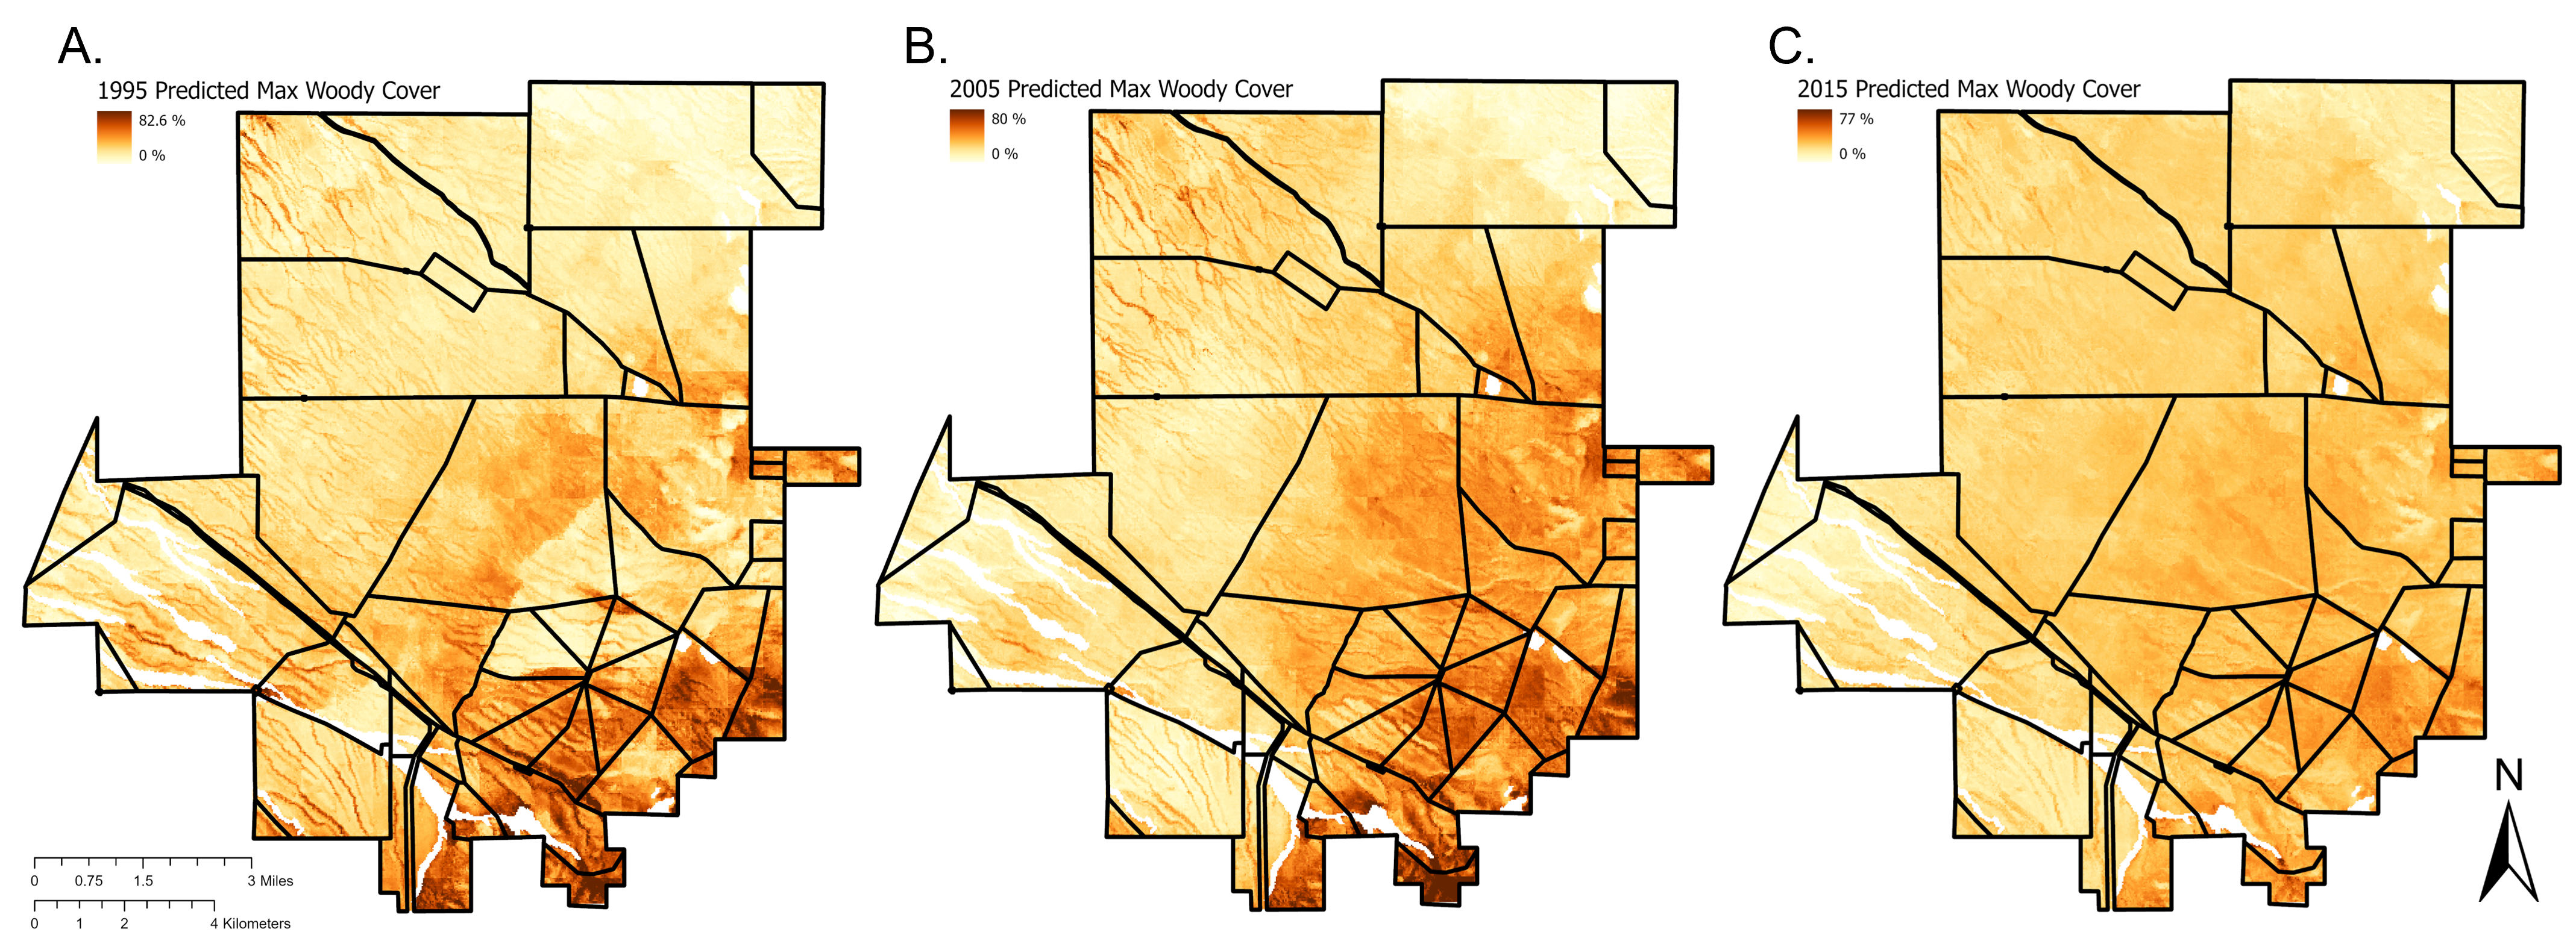
Figure 9. Random forest models of woody cover potential on the Santa Rita Experimental Range in (A) 1995 (max = 82.6%, min = 0%), (B) 2005 (max = 80%, min = 0%), and (C) 2015 (max = 77%, min = 0%). The densely vegetated areas (e.g., washes and foothills) appear orange to dark brown, reflecting their high shrub cover. Yellow areas are dominated by bare soil patches and/or Pleistocene-aged soils with high clay content and low shrub cover.
The random forest model predictions for maximum potential woody cover were used in finalizing the proposed SEEDS/ShrubRisk models (Fig. 10A-C) for determining a site’s woody plant encroachment (WPE) risk. Risk was calculated as the ratio of a site’s shrub cover on a given date (estimated by the Enhanced Vegetation Index for a given year: 1995, 2005, 2015) to its potential shrub cover. The wildfire that occurred in 1994 in the center of the SRER was detectable in the 1995 potential woody cover model (Fig. 9A, light yellow) and in the resulting WPE risk map (Fig. 10A, dark brown). Much of the burned region was classified as moderately high to high WPE risk in the 1995 due to the potential for velvet mesquite, a vigorous sprouter tolerant of top-kill, to re-establish post-fire. The moderately high to high risk areas within the area burned in 1995 then decreased in their risk level slightly by 2005 (Fig.10B), whereas many of the high risk burned areas transitioned to moderate/moderately high. By 2015 (Fig. 10C) woody cover was approaching the site’s woody cover potential, and its risk level declined compared to 2005. Regions dominated by bare soil patches and/or Pleistocene-aged soils with high clay content and low shrub cover potential remained at low to moderately low risk of shrub encroachment over the entire 20-year period (Fig.10).
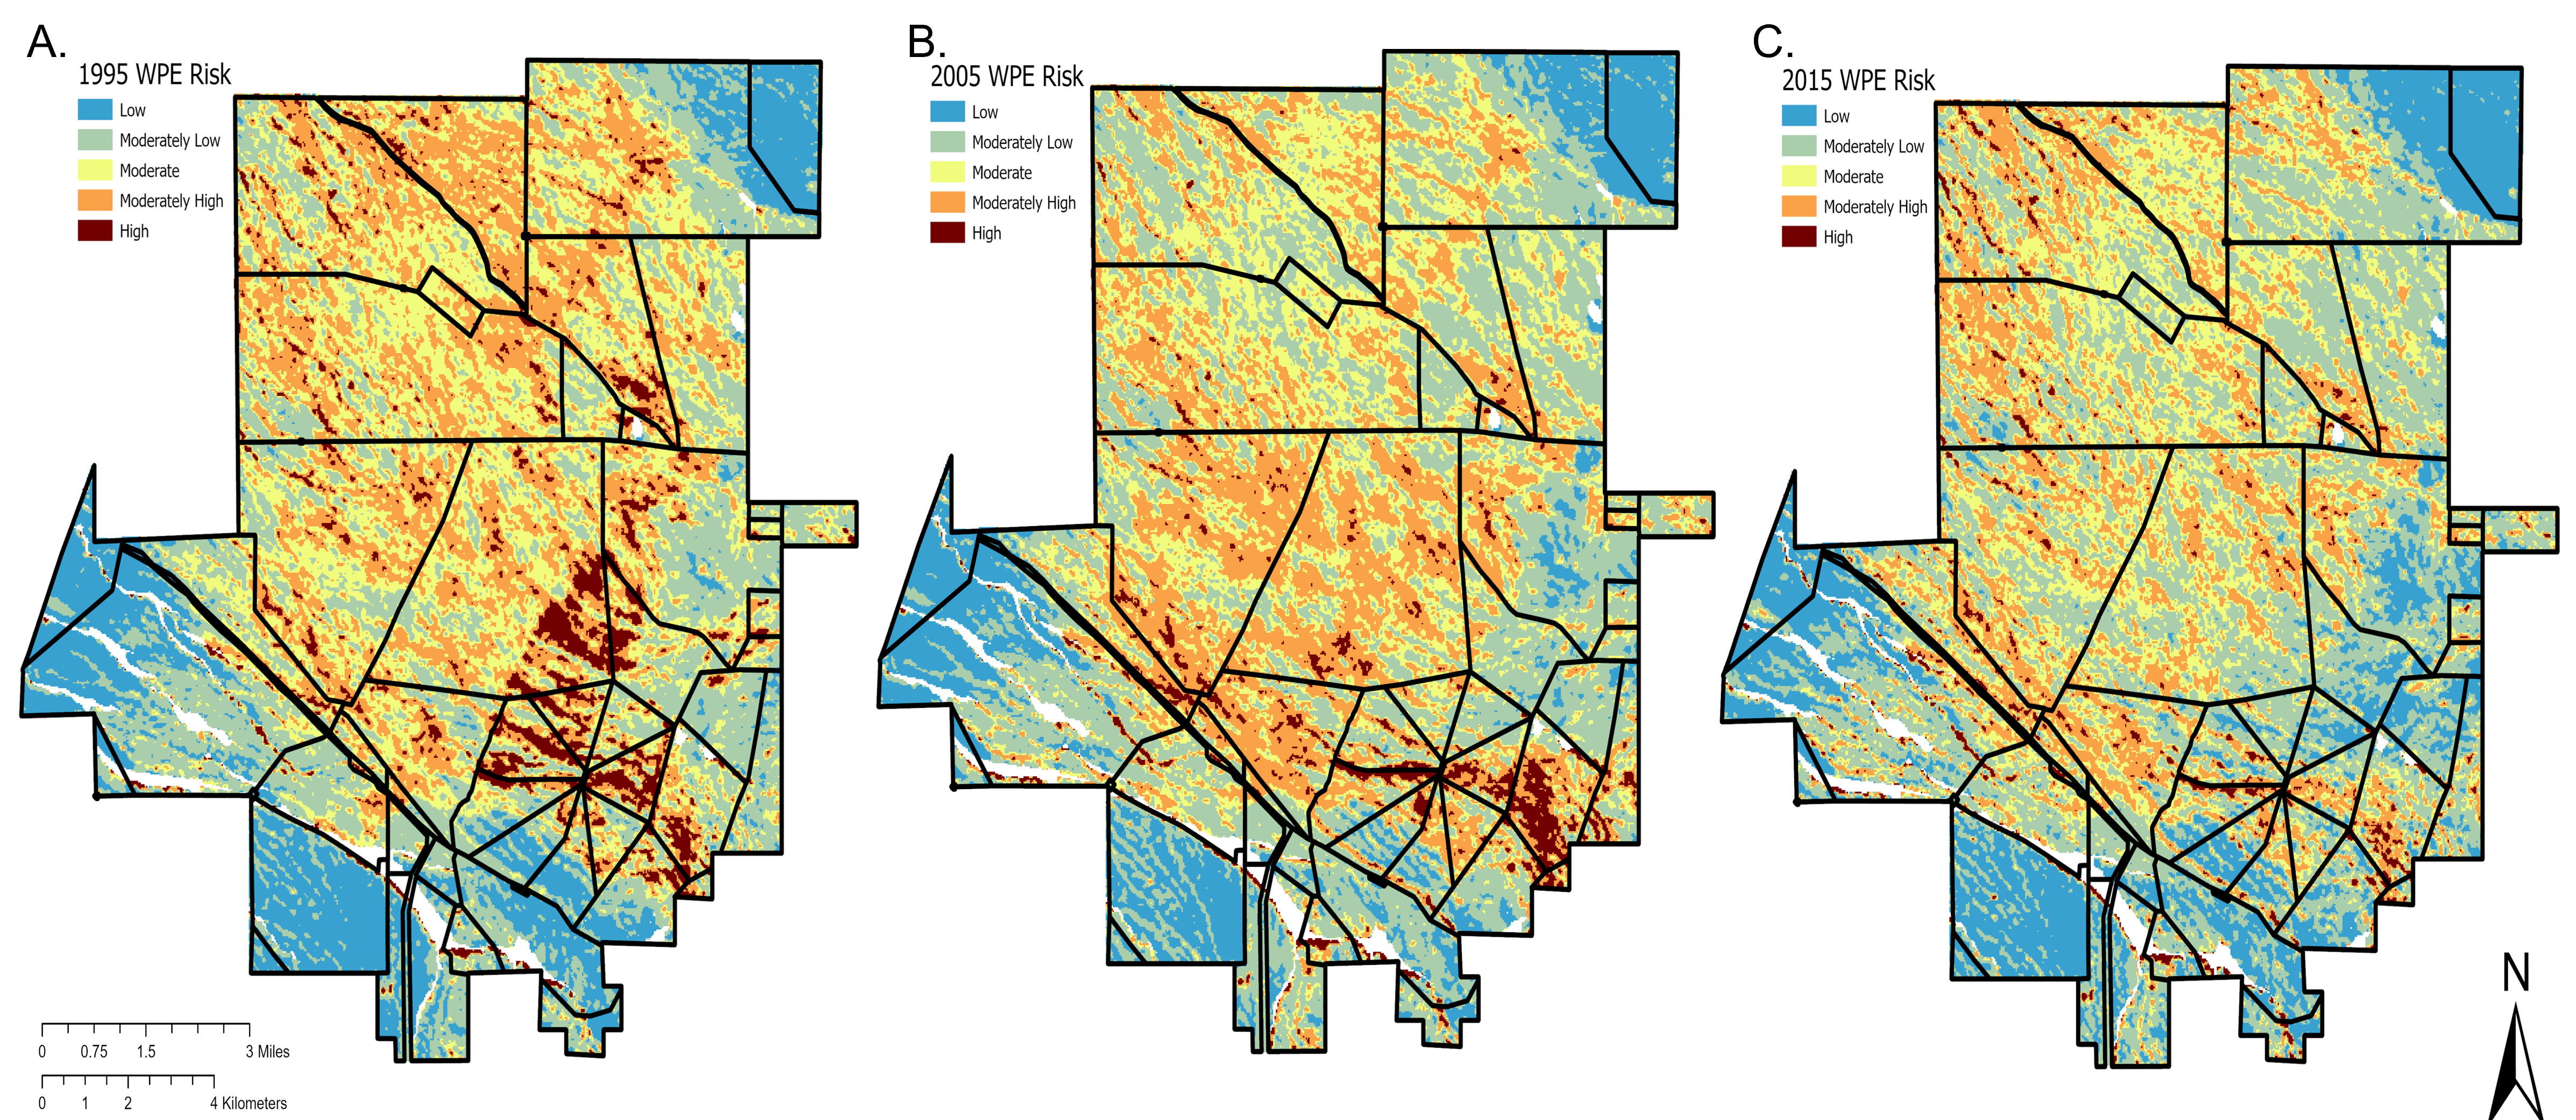
Figure 10. Classified woody plant encroachment risk calculated as the ratio of a site’s shrub cover on a given date (estimated by the Enhanced Vegetation Index for a given year: 1995, 2005, 2015) to its potential shrub cover. The five risk classes range from Low to High and were defined by Natural Breaks (Jenks, 1967). The areas at most risk for shrub encroachment appear orange to dark brown; yellow to blue areas are low to moderate risk areas reflective of low shrub cover potential and/or areas that have reached their potential woody cover.
The areal extent of the various WPE risk levels for 1995, 2005, and 2015 is summarized in Table 2. Areas at the most risk have been decreasing in their areal extent over time ostensibly reflecting the progression toward maximum potentials on the various topoedaphic settings. Accordingly, the low to moderately low levels have been increasing in area. It should be noted that the areal extent of high risk areas in 1995 (5.6% of the SRER land area) is likely inflated due to the 1994 wildfire, while moderately high risk areas remained rather stable between 1995 and 2005 (24.6% vs 24.9%, respectively). The greatest change in WPE risk occurred between 1995 and 2015, wherein moderately low risk areas increased by 10.0% or ~5,200 acres (Table 3) reflective of the reduction in moderate to high risk sites
Table 2. Percentage of the ~21,000-hectare Santa Rita Experimental Range classified in various woody plant encroachment risk level in 1995, 2005, 2015.
| Risk Level | 1995 | 2005 | 2015 |
| Low | 14.1 % | 11.9 % | 16.6 % |
| Moderately Low | 28.1 % | 35.7 % | 38.1 % |
| Moderate | 27.5 % | 24.3 % | 23.8 % |
| Moderately High | 24.6 % | 24.9 % | 19.3 % |
| High | 5.6 % | 3.3 % | 2.2 % |
Table 3. Absolute percent change in WPE risk level area over three time steps (e.g., 2015 vs 2005, 2015 vs 1995, and 2005 vs 1995). Calculated from percentages provided in Table 1.
| Risk Level | Δ (2015-2005) | Δ (2015-1995) | Δ (2005-1995) |
| Low | 4.7 % | 2.5 % | -2.2 % |
| Moderately Low | 2.5 % | 10.0 % | 7.5 % |
| Moderate | -0.5 % | -3.8 % | -3.3 % |
| Moderately High | -5.6 % | -5.3 % | 0.3 % |
| High | -1.1 % | -3.4 % | -2.3 % |
Percent area calculations (Table 2) and acreage estimates (Table 4) for each WPE risk level can be used by stakeholders to estimate costs to implement brush management treatments on a landscape, watershed, pasture or allotment. Costs will vary depending on treatment method chosen (e.g., individual plant, chemical, mechanical, etc.), but an accurate estimate of acreage for potential treatment will aid in budget calculations and future planning. Furthermore, assessment of WPE risk level change through time across a landscape allows for understanding the trend of WPE in a given area of interest. For example, a decrease in high WPE risk acreage overtime (1995-2015 in Table 4) indicates more of the landscape has approached it’s carrying capacity for shrubs. While this may seem like a positive to decrease in high WPE risk-level acreage, these lands will require more intensive management treatments to reduce shrub cover and maintain a grassland state as these sites are close to or at their maximum shrub cover. In other words, it will cost more to treat more shrubs, especially if using a mechanical or chemical technique.
Table 4. Areal extent (acres) of landscapes at various levels of risk for woody plant encroachment on the Santa Rita Experimental Range in 1995, 2005 and 2015.
|
Risk Level |
1995 |
2005 |
2015 |
|
Low |
7,406 |
6,241 |
8,708 |
|
Moderately Low |
14,770 |
18,710 |
20,011 |
|
Moderate |
14,456 |
12,746 |
12,466 |
|
Moderately High |
12,921 |
13,069 |
10,136 |
|
High |
2,926 |
1,710 |
1,132 |
The random forest modeled woody cover for 2015 was validated using independent field data (Fig. 11) obtained from long-term transects (1953 – 2021; n = 131). Samples of predicted woody cover obtained by averaging the pixels that intersected transect locations using the ‘Sample’ tool in ArcGIS Pro (v2.6.1). We then calculated MAE, RMSE, and R2 for model vs. transect cover estimates. Matching ground-based woody cover transect data were available only for model year 2015.
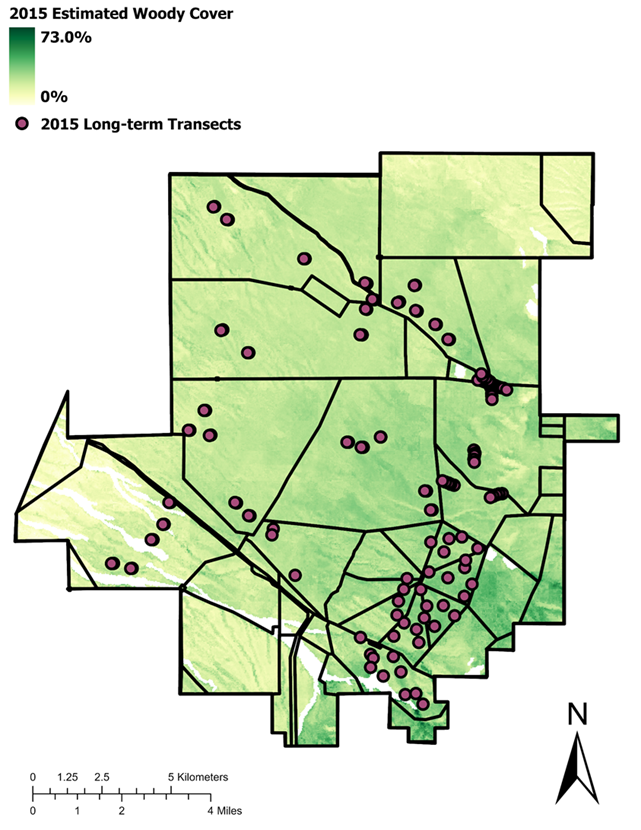
Figure 11. Random forest modeled woody cover across the Santa Rita Experimental Range in 2015. Points denote locations of ground-based woody cover measurements from 2015 on long-term transects (n = 131). White areas on maps are sandy wash (or drainage) and rock outcrop areas with missing maximum clay data.
While random forests emerged as the best machine learning technique, the ground- vs model-based shrub cover validation comparison suggested improvements could be made (Fig. 12). A model estimated vs field-observed woody cover RMSE of 13.9% is comparable however to similar continuous woody cover mapping studies. Xian et al. (2013) estimated shrub cover with RMSEs of up to 15.8% in Arizona using regression trees, where Jones et al. (2018) used random forests to model shrub cover across the entire Western US with RMSE values ranging from 7.1% to 11%. The slight RMSE increase of ~2.9% in our random forest model as compared to Jones et al. 2018 (e.g., 11% with SageSTEP ground-based observations) may be attributable to variation in transect measurement protocols and the spatial distribution of transects across the SRER (Fig. 11), as well as the transect orientation relative to estimated woody cover raster cells. Numerous types of error are associated with field-based vegetation cover sampling which is also highly influenced by the observer-based error. Taken together, SEEDS/ShrubRisk model estimates are not necessarily better or worse than field-based estimates and on-the-ground monitoring may be warranted to attain additional site-level vegetation cover information that’s beyond the scope of SEEDS/ShrubRisk. Regional and local vegetation mapping with random forests has proven beneficial in this application in development of a WPE risk framework, and supports the utility of machine learning, model-based approaches for application in conserving Sonoran Desert grasslands.
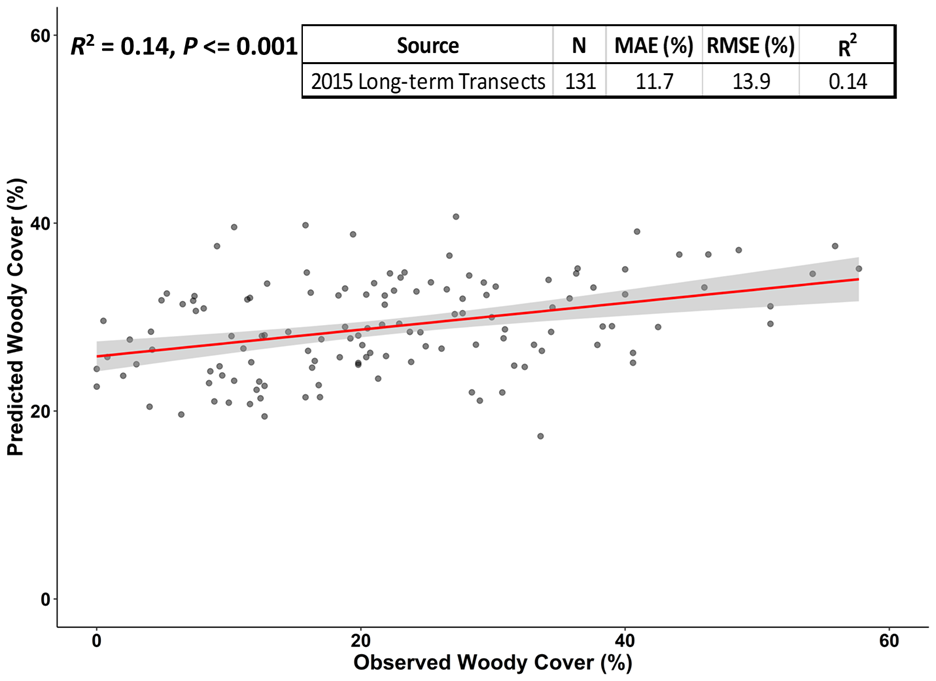
Figure 12. Final random forest modeled woody cover (%) relative to ground-based estimated woody cover (%) in 2015. Red line is the linear fit between modeled and observed values. Inset: random forest estimated woody cover evaluation metrics (number of samples, N; mean absolute error, MAE; root mean square error, RMSE; and coefficient of determination, R2) calculated using the Santa Rita Experimental Range long-term ground-based transects for 2015.
WPE Risk and Disturbance
The WPE risk/SEEDS framework sensitivity to fire was assessed on an area experiencing wildfire, where wildfire would ostensibly reduce shrub cover potential and thus increase the risk for WPE. Following years after a wildfire, a site would move closer to its potential cover and WPE risk would be reduced. The 2017 Sawmill fire (Fig. 13) burned 3,340 ac in the spring with only ~5% of the fire experiencing moderate burn severity and remaining areas at low severity or left unburned (Fig. 13 inset). Three years post-fire (2020), there remained 302 ac of moderately high and 213 ac of high WPE risk relative to 2015. Many areas of moderately low WPE risk were replaced by moderate risk from 2015 to 2020, but many of the moderately high to high risk areas in or near sandy washes changed little through time (Fig. 9). The high clay (maximum = ~47.5%), Pleistocene-aged alluvial fan in the southern portion of the Sawmill Fire remained at low to moderately low WPE risk over ~25 years.
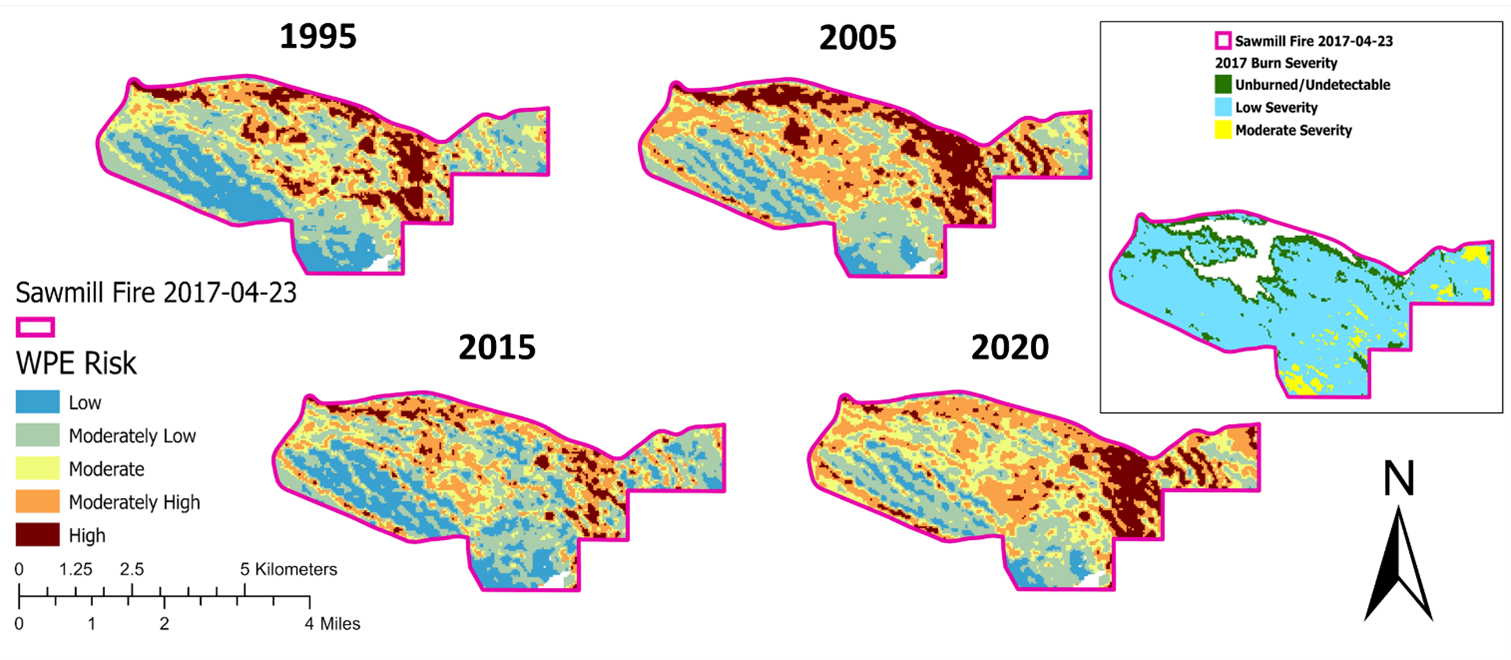
Figure 13. Woody plant encroachment (WPE) risk maps for 1995, 2005, 2015, and 2020 within the 1,352-ha area burned by the Sawmill Fire (April 23, 2017) that occurred on the Santa Rita Experimental Range. Inset: Burn severity from the Monitoring Trends in Burn Severity remote sensing-based dNBR (differenced Normalized Burn Ratio) products for the 2017 Sawmill Fire. White areas in the burn area indicate missing data. White areas on WPE risk maps are sandy wash and rock outcrop areas with missing maximum clay data.
The lack of a moderate-to-high risk conversion with the Sawmill Fire suggests that SEEDS/WPE risk’s response to fire disturbance is relatively short-lived (e.g., ≤ 3-y post-fire). The differences in response to fire within the burn boundary could be due to contrasting soil clay content, where the loamy upland areas (southwest portion of the burn area; Fig. 13) within the Sawmill Fire experienced little increased WPE risk as compared to the sandy loam upland areas. The loamy, southwestern portion of the Sawmill Fire was also subjected to a lower severity burn. A higher severity burn may have facilitated a conversion of low to high WPE risk classes. Follow-up comparative work between ecological site shrub cover responses to prescribed fire and fire severity may inform more precise timing for implementing controlled burns as effective brush management strategies.
Conclusion
With the advancements in cloud-computing and the robust accuracy and reliability of machine learning modeling, a new decision support tool for proactive, as opposed to traditionally reactive, brush management was developed. Our WPE risk/SEEDS framework offers a cost-effective, and preventative alternative to reactive brush management on western rangelands. Furthermore, assessment of a site’s risk of encroachment helps to increase effectiveness and reduce the cost (money and time) of rangeland monitoring effort by pinpointing specific sites most at-risk, while simultaneously facilitating planning efforts for the location, type (e.g., prescribed fire), and timing of brush management. In an effort to benefit our stakeholders, we provide the most important biogeophysical determinants of shrub cover as indicated in our random forest model across Major Land Resource Areas 41 (Southeastern AZ Basin and Range) and 40.1 (Upper Sonoran Desert) including the 2015 WPE risk map for the SRER in an interactive online tool, called ShrubRisk (ShrubRisk.app).
Participation Summary
This project does not contain a stakeholder academic interview component for use in analysis per se, but instead included general participation to guide research applicability and development of the SEEDS/ShrubRisk application. Ranchers/producers and agriculture professionals participated in local meetings and field days/tours, where this project was highlighted and discussed, including the 2020-2022 Altar Valley Conservation Alliance Community Meetings and the 2019-2022 Las Cienegas National Conservation Area Bio Planning Field Days (see Educational and Outreach Activities section). Results on the project have been shared with the Rangelands Partnership at their Annual Meetings and with regional stakeholders through technology panel discussions and field days. The latter includes the Altar Valley Conservation Alliance and other stakeholders from the Arizona State Land Department; US Fish and Wildlife Service; Bureau of Land Management; Pima County, AZ Natural Resources, Parks, and Recreation; and The Nature Conservancy. Collaboration with CCAST’s Grassland Restoration Community of Practice has allowed for completion of a new Case Study and ArcGIS StoryMap including a PDF handout for dissemination. The web-based Brush Management topic pages are finalized, and the Rangelands Gateway website updated with new text and online resource links/URLs. The prototypic geospatial application (ShrubRisk) is completed, and the official version 1.0 was released June 2022. Stakeholder feedback will continually be solicited through the Rangelands Partnership newsletter and various University of Arizona email lists, with feedback incorporated by the CCT group.
Appendix A

Research outcomes
Education and Outreach
Instructor for the Institute for Tribal Environment Professionals Tribal Exchange Network Fall 2020 Virtual Data Academy and Conference. Taught Tribal Natural Resource Professionals on how to apply the R programming language to their own unique data manipulation, organization, and visualization tasks.
Osher Lifelong Learning Institute (https://olli.arizona.edu/) Lecturer on an introduction to Rangelands, Range Science, and personal research summary.
Regional stakeholder virtual/Zoom interviews on brush management web-based decision support tool functionalities, data availability, and management considerations addressable from using the toolkit.
Co-Organizer & Helper/Instructor Coordinator - Research Bazaar Arizona (https://researchbazaar.arizona.edu/) Virtual Conference.
Panel participant, Collaborative Conservation and Adaptation Strategy Toolbox (CCAST)’s Grassland Restoration and Management Panel-Discussion Series: Existing and Emerging Vegetation Tools. Fall 2021. (https://www.youtube.com/watch?v=vsqHXfK51Yo)
Guest Lecture in UArizona ENVS 401/501 Sustainable Management of Arid Lands course. Fall 2021.
Participation summary:
Presentations, conferences, and workshops/field days during Year 1 (2019-2020), Year 2 (2020-2021), and Year 3 (2021-2022) are listed below. In addition to these activities, an educational tool for the Natural Resource Conservation Service Soil Health Division learning module under the “Social and Economic Considerations” topic area was updated to target Arizona- and rangeland-focused learners (internal presentation slides for NRCS). In Year 1 and 3 mostly, tours and field days with collaborators occurred at the Las Cienegas National Conservation Area, Altar Valley, and the Santa Rita Experimental Range in southern Arizona. During these tours and field days, producer/manager shrub encroachment concerns were heard, and brush management projects being planned or proposed were discussed. In Year 2, one tour/field day on vegetation/brush management occurred in autumn of 2020 in Altar Valley, AZ. Unfortunately, many Year 2 scheduled opportunities were cancelled due to the COVID-19 pandemic in accordance with University of Arizona guidelines. Details and methods for this research has also been presented to mixed undergraduate and graduate groups in the University of Arizona College of Agriculture and Life Sciences as part of Data Science and R-language programing community meetings. Presentations emphasized the utility and applicability of machine learning modeling practices to local and regional land management goals and research questions.
In Year 3, many educational and outreach activities occurred with the collaboration with CCT and Rangelands Partnership in accordance with Objectives 3b and 4. Specifically 9 new brush management-focused webpages for Rangelands Gateway with extended content were created:
- Brush Management
- Biological Methods
- Chemical Methods
- Cultural Methods
- Prescribed Fire and Wildfire
- Targeted Grazing
- Range Seedling
- Mechanical Methods
- Integrated Brush Management Systems
Each webpage contains new photos, introductory text, videos, linked tools, featured readings, and outside resources/readings/case studies for any person interested in a given topic area. A Rangelands Gateway handout/flier with a QR code to brush management topic webpages was developed for regional field days/workshops. A CCAST story map and handout was finalized, which provided an undergraduate student from Hastings College (Nebraska) experience in disseminating Natural Resource-focused research. Lastly, the web-based, prototypic decision support tool now called ShrubRisk was finalized, which operates as an educational and outreach platform with “About the Data” and “Additional Resources” pages in addition to being a proactive brush management tool for land managers in southeastern Arizona.
Webinars, talks, and presentations presented:
- Rutherford, WA, SR Archer, S Merrigan, A Gondor. ES Gornish. (2022). An online toolkit for grassland conservation. Oral presentation; 75th Annual Society for Range Management Meeting, Albuquerque, NM. 1st Place PhD Oral Presentation Competition.
- Rutherford, WA, S Merrigan, SR Archer, ES Gornish. (2021). Developing online resources for managing shrub encroachment. Oral presentation & panelist; Collaborative Conservation and Adaptation Strategy Toolbox (CCAST) Grassland Restoration and Management Panel-Discussion Series: Existing and Emerging Vegetation Tools, Virtual Meeting.
- Rutherford, WA and SR Archer. (2021) Evaluating shrub proliferation in the Sonoran Desert. Oral/Lightning Talk; International Arid Lands Consortium, Virtual Meeting. Finalist in Graduate Student Lightning Talk Competition (1 of 2 from U.S. Institutions of Higher Education)
- Rutherford, WA, S Merrigan, SR Archer, ES Gornish. (2021 & 2022) Fusing range and data science: developing online resources for managing shrub encroachment. Oral Presentation; Rangelands Partnership Annual Meeting, Virtual.
- Rutherford, WA. (2020) Instructor, Natural Resources Data in R. Institute for Tribal Environment Professionals Tribal Exchange Network 2020 Virtual Data Academy and Conference.
- Rutherford, WA and SR Archer. (2020) Evaluating shrub proliferation risk on Sonoran Desert rangelands. Invited Oral/Inspire presentation; Ecological Society of America Annual Meeting, Virtual Meeting.
- Rutherford, WA, SR Archer. (2020) Predicting Woody Plant Encroachment Risk on Sonoran Desert Rangelands. Poster Presentation; 73rd Annual Society for Range Management Meeting, Denver, CO.
- Rutherford, WA. (2020) AVCA 2020 Update: Shrub Encroachment Early Detection System (SEEDS). Oral Presentation; AVCA Community Meeting, Virtual.
- Rutherford, WA, SR Archer. (2019/20) Predicting Woody Plant Encroachment Risk on Sonoran Desert Rangelands. Oral Presentations; University of Arizona R-programing Community Meetings, Tucson, AZ.
- Rutherford, WA, SR Archer. (2019) Evaluating Shrub Encroachment Risk on Sonoran Desert Rangelands. Poster Presentation; Society for Ecological Restoration-Southwest, Tucson, AZ.
- Jones, S, WA Rutherford, SR Archer. (2019) Evaluating Woody Plant Encroachment in Sonoran Grasslands for Brush Management Planning. Oral presentation (co-presented by Jones and Rutherford); Science on the Sonoita Plain Symposium, Sonoita, AZ.
Conferences/Workshops/Field Days Attended (2019):
- Science on the Sonoita Plain. June 22nd, 2019, Elgin, Arizona. Organized by Cienega Watershed Partnership. Approximately 50 participants.
- Research Insights in Semiarid Ecosystems (RISE). October 26th, 2019, Tucson, Arizona. Organized by Agricultural Research Services and College of Agriculture and Life Sciences University of Arizona. Approximately 60 participants.
- Southwestern Grasslands Research & Management Workshop. November 7th, 2019, Tucson, Arizona. Organized by Southwest Division Resources/Society for Ecological Restoration. Approximately 100 participants.
- Society for Ecological Restoration Southwest (SER SW). November 8th-10th, 2019, Tucson, Arizona. Approximately 500 participants.
- Altar Valley Conservation Alliance (ACVA) Vegetation Watershed Working Group (bi-monthly from 2019-Current)
- AVCA Field Day. November 1st, 2019, Altar Valley, AZ.
- Las Cienegas National Conservation Area (LCNCA) Winter Planning Meeting/Field Day. December 12th, 2019, Sonoita, AZ. Organized by Bureau of Land Management and Southwest Division Resources. Approximately 50 participants.
Conferences/Workshops/Field Days Attended (2020):
- Society for Range Management Annual Meeting. February 16th-20th, 2020. Denver, CO.
- Arizona Society for Range Management Winter Meeting. January 22nd – 24th, 2020. Wickenburg, AZ. Approximately 50 participants.
- AVCA Community Meeting. May 20th, 2020. Virtual. Approximately 30 participants.
- AVCA Vegetation/Brush Management Field Day. October 16th, 2020. Approximately 10 participants.
Conferences/Workshops/Field Days Attended (2021):
- Society for Range Management Annual Meeting. February 15th-18th, 2021. Virtual.
- Arizona Society for Range Management Winter Meeting. February 4th, 2021. Virtual. Approximately 50 participants.
- Rangelands Partnership Annual Meeting. April 19th – 21st, 2021. Virtual. Approximately 30 participants.
- International Arid Lands Consortium. May 24th – 26th, 2021. Virtual. Approximately 100 participants.
- AVCA Community Virtual Meeting. May 26th, 2021. Virtual. Approximately 30 participants.
Conferences/Workshops/Field Days Attended (2022):
- Arizona Society for Range Management Winter Meeting. January 20-21, 2022. Virtual. Approximately 50 participants.
- Society for Range Management Annual Meeting. February 6th-10th, 2022. In-person.
- Rangelands Partnership Annual Meeting. April 25th – 27th, 2022. Virtual. Approximately 50 participants.
- Discovering the Land: Community, Science, and Partnership in the Sonoita and Patagonia Region. May 7th, 2022. In-person. Approximately 60 participants.
- AVCA Community Meeting. May 18th, 2022. In-person. Approximately 30 participants.
Training and professional development opportunities were provided for the graduate student, William A. Rutherford. Engaging in the development of the online resources and SEEDS/ShrubRisk development has provided him the opportunity to (i) build desired skills and experiences in Extension and Outreach (ii) be competitive in obtaining future employment within these job fields, and (iii) foster relationships with regional stakeholders interested in brush management. Rutherford successfully defended his dissertation in May 2022. Rutherford has performed multiple consultations with the Bureau of Land Management on a vegetation management Environmental Assessment for the Las Cienegas National Conservation Area including consulations with a regional conservation group (Altar Valley Conservation Alliance) and county officials (Pima County, AZ) on vegetation management treatment planning efforts. In addition, an open-sourced software container image was developed and released for performing any statistical modeling activity in the R programing language using the ‘Tidymodels’ package. The container image was initially created for development of the woody plant encroachment risk models and initial decision support tool development but is now shared in a Docker Hub repository for potential community use.