Final report for GW19-202
Project Information
Title: Climate mitigation through soil carbon sequestration: increasing soil resilience and plant productivity in rangelands through compost application
Climate change has already shifted temperature and precipitation levels in Colorado, making it hotter and drier. Due to these changes, ranchers are more inclined to improve their soil’s health, specifically the water holding capacity (WHC). By increasing the WHC of soil, ranchers can expect positive effects of increasing plant productivity. Soil’s WHC is extremely important in arid climates where ranchers rely upon flood irrigation during the spring and early summer. Once the irrigation is shut off, the water needs to sustain the grasses throughout the growing season until harvest. Typically, ranchers in the West harvest three cuts of hay during the season. In Gunnison, due to the short growing season of 62 days, ranchers only get one. Ensuring that a single cut of hay is as productive as possible is of vital importance to the ranchers whose livelihoods depend upon that yield. Improving the soil's WHC by increasing the soil’s organic matter (SOM) content has shown to promote plant productivity (Deng et al., 2016). In addition to increasing ecosystem resilience, compost additions can increase SOM content and soil organic carbon (C) storage thus providing a pathway to climate change mitigation. The soil microbial community can play an integral part in increasing nutrient availability to enhance plant production and the C sequestration potential of soils. This project addressed three questions related to soil health:
1) How does the application of compost increase the C sequestration potential of rangelands in this specific climate?
2) Does compost additions enhance SOM to increase the soil’s WHC?
3) What is the relationship between compost additions, soil microbial community structure and soil C sequestration?
These questions were addressed by conducting research on four ranches where we monitored the effects of two inches of compost addition on rangeland’s soil health throughout the growing season of 2019.
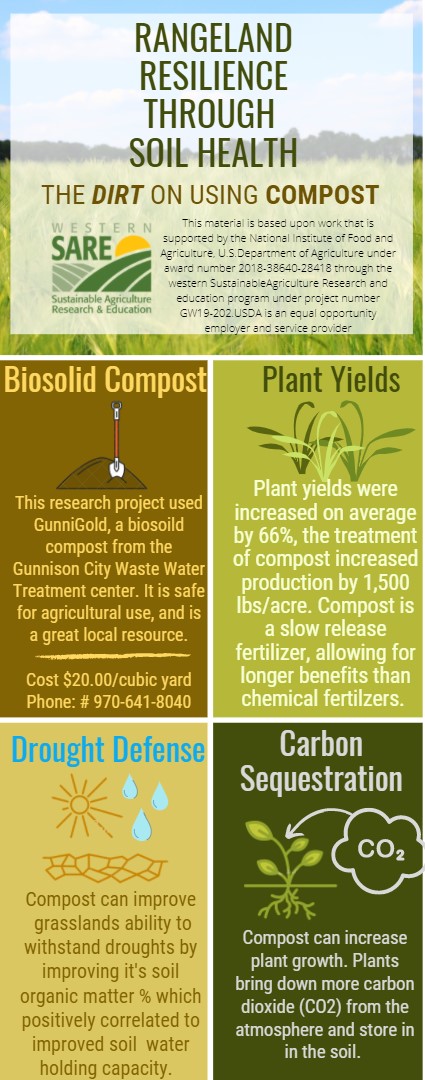
We found that a single application of a biosolid compost increased SOM, biomass production, and soil moisture. There was a general trend of increased SOM at all sites, but it was not a significant change (Fig. 1). The average increase of SOM across sites with the treatment of compost was 23% SE ± 4.7. Like SOM, there was a trend of an increase in the carbon pool size, but it was not a significant change (Fig. 2). There was a significant increase in biomass production across sites with the treatment of compost, with three sites having a significant change within the site (Fig. 3 ). The average difference in total biomass production between the control and treatment was 199.83 g/m2 (95% CI 133.6 – 266.1 g/m2) which was on average a 66% (SE ± 18) increase in biomass, see image 1. For producers, this management practice could increase the average yield by 4,405 lbs/ha. There was a trend of increased soil moisture in the treatment plots relative to the controls at each site for most of the growing season (Fig. 4). The addition of compost did not change the species richness at the treatment site (Fig. 5), nor the proportion of forbs to graminoids (Fig. 6). The pH of the soil was not significantly changed, but there was a trend of either decreasing or increasing the treatment site's pH closer to neutral i.e. a pH of 7.
Our findings can help to inform ranchers in this region with site-specific examples of how a biosolid compost amendment can help to support their ranching operations to withstand periods of droughts while improving the productivity of their irrigated pasturelands. Ranchers noted that the treatment sites were favored by grazing cattle, most likely from increased nutrient availability in the grasses from the compost. This study also hopes to prove that the use of a Class A biosolids compost is a viable option for a compost choice, and should be utilized within communities that have wastewater treatment plants that generate compost.
Another graduate student at Western Colorado University is currently conducting her research thesis at these sites. These sites are being maintained to study the long-term impacts of compost addition on soil health.
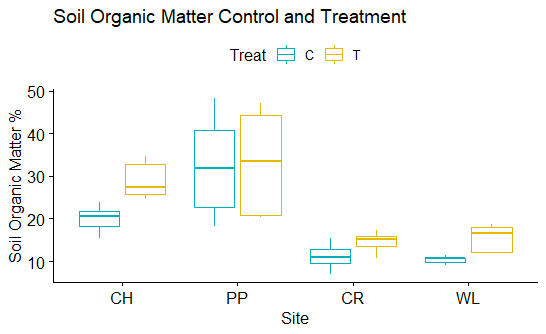
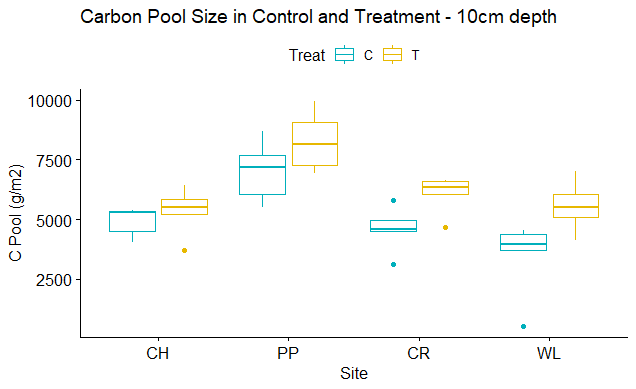
Figure 2: Carbon pool size changes in treatment and control across sites did not significantly change, but there was a general trend of increased carbon in the pool. This graph was generated off of the hypothesized 10 cm sampling depth. Not all sites were able to achieve the desired depth of core sampling. A hypothesized depth of 10 cm across sites was used to gain clarity in the effects of this treatment across sites.
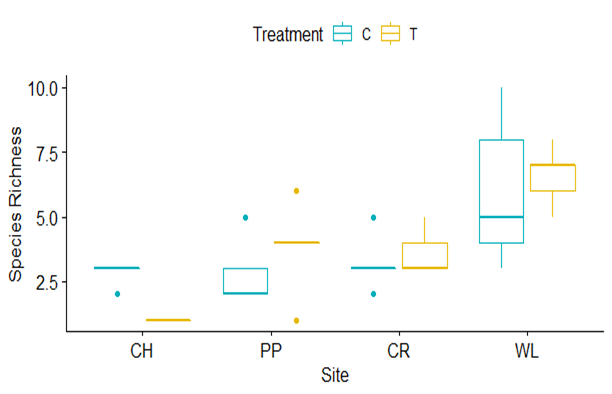
Species Richness between Control and Treatment
Proportion of Forbs to Graminoids at Control and Treatment
The goal of this research was to provide ranchers and rangeland managers with site-specific research on how to compost amendments in this climate impact their land's soil water holding capacity, ecosystem resilience to climate change, and potential for climate mitigation through soil carbon sequestration.
With additions of compost to rangelands we expected to:
- Increase soil health, specifically looking at soil moisture and SOM.
- Increase plant productivity
- Foster increased soil carbon sequestration.
- Better understand the role of soil microbial community structure in influencing soil carbon sequestration.
An additional objective:
5. We assessed ranchers’ needs and interests in improving soil health and shared the results of this study with the community in order to inform future land management practices.
To achieve objective 1 (increase soil health), we quantified differences in soil pH, moisture content, organic matter, and bulk density between rangelands sites treated with compost versus untreated sites. To determine changes in the soil’s water-holding capacity (WHC), soil moisture was monitored (volumetric water content % ) throughout the growing season.
To achieve objective 2, we measured differences in plant biomass between the treatment sites and control.
To achieve objective 3, we quantified the amount of carbon that had been sequestered in the soil in the treated and control sites.
To achieve objective 4, we measured soil microbial community structure and respiration in the treated and control sites.
To achieve objective 5, we held a soil health workshop for the local agriculture community.
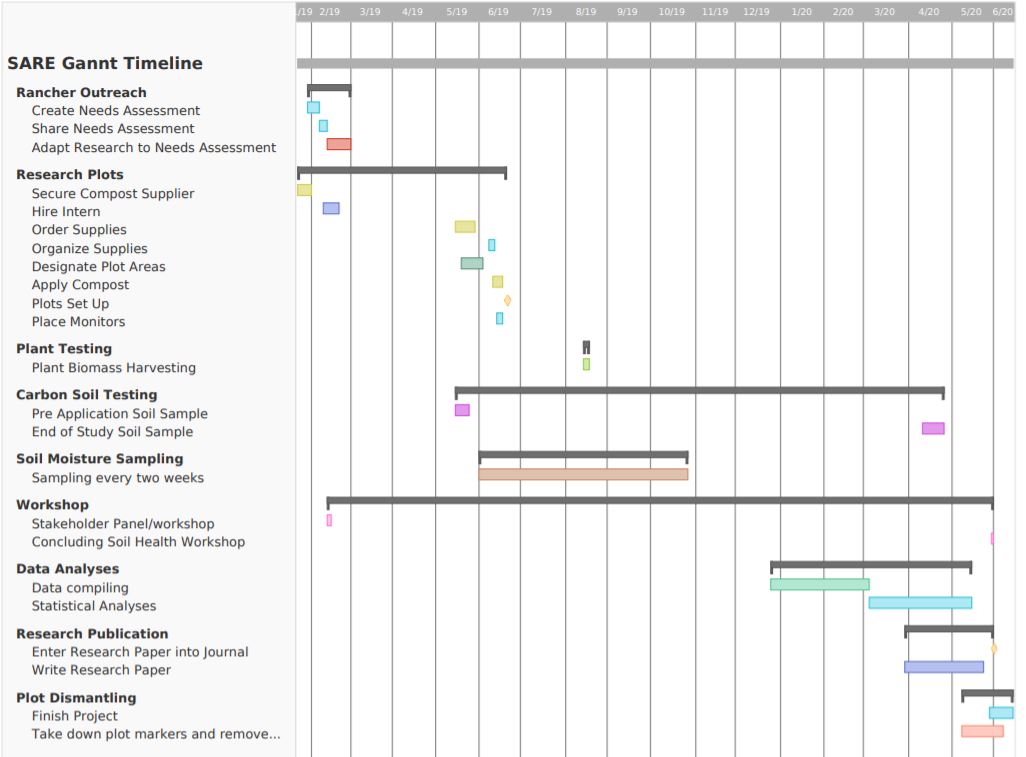
Timeline Discussion
The project will be conducted over one year (May 2019-May 2020). In the late winter 2019, we will have stakeholder panel, where we will conduct a pre-survey about land management goals and current adoption of sustainable farming techniques and soil health practices. A. Cooper will create a needs assessment for the local ranchers whose land this research will be conducted on, to learn about their land management goals and agricultural needs. From the results of the needs assessment, we will adapt our research to reflect their needs. In the early spring, we will begin the planning and organizing for the creation of our research plots. For our research plots, we will need to secure our compost for the research through the supplier GunniGold. We will also conduct interviews for an undergraduate technician. Ordering research supplies and organizing them for each site once funds have been dispersed. In early May we will designate the research plots and then apply compost. Then we will place our monitors. A milestone is the completion of the plot set up. Field sampling will occur through the growing season and the project will conclude in May of 2020 with a workshop.
Cooperators
- - Producer
- (Educator)
- - Producer
- - Producer
- - Technical Advisor
Research
Study Area
This study was conducted at four sites located on perennial semi-native pastures in the Gunnison Valley in South Western Colorado (Lat. 38°32'45'' N, Long. 106°55'31'' W; elevation 2,348m). Gunnison is located at the bottom of several valleys in the Southern Rocky Mountain region. The mean annual air temperature in this region is approximately 2.8 °C, with an average of -6.4 °C in the winter and 12.0 °C in the summer (Lukas, 2014). The mean annual precipitation is 270 mm, with an annual snowfall of 144cm. The majority of the water that the Gunnison Valley agriculture utilizes water from the Taylor River and Tomichi Creek, which are considered to be the headwaters of the Colorado River. The Gunnison Valley contains a variety of ecosystems and is primarily riparian grasslands, sagebrush steppe, and sub-alpine pine forests.
Rangelands in this region vary from native grasslands, to previously seeded hay fields converted into pasturelands. Plant communities in these rangelands are dominated by: Meadow Foxtail (Alopercus. pratensis), Kentucky Bluegrass (Poa pratensis), Timothy (Phleum pretense), Alsike Clover (Trifolium hybridum), Mammoth Clover (Trifolium hybridum L), Dandelion (Taraxacum officinale). Known and present invasive are Curly Dock (Rumex crispus), Canada thistle (Cirsium arvens) and Prostrate Knotweed (Polygonum aviculare). The soils in this area are comprised of a Mysten series, which consist of excessively drained soils that formed in neutral or slightly acid sandy alluvial sediments derived mainly from granite (National Cooperative Soil Survey, 1975).
The study sites were named after the ranches they were located on: Coldharbour Ranch (CH) (Lat. 38.52098, Long.-106.78583), Wiley Lane Ranch (WL) (Lat. 38.62508, Long. -106.95143), Parker Pastures (PP) (Lat. 38.56311, Long. -106.93822) and Cranor Ranch (CR) (Lat. 38.59816, Long. -106.88023). The four study sites are all located within 30 km from each other (Fig. 3). Sites vary in their land management but are all flood irrigated from early June to August 2019. All sites have been grazed but duration, frequency and density of grazing varies across sites.
Study Design
In the spring of 2019, at each site, five paired replicate plots, control and treatment, were established for a long-term ecological study. Treatments consisted of untreated controls and composted biosolid organic matter amendments. Plots were 10 X 5 m in size buffered by a 1 m buffer strips between plots and a > 10 m buffer between control and treatment arranged in a split-plot design. Each site was 40 m x 39 m, due to the 5 m bleed around the edge and a 10 m bleed between treatment and control. The study design created 4 sites x 2 treatments x 5 replicates for a total of 40 total plots (see image below). We chose this design of a split-plot to try and limit the amendment drifting from treatment to control from flood irrigation. Recommendations for future studies, I would have done a paired control and treatment instead.
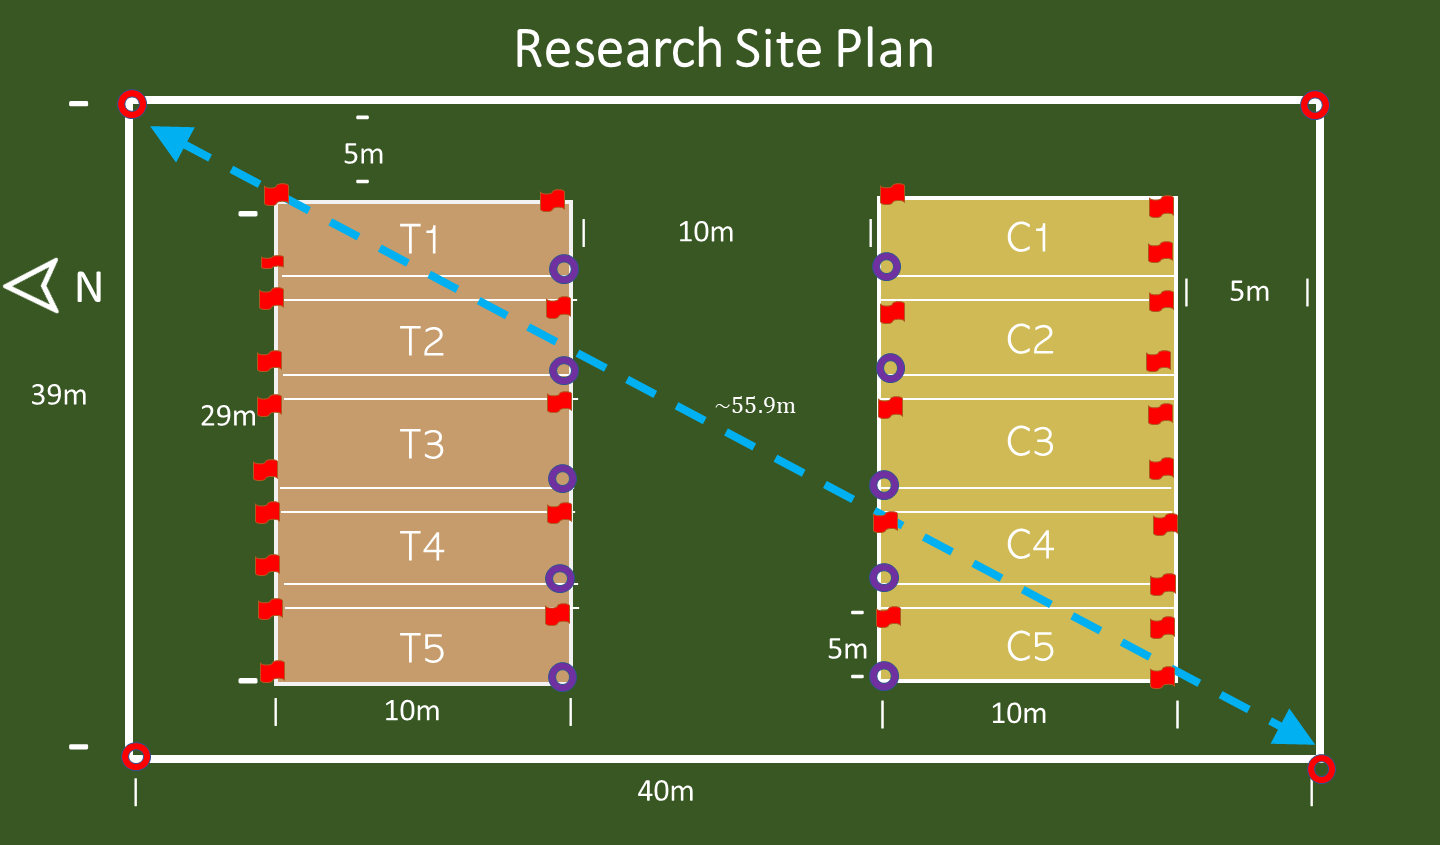
Site plan for each CH, CR, PP, and WL. Shows the 5 replicates, T1-5 is the treatment of compost C1-5 is the control.
Treatment Application
A Class A bio-solid compost, “GunniGold,” was applied to all sites over a weeklong period from June 17th to June 21th, 2019. The compost application rate was 5 cm per treatment plot. This compost was purchased from the City of Gunnison Waste Water Treatment Plant (GunniGold Site) and has been proven to be a safe and viable option for agricultural use by the EPA’s rigorous testing procedures (Allen et al., 2013). To avoid compaction, the compost was dumped outside of the site areas by a dump truck, then wheelbarrowed, and raked into the treatment plots. If you are not concerned with compaction of soil, I would recommend using a dump truck to apply the compost or a manure spreader to save time and energy.
Land Management
The four research sites are under different management strategies provided another type of variable ‘site’. Specific aspects of site differences include but are not limited to, grazing practices, water management i.e. length of time flood irrigation was used based on Colorado water right status, and species diversity. These sites will provide another layer of insight into how land management practices affect soil health, biodiversity, and plant productivity.
Data Collection
Drone footage
Drone footage was captured throughout the summer of the project to provide visual aids in observing the changes in biomass from June to October, each month.
Species Diversity
Within each plot, species diversity was measured using the point grid intercept method (Godínez-Alvarez et al., 2009) which is an objective way to sample cover and species diversity (Bonham 1989). A 0.5 m x 0.5 m PVC quadrat frame with 25 intercept points, delineated by intercrossing strings, was used to sample vegetation. A wooden dowel, 1m long with a diameter of 4.76 mm was used as the sampling pole. Crosshairs of a grid quadrat are considered points and the vertical interception of the dowel with plant parts were considered hits. Plant species or ground cover classes that touched the dowel are recorded as “hits”. Ground cover classes were recorded as bare ground, litter, or compost. Percent species composition of each functional group was calculated by totaling the number of species present, then finding the proportion of the total by each species. Species richness was calculated as the # of present species in each plot’s quadrat point intercept.
Biomass Harvest
Aboveground plant biomass (AGB) was measured at the height of the growing season between August 12 and August 18, 2019 when the plant productivity had reached its nutritional peak. In each plot across all four sites, AGB was harvested on the same quadrats that were measured for species diversity. Live and standing dead plant biomass was clipped to the ground and brought back to the lab and sorted into functional groups of standing dead graminoids, live graminoids, and live forbs. Dead forbs were not sorted from live forbs due to the fact they are annuals, and we are assuming all dead growth found is from this year. The dead graminoids were sorted out to inform the impact of different grazing practices effects on standing dead forage. After sorting, the samples were dried in paper bags in an oven at 65 °C for a minimum of 48 hours and then weighed in the bag. 5 paper bags of each size were also dried at 65 °C and then averaged to create a correction of bag weight in the biomass weight. For analysis of total biomass for all sites, we combined the total live forbs and graminoids. The total biomass was then converted from grams to grams per meter squared.
Soil Properties
Soil samples were collected in each plot at each of the sites in late September of 2019, just 4 months after the application of compost. Samples were collected at the soil depth of 0-10 cm using an AMS Bulk Density Auger (Forestry Suppliers, Mississippi, USA) with a diameter of 5 cm. This depth was informed by the typical root depth of grazed rangeland grasses for the area (Shuster, 1964; Tan, 2005). To characterize the variability in soil C within each plot, three replicate soil cores were taken from each plot then pooled for analysis (n = 10 per site). Before soil analysis, each sample was homogenized by hand and the > 0.2 mm diameter coarse fraction (e.g., roots, belowground stems, and coarse woody debris) and rocks were removed. The mass and volume of the rocks were subtracted from the initial soil weight and the soil core volume.
The soil water content was calculated by subtracting the weight of soils dried at 105 °C for 48 h, from the wet weight of soil, and then dividing that amount by the dry weight of the soil. Bulk density was determined by dividing the oven-dried soil mass by the core volume. From the field wet soils, pH was found using a pH Triode (VWR Scientific, Pennsylvania, USA). A water slurry method was used with a 1:2 soil to water ratio (Mclean 2015).
Field Soil Moisture
Soil moisture content was measured in the field using HydroSense II (Campbell Scientific, Utah, USA) soil moisture probes with 12 cm probes that provide the volumetric water content of the soil in percentages. Sites were sampled for soil moisture consistently between 12:00 pm (MST) to 4:00 pm (MST), once a week starting on July 27, 2019 ending October 28, 2019. Each plot was measured within a 3m ‘zone’ three times during a session to create a better reference of the variability of moisture within the plots for each sampling period.
Soil Organic Matter
Soil organic matter (SOM), was determined using the loss on ignition method (Heiri et al., 2001). Air-dried homogenized soil was dried at 105 °C for 24 hours and then 5 g of soil was weighed in porcelain crucibles. The crucibles were heated for 1 h at 375°C in a muffle furnace, cooled to 150 °C. , then weighed. Soils were placed into a muffle furnace for 4 hours at 550°C. After the samples were cooled to 150 °C, they were placed into a desiccator for 30 minutes to cool to room temperature before weighing. To calculate percent organic matter, the crucible weight was subtracted from the post ignition weight plus crucible weight to give us the post ignition soil weight. To calculate the % SOM, the dry weight (g) of the sample after combustion at a temperature 550 °C was subtracted from the initial dry weight (g), dried at 105 °, divided by the dried weight (g) of the sample pre-combustion, multiplied by 100.
Soil Organic Carbon
The % SOC was estimated by dividing the % SOM by a factor of 2, with the assumption that half of the SOM was SOC (Pribyl 2010). To calculate the SOC (g C/ m2), % SOC was multiplied by bulk density and soil sampling depth then converted to grams per meter squared. To provide the ability to compare SOC pools between the sites' various sampling depths, the SOC pools were standardized to a depth of 10 cm, which influences BD. But the true depth was also calculated to understand how certain sites would be advantageous for this approach due to their soil depth.
Statistical Analysis
Linear regression models were used on the variables: biomass, SOM, SOC, to understand how site, treatment, and chosen variable responded to the treatment of compost. The four research sites are under different management strategies which provided another type of variable ‘site’. Two-way Analyses of Variance (ANOVA) were used to identify significant treatment effects on soil organic C, soil moisture, SOM, soil temperature, biomass production, and net ecosystem C storage. Site and Treatment were considered the main effects with site x treatment as the interaction term. Statistical tests were performed using R (R Core Team, 2013). Variables that were not normally distributed were log-transformed or Tukey Power of Ladders transformed to meet assumptions for ANOVA. If an ANOVA showed a significant treatment, it was then followed by a Tukey Post Hoc test to see if significance was within site control and treatment. Data are reported either as mean values or treatment differences followed by ±SE. Statistical significance was determined as P< 0.05 unless otherwise noted.
Species Richness
The vegetation communities at the study sites are strongly dominated by perennial grass and annual forb species. Across sites, species richness ranged from 1 to 10 with WL having the highest richness and CH site the lowest richness (figure 5). There was a significant difference in species richness across sites (F1,3 = 18.6, p= 3.81e-07). There was not a significant difference between treatments within a site ( F1,3 = 0.153 p= 0.6985). The interaction effect between site and treatment was significant ( F3,3 = 4.103, p= 0.0143), a post hoc test revealed that the significance was between sites not within.
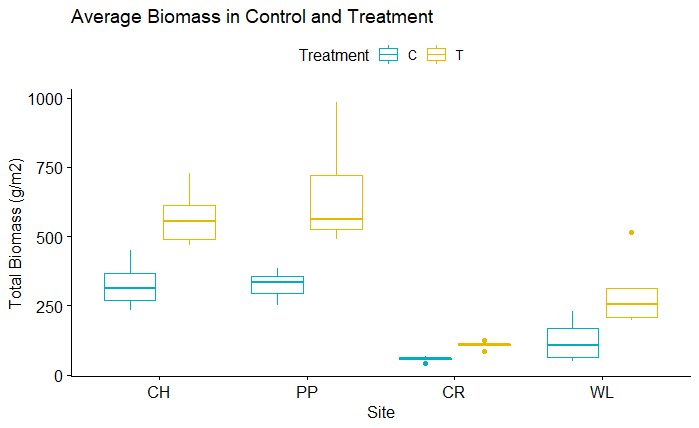
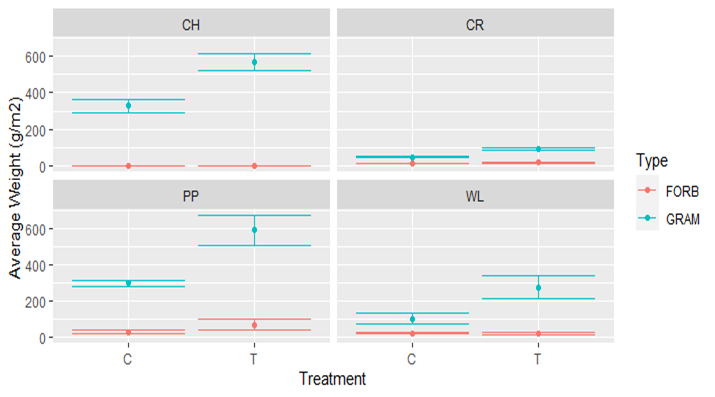
Aboveground Biomass
Total biomass production was highly variable across sites and treatments, ranging from 57 to 656 g/m2 SE ± 76., with PP having the most biomass production and CR the lowest (figure 2). There was a significant change in plant biomass across sites (F3,3 = 62.3, p=1.87e-13), Plant biomass was significantly different with the treatment (F1,3 = 43.2, P = 4.67e-08). There was not a significant interaction effect between site and treatment (F3,3 = 1.1, P = 0.37). The three sites that had a significant change in production were CH (P= 2.61e-02), PP (P= 2.48e-03) and WL (P = 4.41e-03). The average difference in total biomass production between the control and treatment was 199.83 g/m2 (95% CI 133.6 – 266.1 g/m2) which was on average a 66% (SE ± 18) increase in biomass. One site did not have a significant response to the amendment, CR (P= 0.442).
Soil Properties
pH
Soil pH across sites ranged from 6.61 to 7.88, with CR having the most acidic soil and CH having the most alkaline soil. The average pH of the biosolid compost was 6.7 ± SE 05. There was a trend of the treatment sites becoming more neutral i.e. closer to a pH of 7, with the addition of compost. pH was significantly different across sites (F3,3 = 18.1,P= 4.92e-07) but not between treatment and control plots (F1,3 = 0.33, P=0.57). There was not a significant interactions effect between site and treatment (F3,3 = 1.76, p= 0.17).
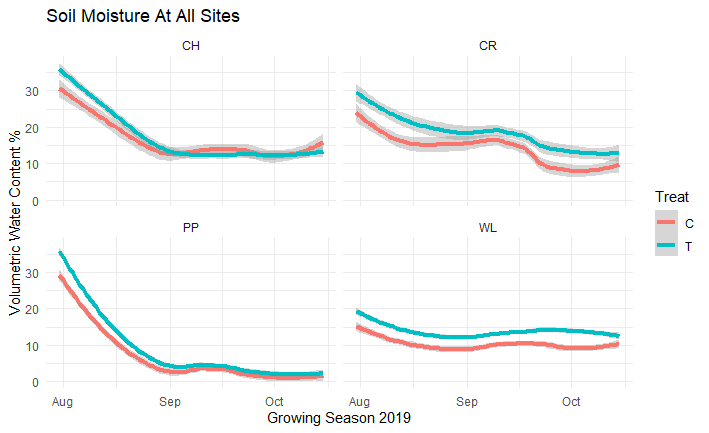
Field Soil moisture
There was a trend of increased soil moisture in the treatment plots relative to the controls at each site for most of the growing season (July-Oct). The highest soil moisture was measured in July and the lowest in September (figure 4). Soil moisture was significantly different across sites (F3,3 = 182.3, p=2e-16). There was a significant effect for treatment (F1,3 = 54.5, p= 2.77e-12). The site*treatment interaction was also significant (F3,3 = 6.7, p= 1.8e-04). With a post hoc TukeyHSD, there was a significant difference between sites and across sites. Between sites, there were two sites that had a significant difference between control and treatment throughout the season: CR (p<0.00005) and WL (p=2.0e-06).
SOM
Percent SOM varied widely across sites with PP having the highest average SOM (32% SE ± 5.6) in the control site and WL having the lowest mean SOM (10% SE ± 0.38) in control. There was a general trend of increased SOM between control and treatment at each site (figure 1). After application, the biggest change in SOM was measured at WL, which had an average increase of 49% resulting in an average treatment SOM of 15% compared to 10% in control. While the smallest change was observed at PP, with just a 2% increase in its already high SOM content, control was 32% while treatment was 33%. SOM was significantly different across sites (F3,3 = 30.5, p= 1.66e-09). The treatment across sites was significantly different in regard to SOM, (F1,3 = 10.6, p= 2.68e-03). There was not a significant interaction between site and treatment (F3,3 = 1.01, p= 0.40). The post hoc test showed that the SOM between control and treatment within sites was not significant: WL (P=0.3063480), CR (P=0.6579520), CH (P=0.3461440), and PP (P=0.9999997). The average increase of SOM across sites with the treatment of compost was 23% SE ± 4.7.
SOC Pools
The ranges of SOC across the sites control plots in the actual sampled depth was 3.5% to 24.2% A two way ANOVA test found that the variable of site was significant (P=2.75e-6), along with the variable of treatment (P=0.000769). There was a general trend of increased carbon pool size with treatment (figure 2). There was not a significant effect of the treatment*site effect. With a post hoc Tukey test, it seems the significance found was between sites, not within sites treatments
Research outcomes
Education and Outreach
Participation summary:
Newspaper Article:
https://www.gunnisontimes.com/news/soil-health-target-research
I was interviewed by a local newspaper the Gunnison Times about my research on compost amendments. Attached is the article. This was a great opportunity to share the current status of my research with my local community - it was on the front page! I was excited when the author reached out to me to share my story and was extremely happy with the way he communicated the science to the readers.
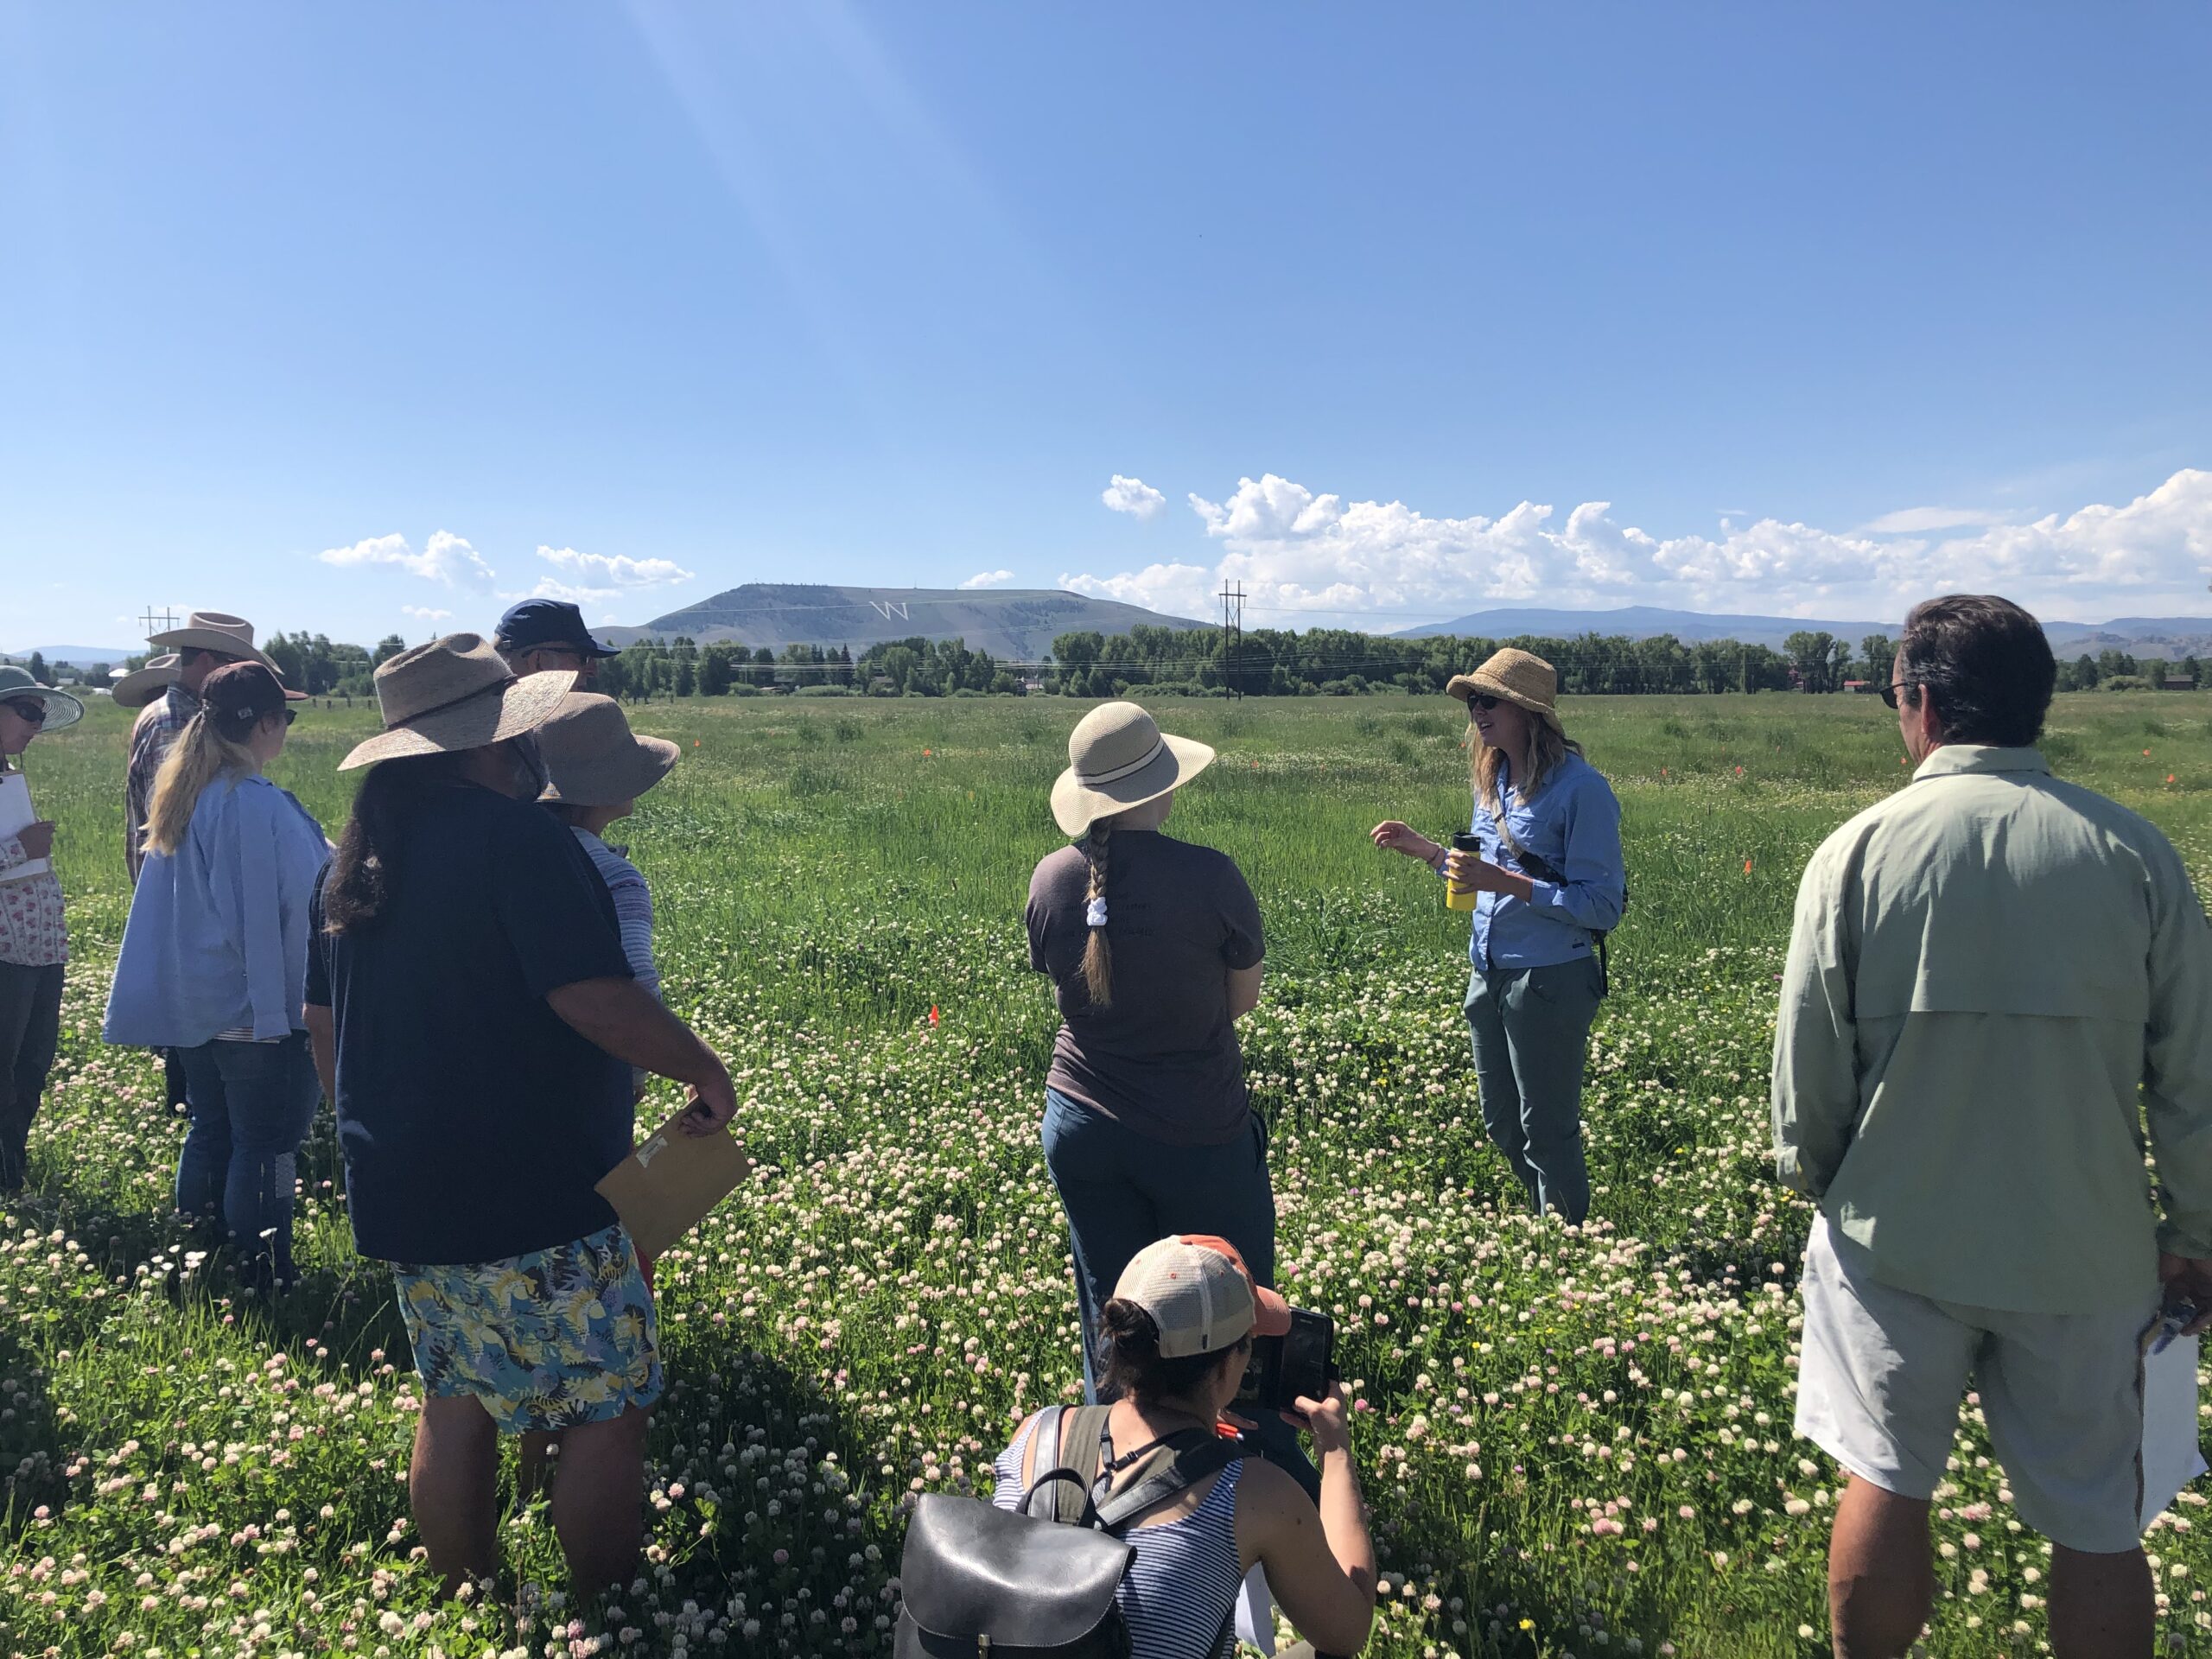
Field Day:
At Parker Pastures, they held a holistic land manager workshop in which I took a group out to my field sites to share my research goals and how it was going so far.
Documentary:
I was interviewed for a documentary about soil here in the Gunnison Valley and our composting efforts. They were compared and contrasted against a similar approach in South America. The documentary should be out in the Spring of 2021.
Blog article:
https://www.coldharbourinstitute.org/research-blog/category/compost
Above is a research blog I wrote for my community sponsor Coldharbour Institute. I discussed our compost approach to address community needs.
Final Masters Presentation:
<iframe width="560" height="315" src="https://www.youtube.com/embed/ap49pXyxvkc" frameborder="0" allow="accelerometer; autoplay; clipboard-write; encrypted-media; gyroscope; picture-in-picture" allowfullscreen></iframe>
Conference Presentations --
Hawaii Agricultural Conference October 2019
I flew to Hawaii to present my work at their Agricultural Summit. There I made connections with producers and scientists in the field.
Four Corner Symposium September 2019
I presented my work at a local symposium held at Western Colorado University to discuss land management in the four corners area.
Rangeland Society Conference March 2020
I presented my research at the above conference and networked with rangelands specialists, producers, and researchers.
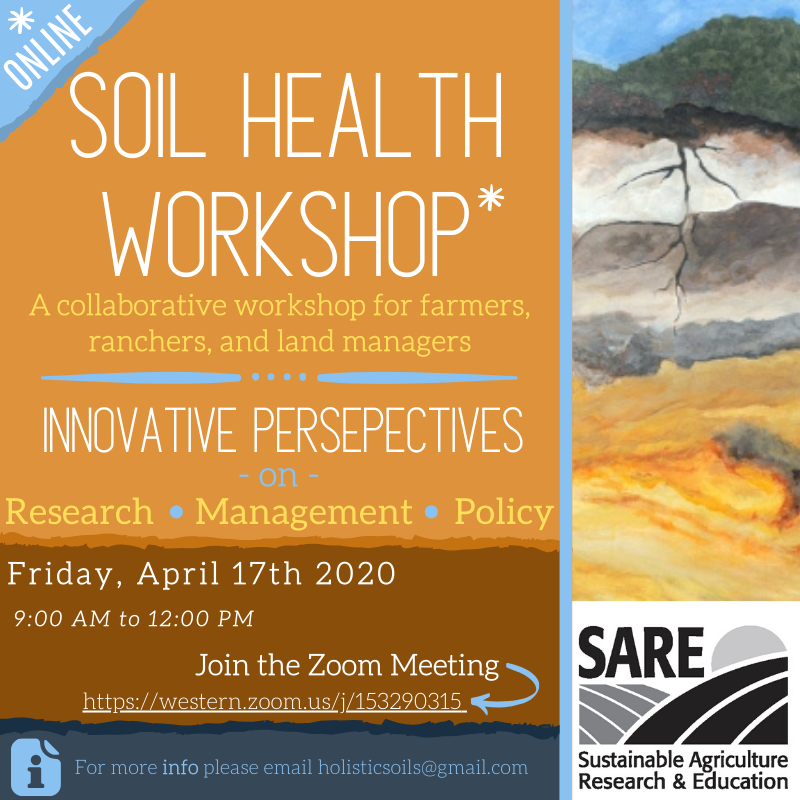
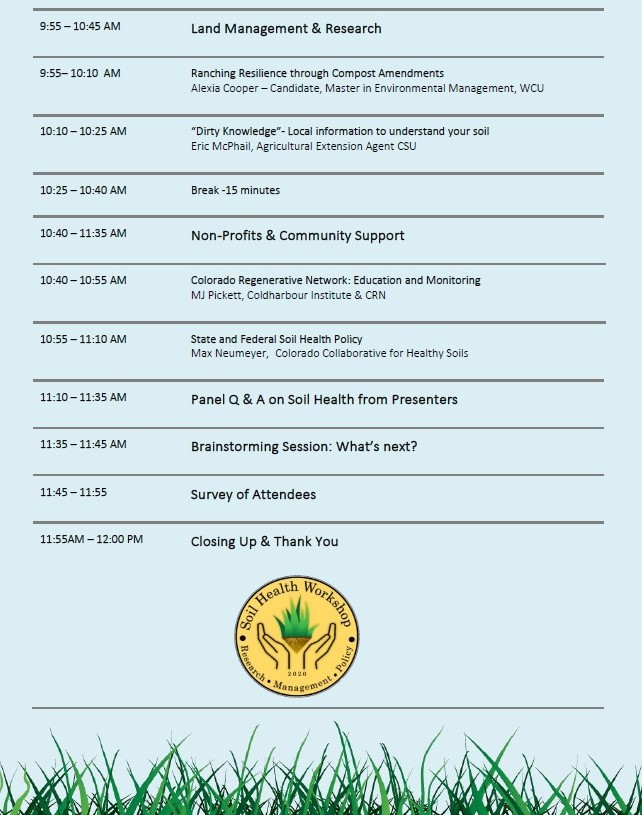
Soil Health Workshop April 2020
I held a soil health workshop in April of 2020 online due to COVID-19 restrictions to 30+ attendees ranging from students and professors to farmers and ranchers.
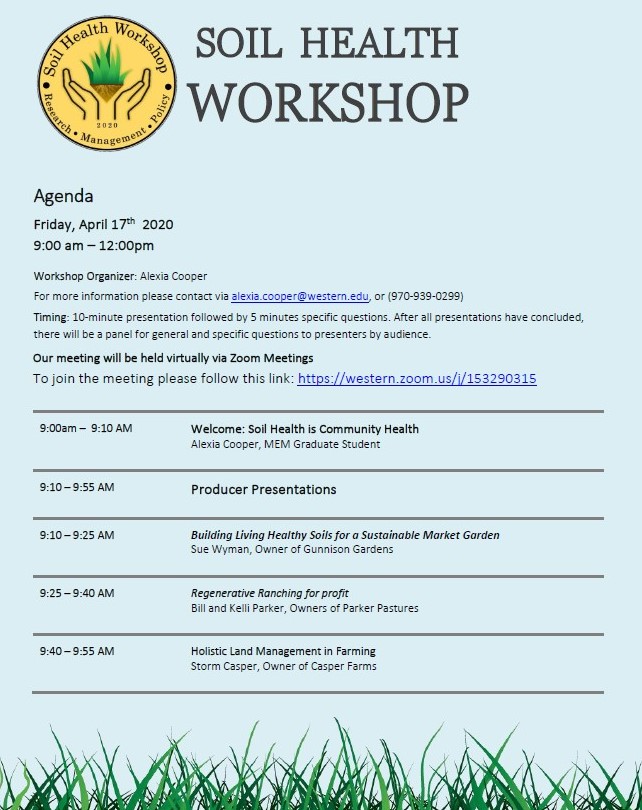
Agenda for the workshop
Curricula, factsheets, or educational tools:
Patreon Lecture:
Factsheet:
The logo I created for the workshop.
Kiosk Posters