Final report for GW20-214
Project Information
Conceptualizing cattle as partners in conservation would be a win-win for the livestock and rangeland conservation sectors, resolving the [often] paradoxical objectives of food production and natural resource management. For millennia the ecology of grasslands, characterized by high quality forage and profuse biodiversity, has supported large herds of herbivores. In turn herbivory has contributed to the maintenance of those ecosystems. However, a debate over the use of government-owned rangelands for cattle grazing is ongoing at local, national, and global levels. Amplifying the issue for conservationists and livestock producers alike is the notion that more land is used to raise cattle than is used for all other agricultural production combined.
To learn more about the collaborative grazing management that occurs across Colorado’s rangelands, we conducted a holistic investigation of four partnerships between private ranchers and government-owned land managers. We evaluated three system components - ecological, economic, and social - to answer our overarching question: How do strategic grazing partnerships on multi-use public landscapes achieve the dual goals of assisting land management agencies with natural resource conservation, and ranchers with maintaining sustainable beef production?
Themes we explored included soil health, plant community, forage quality, ecosystem services, and the human dimension (socio-cultural values). Results will be used to support collaborating ranchers and government-owned lands agencies by informing how cattle may be managed as tools for conservation while producing a sustainable food product. We also created an integrated agent-based model to broaden applicability to collaborative rangeland management efforts in other regions.
The following objectives incorporated variables relevant to the model of sustainability. The three ecological objectives included soil health, plant community, and forage quality studies. Soil organic carbon and nitrogen, water infiltration, plant community composition and biodiversity, and forage quality are well established indicators of rangeland health and sustainable agriculture. In a time when climate change is an imminent threat, carbon sequestration and nitrogen management also provide solution-focused strategy for mitigation. The socio-economic objective investigated stakeholders’ valuation of ecosystem services produced by collaborative conservation. Evaluating socio-cultural values as drivers of decision-making provides a method of emerging importance in sustainability science.
- Examine the outcomes of collaborative grazing management on soil health as measured by levels of a) organic carbon, b) nitrogen, and c) water infiltration, over a 2-year period.
- Examine the outcomes of collaborative grazing management on plant community as measured by a) plant species diversity (richness and evenness), and b) composition (functional groups), over a 2-year period.
- Examine the outcomes of collaborative grazing management on forage nutritive quality as measured by a) crude protein, b) acid detergent fiber, and c) neutral detergent fiber, over a 2-year period.
- Identify and evaluate the unique sets of values and perceptions toward ecosystem services among collaborative grazing management stakeholders and investigate how the prioritization of these values drive dynamic decision-making.
This project will be completed in partial fulfillment of a PhD program for the graduate student applicant. Therefore, the 2-year Western S.A.R.E. grant timeline encompasses only a portion of the entire program (Figure 5). The project officially started with the academic semester of Fall 2019. For the first 2 academic years, the graduate student will complete required coursework at Colorado State University, in addition to carrying out the research objectives illustrated in the chart below. During the first 2 years, 16-28 stakeholder interviews will be conducted (Objective 3) and bi-annual meetings with producers will also take place in order to report on, evaluate, and discuss research progress. During months following the completion of interviews, transcription and coding of the interviews will take place. During the period of peak vegetative growth, July-September of 2020 and 2021, ecological data including soil, vegetation,and forage samples will be collected (Objectives 1, 2, & 3). In months following each of these data collection periods, samples will be sent for lab analysis. During peak recreation season, June-September of 2020 and 2021, public recreationer surveys will be conducted on each of the 4 study sites (Objective 4). Although the term of this grant will end July 31, 2022, the graduate student will continue processing and synthesizing data throughout the year 2022, within which time she will be completing her dissertation, presenting her results to stakeholders and at professional conferences, and pursuing publication as described in the other sections of this proposal.
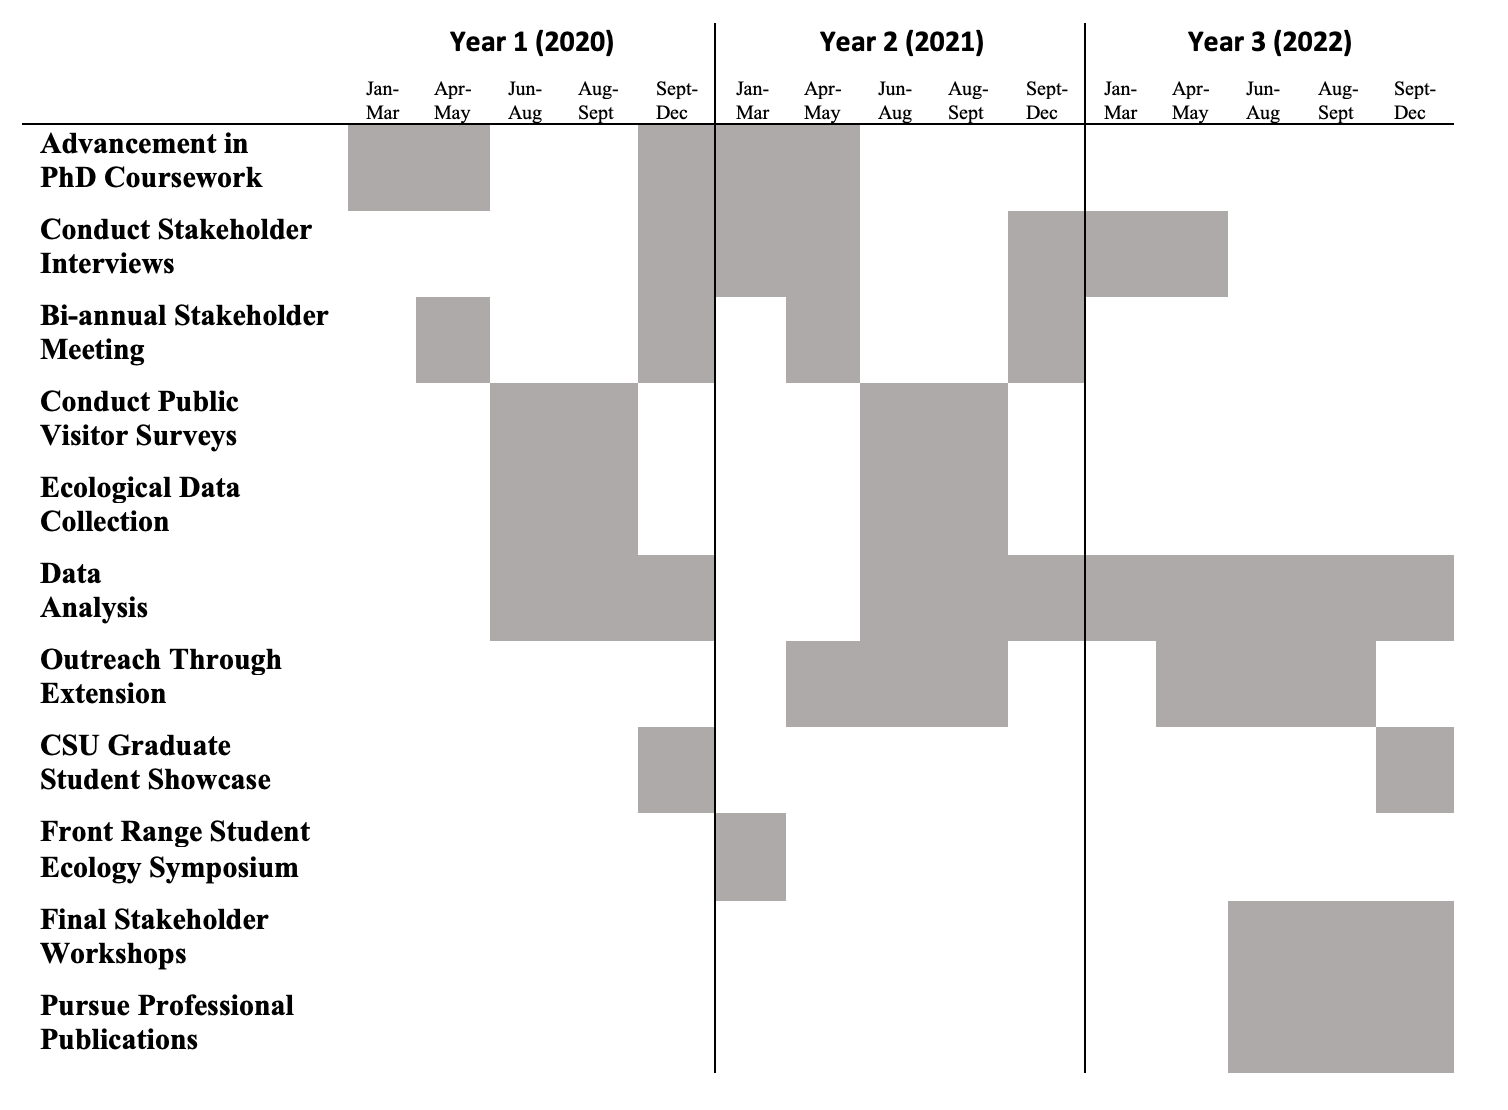
Figure 5. Three-year timeline of graduate student research plan and deliverables. Although the S.A.R.E. grant will span from August 1, 2020-July 31, 2022, prior months in 2020 and remaining months in 2022, are also noted on the timeline to portray the broader scope of the student’s program.
Cooperators
- - Producer
- - Technical Advisor
- - Technical Advisor
- - Producer
- - Producer
- (Researcher)
- - Producer
- - Technical Advisor
Research
To learn more about the collaborative grazing management that occurs across much of Colorado’s Rocky Mountain rangelands, we conducted a holistic investigation of partnerships between private ranchers and government land agencies on the Northern Front Range over a 2-year period. Our research process addressed the stewardship of these rangelands as complex social-ecological systems where livestock production and natural resource conservation are woven together in a tapestry of management, culture, and science. We quantitatively and qualitatively evaluated three system components - ecological, social, and economic.
Two field seasons, 2020 and 2021, of ecological data collection were completed on four Colorado Northern Front Range multi-use conservation areas that include cattle grazing leases in their management plans: Coalton Trailhead Open Space (CTO) in Boulder County, Soapstone Prairie (SSN) and Coyote Ridge (CRN) Natural Areas in Larimer County, and Lowry Ranch (LRR) in Arapahoe County (Figure 1).
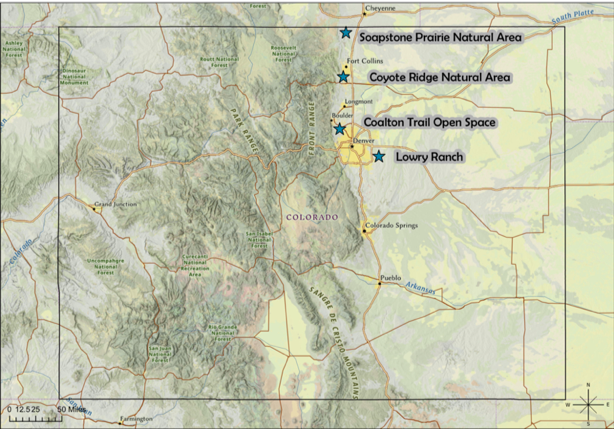
Figure 1. Map of 4 Northern Front Range study sites located in Larimer, Boulder, and Arapaho counties.
The following methods were followed:
Ecological Component: Field Sampling
A total of six, 50 m linear transects were place on each of the four study sites. At each study site, 4 transects were randomly located in areas under long term grazing management (grazed transects), and 2 transects were located in areas that have been excluded from cattle grazing for a minimum of 10 consecutive years (ungrazed transects). Transect locations were selected based on similarities of slope and soil texture across study sites and were placed with adequate distance, at least 20 m, to fence lines or water troughs to reduce the effects of heavier hoof traffic around those areas. Soil scientists from the National Resource Conservation Service (USDA) conducted expert in-depth soil profile analyses to verify biological consistency across transect locations.
Soil health and plant community data were collected during peak vegetative growth July 14-August 11 in two consecutive years, 2020 and 2021. Forage quality data were also collected each year, earlier in the growing season, May 17- June 18, prior to cattle grazing. Specific variables were measured and analyzed in association with each of the three data categories (soil health, plant community, forage quality) (Table 1).
Table 1. Categories of study response variables coinciding with grazing and land management goals.
|
Soil Health Total nitrogen Organic carbon Water Infiltration |
Plant Community Biodiversity Relative abundance: species functional groups Relative abundance: native vs exotic species |
Forage Quality Crude protein Acid detergent fiber Neutral detergent fiber |
Soil Health: To test the hypothesis that collaborative grazing management on public lands will improve soil health as indicated by levels of organic carbon (OC), nitrogen (TN), and water infiltration (WI), samples were collected to a 20cm depth, using a 8.25 cm diameter soil auger. Soil cores were extracted from one random location within a 25 cm x 25 cm quadrat placed at 10 m intervals on alternating sides of each transect and at a 1 m minimum distance from the transect. Each core was divided into 2 sub-cores 0-10 cm and 10-20 cm to be processed individually for a total of 10 subsamples per transect (5 at each depth).
WI was calculated using the single-ring infiltrometer method to test the hypothesis that grazing management on public lands improves hydrologic function. A 15.24 cm diameter ring was placed along each transect at 10 m intervals, within each soil sampling quadrat, for a total of 5 subsamples per transect. Using a graduated cylinder, 440 mL of water was poured into the ring to create a 2.54 cm depth. Infiltration rates were measured as the unit of time for water to completely penetrate the soil surface.
Plant Community: To test the hypothesis that collaborative grazing management improves above-ground biodiversity, the Daubenmire cover class method was used to collect data on plant species richness, evenness, and composition by functional group. Along the right side of each 50 m transect a random point between 0-100 cm was selected for the placement of the first 20 cm x 50 cm frame. Consecutive frames were placed every 1 m thereafter for a total of 50 subsamples per transect. The rectangular frames were placed perpendicular to the transect to improve capture of biological variability. Canopy cover class was determined in each frame, and the mean value of each class range was entered into statistical analysis. Bare ground, litter, and manure were notated in sampling when applicable. Standardized photo points were taken at each transect end looking toward the transect, and over every 5th Daubenmire frame from a 1 m height.
Forage Quality: To test the hypothesis that collaborative grazing management improves forage nutritive quality as indicated by 3 components: crude protein (CP), acid detergent fiber (ADF), and neutral detergent fiber (NDF), 6 forage quality samples were collected within 0.25 m x 0.25 m frames at 8 m intervals, alternating sides of the transect and 2-10 m from each transect. All standing biomass rooted within the frame was clipped at ground level.
Ecological Component: Lab/Data Analysis
Soil Health: Samples were stored in individual bags, air-dried for a minimum 2 weeks, then finely ground using a mechanical porcelain pestle. Samples were analyzed for percent total carbon and percent TN as determined by combustion analysis (Nelson 1982) using the Velp 802 CN analyzer (Velp Scientifica Srl, Usmate Velate, Italy). Inorganic carbon was analyzed using the Modified Pressure-Calcimeter Method. Percent inorganic carbon was subtracted from total carbon to determine percent OC. Raw data from quadrats were treated as subsamples and averaged across each transect. Permutational Multivariate Analysis of Variance (PerMANOVA) was used to compare estimates of soil OC, TN, and WI rates in grazed versus ungrazed areas, within and between study sites, for each year of data collection.
Plant Community: Raw data from Daubenmire frames were treated as subsamples and averaged across each transect. Canopy cover class data were used to characterize plant species composition by functional groups: cool-season graminoids (C3), warm-season graminoids (C4), Forb, Shrub, and annual graminoids (AnGram), and origins groups: Native and Exotic. Nonmetric Multidimensional Scaling (NMDS) was employed to fit plant species data, using soil and forage quality variables as gradients, to ordination plots comparing grazed and ungrazed areas within and between the 4 study sites. Shannon diversity index (SDI) was used to characterize biodiversity using plant species richness and evenness estimates and compared in grazed and ungrazed areas using PerMANOVA.
Forage Quality: Samples were oven-dried at 55°C for a minimum of 3 days, ground to pass through a 1-mm sieve using a Wiley Model 4 grinder. These finely ground samples were then be analyzed with Near Infrared Reflectance Spectroscopy (NIR) using a Spectrastar XT 2600 XT-R, Reflectance monochromator (680 –2600 nm). NIR was calibrated for detection accuracy using the results of a sample subset analyzed by wet chemistry. Sample preparation and NIR analyses were conducted in CSU’s Department of Animal Sciences’ Nutrition Lab. Percent CP, ADF, and NDF were compared in grazed and ungrazed areas using PerMANOVA.
The social-economic component of our study were explored through a human dimensions approach combining two methods established in the literature of social-ecological systems, Q Methodology and agent-based modeling. The synthesis of these two methods provided a novel application, integrating the human dimension of natural resource management through the use of stakeholder-driven research and the creation of social narratives. The goals of combining these methods were to: 1) integrate stakeholder-derived values and knowledge into the research process, 2) increase contextualization of the research results for relevancy and reduce researcher bias, 3) elucidate diverse values inherent in collaborative conservation, 4) understand the social-ecological complexities in collaborative grazing systems and their influence on ecosystem services (ES), sometimes referred to as Nature’s Contributions to People (NCP) management, and 5) develop an applied, context-specific, and dynamic tool to aid stakeholders in consensus-building, co-learning, and collaborative decision-making.
Q Methodology was used to capture the dynamics of management and decision-making from the perspectives of diverse stakeholders within four collaborative grazing systems on the Colorado Northern Front Range, we included from each site a combination of participants representing 3 stakeholder groups: a) rancher/producers b) agency/professionals, and c) community/recreationers. Stakeholder participants were recruited using purposive sampling, a nonprobability technique appropriate for in-depth research pertaining to complex socio-cultural domains. We executed the 6-step Q methodology process with a sample of 40 stakeholders, including 10 rancher/producers, 18 agency/professionals, and 12 community/recreationers. We had 100% participatory follow-through from all stakeholders. Because this study was conducted during the coronavirus pandemic, we offered participants multiple modalities for completion of each step of the process to provide flexibility and ensure public health measures were maintained throughout the study.
1. Develop Q Concourse. The first step was to survey participants for values, opinions, and beliefs about the ecosystem services associated with relative study areas. A questionnaire was created to mine participants for this information. We emailed these questionnaires as both PDFs and Microsoft Word documents and offered snail-mail with return postage. We also offered an oral questionnaire via phone call, for those who preferred more personal contact. The researcher also used other expert knowledge, conversations with stakeholders, and background research to formulate the Q Concourse.
2. Refine Q Sample. The Q Concourse, made up of participant questionnaire responses, was thematized, where researchers extracted major themes and condensed them directly into statements. Researchers made an effort to retain original words and phrases directly from participant questionnaires to strengthen the iterative research process and reduce bias. The final statements derived for the Q Sample were organized into the three NCP/ES categories: material, nonmaterial, and regulating. These categories coincided with recent ecosystem services valuation theory, including instrumental, relational, and intrinsic value categories, and were adapted to the context of this study. While the Q sample was organized and analyzed using ES and NCP concepts, researchers were careful to use common language that was accessible to a diverse stakeholder group, so that concepts were framed in non-technical language and comprehensible to a broad spectrum of participants. In the end, the Q Sample consisted of a set of thirty-six statements that reflected concepts for which the majority of participants expressed an opinion, attitude, or perspective.
3. Facilitate Q Sort. The next step was the Q Sort exercise, where each stakeholder had the opportunity to complete their unique prioritization of statements and rank relative values from the Q Sample. Traditionally, this is done in-person, in a group or individual setting in 3-D, with scissors and glue, a Q Sort diagram (Fig. 2), and statements printed on pieces of paper (the Q Sample) (Fig. 3), that would then be assorted onto the diagram. Due to the conditions of the pandemic, we adapted the Q Sort exercise to an online platform, Google Jamboard (Fig. 4). This offered a private virtual Q Sort diagram option, although some participants still followed through with using the paper and scissors version. The researcher also offered to meet with participants one-on-one over the phone, video, or in a COVID-19-safe setting, where the researcher could verbally facilitate the Q Sort exercise.
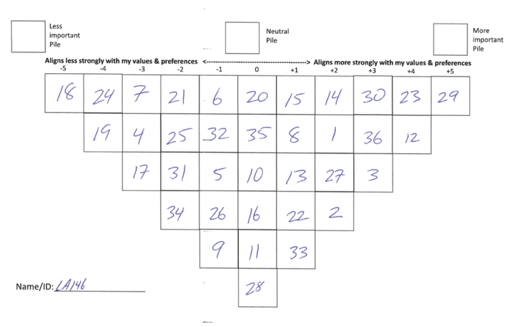
Figure 3. Example of completed Q sort diagram: a key step in Q methodology using participant involvement. Each number in the diagram corresponds with a Q statement in the Q sample.
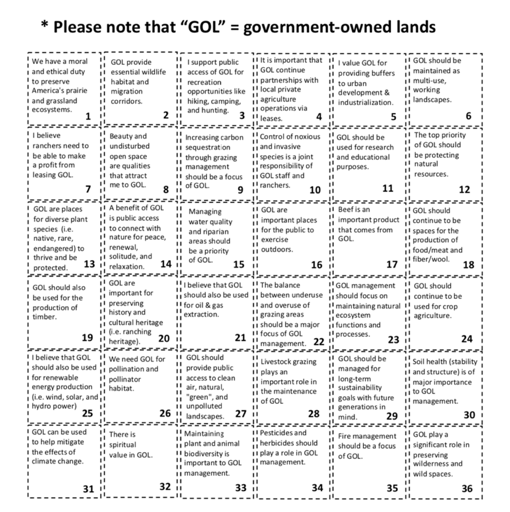
Figure 4. Q concourse paper version. Participants were instructed to cut out squares and arrange them according to personal values on Q sort diagram.
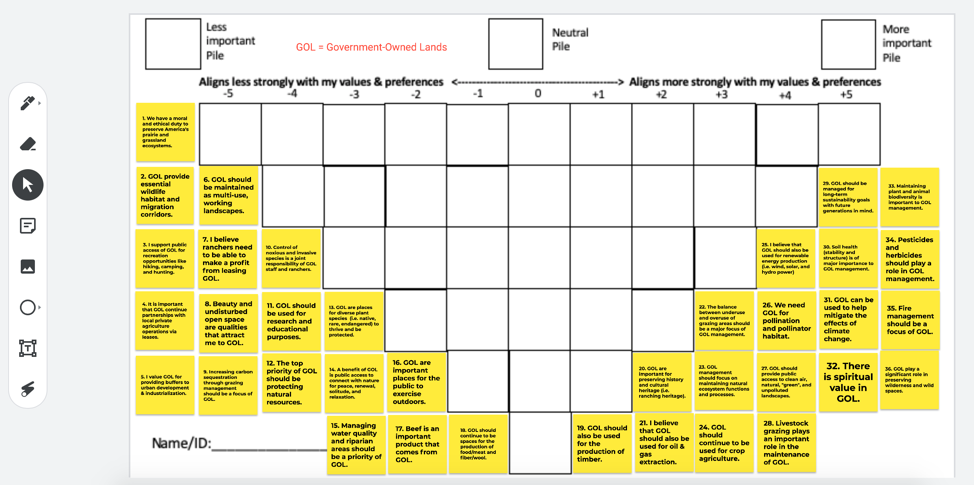
Figure 5. Q concourse and Q sort diagram on virtual platform, Google Jamboard. Participants were instructed to arrange squares according to personal values and download their final sort.
4. Conduct Exit Interviews.Within two weeks of completing their Q Sort, each participant took part in a semi-structured exit interview so that more details about each unique Q sorting process could be understood and clarified. The exit interviews were essential to understanding nuances in the Q Sort process, which informed interpretation of results. The researcher offered to conduct interviews by phone, video conference on multiple platforms, or in person in a COVID-19-safe setting.
5. Perform Factor Analysis.The Q Sorts were then be analyzed using factor analysis and the software, KADE. Researchers used Principle Components Analysis follow by Varimax rotation on 3 factor levels that were determined by examination of an Eigenvalue scree plot and elimination of factors with Eigenvalues <2. This analysis illuminated three typologies among stakeholders, demonstrating which ecosystem services were valued similarly or dissonantly among stakeholder groups. Researchers also examined how stakeholder groups prioritized each of the 3 ES categories (material, nonmaterial, regulating), which added a thematic dimension to the interpretation of the results and explored the question: “Do stakeholders tend to place higher value on ecosystem services that are material, non-material, or regulating?” This step was important in understanding the value basis for management decision-making approaches.
6. Interpret and Create Social Narrative.The final Q step was to present factor analysis results to the stakeholder participants. This was done in the form of a workshop to which all stakeholders were invited. With facilitated discussion, stakeholders were encouraged to think critically about the results and assist in the calibration of researcher interpretation based on personal on-the-ground experiences. The interpretation process involved the creation of a social narrative, incorporating areas of discord and consensus among the 3 factors or typologies.
Agent-Based Modeling was used in our study to create a learning tool that could explore the social-ecological complexities of grazing systems. Using a coupled approach to system dynamics modeling combining geospatial and climate data with agent-based simulation, our objective was to model the human-environment-animal-forage dynamics of typical grazing systems. Our resulting model allows the user to create a theoretical scenario with options regarding environmental conditions and livestock management decisions. The model simulates a single grazing season and produces measurable outcomes. The utility of the model lies in its ability to answer a multitude of stakeholder questions revolving around a central question: How do select cattle management and land use decisions affect grazing system outcomes under various environmental conditions?
Our model represents a context-specific grazing landscape. We created this landscape using methods that would be easily repeatable on other ranches, study sites, or geographical regions. Two components formed the foundation of this model landscape, which contributed geographical and data-driven realism to modeling scenarios: the area of interest, derived from a geospatial explicit map, and the landscape texture, derived from remote-sensing satellite imagery and a calculation of Normalized Difference Vegetation Index (NDVI).
The model is programmed to simulate grazing system dynamics in specific ecological and geographical contexts, where the human decision-making dimension, the input of stakeholders or managers, is influential in the ecological (animal and land based) outcomes of cattle grazing. These dynamics are demonstrated through scenario manipulations involving cattle stocking rate, number and size of available pastures, water source locations, and forage availability using programmable manipulations in precipitation patterns, forage consumption, cattle weight gain/loss, grass growth rates, and pasture rotation thresholds. We developed the model in NetLogo 6.2.0.
The basic principle behind the model is that cattle grazing is a dynamic process that takes place on heterogenous landscapes. Forage availability is driven by environmental factors, and cattle utilization of that forage is dependent upon animal behavior, stocking rate, water location, and forage quality. The sustainability of rotational grazing systems relies on human decision-making to determine which temporal and spatial thresholds will result in 3 optimal and linked outcomes: 1) maximum residual biomass, 2) maximum vegetation biodiversity/heterogeneity 3) maximum cattle weight gain. It is understood that grazing distribution, stocking rate, drought level, and seasonal precipitation patterns are all variables that may affect these outcomes. Figure 6 describes the model process based on these concepts.
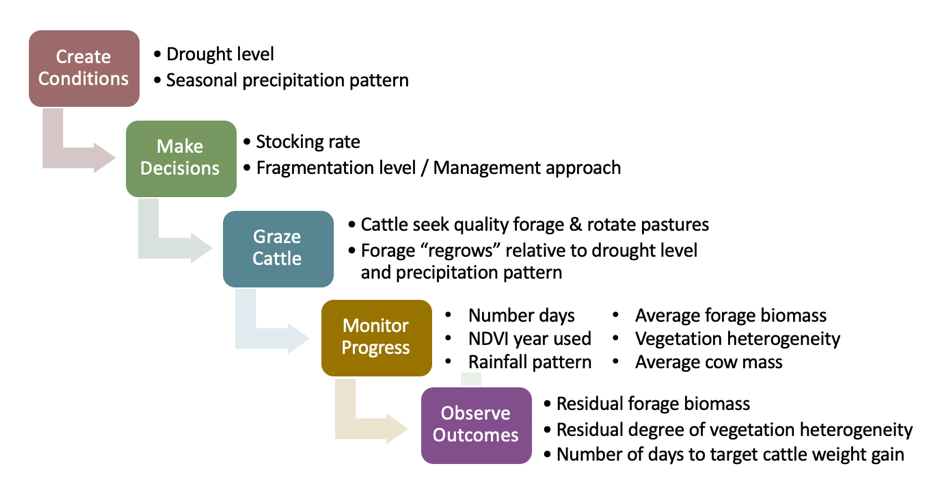
Figure 6. Flow chart of grazing system agent-based model process in five phases.
Ecological Component
Grazed vs. Ungrazed Lanscapes
Multivariate statistical analysis, PerMANOVA, was used to detect differences in areas historically managed by collaborative grazing compared to areas that had been excluded from grazing on the Colorado Northern Front Range. Soil health (TN, OC, WI), plant community (SDI, functional groups, origin groups), and forage quality (CP, ADF, NDF) metrics were analyzed and results were summarized (Table 2).
Table 2. Results of multivariate PerMANOVA tests for differences between grazed and ungrazed areas in 3 groups of variables measured across 2 years, 2020 and 2021. Upper horizon = 0-10 cm depth. Lower horizon = 10-20 cm depth. R2 is the percentage variance explained by the groups.
|
Group |
Variables included |
R2 |
p-value |
|
Soil Health 2-yr |
Total nitrogen (upper horizon) Total nitrogen (lower horizon) Organic carbon (upper horizon) Organic carbon (lower horizon) Water infiltration rate |
0.09 |
<0.01 |
|
Plant Community 2-yr |
Species Abundance Shannon Diversity Index Functional Groups Origin Groups |
0.01 <0.01 <0.01 <0.01 |
0.32 0.82 0.96 0.98 |
|
Forage Quality 2020 |
Crude protein Acid detergent fiber Neutral detergent fiber |
0.01 |
0.47 |
|
Forage Quality 2021 |
Crude protein Acid detergent fiber Neutral detergent fiber |
0.31 |
<0.01 |
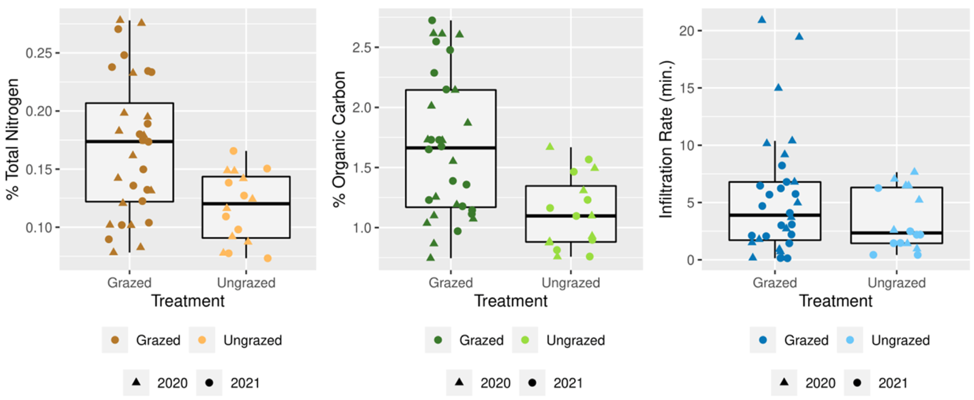
Figure 7. Boxplots of soil health variables used in PerMANOVA analysis. Data points represent averages of upper (0-10 cm) and lower (10-20 cm) soil horizon samples, 2 sampling years (2020 and 2021), and a comparison between grazed and ungrazed areas.
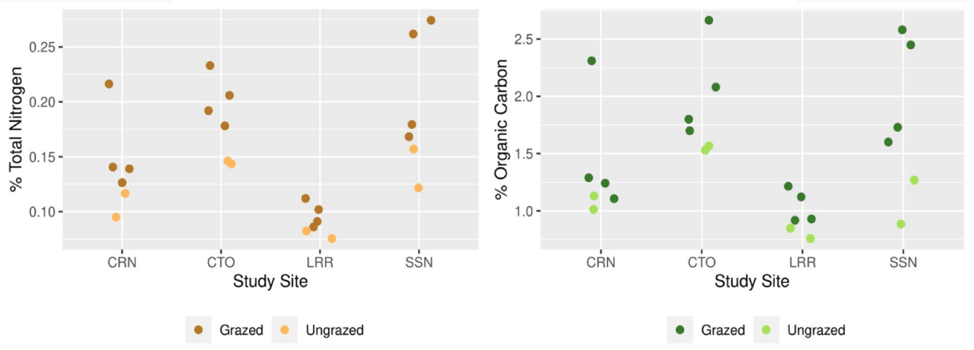
Figure 8. Scatterplots of soil nutrient variables used in a PerMANOVA analysis. Data points represent averages of upper (0-10 cm) and lower (10-20 cm) soil horizon samples from 2 sampling years (2020 and 2021), and a comparison between grazed and ungrazed areas on each of 4 study sites.
Plant Community: An inventory of canopy cover (relative abundance) of 104 plant species, provided the basis for examining plant community composition in the following ways: species abundance, SDI, functional groups and origin groups. PerMANOVA was applied to each of these inquiries and results indicated that there were no statistical differences in the centroid or dispersion of these measures between grazed and ungrazed areas (Table 2). The spread of SDI (p = 0.82) across study sites and by year, 2020 and 2021 (Figure 9), confirms no apparent trends or significant dispersion differences between grazed and ungrazed areas for either year.
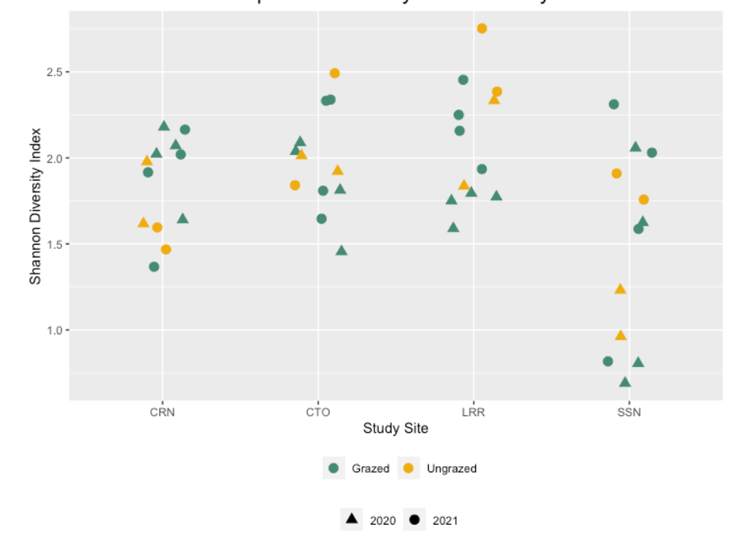
Figure 9. Scatterplots of Shannon’s diversity used in a PerMANOVA analysis. Data points represent averages of 50 subsamples along each transect collected in 2 sampling years (2020 and 2021) and illustrate the comparison between grazed and ungrazed areas on each of 4 study sites.
Results of species abundance, as percent canopy cover, allocated to functional and origin groups were summarized (Table 3). We further explored patterns in plant species relative abundance in 2020 and 2021 by functional groups (Shrub, Forb, C3, C4, AnGram) (p = 0.96) using clustered bar charts (Figure 10). While there were no statistical differences between grazed and ungrazed areas, bar charts allow us to observe patterns in the data. For example, C3 plants across all study sites may have increased in abundance, replacing Forb abundance in 2021 grazed areas, compared to ungrazed areas. Also, in the LRR study site, C4 abundance may have been greater in 2020 compared to 2021 in grazed areas. C3 abundance may ave increased in grazed areas, while AnGram and Forb abundance showed an increasing trend in ungrazed areas in 2021.
Table 3. Means and standard deviations of plant community groups in grazed and ungrazed areas, including 2 sampling years, 2020 and 2021.
|
Functional Groups |
n |
Grazed Mean % |
Grazed Std Dev |
Ungrazed Mean % |
Ungrazed Std Dev |
|
Cool season |
48 |
28.02 |
14.74 |
25.95 |
11.01 |
|
Warm season |
48 |
9.47 |
11.54 |
9.00 |
10.45 |
|
Forb |
48 |
14.93 |
11.16 |
14.21 |
9.07 |
|
Shrub |
48 |
1.45 |
1.85 |
1.42 |
1.34 |
|
Annual Graminoid |
48 |
8.68 |
7.57 |
9.68 |
7.34 |
|
Origin Groups |
n |
Grazed Mean % |
Grazed Std Dev |
Ungrazed Mean % |
Ungrazed Std Dev |
|
Native |
48 |
36.97 |
19.43 |
35.71 |
20.04 |
|
Exotic |
48 |
25.58 |
23.11 |
24.55 |
21.31 |
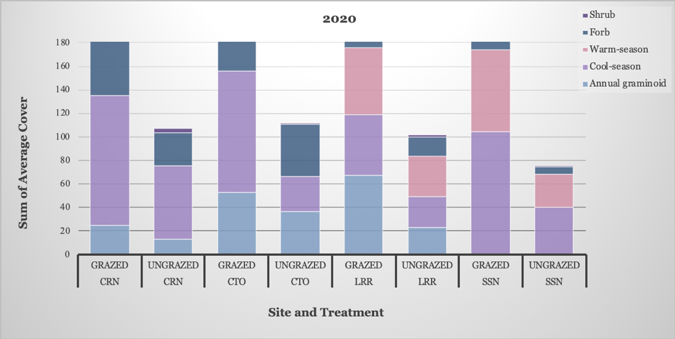
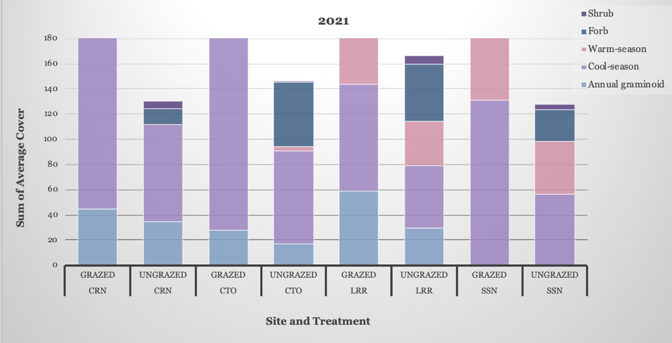
Figure 10. Sums of average species canopy cover by 5 functional groups (Shrub, Forb, C3, C4, Annual Graminoid) in year 2020 and 2021, illustrating comparison between grazed and ungrazed areas on each of 4 study sites.
We also explored species relative abundance in 2020 and 2021 by origin groups (Native and Exotic) (p = 0.98) using clustered bar charts (Figure 11). Despite the lack of statistical differences between grazed and ungrazed areas, patterns are visible in the bar charts. For example, it appears that overall cover of both native and exotic species tends to be greater in grazed versus ungrazed areas, across time (year) and space (study sites). Also, in the LRR site, native species in grazed areas may have increased in abundance in 2021 compared to ungrazed areas.
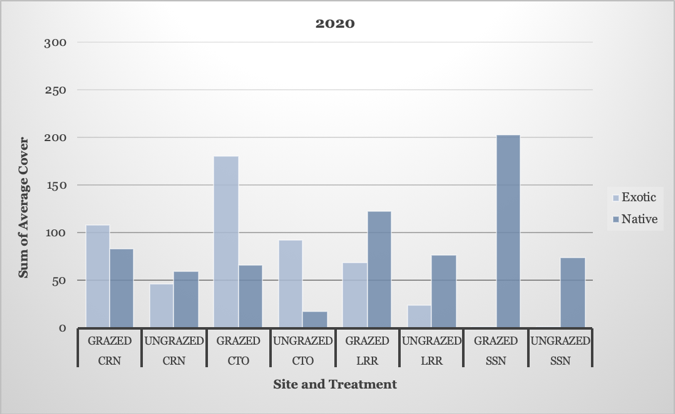
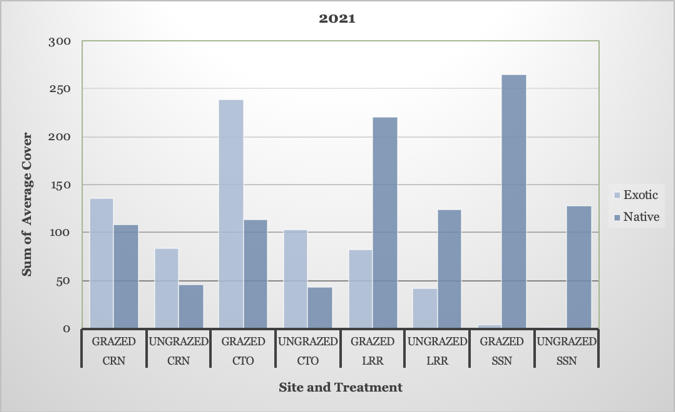
Figure 11. Sums of average species canopy cover by origin groups (native and exotic) in year 2020 and 2021, illustrating comparison between grazed and ungrazed areas on each of 4 study sites.
Forage Quality: Three components of forage nutritive quality (CP, ADF, NDF) were compared in grazed and ungrazed areas. Results were summarized (Table 4). Statistical differences in the centroids and dispersion of CP, ADF, and NDF between grazed and ungrazed areas were found in 2021(p < 0.01) but not in 2020 (p = 0.47). Box plots were used to illustrate 2021 data where there was a statistical difference between grazed and ungrazed areas indicating that forage quality was higher in grazed areas (Figure 12).
Table 4. Means and standard deviations of three forage nutritive quality components (crude protein, acid detergent fiber, neutral detergent fiber) in 2 sampling years, 2020 and 2021.
|
Nutritive Component |
n |
Grazed Mean (%) |
Grazed Std Dev |
Ungrazed Mean (%) |
Ungrazed Std Dev |
|
2020 CP |
144 |
10.25 |
1.48 |
9.96 |
1.85 |
|
2021 CP |
144 |
9.44 |
1.97 |
7.50 |
2.10 |
|
2020 ADF |
144 |
38.34 |
3.11 |
39.04 |
2.49 |
|
2021 ADF |
144 |
26.07 |
3.58 |
30.87 |
5.67 |
|
2020 NDF |
144 |
63.87 |
4.79 |
63.82 |
5.71 |
|
2021 NDF |
144 |
55.80 |
4.43 |
60.33 |
5.56 |
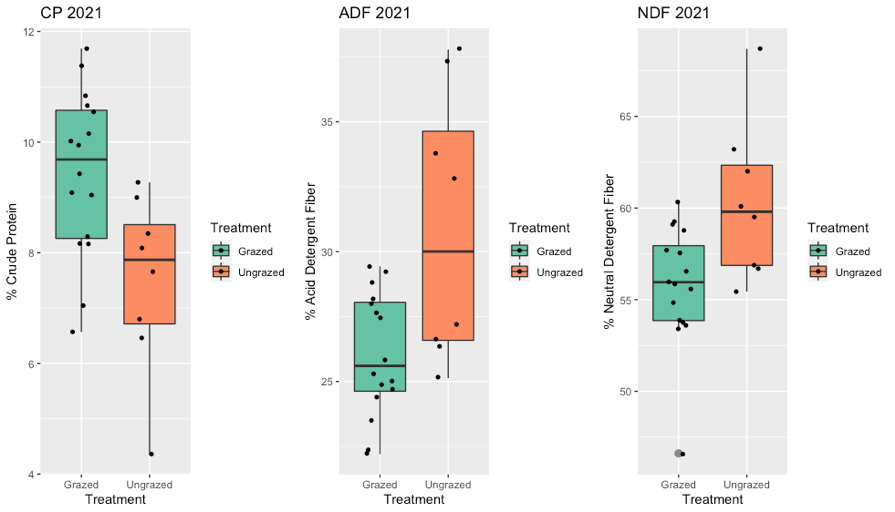
Figure 12. Boxplots of forage nutritive quality used in PerMANOVA analysis. Data points represent averages of 6 subsamples per transect, collected in 2021, and illustrate the comparison between grazed and ungrazed areas.
Broader Patterns
In addition to using PerMANOVA for statistical exploration, we further dissected the comprehensive dataset, composed of 3 variable categories, with NMDS. Soil health, plant community, and forage quality metrics were used as gradients or vectors that were overlaid on a plant species ordination plot (Figure 13). The ordination plot allowed us to conceptualize patterns among variables in an interrelated correlational space.
Native species were most highly correlated to the SSN grazed areas. Shrubs were most highly correlated to the LRR study site in general, and C4 were most tight linked to SSN and LRR sites. Highest SDI and AnGram measures correlated to LRR ungrazed areas and CRN ungrazed areas. Exotic species were highest in CRN and CTO sites, while Forbs and C3 were most highly associated with CTO grazed areas. TN and OC had the greatest correlation to CRN grazed areas. SSN and LRR had plant species compositions that were distinguishable from the other sites, while CRN and CTO shared similarities in plant species composition.
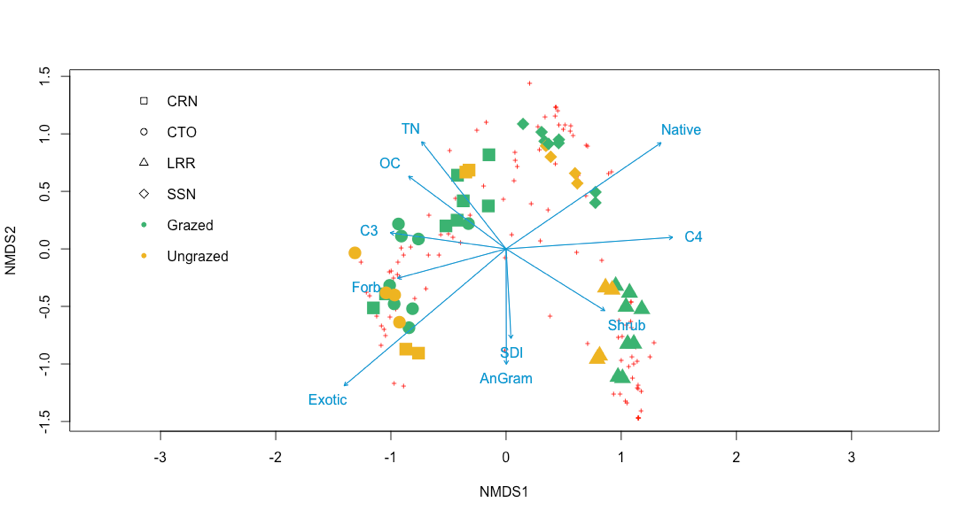
Figure 13. Scatterplot of 2 axes, resulting from a 3-dimensional Non-Metric Multidimensional Scaling (NMDS) analysis of plant species distribution on 4 grazed (green) and ungrazed (yellow) study sites correlated with 10 gradients (blue) Shannon’s Diversity Index (SDI), 5 functional groups: C3 (cool season), C4 (warm season), forb, shrub, and annual graminoid(AnGram), 2 origin groups: native and exotic, 2 soil health components: percent total nitrogen (TN) and organic carbon (OC), and 3 forage quality components: crude protein(CP), acid detergent fiber (ADF), and neutral detergent fiber (NDF). Created in R Version 3.6.1.
Ecological Component Discussion:
The objective of our study was to compare areas on government-owned landscapes that were managed by cattle grazing to areas that had been purposefully excluded from cattle grazing. After at least a decade of collaborative grazing management versus grazing exclusion, we wanted to learn what differences were detectable in terms of soil health (TN, OC, WI), plant community (SDI, functional groups, origin groups), and forage quality (CP, ADF, NDF), and what were the relationship patterns among these outcomes?
Our methods included data collection in 2 consecutive field seasons, 2020 and 2021. As it turns out, there was considerable variation in spring precipitation levels across those years. 2021 precipitation (March, April, and May) was 25-50% greater than in 2020 across our study region (Colorado Climate Center 2022). The annual precipitation was slightly above the historical average for the 2021 water year (October-September), and 2020 experienced a below-average water year, with some study areas only receiving 75% of the average annual precipitation (Colorado Climate Center 2022). Therefore, evaluating 2020 and 2021 data separately and as a composite 2-year dataset was necessary to account for this environmental influence. We also considered spring precipitation in our interpretation of results, knowing that this environmental factor is known to heavily influence plant and soil dynamics.
The soil health component of our study revealed a clear difference in the cycling of nutrients like TN and OC in areas that been managed by cattle grazing compared to areas that had been excluded from grazing. The higher TN content recorded in grazed areas is congruent with findings in other studies that addressed the addition of nitrogen-rich inputs like bovine urine and manure (Knapp et al. 1999). Similarly, manure inputs and mechanical breakdown of plant biomass from herbivore trampling are among the ways in which livestock can contribute to higher soil OC in grazed areas. The higher percentages of TN and OC in the upper horizon (0-10 cm) compared to the lower horizon (10-20 cm) were also expected. The upper horizon and soil surface are where the previously mentioned nitrogen deposits and decomposing organic matter are in the highest concentrations. Only a fraction of these compounds is cycled into lower soil horizons while the rest is taken up by other organisms or otherwise lost to the environment.
Our plant community component examined a biodiversity index (SDI) as well as species composition through analysis of abundance of functional groups (C3, C4, Forb, Shrub, AnGram) and origin groups (Native and Exotic). Statistical analysis did not show significant differences between grazed and ungrazed areas, which informs us that long-term cattle grazing had not measurably altered plant biodiversity or community composition over time and that collaborative stewardship and ranching partnerships had not detrimentally altered these aspects of plant community dynamics. This finding supports the use of cattle grazing as a conservation method since grazed areas maintained similar levels of biodiversity, functional group composition, and native versus exotic species abundance as ungrazed areas. Our study was designed to decrease confounding biological variables by carefully selecting locations with similar soil profiles, geography, and topography. Yet, the high spatial and temporal heterogeneity of grassland ecosystems, especially in plant community composition, may have evaded attempts to identify close-to-perfect biological replicates on vast landscapes. In fact, the ordination plot derived from NMDS analysis underscored the conclusion that there were observable spatial patterns and clustering around study sites, emphasizing site-specific characteristics. The longest-term grazing studies in our region have illuminated that changes in plant communities happen very slowly and are vulnerable to environmental events unrelated to grazing, like drought (Augustine et al. 2017; Porensky et al. 2017). In one study, researchers learned that differences in plant community composition only became detectable after approximately 50 years of grazing (Porensky et al. 2017). Hence, ongoing research will allow us to more fully understand the long effects of collaborative grazing management in our study areas.
The forage quality component of our project was an important element from both a cattle management perspective and a wildlife habitat perspective. On government-owned lands, domestic livestock share valuable resources with wild herbivores, and both have unique nutritional needs at various phases of life, from gestation to lactation to growth and reproductive maturity. Our statistical analysis revealed a clear positive relationship between forage nutrient content and long-term grazing. Therefore, rather than reducing quality forage available to wildlife, cattle in these management scenarios have actually improved forage quality over time. Other research on large herbivore grazing has produced similar results.
The primary challenge of our study was to implement scientific rigor and sound research design while honoring the inherent complexity and heterogenous realism of grazing systems. Our sample size was limited due to geographic constraints in accessible ungrazed areas, which were small and subject to spatial autocorrelation issues. Our tradeoff for a relatively small sample size was to broaden the spectrum of variables in our inquiry. This allowed us to approach our study from a more holistic or social-ecological systems perspective where human, plant, soil, and animal components were integrated. Our intention was to study these collaborations “as is,” without constraining managers to a contrived set of conditions. By allowing for this level of variability, we were able to study real-time, real-scale scenarios, producing information and learning opportunities that were meaningful and contextually applicable.
We also incorporated variables that were important to the ranchers and government agency personnel. Understanding abundance of native versus exotic species, the potential sequestration of atmospheric carbon, and the effect of management on forage quality were all curiosities that were derived from stakeholders in these systems and which were implemented into the research design. This collaborative research process was ultimately a mirror to the historical collaborative management of these lands.
Social-Economic Component
Stakeholder Values and Perceptions
We performed factor rotation until three distinct stakeholder typologies were revealed. The final three typologies were distinguishable and interpretable. They each had an eigenvalue > 2 and cumulatively accounted for 63% of the study variance. Stakeholder typologies were labeled according to their overarching themes and ES valuation approach. They included: I) ecocentric naturalist II) sustainable utilitarian III) multi-use steward. A summary of results, the top five distinguishing statements, associated with each typology, their Q sort value, and z score, were reported (Table 5). A correlation matrix among stakeholder typologies was also considered (Table 6). Type I and Type 3 were most strongly correlated (r = 0.62). Type II was weakly correlated with Type I (r = -0.07) and Type II (r = 0.26).
Table 5. Distinguishing statements, Q sort values, and z scores associated with three stakeholder typologies resulting from factor analysis. Distinguishing statements are defined as having significance levels p < 0.05 and z scores higher than in all other factors. “GOL” = government-owned lands. Q sort values reflect the Q Sort ranking exercise. +5 indicated a statement most highly aligned with the participants values and beliefs. -5 indicated a statement least aligned with the participants values and beliefs. Z score describes the number of standard deviations away from the mean, where a higher the Z score correlates to a more distinguishing statement.
|
Type I: Ecocentric Naturalist |
||
|
Distinguishing Statements |
Q sort value |
Z score |
|
We have a moral and ethical duty to preserve America's prairie and grassland ecosystems. |
+5 |
1.53 |
|
GOL provide essential wildlife habitat and migration corridors. |
+4 |
1.45 |
|
GOL are places for diverse plant species (i.e. native, rare, endangered) to thrive and be protected. |
+3 |
1.32 |
|
Maintaining plant and animal biodiversity is important to GOL management. |
+3 |
1.27 |
|
Beauty and undisturbed open space are qualities that attract me to GOL. |
+2 |
0.64 |
|
Type II: Sustainable Utilitarian |
||
|
Distinguishing Statements |
Q sort value |
Z score |
|
Livestock grazing plays an important role in the maintenance of GOL. |
+5 |
2.38 |
|
It is important that GOL continue partnerships with local private agriculture operations via leases. |
+4 |
1.69 |
|
Beef is an important product that comes from GOL. |
+4 |
1.69 |
|
GOL should continue to be spaces for the production of food/meat and fiber/wool. |
+3 |
1.57 |
|
I believe ranchers need to be able to make a profit from leasing GOL. |
+3 |
1.05 |
|
Type III: Multi-use Steward |
||
|
Distinguishing Statements |
Q sort value |
Z score |
|
GOL should be managed for long-term sustainability goals with future generations in mind. |
+5 |
2.28 |
|
The top priority of GOL should be protecting natural resources. |
+4 |
1.55 |
|
GOL can be used to help mitigate the effects of climate change. |
+3 |
1.01 |
|
I support public access of GOL for recreation opportunities like hiking, camping, and hunting. |
+2 |
0.86 |
|
GOL should be maintained as multi-use, working landscapes. |
+2 |
0.72 |
Table 6. Correlation matrix of three stakeholder typologies (Types) resulting from factor analysis.
|
Type I |
Type II |
Type III |
|
|
Type I |
1 |
-0.0736 |
0.616 |
|
Type II |
-0.0736 |
1 |
0.2645 |
|
Type III |
0.616 |
0.2645 |
1 |
Ecocentric Naturalist: The first type labeled ecocentric naturalist was characterized by perspectives and opinions that clustered greatly around prioritizing regulating and non-material ES. Q sorts from these stakeholders ranked material ES and an economic focus on rangelands at the lowest end of the Q Sort, indicating that that those relative statements least aligned with their values and perspectives. Stakeholders that comprised this typology exhibited strong intrinsic values like preserving wilderness, minimizing human use, and that nature should be protected simply because it exists. The thematization process that guided researcher interpretation was summarized (Figure 14). Twenty-four out of forty Q Sorts were associated with the ecocentric naturalist type, all of which were associated with the agency/professionals and community/recreationers groups, and none of which included members of the rancher/producers group. Exit interviews with stakeholders whose Q Sorts were most highly weighted in this typology confirmed our interpretation and also revealed nuances in the Q Sort process.
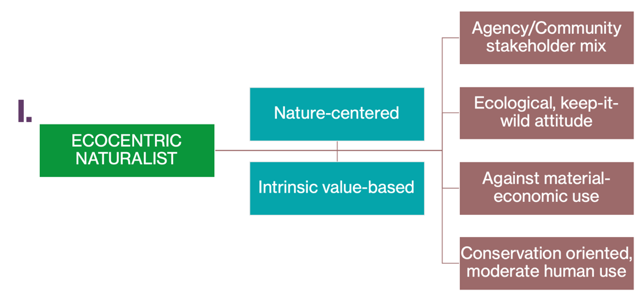
Figure 14. Typology I: Ecocentric Naturalist, resulting from Q Sort factor analysis and interpretation of overarching themes and value clusters.
Type II: Sustainable Utilitarian: The second type labeled sustainable utilitarian was characterized by perspectives that prioritized material ES and a strong instrumental value system. Non-material and regulating ES were also ranked in the upper 50% of Q Sort values, but material ES overwhelmingly took the highest ranks and were rarely placed in negative Q Sort values. Stakeholders whose Q Sorts fell into this typology were from the agency partner/professionals and rancher/producers groups. There were no community/recreationers group Q Sorts represented by this type. Ten out of forty Q Sorts comprised the sustainable utilitarian type. While this type highly valued material ES, stakeholders were also clear about prioritizing sustainability and minimizing ecological disturbance. The themes that guided researcher interpretation were summarized (Figure 15). Exit interviews with stakeholders whose Q Sorts were weighted the highest for this type illustrated this integrated perspective.

Figure 15. Typology II: Sustainable Utilitarian, resulting from Q sort factor analysis and interpretation of overarching themes and value clusters.
Type III: Multi-Use Steward: The third factor, the multi-use steward type, was characterized by a general blend and integration of material, non-material, and regulating ES across the entire Q Sort. Six out of forty Q Sorts comprised this typology and all three stakeholder groups were represented. The multi-use steward type was based in a holistic approach that incorporated relational values and prioritized human use, as well as natural resource conservation. Focus was on less extractive uses of rangelands while acknowledging society’s dependence on the environment. Thematization used in researcher interpretation was summarized (Figure 16). Exit interviews with stakeholders whose Q Sorts fell into this typology supported this interpretation:
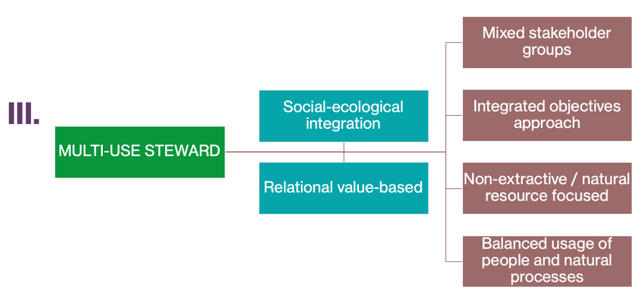
Figure 16. Typology III: Multi-Use Steward, resulting from Q sort factor analysis and interpretation of overarching themes and value clusters.
Social-Economic Component Discussion:
The objective of our study was to take a context-specific dive into the socio-ecological-economic dynamics of collaborative grazing management. We evaluated how stakeholders in public-private partnerships perceive and value of ES on government-owned lands and how their perceptions influence decision-making. We used a robust semiquantitative approach, Q methodology, to investigate and illustrate pluralism in the interconnected pathways of rangeland ES and its people, specifically addressing the role of humans and their value systems as they pertain government-owned lands, natural resource management, and sustainable food production.
Two ways in which we conceptualized and interpreted Q sort results was through the lens of NCP categories (material, non-material, regulatory) and associated value clusters (instrumental, relational, intrinsic). We noted patterns in how each stakeholder group tended to prioritize certain ES over others and how this prioritization was a reflection of value systems. The importance of these observations lie in the notion that stakeholder perspectives and values are directly linked to decision-making and management approaches. All three value categories were represented in stakeholders’ perspectives of government-owned rangeland ecosystems. Of the twenty ES addressed by study participants, instrumental values could be linked to 17 of them, intrinsic values could be linked to 12, and relational values could be linked to 9. The dominate value cluster was instrumental, which includes ES like food, wool, energy, and timber production, as well as recreation and other forms of public access and use. In fact, for this study region, the majority of ES identified by stakeholders are tied to instrumental human values. It is important to acknowledge the cultural context here. Whereas, Western society may uphold stronger instrumental values of nature, such as for agriculture or recreational use, indigenous or even pastoralist non-Western communities may hold stronger relational or intrinsic values of nature. There within is the significance of context-specific or place-based ES valuation inquiry.
In our case, Q methodology demonstrated that there is more harmony than discord in how diverse stakeholders perceive and value the ES on government-owned rangelands. Results also illuminated that while there is general consensus and significant overlap in opinions on controversial issues such as cattle grazing and recreational use, the rancher/producers stakeholder group expressed perspectives that were less correlated and less aligned with the other stakeholder groups. This pattern is commonly played out in controversies around public lands management and the beef industry. From mainstream public media to the policy table, rancher/producers and their beliefs and practices tend to be under incredible scrutiny. In our study, we see that, in fact, their collective perspectives and value systems appear to deviate from the other stakeholder groups. A next step would be to further investigate this divide and the drivers and dynamics contributing to these differences, the “why.”
It was valuable to learn that the areas of greatest consensus also provided potential solutions to areas of greatest discord. For example, there may be conflict in the degree of rules and oversight, as well as management approaches imposed on public rangeland use (areas of discord). However, if we acknowledge that conflicting interests exist, then we may bring these diverse views together in a collaborative effort and approach management cooperatively, while setting transparent goals and objectives (areas of consensus).
When stakeholders were interviewed as a last step in the Q methodology process and then participated in an interactive workshop, study results were presented, researchers gained even more contextual insight into stakeholder experience in the study. Most stakeholders expressed in one way or another that the Q Sort activity was challenging because it forced them to prioritize things that were all important on some level. Stakeholders commented that they wished they had more room on the “right side” of the Q Sort because they desired to rank certain statements higher, but the constraints of the diagram forced them to make tradeoffs. One stakeholder commented in the exit interview, “We have a lot of goals but not all can be prioritized to the same extent…This was the most challenging aspect of this exercise.” Here within is the value of Q methodology in this context. Just like government-land use and management initiatives are limited by economic and labor constraints, forcing decision-makers to make tradeoffs and prioritize certain issues over others, so did the Q Sort process constrain participants to prioritize their needs and values in a finite space. This proved to be an insightful exercise for most stakeholders, giving them empathy for those in positions of decision-making power.
Agent-Based Modeling Component:
In fulfillment of this project an agent-based model was created (see Methods section) to simulate management scenarios based on drought level, precipitation pattern, forage biomass availability, stocking rate, and degree of fragmentation/intensity of rotational grazing. The model is currently in a "beta" phase. We are working on improvements and fine tuning the background mathematics to provide scenario outcomes and learning that is realistic, applicable, and context-specific. Once our model is performing satisfactorily, we intend to run a series of simulations and publish our results in a peer-reviewed journal. At the stakeholder workshop held on May 13, 2022, we introduced the model and provided example simulations for attendees. We received overwhelming interest from our stakeholders regarding the model, as stakeholders expressed excitement and interest in its capabilities and utility as a ranch management tool.
Research outcomes
Education and Outreach
2. Sorting exercise asking participants to reflect on their prioritization of land and cattle management issues.
3. One-on-one interviews with above participants to further discuss their attitudes, opinions, and beliefs around the management of government-owned lands.
Participation summary:
Over the past two years, my project was used as a platform for multiple education and outreach activities. These activities ranged from academic presentations to one-on-one meetings with study participants to an in-person workshop.
The first activity involved a poster presentation at the Colorado State University Graduate Student Showcase. My poster presentation can be accessed here: https://mountainscholar.org/handle/10217/217324. The poster highlighted the uniquely holistic research design demonstrated by my study, which integrates the ecological, social, and economic elements of collaborative grazing management. The oral presentation associated with my poster was regarded highly by the judges and awarded me a finalist position in the "3 Minute Thesis" fellowship contest sponsored by the Office of the Vice President for Research. My entry in this video contest can be accessed here: https://youtu.be/MWXH8e0j574?t=27. Based on my performance in this contest, I was awarded a fellowship for the upcoming academic year.
In 2021, I entered my project into a virtual poster symposium for the Front Range Student Ecology Symposium. It was a unique opportunity to create an academic poster on a virtual multimedia platform, and I was able to engage in excellent dialogue with fellow students around my poster topic. My poster may be accessed here: https://frses2021-csu.ipostersessions.com/Default.aspx?s=A4-30-5B-4E-1A-29-E4-66-8B-45-92-95-64-70-D9-23.
A final education and outreach tool that I created last year was an ArcGIS Story Map, which can be accessed here: https://storymaps.arcgis.com/stories/fef398af9ca24d30b0f263c27d15b000. This publicly available educational tool describes the purpose, methods, results, and conclusions of a forage productivity and quality analysis, which was conducted on my four study sites. While I am currently collecting on-the-ground data on these sites (as per my project methods), I felt it important to also explore similar rangeland health indicators using remote sensing and geospatial data analysis tools.
In spring 2021 I was also given the opportunity to present my research to an undergraduate class at CSU. This class focused on the development of research and scientific combination skills for students interested in graduate school or field work.
Additionally, in spring 2021 and 2022 I met with each of my 8 rancher/producer and land agency research partners to discuss the upcoming grazing season. I consulted with each of them on research progress thus far, as well as next steps and approaches to grazing management this summer.
Finally, I maintained direct contact with 40 research participants through a 3-step process involving the collection of qualitative data using Q-Methodology. These 3 steps included a written survey, a sorting exercise, and a one-on-one interview used to further discuss and clarify their responses to the survey and sorting exercise. Participants represented each of 3 stakeholder groups: rancher/producers, government land agency partners/conservationists, and community volunteers/recreationers. Nearly all participants provided feedback on this process expressing how much it inspired them reflect on the root of their values and beliefs as well as the complexities of government-land management regarding multi-use and agricultural objectives. My contact with these participants continued throughout the 2021-2022 academic year, and on May 13, 2022 we hosted a stakeholder workshop to disseminate research results and discuss learning opportunities, application, and next steps.
On November 1, 2022, I will also be presenting my research at a workshop/field day at one of my study sites, Lowry Ranch. The Quivira Coalition is hosting this field day/workshop, and it is expected to be attended by key figures in the industry.
I intend to take advantage of other research communication and outreach activities that become available throughout the next year. I participated in 2 CSU fellowship programs, the Office of the Vice President for Research and the School of Global Environmental Sustainability. Both of these programs involved monthly workshops and training meetings, where I gained further experience in networking and communicating my research to broader audiences. I discovered that there is immense interest in the concepts explored by my project, and I am energized by the momentum building around these important themes.