Final report for GW21-225
Project Information
The Mid-Columbia Basin is the dominant cherry production region in Oregon, producing approximately 80% of the state’s cherries. When new orchards are planted, the ground under young trees is typically left bare. However, planting cover crops in new orchards may provide habitat for diverse beneficial invertebrates (hereafter “beneficials”), some of which play key roles in pest control. When cover crops are planted, producers must decide on a seed blend to use, despite scarce information on how different blends influence beneficials. Adjacent natural lands also likely harbor beneficials, which can provide additional pest-control services to nearby orchards.
This study examined how communities of beneficials are influenced by different cover crop blends, both in fallow orchard habitats (no trees - just cover cropped), newly planted orchards and adjacent natural habitats. We sampled beneficial and pest invertebrates in three broad habitat types associated with orchards including: 1) new orchards - ranging from no cover crop to grass-dominate cover, to mixed forb/grass cover, 2) mature orchards, and 3) natural habitat fragments.
As we have finished fieldwork, labwork, and started data analyses, we have shared the results of the project with producers via two extension publications (one currently in press) and presentations at a farm fair in Hermiston in the fall of 2023. We have conveyed initial results with the scientific community at the Ecological Society of America National Conference (August 2023), the Orchard Pest and Disease Management Conference (February 2023) and in peer-reviewed publications (one currently in prep). Finally, results will be shared with the public in a series of educational videos to be released on YouTube. This project addressed several “critical needs” identified by a 2018 working group on sweet cherry production in Washington and Oregon. Several members of the working group have indicated support for this project (see letters of support).
Research Objectives:
- Inventory non-pollinator beneficial invertebrates in orchards and natural habitats in the Mid-Columbia Basin and examine habitat characteristics associated with their distribution and community composition.
- Determine the ability of different cover-cropping regimes (no cover crop vs. grass dominant cover crops vs. a grass and forb mixed cover crops) to enhance beneficial invertebrate communities.
- Investigate the ability of different cover-cropping regimes to reduce the abundance of three common pest taxa (spotted wing drosophila (SWD), aphids, and leafhoppers).
Education and Outreach Objectives:
- Share research results about beneficial invertebrates, the value of adjacent natural habitat fragments, and project outcomes related to the use of cover crops in cherry orchards with fruit producers in the Columbia Basin.
- Present project results to the scientific community via conference presentations and publications in the primary literature.
- Create targeted educational content related to beneficial invertebrates designed to connect urban audiences to sustainable agricultural research and practices.
Prior to grant awarding, we conducted initial site surveys and collected preliminary data (summer 2021). After preliminary data collection, invertebrate samples that were collected during 2021 were be sorted and organized to the lowest taxonomic level (for some taxa) possible from September 2021 prior to the official start date of the grant on January 1, 2022. Preliminary data collection helped us refine our methods, identify several potential hiccups, and ensured that full data collection conducted in 2022 went as smoothly as possible after the grant funds were awarded.
We began the project in January of 2022 based on our requested start date of January 1, 2022. After grant funds were awarded, we will began purchasing materials for field collections that happened in the spring and summer of 2022. After we purchased our supplies, we will March and early April preparing the multi-component, plant volatile lures, and other field equipment. During this time we also coordinated with growers to implement cover crops and identified additional study sites that were not located during initial sampling in 2021. Field collections occurred from the April 2022 until August of 2022. After field collection, all invertebrate specimens were pinned and sorted. We are currently working on identifying specimens to the lowest taxonomic level possible.
Following field data collection, we began initial analyses and manuscript preparation. We currently have one manuscript that is in prep and are just finalizing edits before submitting to the journal Northwest Science. Preliminary data analyses on some of our objectives were completed in December 2022 and presented at the Annual Orchard Pest and Disease Management Conference in Portland, Oregon held during the week of January 9th, 2023. After this conference, we refocused our efforts to continued identification of invertebrate specimens.
Most extension and education efforts were conducted during the summer and fall of 2023. In early August of 2023, we presented some of our initial research results at the Ecological Society of America conference. The final extension event that we conducted for this grant was a presentation we gave at the Annual Hermiston Farm Fair in late November 2023. We plan on continuing to make outreach videos and presentations as we continue to finalize our results.
For a more detailed, graphical timeline, see the Figure 1.
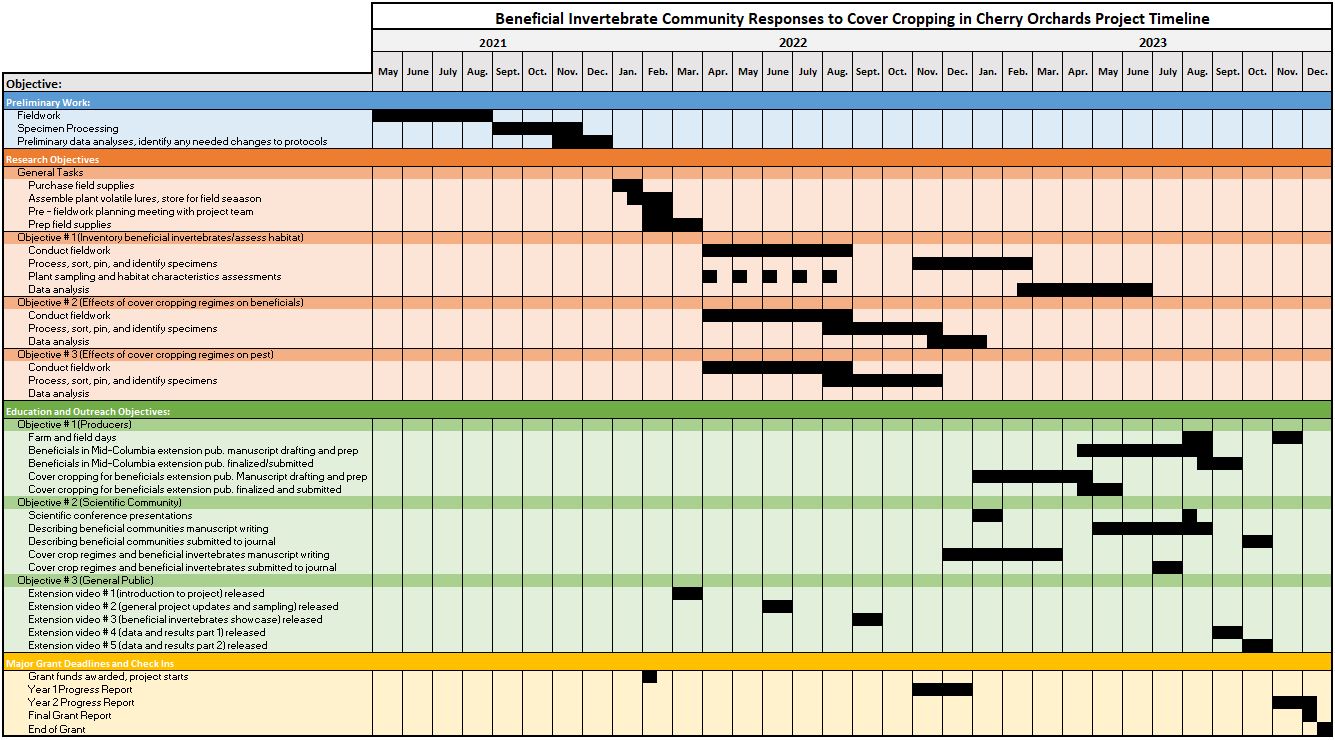
Figure 1: Proposed project timeline. Gantt chart displaying major project check points beginning with preliminary work planned for the summer of 2021 and ending with the end of the grant in 2023. Solid black bars represent continuous or ongoing work. In places where bars are broken, work will be conducted periodically as indicated in the chart. Blue is preliminary work, orange is research objectives, green is education and outreach objectives and yellow is major grant deadlines. We used this timeline as a guideline for our work, though we had to deviate from the proposed timeline in several minor ways throughout the course of the project.
Cooperators
- - Producer
Research
Overview
We addressed the following objectives with our research:
- Inventory non-pollinator beneficial invertebrates in orchards and natural habitats in the Mid-Columbia Basin and examine habitat characteristics associated with their distribution and community composition.
- Determine the ability of different cover-cropping regimes (no cover crop vs. grass dominant cover crops vs. a grass and forb mixed cover crops) to enhance beneficial invertebrate communities.
- Investigate the ability of different cover-cropping regimes to reduce the abundance of three common pest taxa (SWD, aphids, leafhoppers).
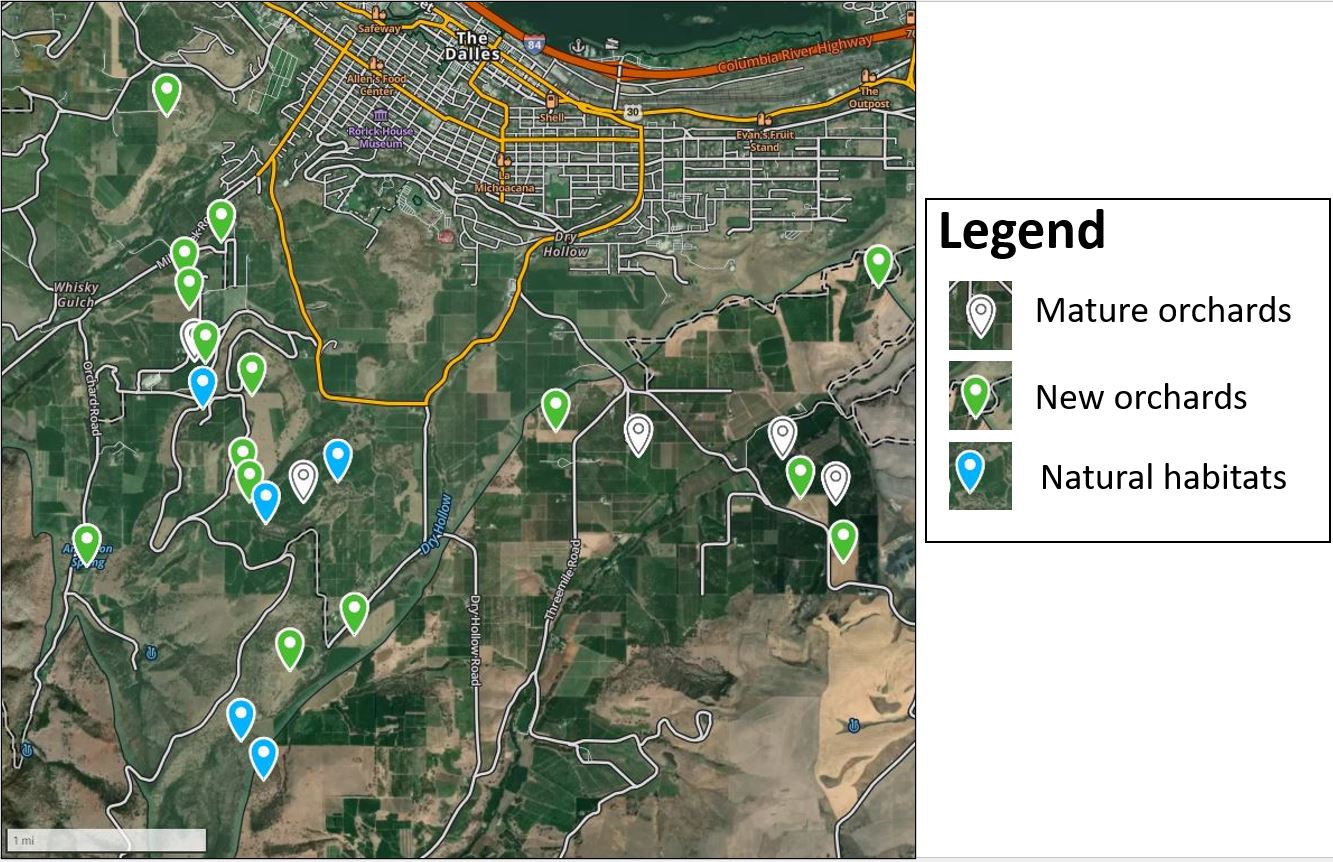
This study was conducted in cherry orchards owned and operated by Orchard View Farms Inc., orchards owned and operated by High Rolls Ranch and in adjoining natural, oak-scrub habitat. Mike Omeg (producer on project team) is the Director of Business Operations at Orchard View Farms Inc. We also cooperated with Dave Meyers (owner and operator of High Rolls Ranch) to conduct some sampling on several of his properties. We sampled beneficial invertebrates (predators and parasitoids) and pests (SWD, aphids, and leafhoppers) in three main habitats associated with cherry orchards (Figure 2). The three habitat types are: 1) mature orchard; 2) new orchards; 3) natural habitat. We identified and established 5 sites that were "mature orchards" that were in active production, 15 sites that were "new orchards," containing young, not yet productive trees or no trees, and 5 sites that were "natural habitat" adjacent to orchards. The 15 "new orchard" sites ranged considerably in the type of cover crop mixes used and included sites that were not planted (bare ground), sites planted with grass dominated cover crops, and sites planted with grass/forb blends of cover crops. The specific cover crop mixtures used in each site ranged in the proportion of forb seed included in the seed mix. A map of all sites established in 2022 can be seen below in Figure 3. Several sites that were originally used in 2021 had to be moved. The updated locations are included in the map below (Figure 3).
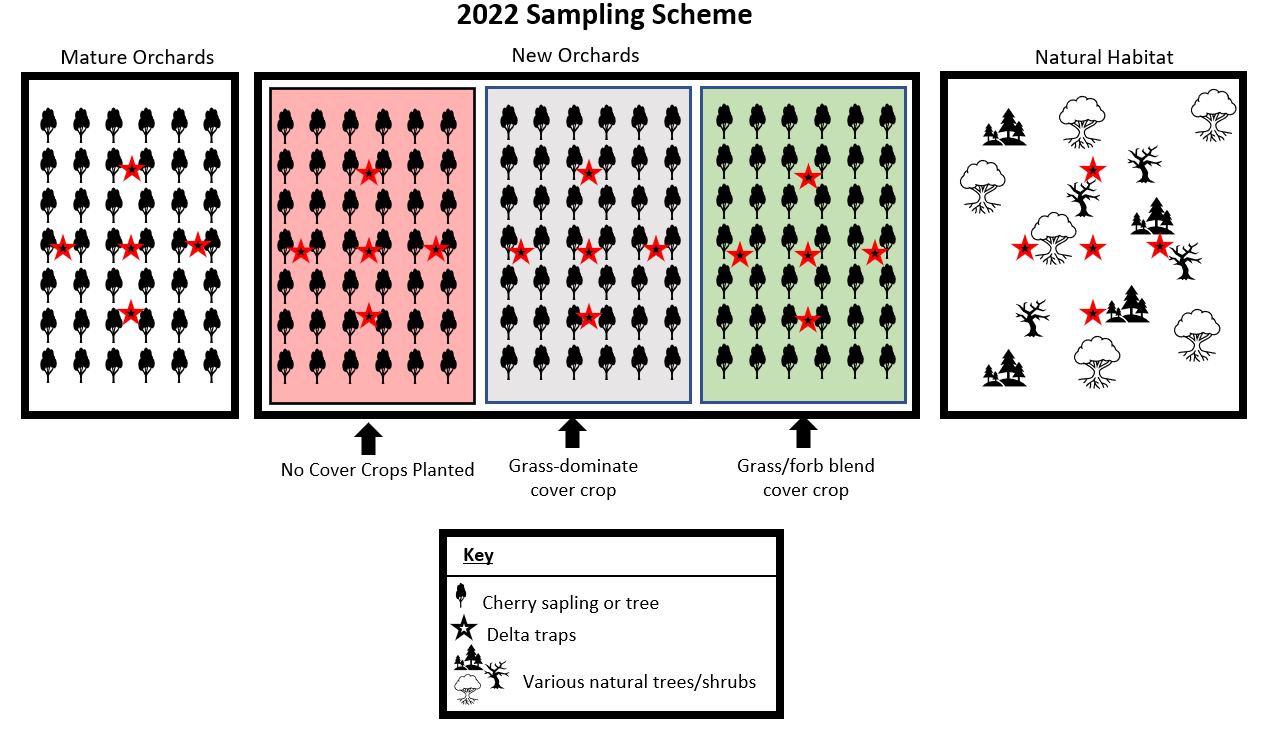
Figure 2. Treatment types and general sampling schematic for sampling beneficial invertebrate communities in cherry orchards and adjacent natural habitats. This figure is updated from our original proposed sampling schematic. For a map of sample sites, see Figure 3, or a updated, detailed, site specific sampling schematic, see Figure 4 below.
Objective 1: Inventory non-pollinator beneficial invertebrates in orchards and natural habitats in the Mid-Columbia Basin and examine habitat characteristics associated with their distribution and community composition.
Field Methods
To address Objective 1, we conducted preliminary sampling in 2021 at 20 of our 25 sample sites. In April 2022, we set up all of our 25 sampling sites including scouting and evaluating the 5 remaining sites that were not used in 2021. Several sites were moved from their 2021 locations to accommodate on the ground changes within our sites. We have monitored each of these sites monthly from April-August of 2022 for beneficial invertebrates. Our original sampling plan included bi-monthly sampling however, each sampling periods took well over 200 person hours (typically 2 people working) to complete, thus we reduced sampling to monthly sampling. Based on preliminary data collected in the summer of 2021, and preliminary results from 2022, we know that this was sufficient sampling intensity to answer our research questions and complete the objectives outlined in our research proposal. Sampling bimonthly would not have been possible based on the amount of time each sampling period takes. Cumulatively we conducted over 1,000 person-hours of fieldwork in 2022 for the project and have spent substantially more time in the lab processing and sorting the samples that we collected in the field.
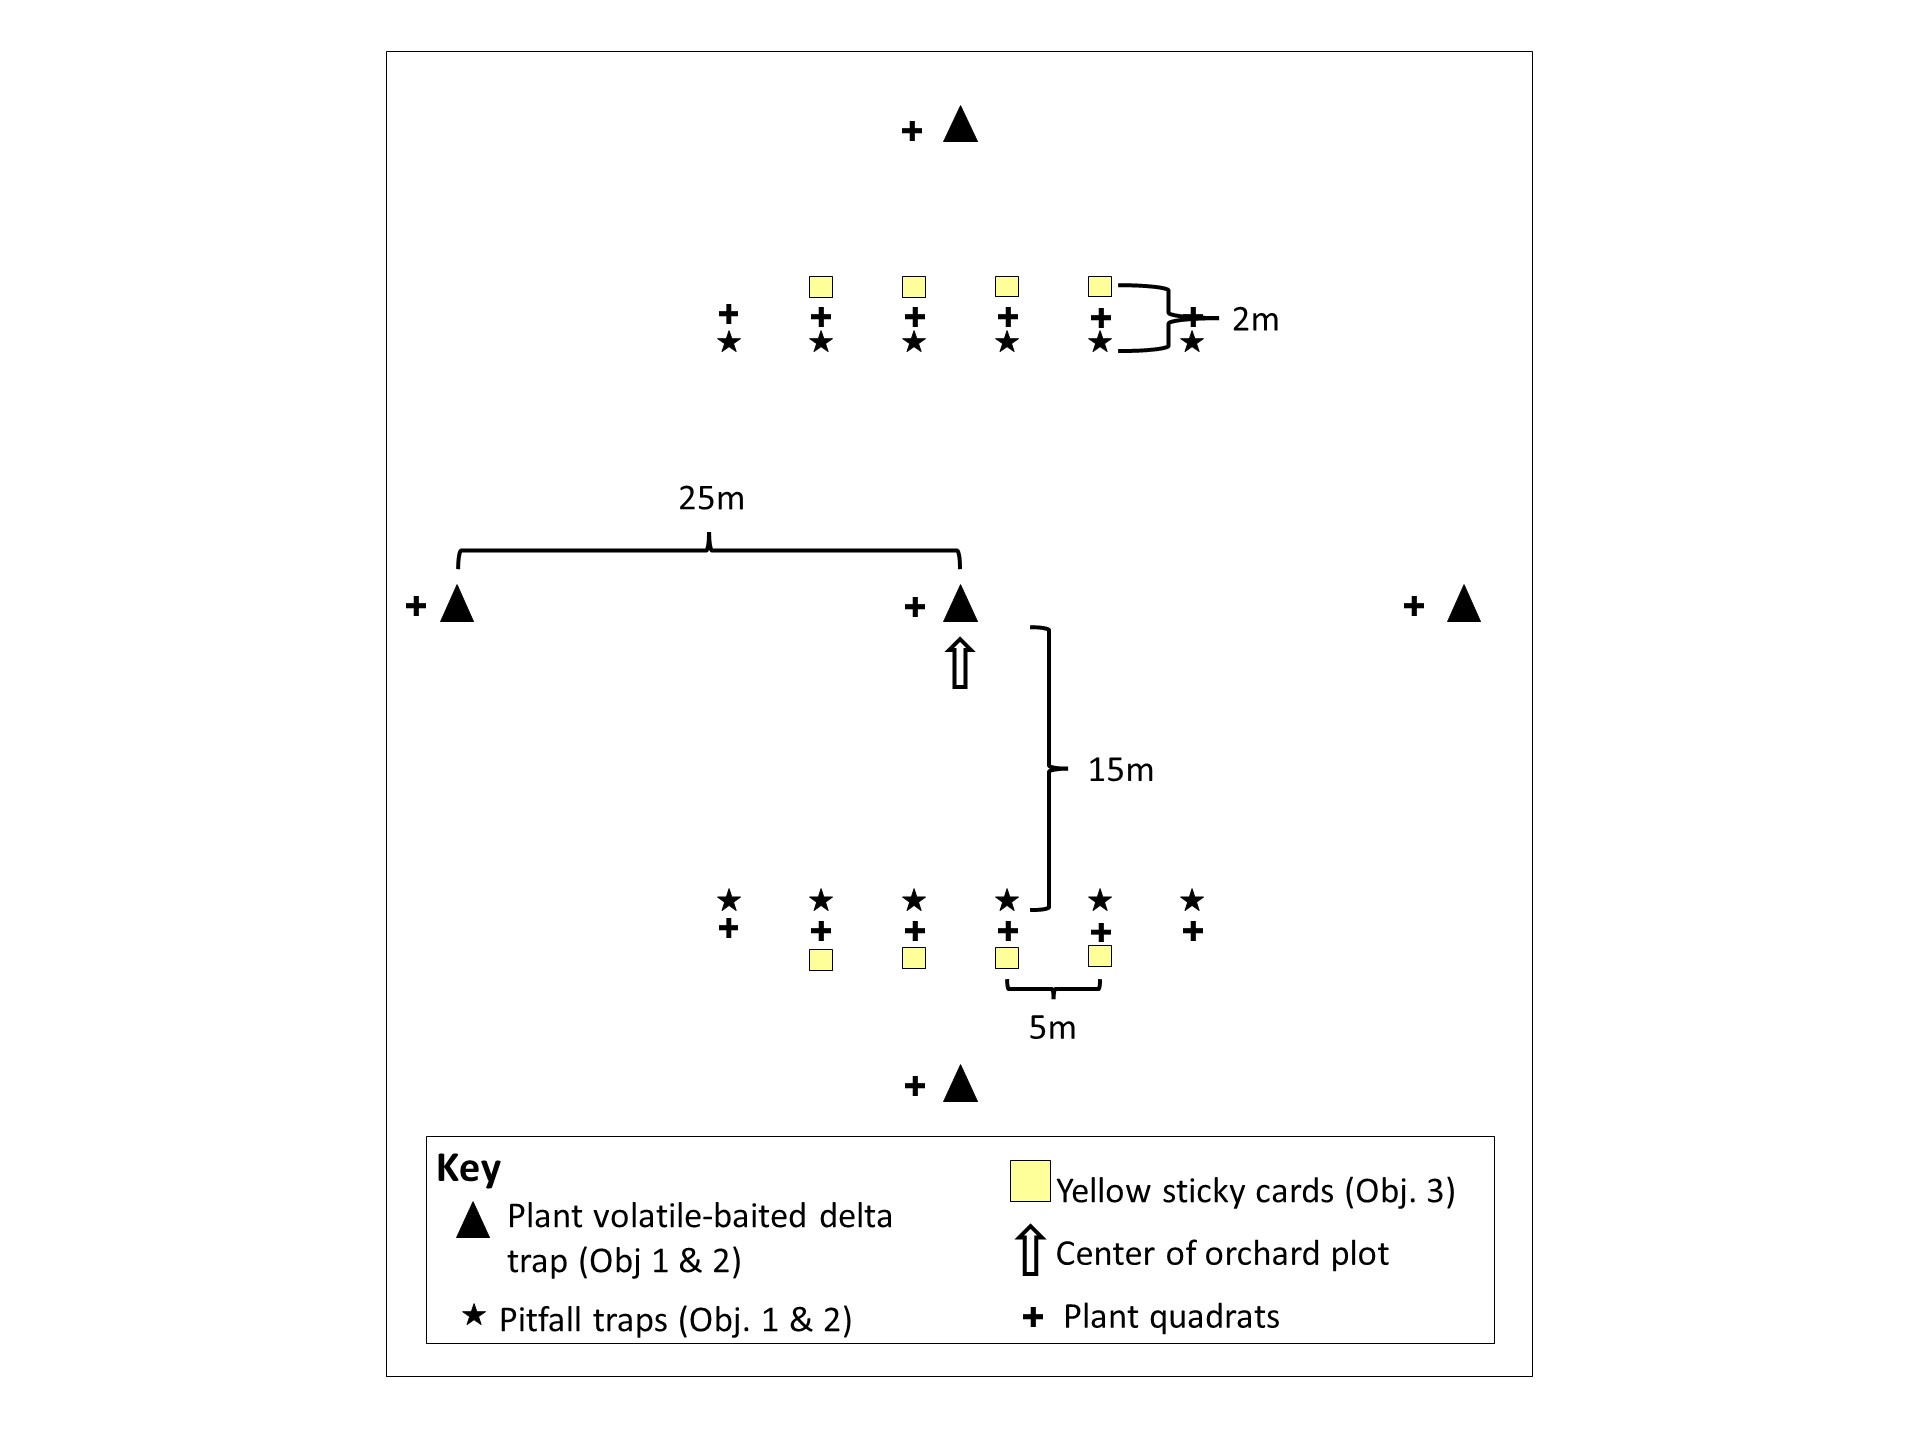
During April, May, June, July, and August of 2022, we collected beneficial invertebrates using four methods. Pitfall traps were used to capture and catalog terrestrial beneficial invertebrates (e.g., ground beetles, spiders). Aerial beneficial invertebrates (e.g., Hymenoptera, lacewings, parasitoid flies) were collected using delta traps baited with plant-volatile compounds known to attract a wide range of beneficial invertebrates (Jones et al., 2016; DuPont and Strohm, 2020), yellow sticky cards were positioned just inside (or above) the groundcover layer, and pan traps (yellow, blue, and white fluorescent painted cups filled with water, designed to mimic flowers and attract flower visiting invertebrates). Five baited delta traps, 12 pitfall traps, ten yellow sticky cards, and 15 pan traps (5 each of blue, yellow and white) were used during each sampling period in each site (Figure 4). During sampling periods, traps were left open for approximately three days (72 hours) at a time. Longer duration trapping was not feasible due to trap saturation (sticky traps) and rapid evaporation of liquid from pitfall and pan traps. Upon collection, we stored collected samples in the lab and sorted and pinned specimens. We are currently working on identifying beneficial invertebrates to the lowest taxonomic level possible using published dichotomous keys.
Data on environmental and plant community characteristics was also collected at each site. Environmental variables that were collected include incident solar radiation at each site (measured using a Solar PathFinder tool), canopy density (measured using a densiometer). Other environmental variables including slope aspect/angle, elevation, distance to nearest natural habitat, and size of habitat fragment will be determined later using GIS software. During April - August, we sampled plant communities using quadrats, once per month at 17 uniformly spaced points/site (Figure 5). Within each quadrat, we counted the number of blooming stems by plant species and measured the height of the tallest woody and herbaceous plants. Photos were taken of each quadrat for each month (a total of 2,125 photos) and are currently being sorted and used to measure ground cover composition. At each sampling site, we counted all of the trees over 5 cm in diameter (by species) inside of a 50 m x 50 m sampling grid.
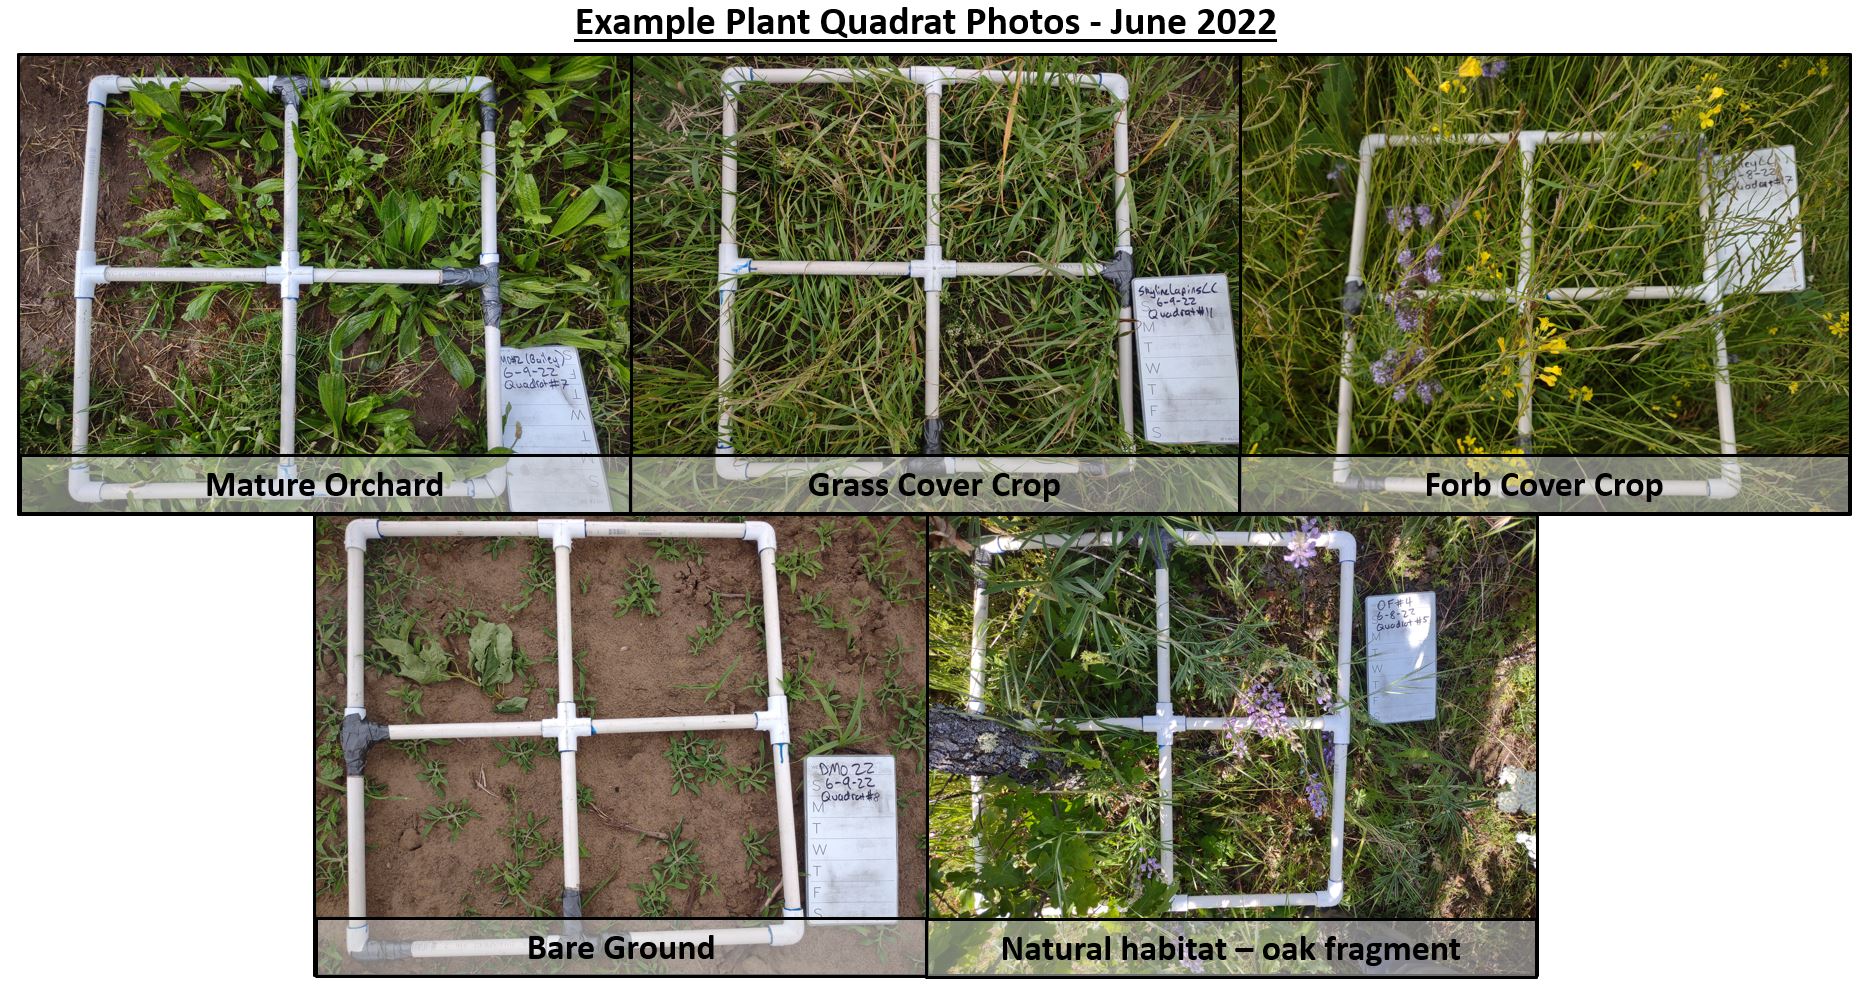
Figure 5: Plant quadrats were used to assess plant community composition and plant heights at 17 evenly spaced points in each site.
Statistical Analyses
Since we are still wrapping up lab work, we have not formally begun statistical analyses. The approaches we plan on using are outlined below, along with some preliminary analyses and results that are described in the "Research Results" section of this report.
Beneficial invertebrate communities will be described in terms of abundance and taxa richness, diversity, and community composition. A list of beneficial invertebrate taxa will be generated for each habitat type. Community patterns will be analyzed by sampling period across the season to understand what kinds of beneficials may be expected throughout the growing season in each habitat type. Two analyses commonly used in community ecology, multi-response permutation procedures (MRPP) and non-metric multidimensional scaling (NMDS) (McCune et al., 2002), will be used to evaluate if and how beneficial invertebrate communities vary in each of the surveyed habitat types.
To understand how environmental and plant variables affect natural enemy richness, diversity, and abundance across treatment types, generalized linear mixed models (GLMMs) with repeated measures will be used with natural enemy abundance, richness, and diversity as response variables. Habitat variables and types will be used as explanatory variables in the GLMM models. We will also use total blooming stem count and species richness as an explanatory variable in our GLMM models. GLMMs can handle a broad range of data types and are able to account for repeated sampling efforts within the same sample sites. We will consult with a statistician to ensure that appropriate model forms and statistical distributions are used. To understand how environmental and plant variables influence species composition of beneficials, we will correlate variables with NMDS axes.
Expected Results
In general, we predict that natural habitat fragments will support the highest diversity and richness of beneficial invertebrates because these habitats typically display a high degree of environmental heterogeneity and because pesticide exposure is limited to drift here, followed by mixed forb/grass cover crop sites (best cover-crop resources for beneficials), then grass-dominated cover crop sites. We expect the lowest beneficial invertebrate richness and diversity to be present in new orchards with bare-ground and mature orchards, as these sites have the heaviest pesticide applications, the least floral resources, and the most homogeneity in environmental variables.
We expect to identify habitat variables that are important for structuring beneficial invertebrate communities in the Mid-Columbia Basin, and that different groups of beneficials may be associated with different combinations of environmental variables. For example, many parasitoids depend on floral resources for food while hunting, so we expect that plant richness and diversity will be related to beneficial invertebrate community composition and that higher plant species richness and diversity will be correlated to more adult nectar-feeding species (Heimpel, 2019). In contrast, other beneficial groups, such as spiders and carabid beetles, may be more associated with physical plant structure and types of soil surface coverage. For example, some common groups of spiders are associated with large amounts of litter (Smith et al., 2019; Smith DiCarlo and DeBano, 2019). We expect multivariate analyses to reveal that cover-cropped sites are most similar to each other while mature orchard, bare ground, and natural habitat sites differ substantially from each other and from cover-cropped sites in multivariate community space.
Objective 2: Determine the ability of different cover-cropping regimes (no cover crop vs. grass dominant cover crops vs. a grass and forb mixed cover crops) to enhance beneficial invertebrate communities.
Field Methods
To address Objective 2, we used a subset of the 25 sites identified in the methods for Objective 1 will be used, which included all the new orchard sites with varied cover crop regimes (no cover crops vs. grass dominated vs. grass/forb mix), resulting in a total of 15 sites (5 replicates per cover crop regime). Beneficial invertebrates were collected in the sampling efforts described above (Objective 1) and will be used to understand how each of the three cover-cropping regimes affect abundance, diversity, richness, and community composition of beneficial invertebrates in new orchards.
Statistical Methods
To analyze difference in average abundance, richness, and diversity in each of the three cover-cropping treatments, we will use GLMMs, allowing us to determine which cover-cropping treatment produces highest abundance, diversity and richness of beneficial invertebrates.
We will conduct an indicator species analysis (ISA) to help us identify beneficial invertebrate taxa that are closely tied to certain cover-cropping treatments, allowing us to make specific estimates of what beneficial taxa producers may find if they implement each type of cover-cropping treatment. This will potentially allow producers to create habitat targeted at increasing specific beneficials.
Expected Results
Because adults of many beneficial species rely on nectar, we expect that the mixed forb/grass cover crop treatment will have higher abundance, richness, and diversity of beneficial invertebrate taxa, than the grass-dominated cover crop. We predict that bare ground will have the least abundance, richness, and diversity because of its lack of floral resources or habitat heterogeneity.
Objective 3: Investigate the ability of different cover-cropping regimes to reduce the abundance of three common pest taxa (SWD, aphids, and leafhoppers).
Field Methods
To address Objective 3, we counted pest invertebrates on sticky cards and in other sampling methods employed. Simultaneously, 8 sticky cards (Murphy et al., 2012) were deployed at each site to sample aphids and leafhoppers (Figure 3). Through multiple conversations with growers and fruit tree entomologists in the region, we also determined that aphids were not a significant concern as a pest as current pest control regimes used to limit other pest species are effective at managing aphids. In processing sticky cards, we had not found many aphids but have counted a high number of leafhoppers and so have focused our efforts here.
Statistical Methods
We will use GLMM models that uses pest taxa abundance (e.g., leafhoppers) as a response variable to investigate if pest abundance is negatively correlated to beneficial invertebrate abundance or cover-cropping regimes.
Expected Results:
We expect that pest abundance will be lowest in mature orchards (because of pesticide application) but expect that within cover-cropping treatments, pest abundance will be lowest in mixed forb/grass cover crop sites, followed by grass-dominated cover crop sites, followed by bare ground sites. We expect pest abundance to be negatively correlated to natural enemy abundance.
Expected Impact for Producers:
One primary reason for low adaptation of sustainable cover-cropping practices is lack of information on the potential costs and benefits of cover-cropping (Daryanto et al., 2019). We expect that this work will generate useable information for producers to make informed decisions about cover-cropping regimes in newly established orchards. We expect this information will include suggestions on how to best plan cover-cropping regimes to enhance beneficial communities in non-productive orchard spaces (e.g., new orchards, natural habitat fragments).
The analysis of beneficial invertebrate communities in natural habitat fragments will likely demonstrate that these areas are useful to growers as source populations of beneficials. The analysis of plant communities in fragments will identify native plants that are strongly correlated to beneficial invertebrate taxa and may be desirable for inclusion in future cover crop seed blends. We expect habitat characteristic analyses to help growers determine where the most robust beneficial invertebrate communities are on their property, allowing for the development of more precisely designed IPM plans the bolster desirable invertebrate populations. In other orchard systems, effectively designed IPM plans have been found to increase worker safety, reduce production costs, and increase biodiversity conservation on farms (Goldberger and Lehrer, 2016).
Finally, and perhaps most importantly, we expect our study to verify that cover crops do not increase the abundance of common pests (e.g., SWD, aphids) and cherry X-disease vectors (e.g., leafhoppers). This is a crucial step to reassure producers that enrolling their EQIP eligible lands in NRCS CIS programs targeting pollinator and natural enemy habitat enhancements will not result in increased pest pressure. If funded, this project is likely to encourage more producers to enroll in these programs and pave the way for future NRCS CIS programs and funding to Oregon farmers.
We are currently working with folks from NRCS and Xerces Society to develop best-practice documents for growers. This is an ongoing process and we are still expecting that these documents will begin to become available in June of 2024. In addition to knowledge from the trapping portions of our study, plant associations with particular sites and beneficial invertebrates will be integrated to inform seeding recommendations for growers interested in using cover crops in their fields.
General Results Overview:
Overall, we have pinned, counted, or sorted over 117,000 invertebrate specimens collected over 2021 and 2022 and are still busily processing the remaining sticky cards and identifying pinned/sorted specimens. While our results are still in a preliminary stage, we have started some data analysis and presented some of our results at the Orchard Pest Disease and Management Conference in Portland, OR on Jan 12, 2023, other results at the Ecological Society of America on August 7, 2023 in Portland, OR, and at several extension-style venues.
Thus far, we have found that a wide number of taxa occur in all sites. For example, we have identified wasps from 31 different subfamilies from 14 families in our samples from sticky cards. Additionally, we have identified wasps from 16 different subfamilies from 14 wasp families from pitfall traps and 10 subfamilies from 9 families in pan traps. Since these different methods capture different types of wasps, in total, we have identified 932 wasps from 49 different subfamilies in 29 different wasp families. Even at the scale of family or subfamily it is evident that wasps (or hymenopterans as a whole) are very diverse throughout our sites.
More detailed initial findings from our research are included in the report below. As we are still processing samples in the lab, we will continue to work on analyses, publications, and presentations as we continue to process samples and have complete invertebrate datasets for analysis.
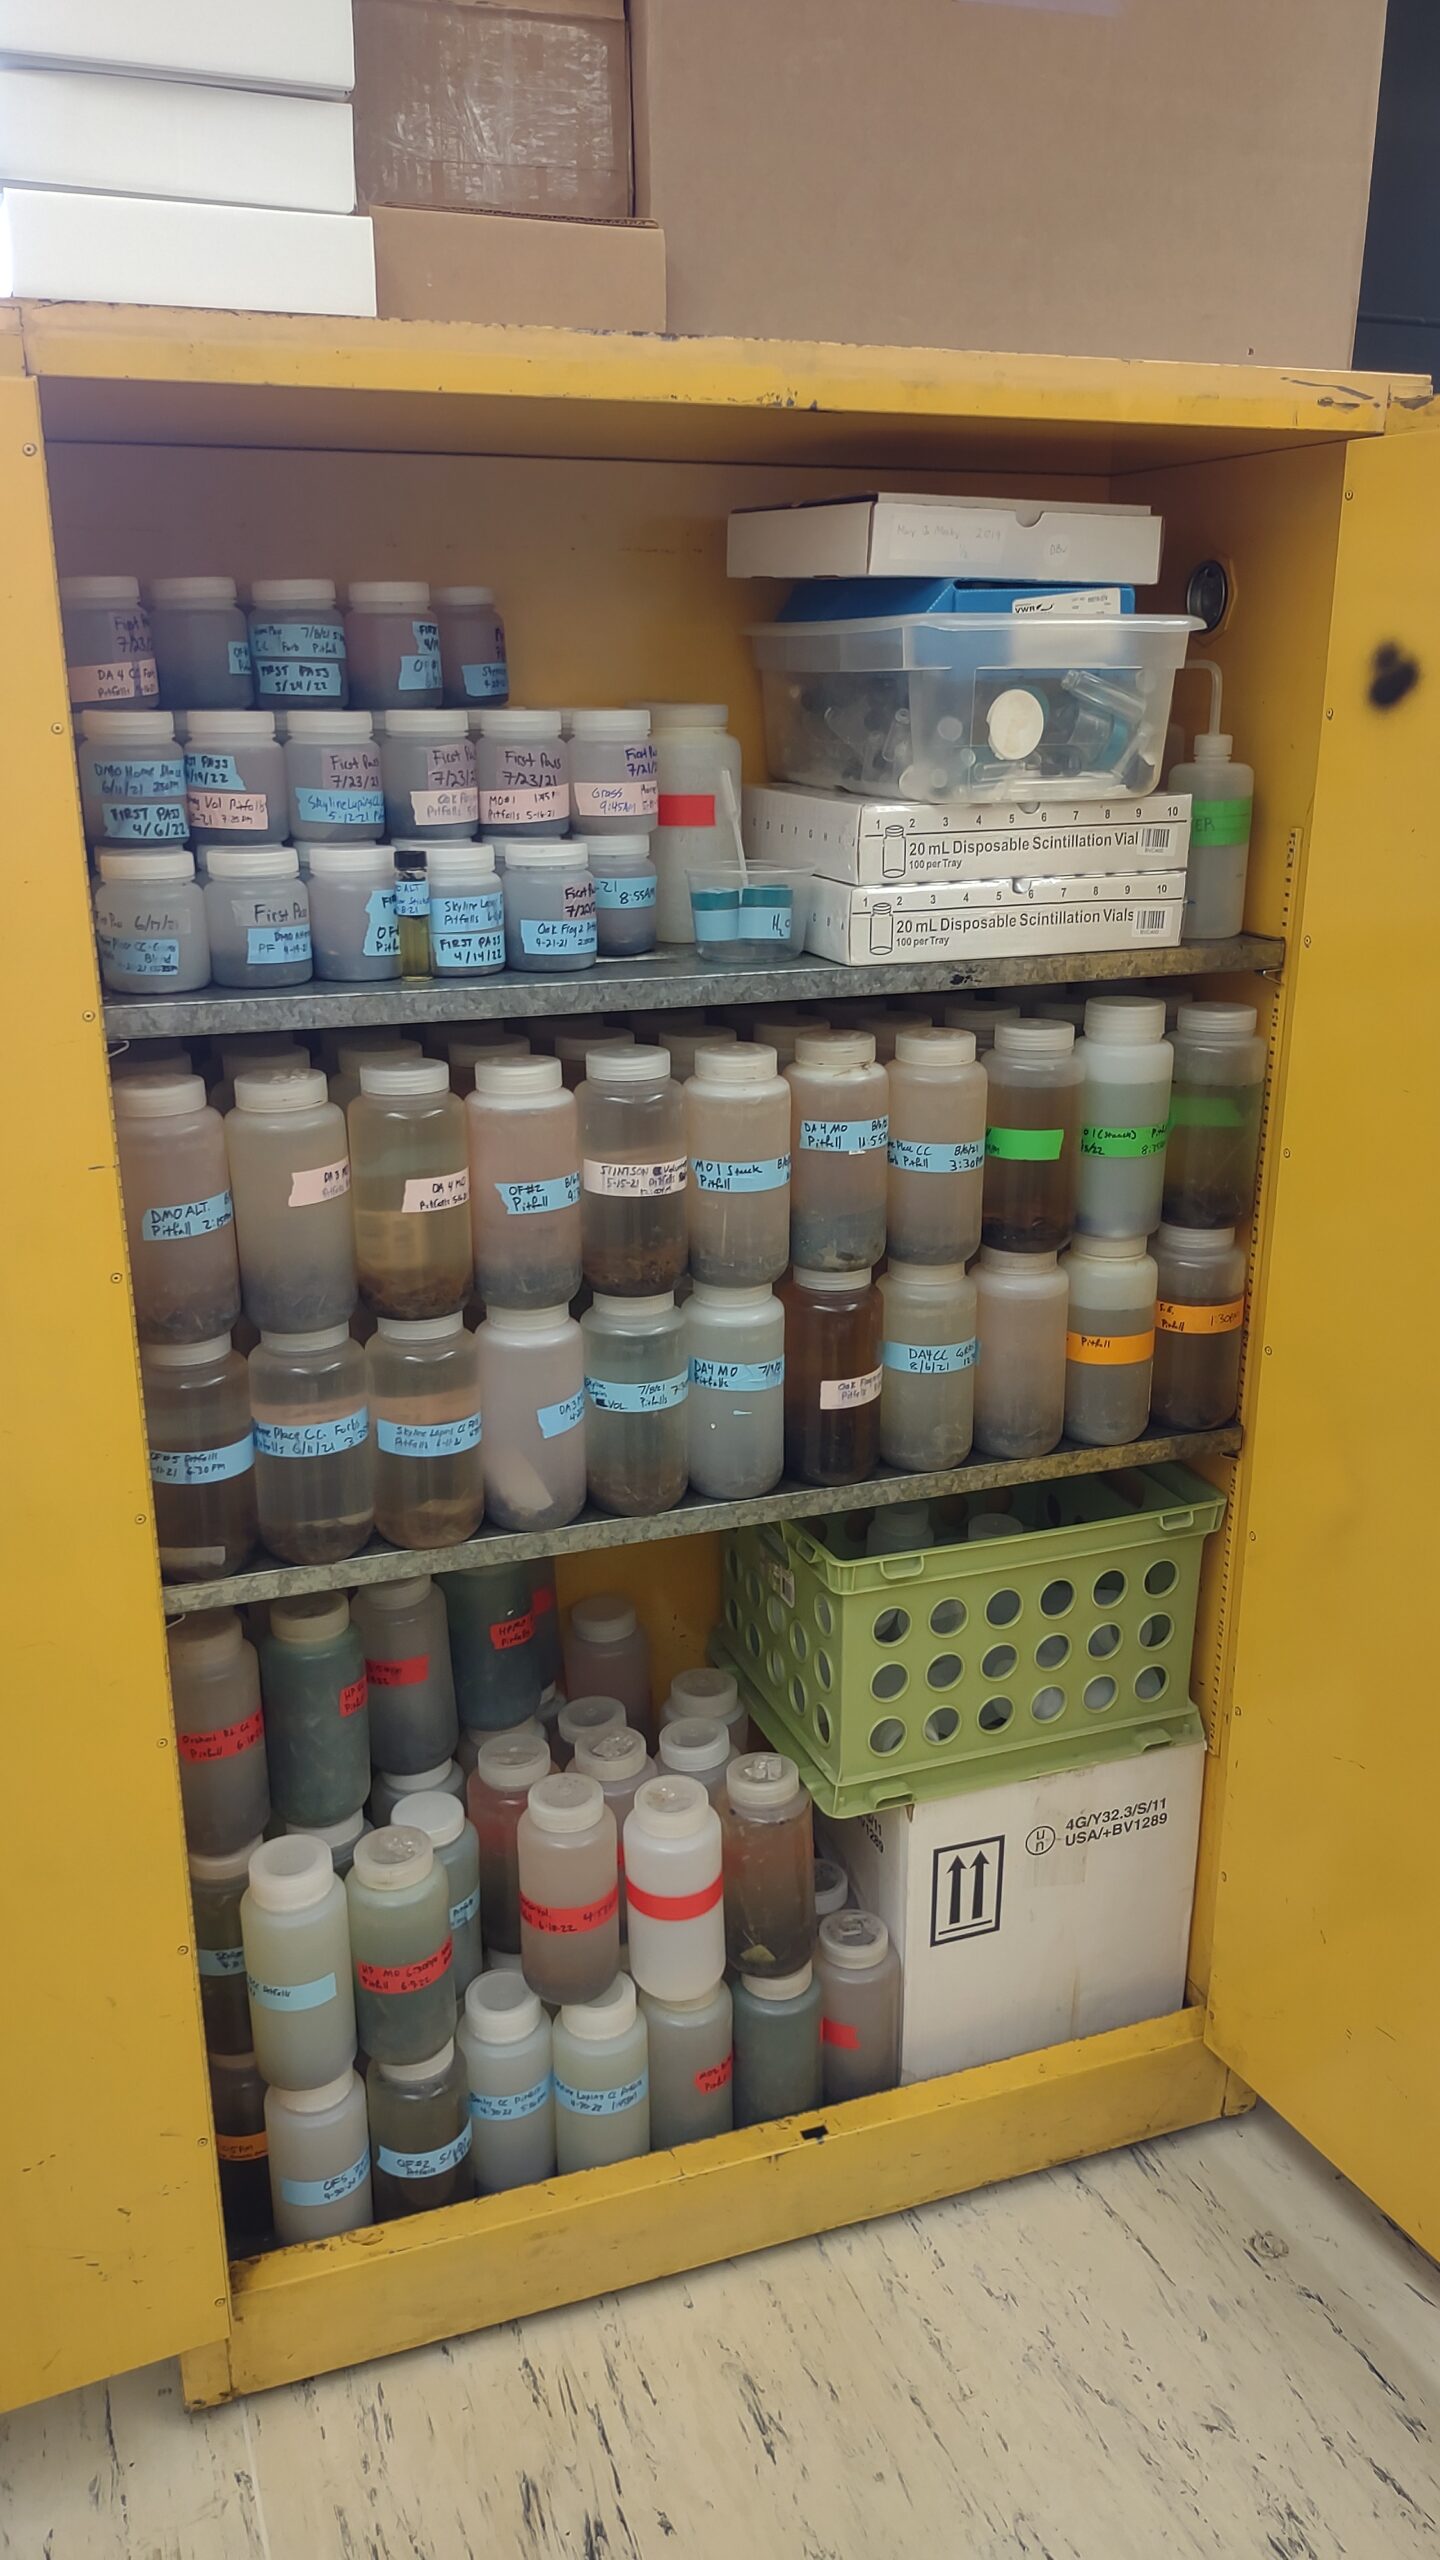
Most of our samples our currently stored in a freezer, in alcohol (Figure 6), or on insect pins (boxes stored in freezer to prevent dermestid beetle damage). Currently, all pitfall specimens are pinned and about half of our sticky card samples have been processed.
General Pitfall Results:
To date, we have pinned 6,496 invertebrates collected in pitfalls during our preliminary sampling season in 2021 and 7,859 invertebrates collected in pitfalls in 2022. We have also counted and roughly sorted (to order where possible) 17,842 smaller invertebrates (too small or fragile to pin) collected in 2021 pitfall traps and 18,902 collected in 2022 pitfall traps.
All in all, we collected 24,338 pitfall specimens in 2021 and 26,761 specimens in 2022. Since this is an immense number of specimens, processing has taken longer than expected and we are still working on sorting and identifying the processed samples. We are currently working through identification of beetles and have completed identification of all wasps (Fig. 7) captured in pitfalls (to family or to finer taxonomic levels where possible).
Below are a few pictures of some of our processed and pinned specimens:
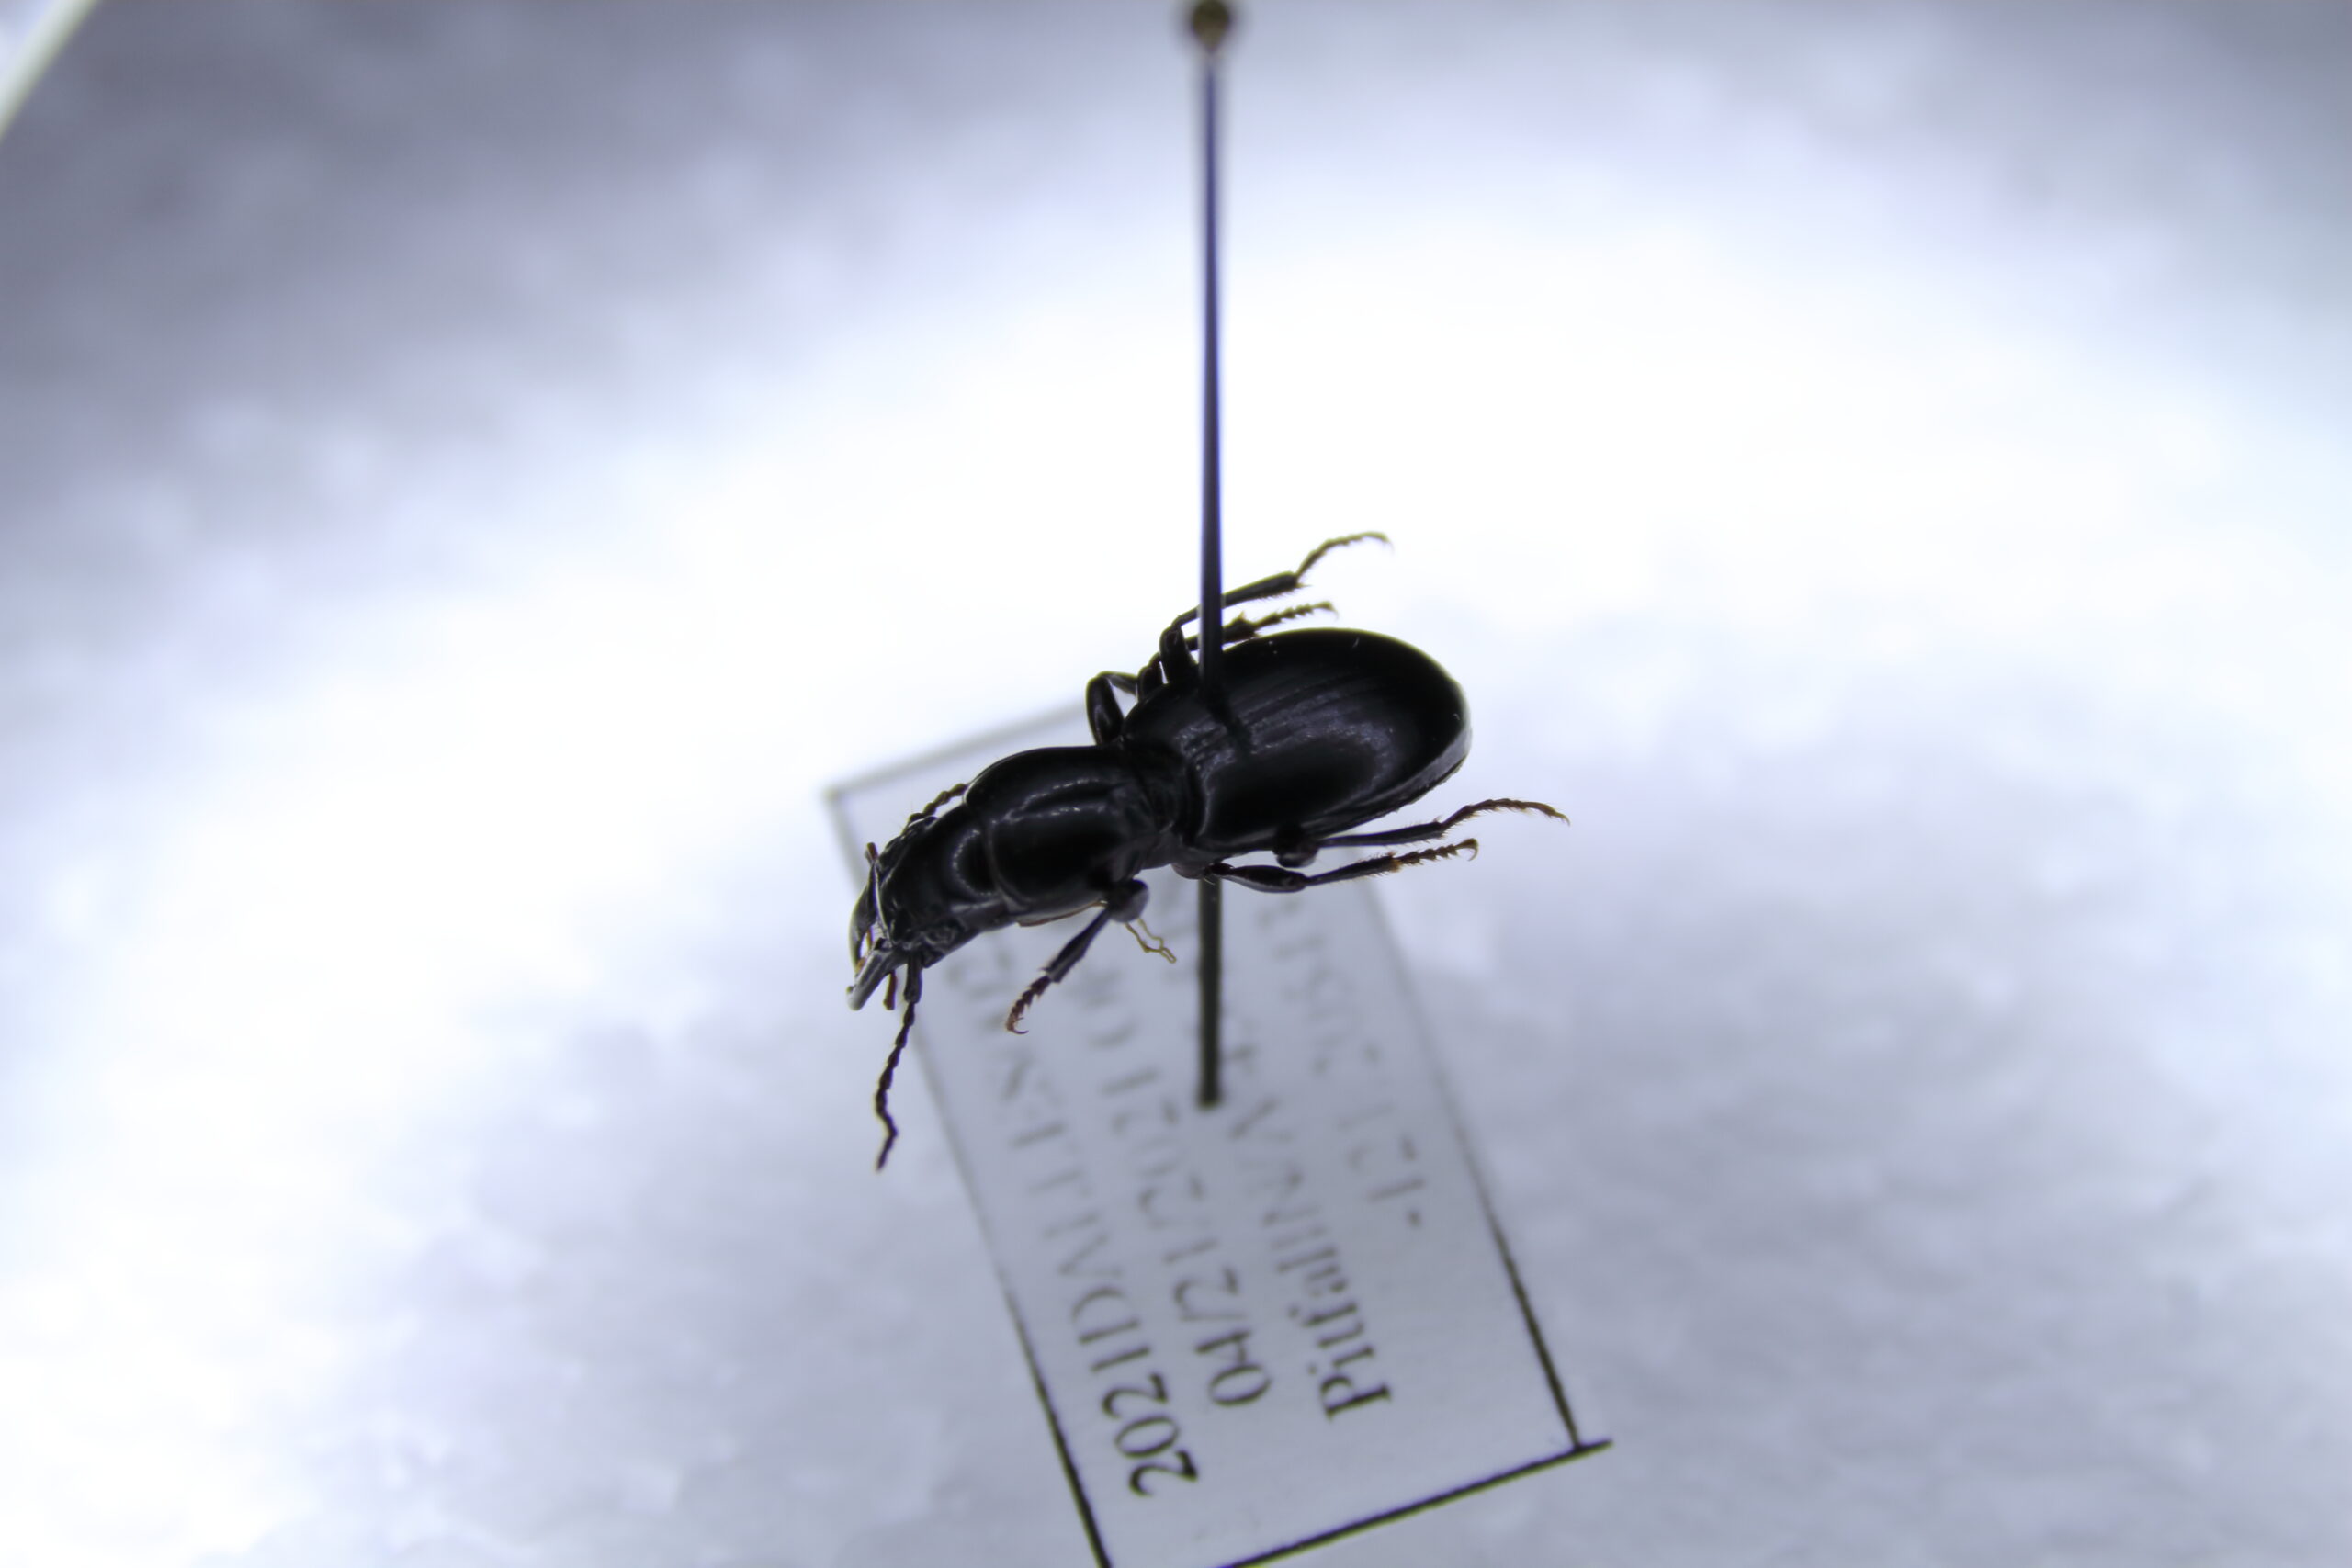
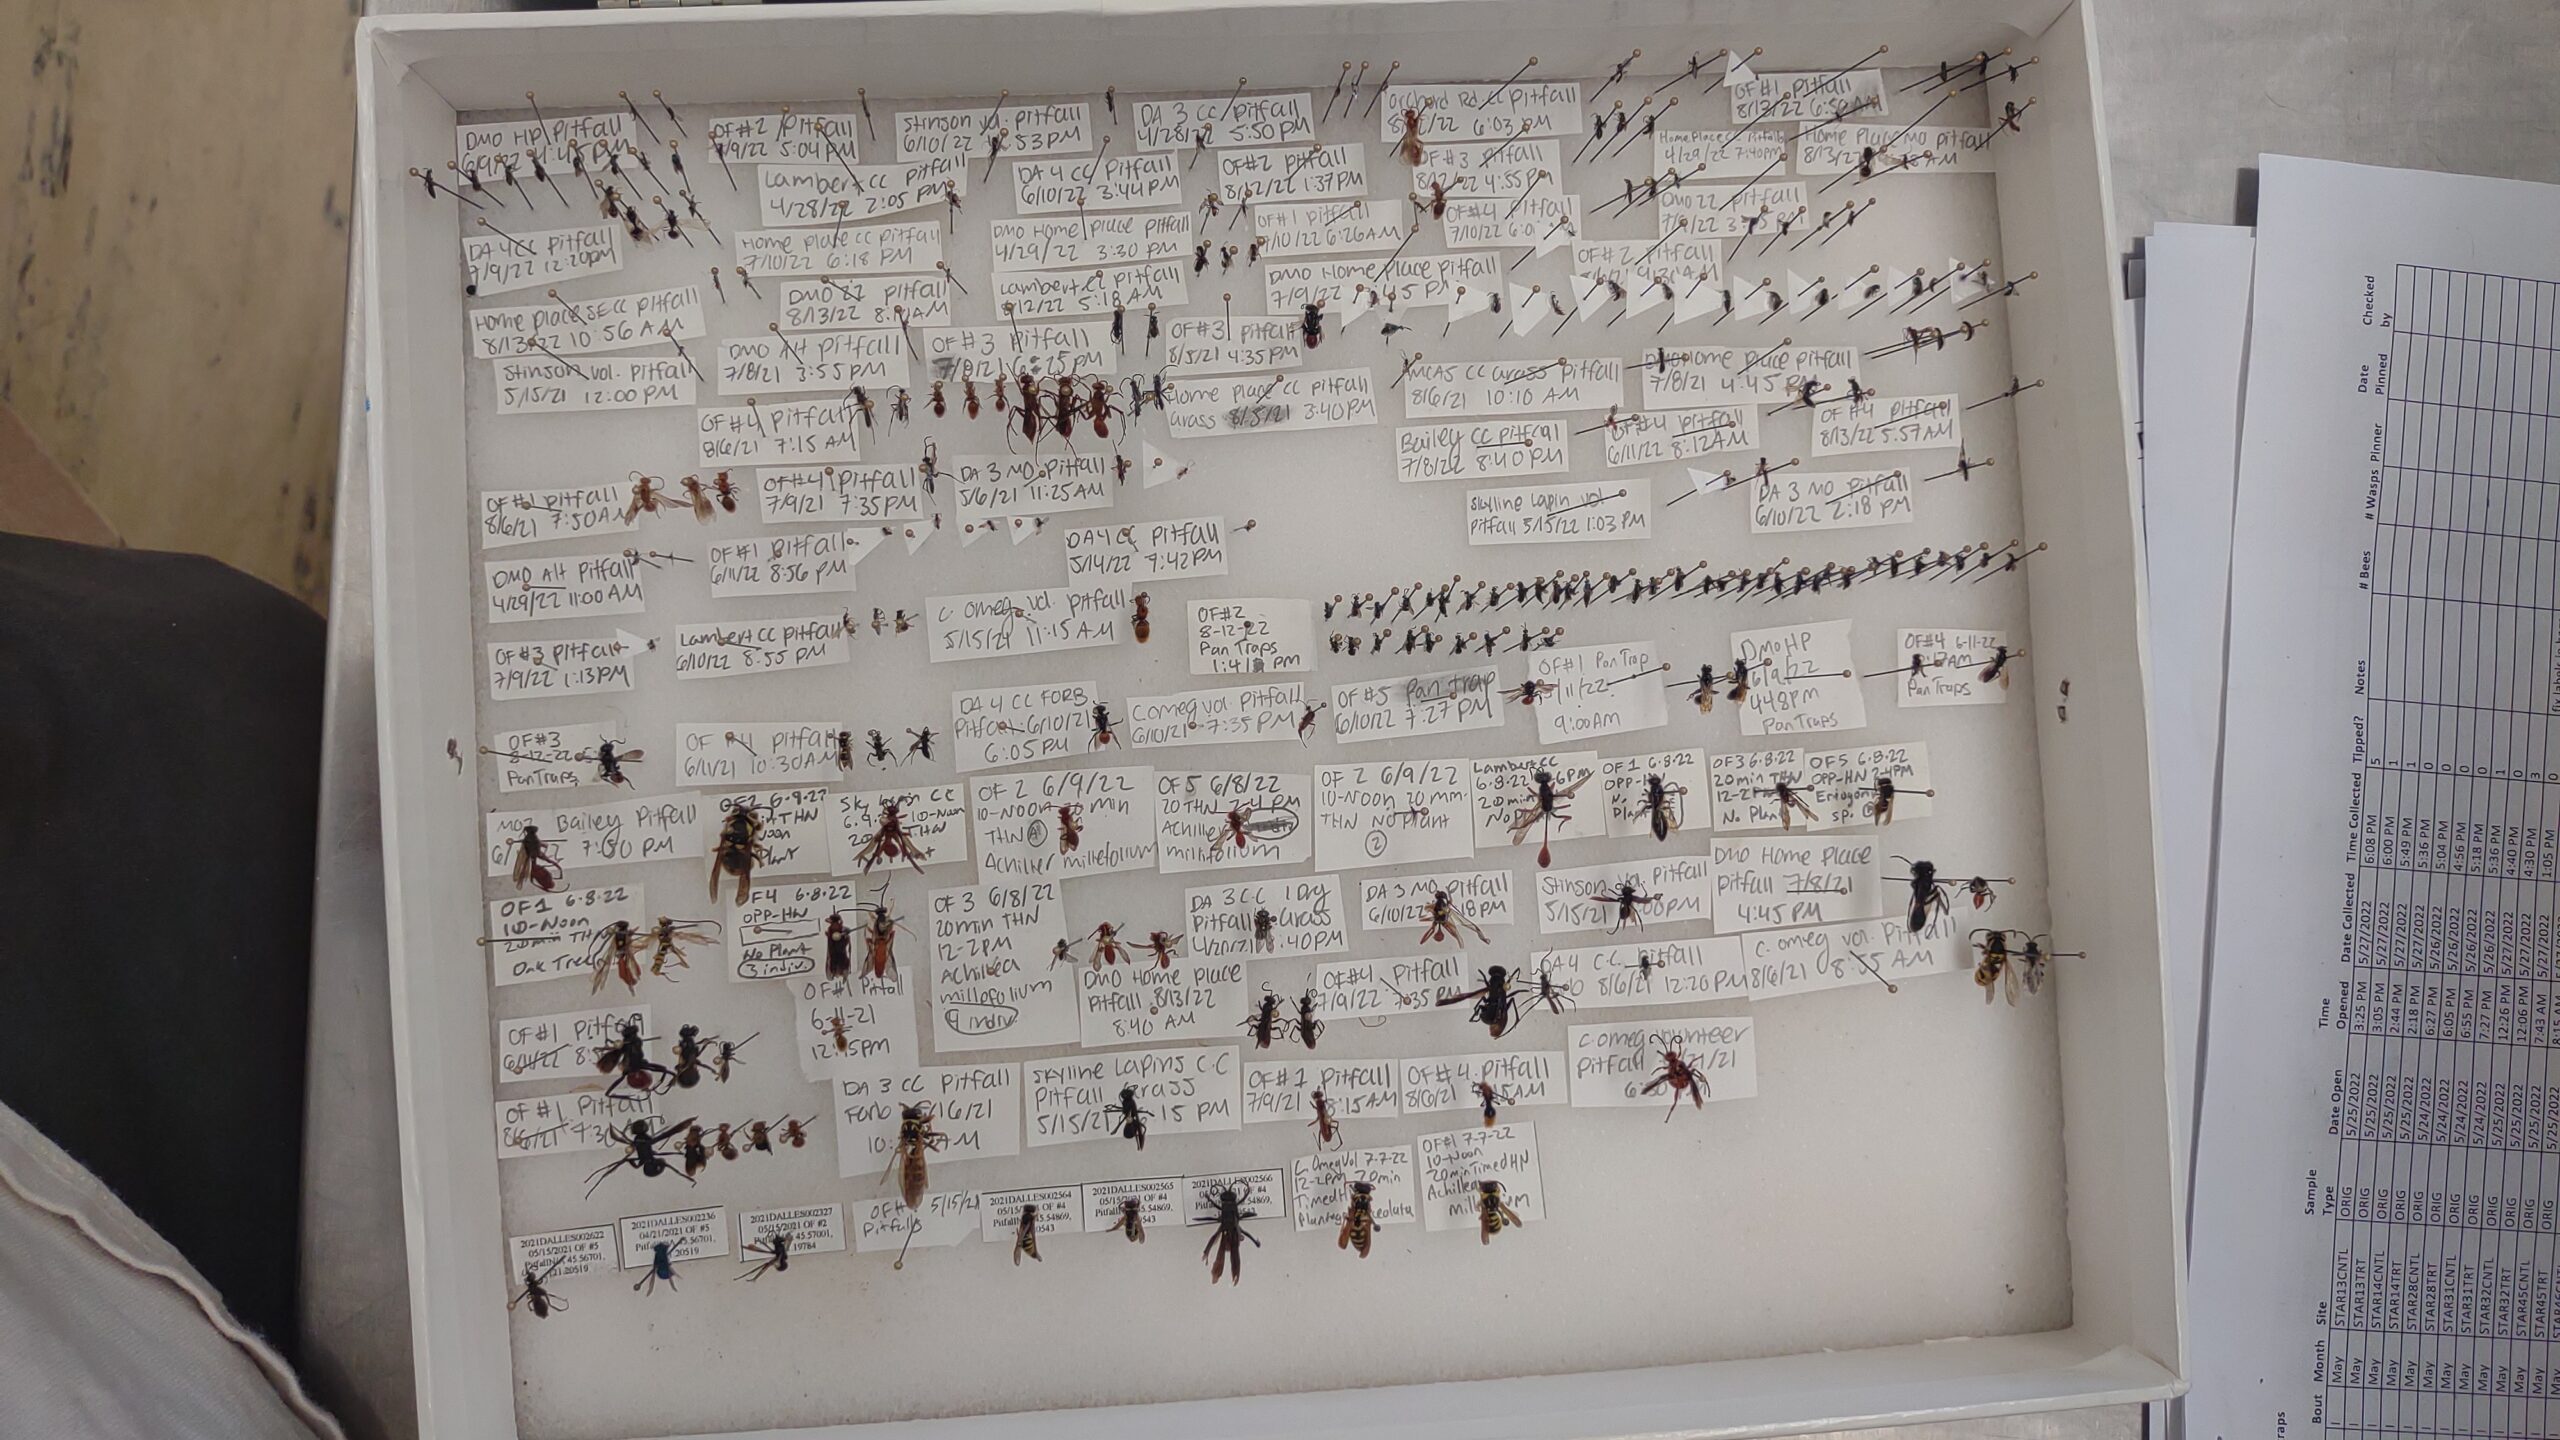
Figure 7: Top: Carabid beetle on a pin. This is a predatory beetle that may provide pest control services in orchards where it is found. Bottom: pinned wasps sorted from pitfall samples ready to be identified and sorted. Wasps will be identified to subfamily or lower taxonomic designations where possible.
General Sticky Card Results:
We are currently working on sorting and counting invertebrates that were collected on yellow sticky cards and on delta traps (Fig. 8). Since pitfall traps took longer to pin and sort than expected, we are behind where we expected to be with sticky card processing but are currently making good progress and are counting up specimens of beneficial taxa of interest including antlions, arachnids, beetles, lacewings, bees, snakeflies, and wasps. We have also made good progress counting potential pest invertebrates including leafhoppers, sawflies, and lepidopterans (butterflies and moths). In total, we have processed 1,127 sticky cards, on these cards, we have counted the total number of antlions, arachnids, beetles, honey bees, green lacewings, native bees, snakeflies, wasps, leafhoppers, lepidopterans, and sawflies, totaling over 62,000 total invertebrate counts. We are still sorting through many of our sticky cards, but have made substantial progress since our last report (we have processed over 800 additional cards since our last report in August.)
For beneficial invertebrates, to date, we have counted 3 antlions, 698 arachnids, 6,030 beetles, 4,672 honey bees, 787 green lacewings, 9,420 native bees, 27 snakeflies, and 8,710 wasps, totaling 30,347 potentially beneficial invertebrates.
As for pest invertebrates, to date, we have counted 19,562 leafhoppers, 676 lepidopterans, and 11,421 sawflies, totaling 31,659 potentially pestiferous invertebrates.
Of course, some taxa (e.g., beetles) can include beneficial and pest species, and we plan to use other data sources (e.g., pitfall traps) to understand the general composition of beneficial vs. pest invertebrates for these taxa as identification of species can be very challenging with sticky card specimens. Other taxa of interest require special care in identifying (e.g., wasps) and so we have been slower to count these specimens.
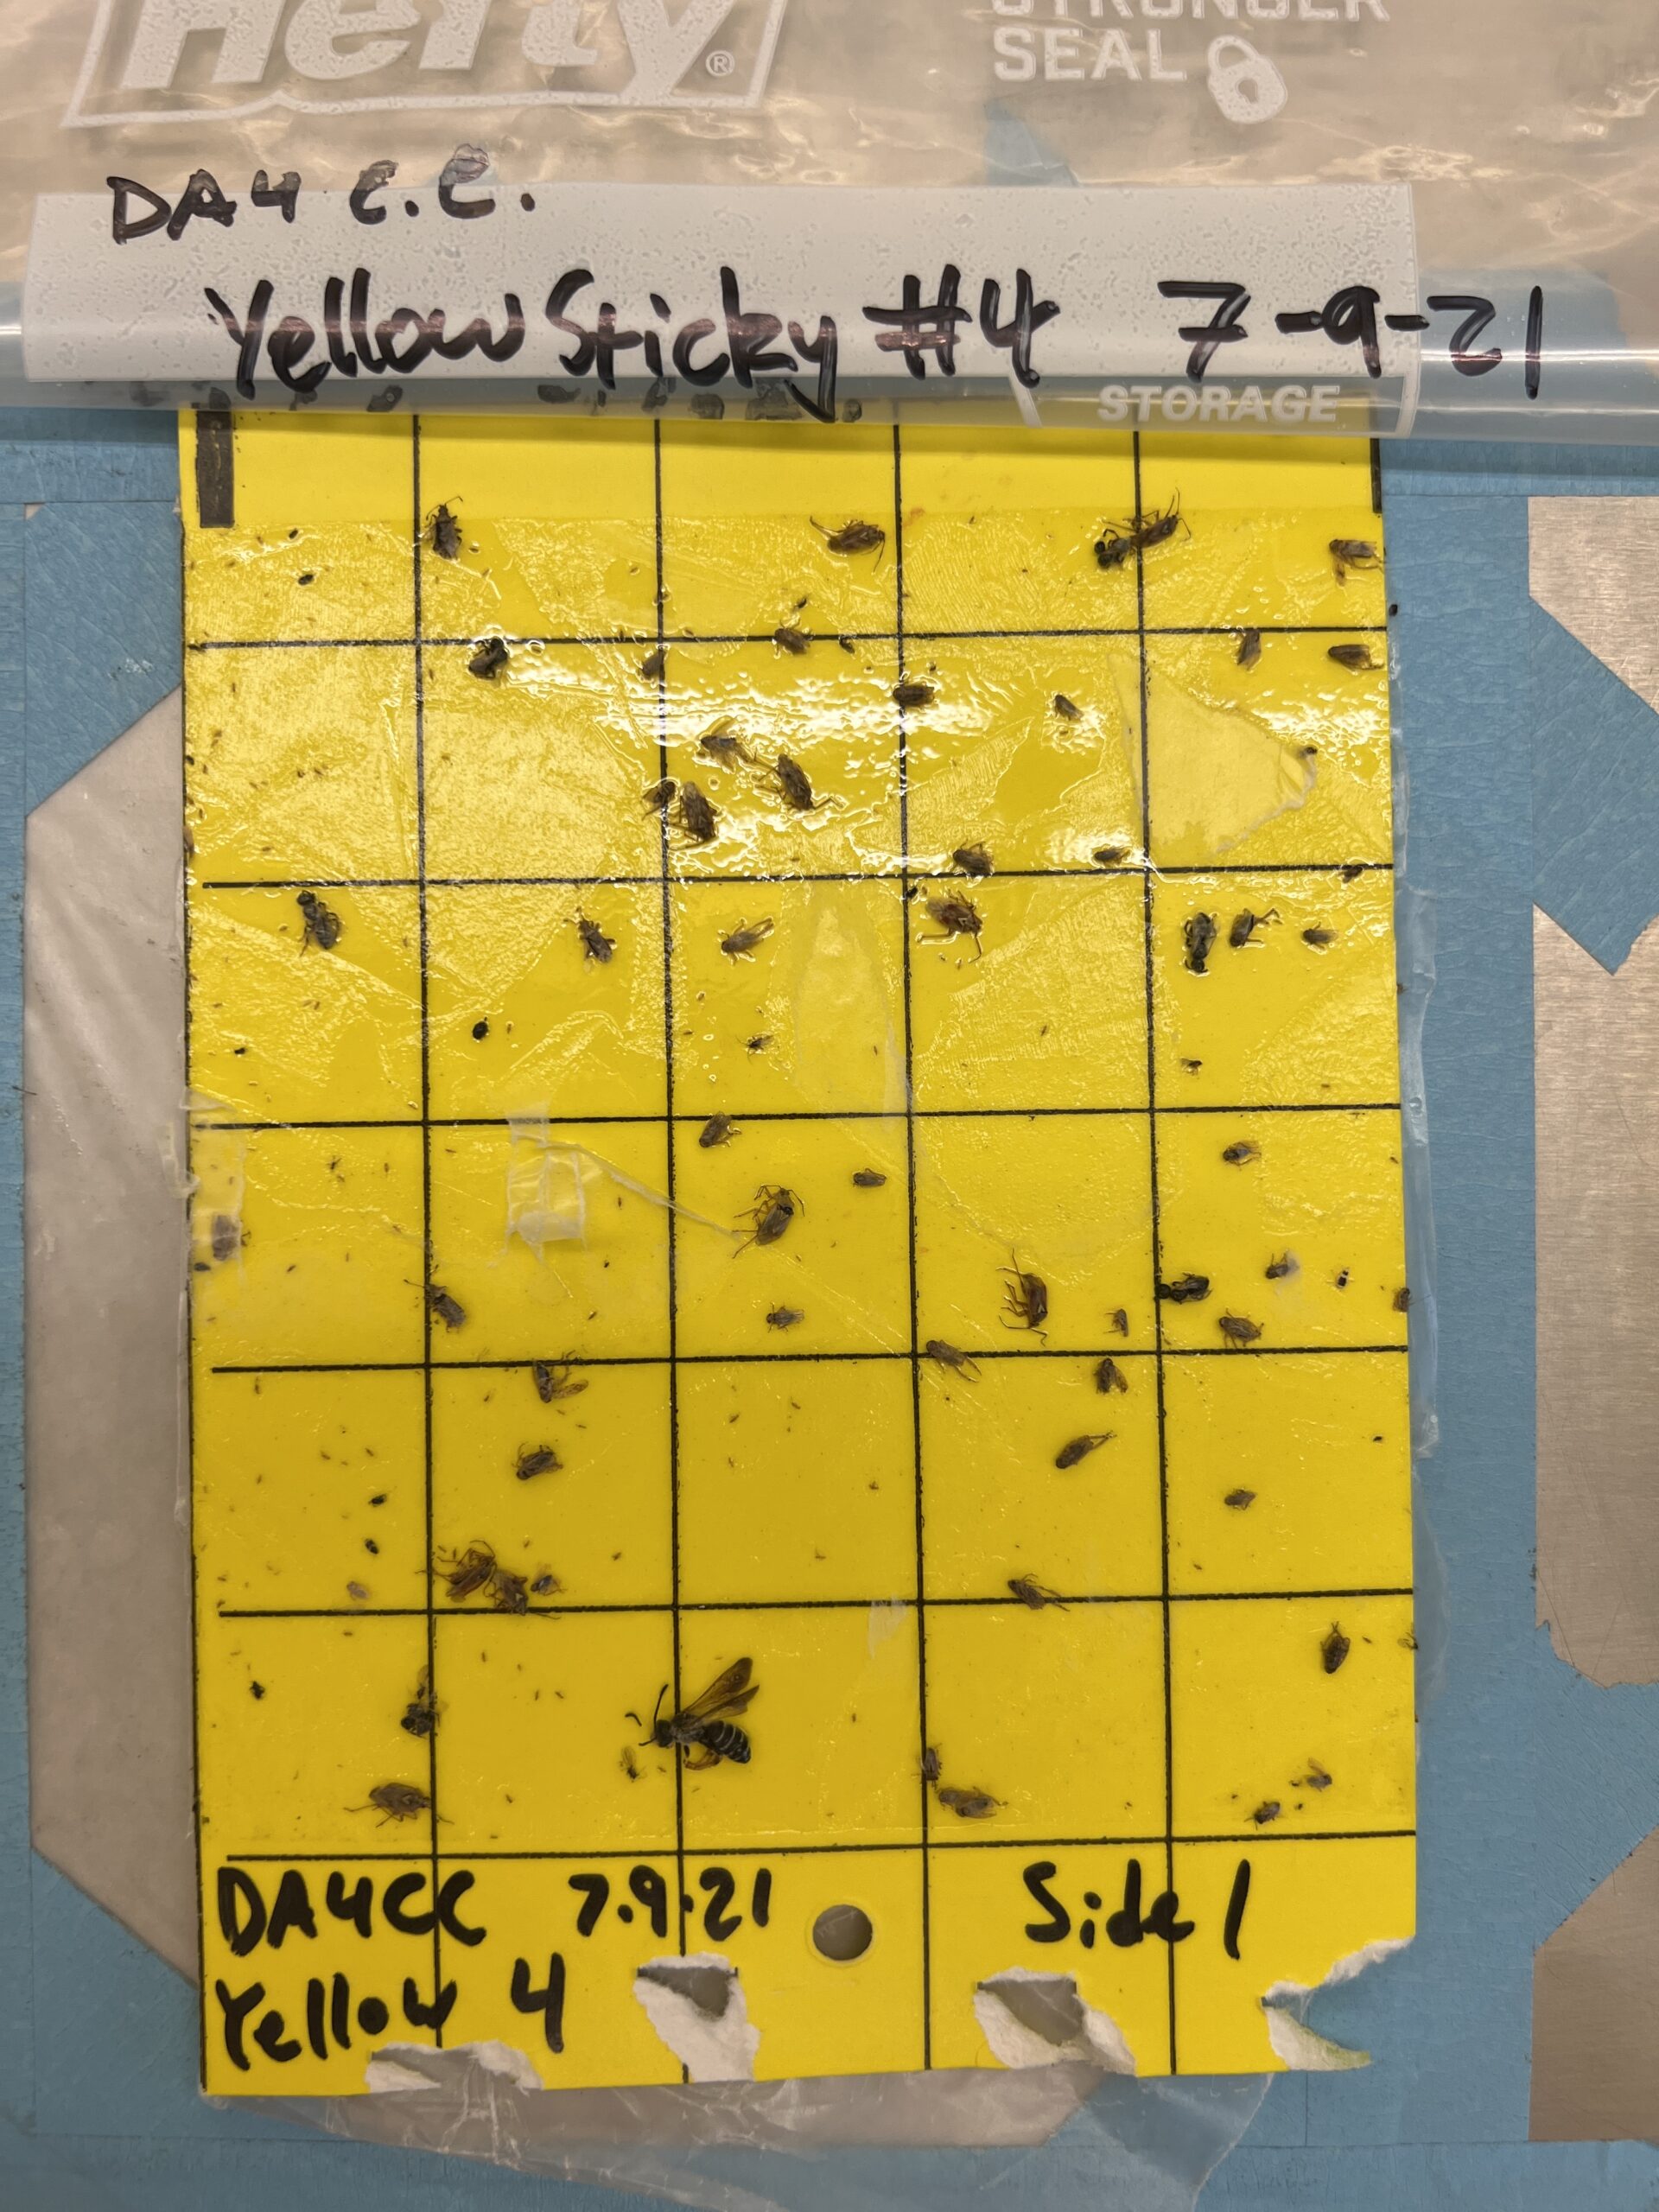
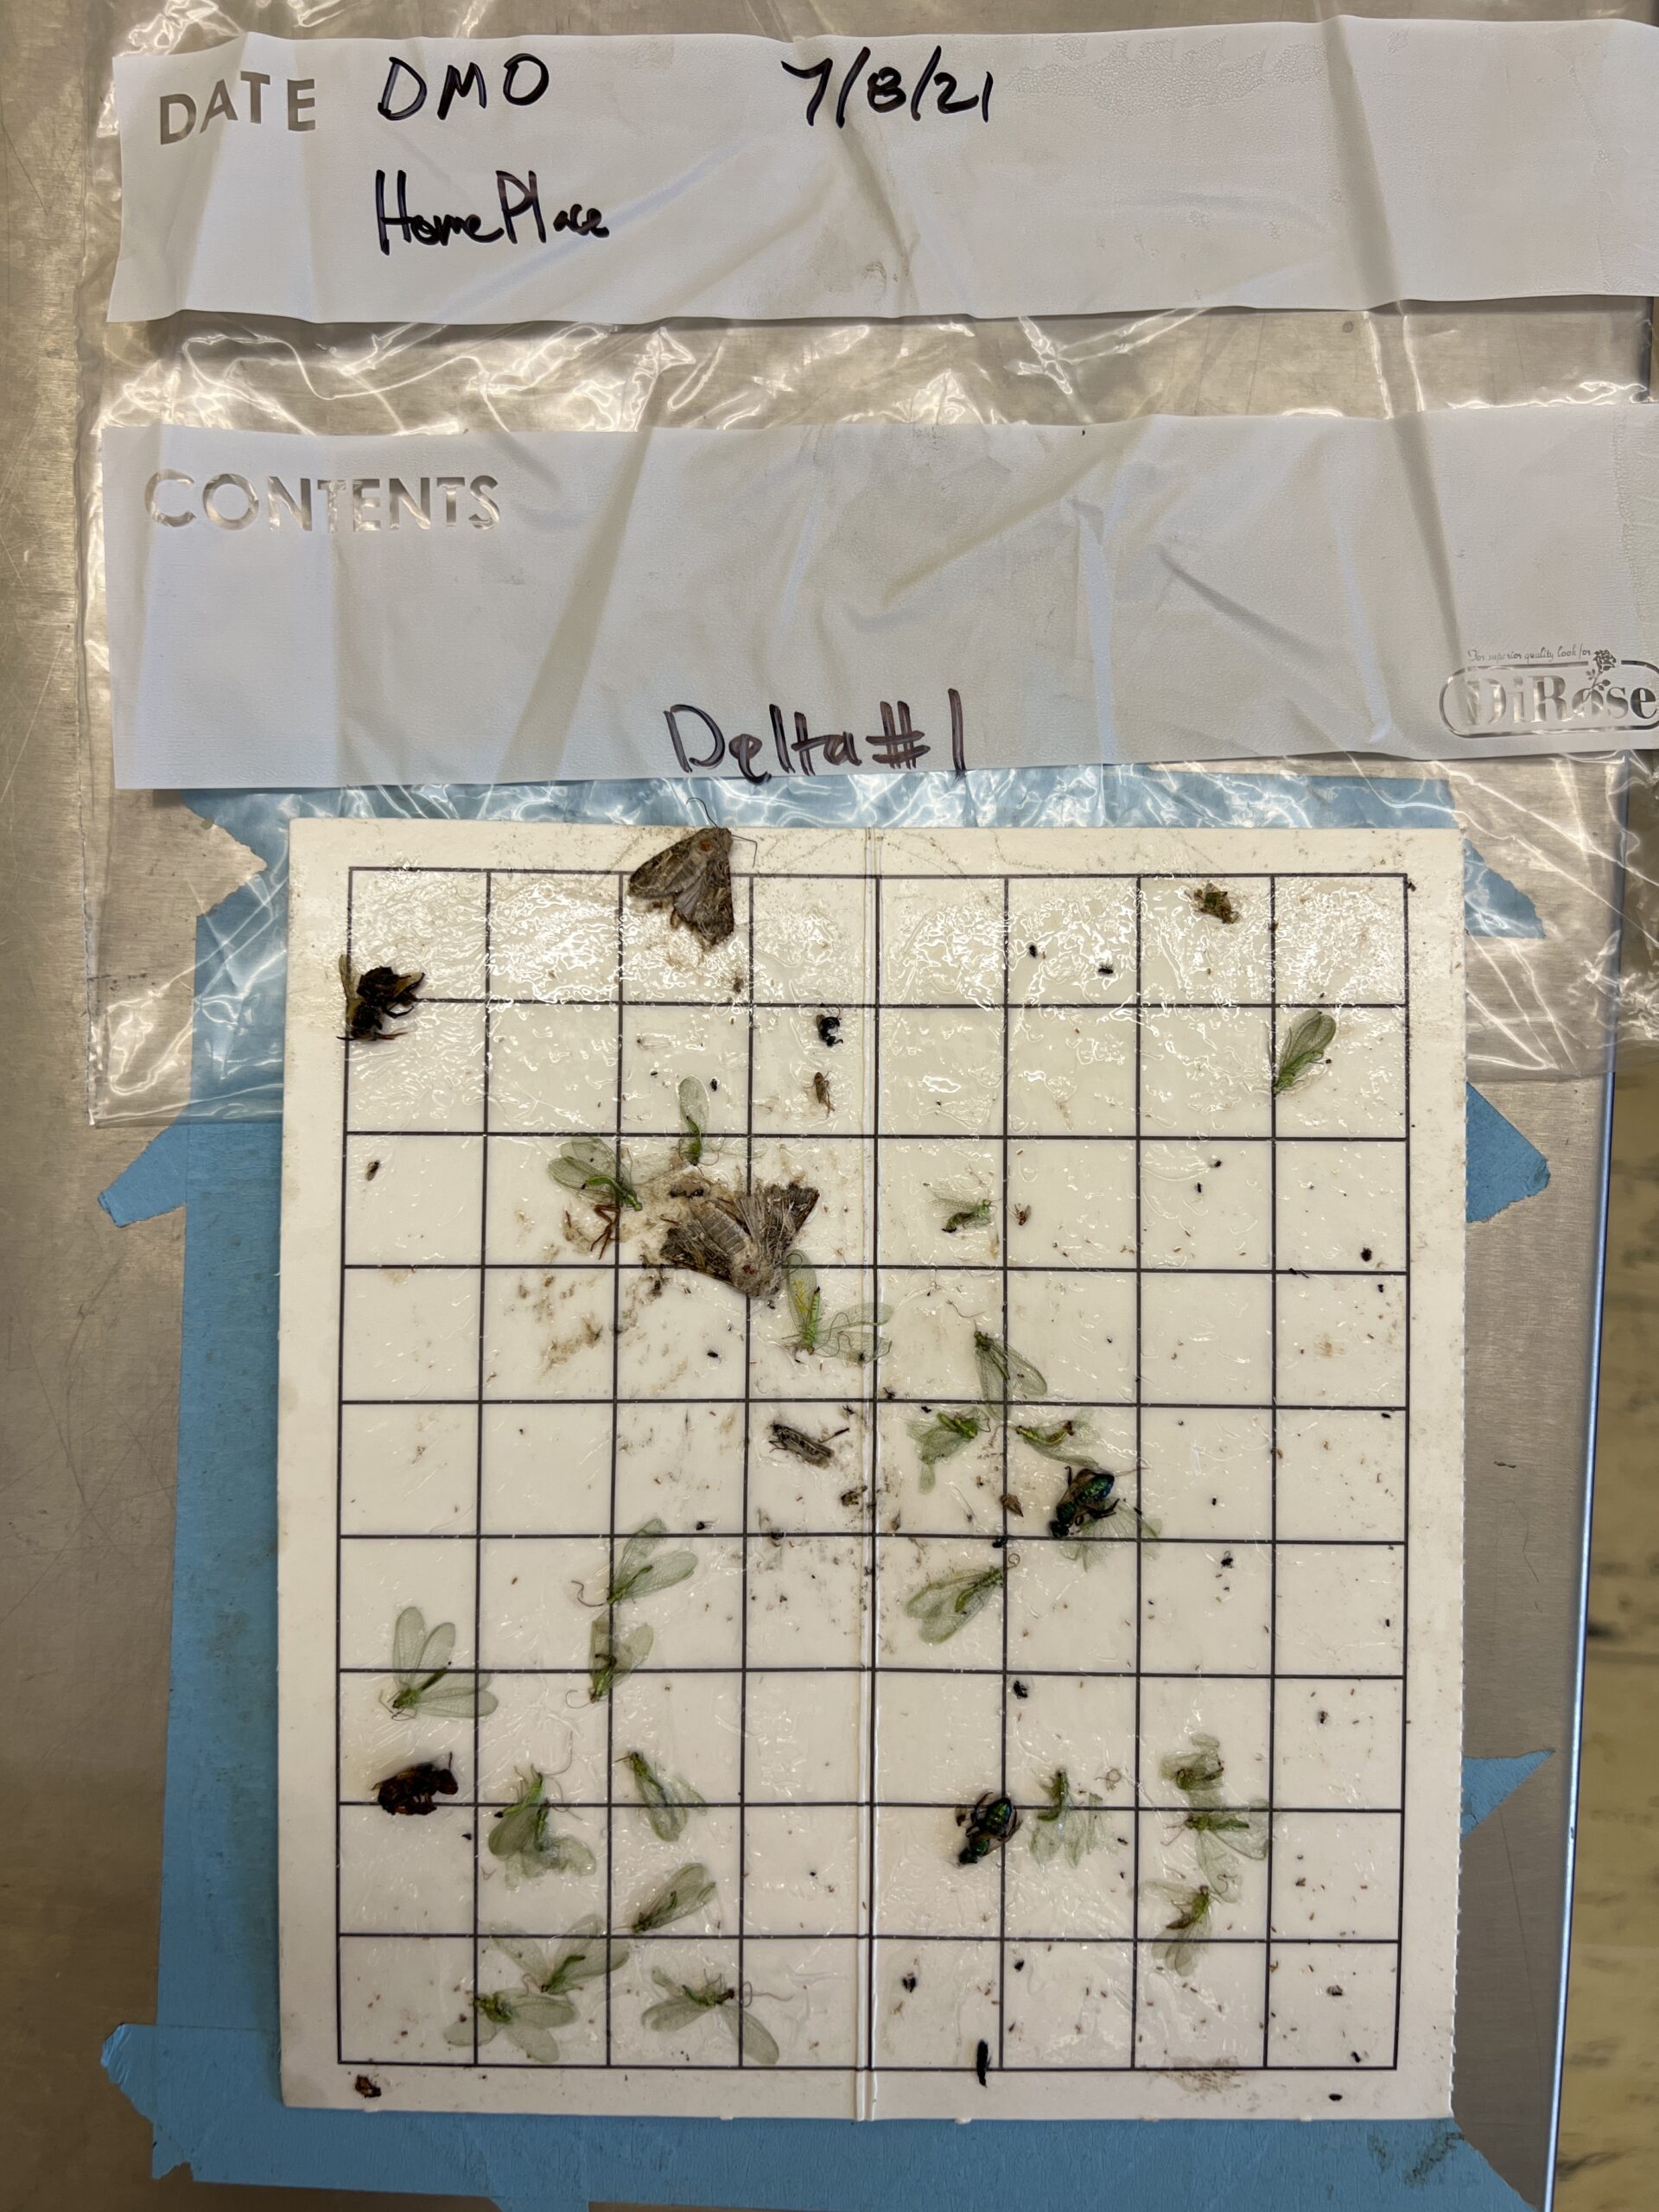
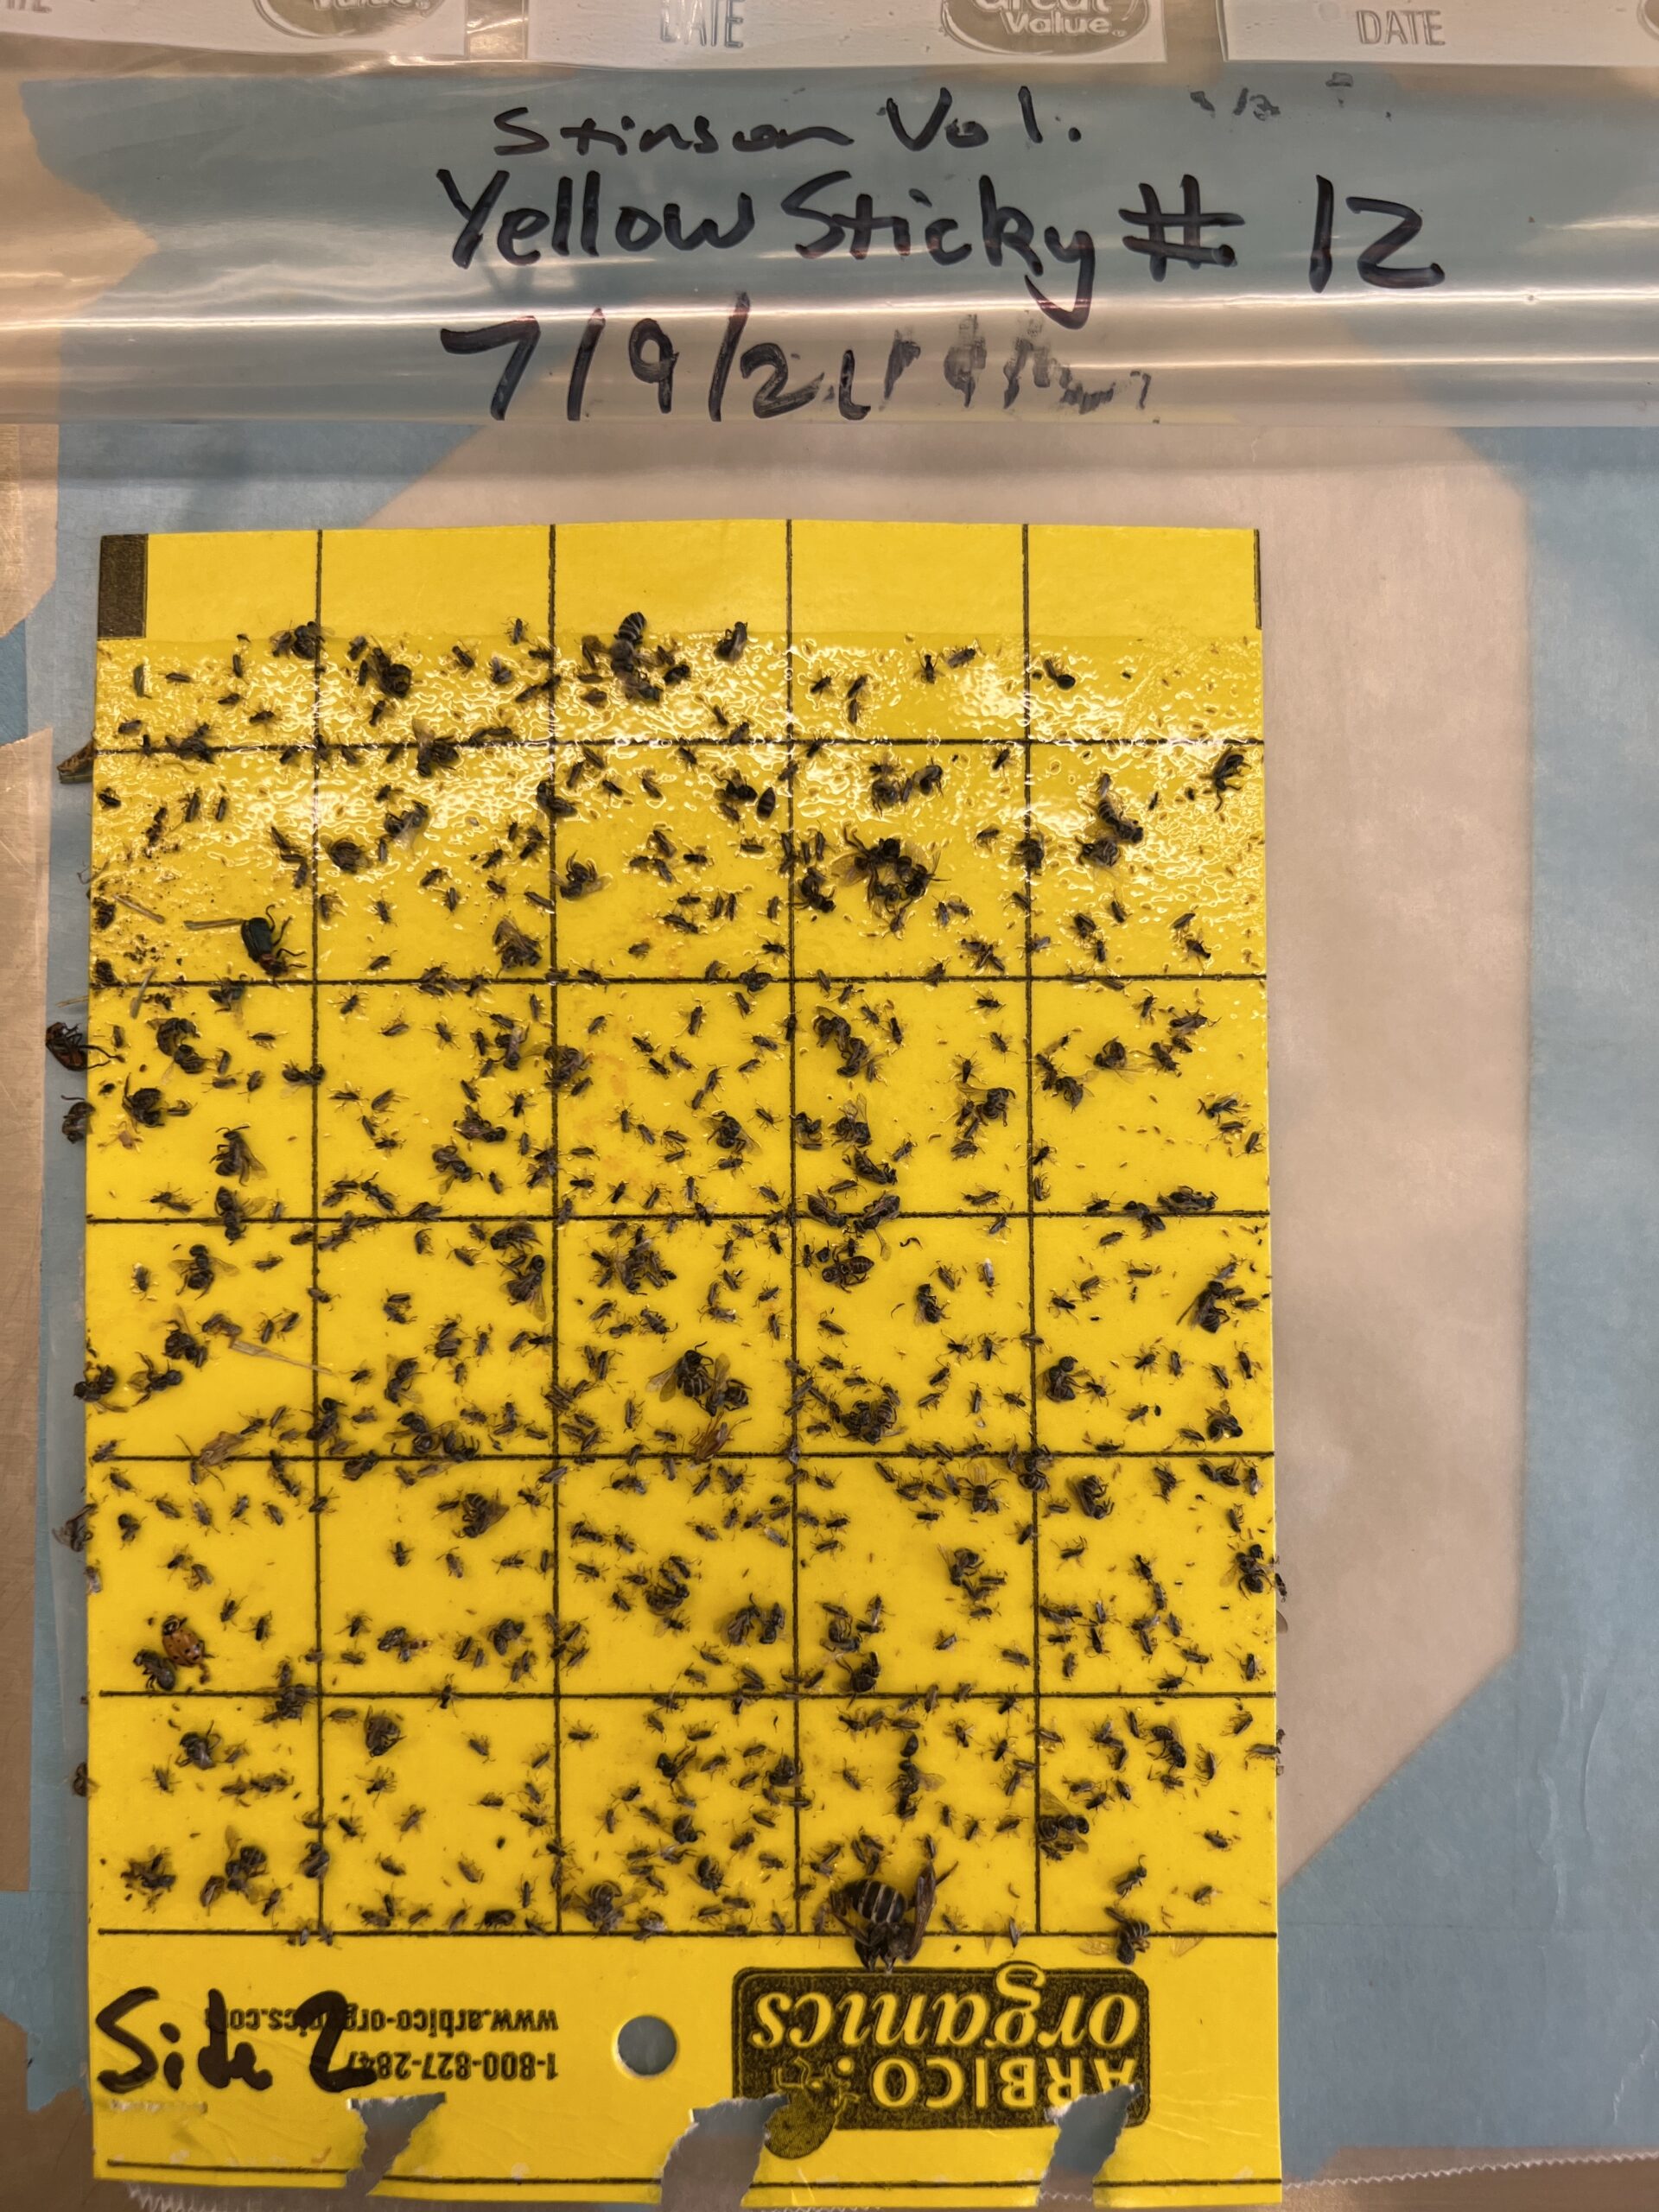
Figure 8: Example sticky card photos. L->R: A yellow sticky card trap with a low-moderate number of invertebrates present; a delta sticky card trap with a high number of lacewings present; a yellow sticky card trap with a high number of invertebrates present.
General Pan Trap Results:
We have finished pinning all beneficial invertebrate specimens collected in pan traps. While not in our initial project objectives, our pan traps collected many native bees (Fig. 9), and so if we get time, we plan on looking at these specimens more closely to add to our understanding of the effects of cover crops on a broader community of beneficial insects, including important native pollinator species. Honey bees that were collected in pan traps were sorted, but have not yet been counted. Most honey bees were collected in April (when more hives were present in the landscape for cherry pollination).
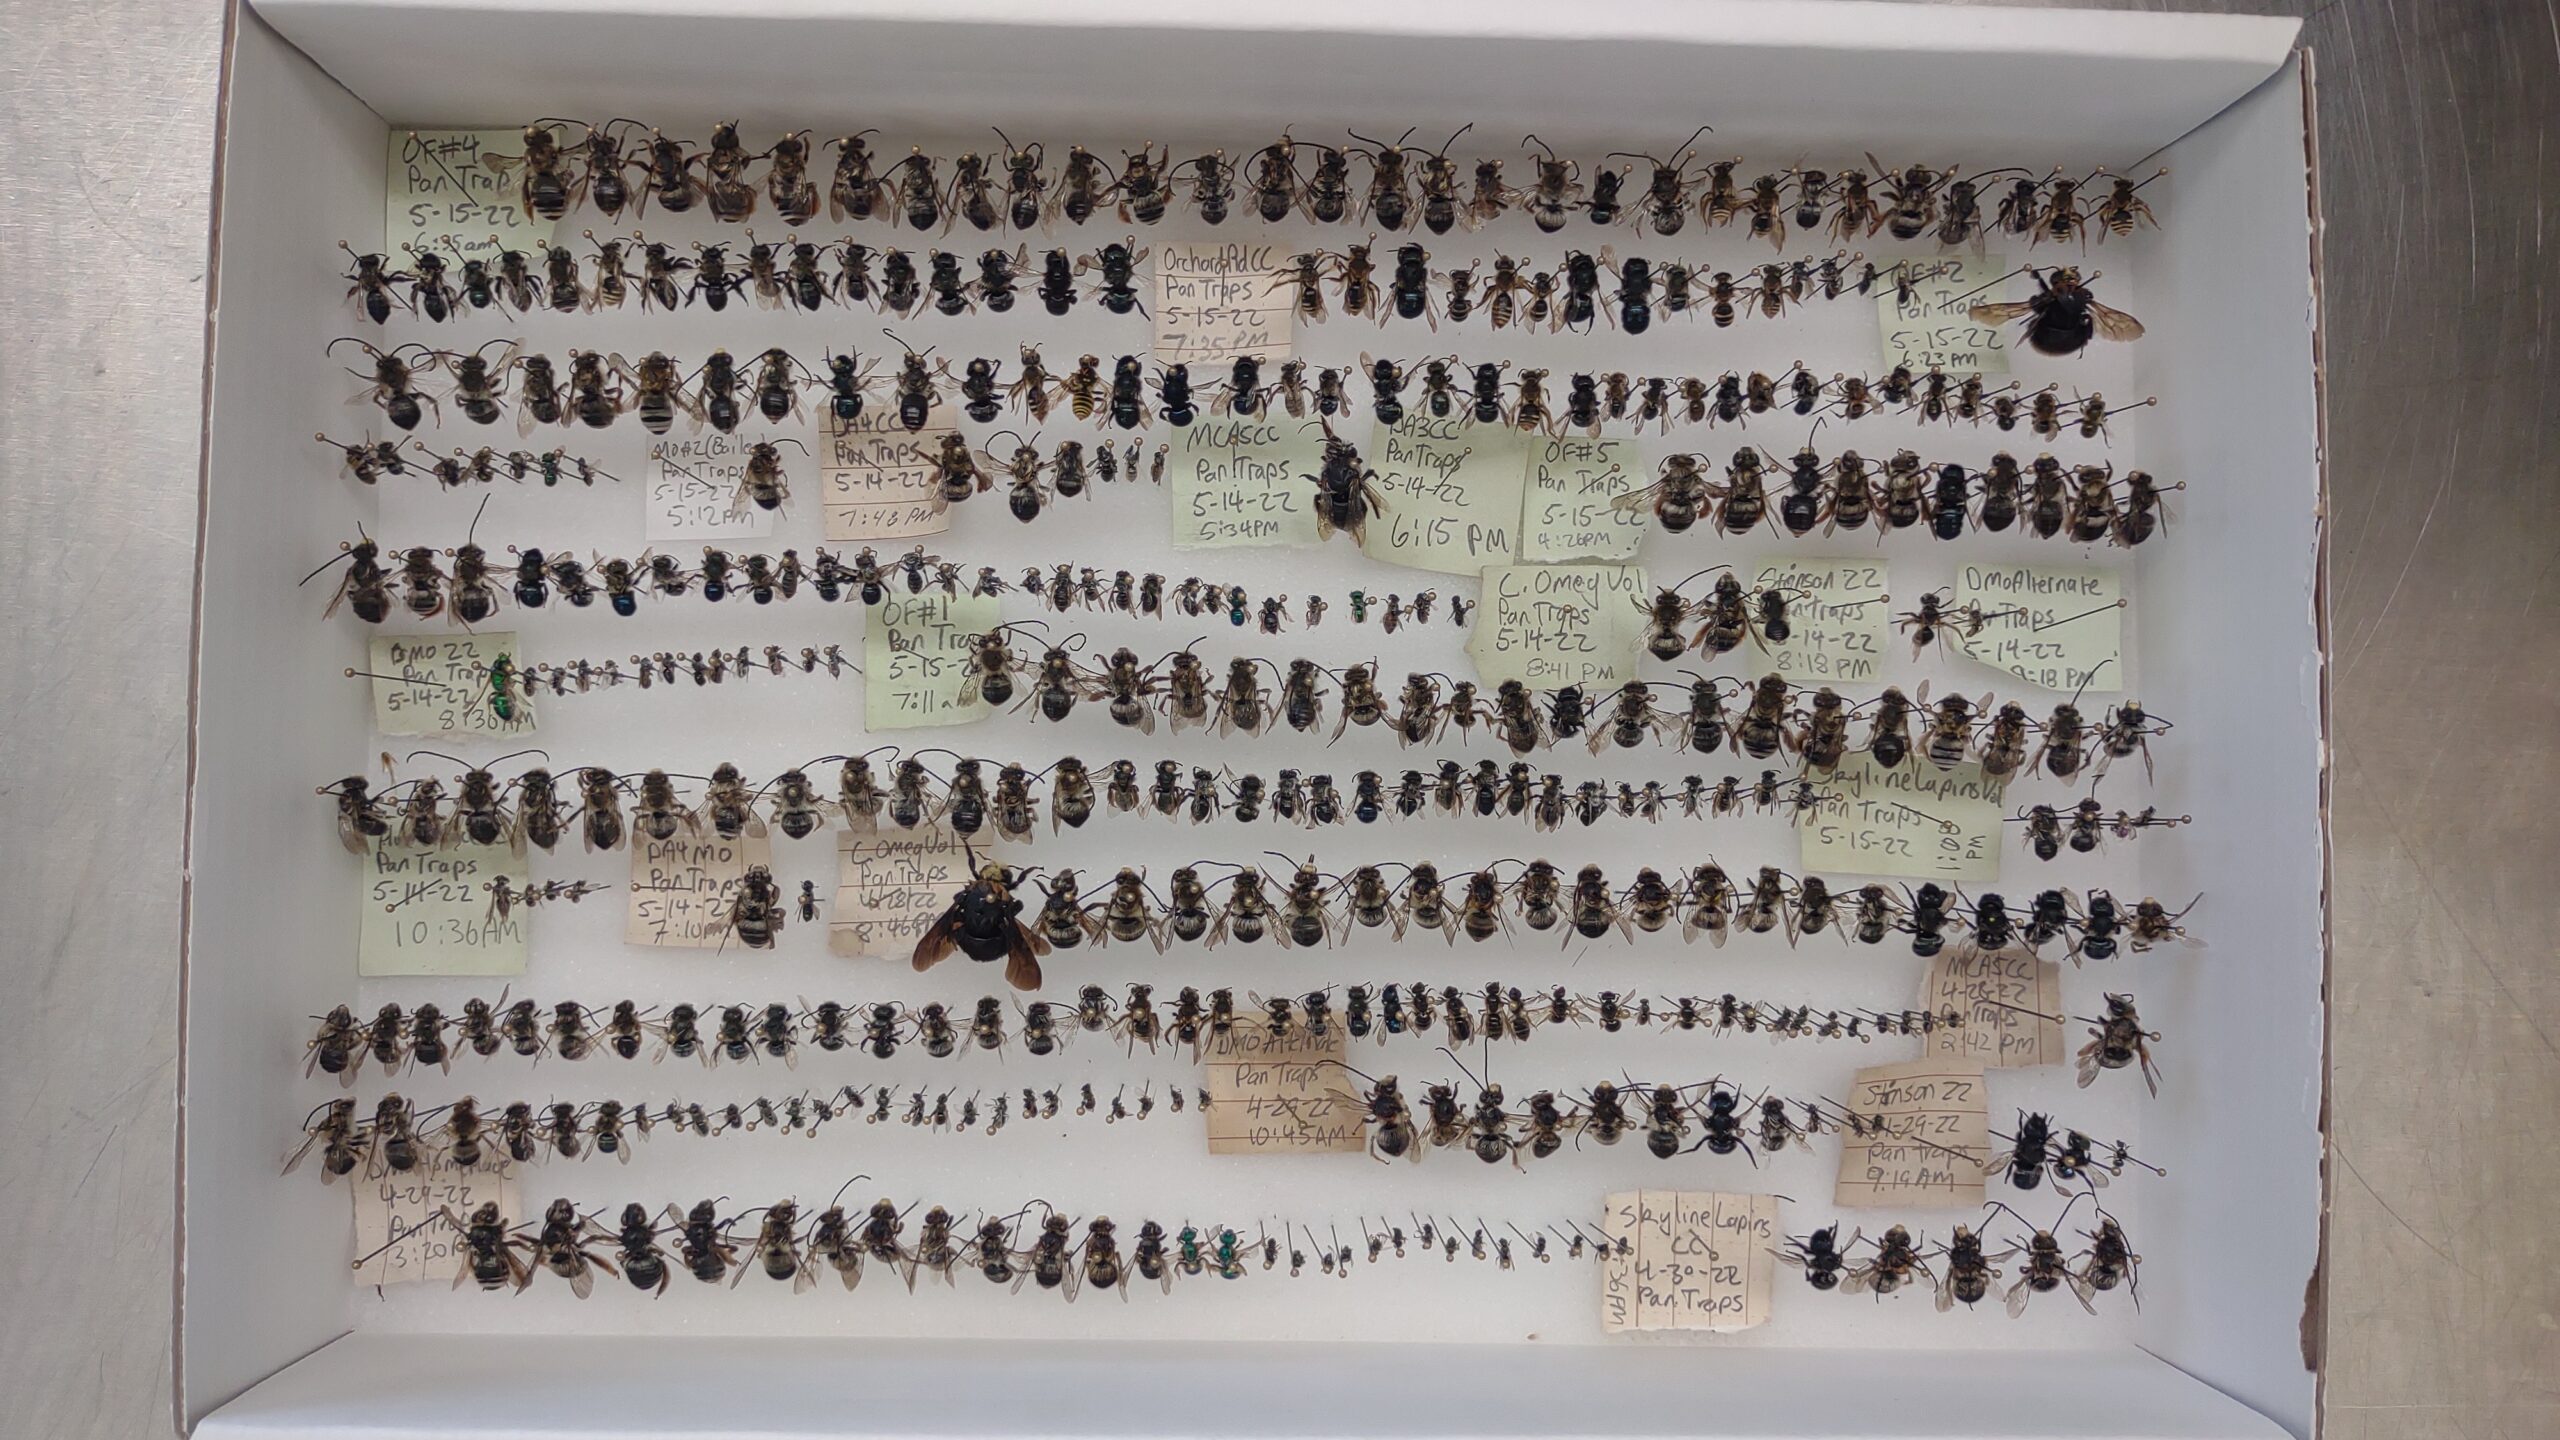
Figure 9: Example of native bees from pan traps set out in 2022. Wasps were also collected in pan traps, though not nearly as many as we had hoped or as previous studies had suggested could be collected in pan traps.
Objective #1 and #2 Results (Non-Pollinator Beneficial Invertebrate Surveys):
Wasp Communities in Oak Fragments:
We have started to look at the wasp communities in oak fragments adjacent to orchards and have found that wasp community composition is strongly related to sample month (Fig. 10a) and that dominant wasp feeding strategies may be related to wasp community composition, with parasitoids being more prevalent in some parts of the year and predators being more prevalent in other times of the year (Fig 10b). This is likely connected to the life stage of host taxa as the preference for different prey species also seems to be related to seasonal trends in wasp communities (Fig. 11c). The prey life stage also seems to be related to wasp community composition (Fig. 10d).
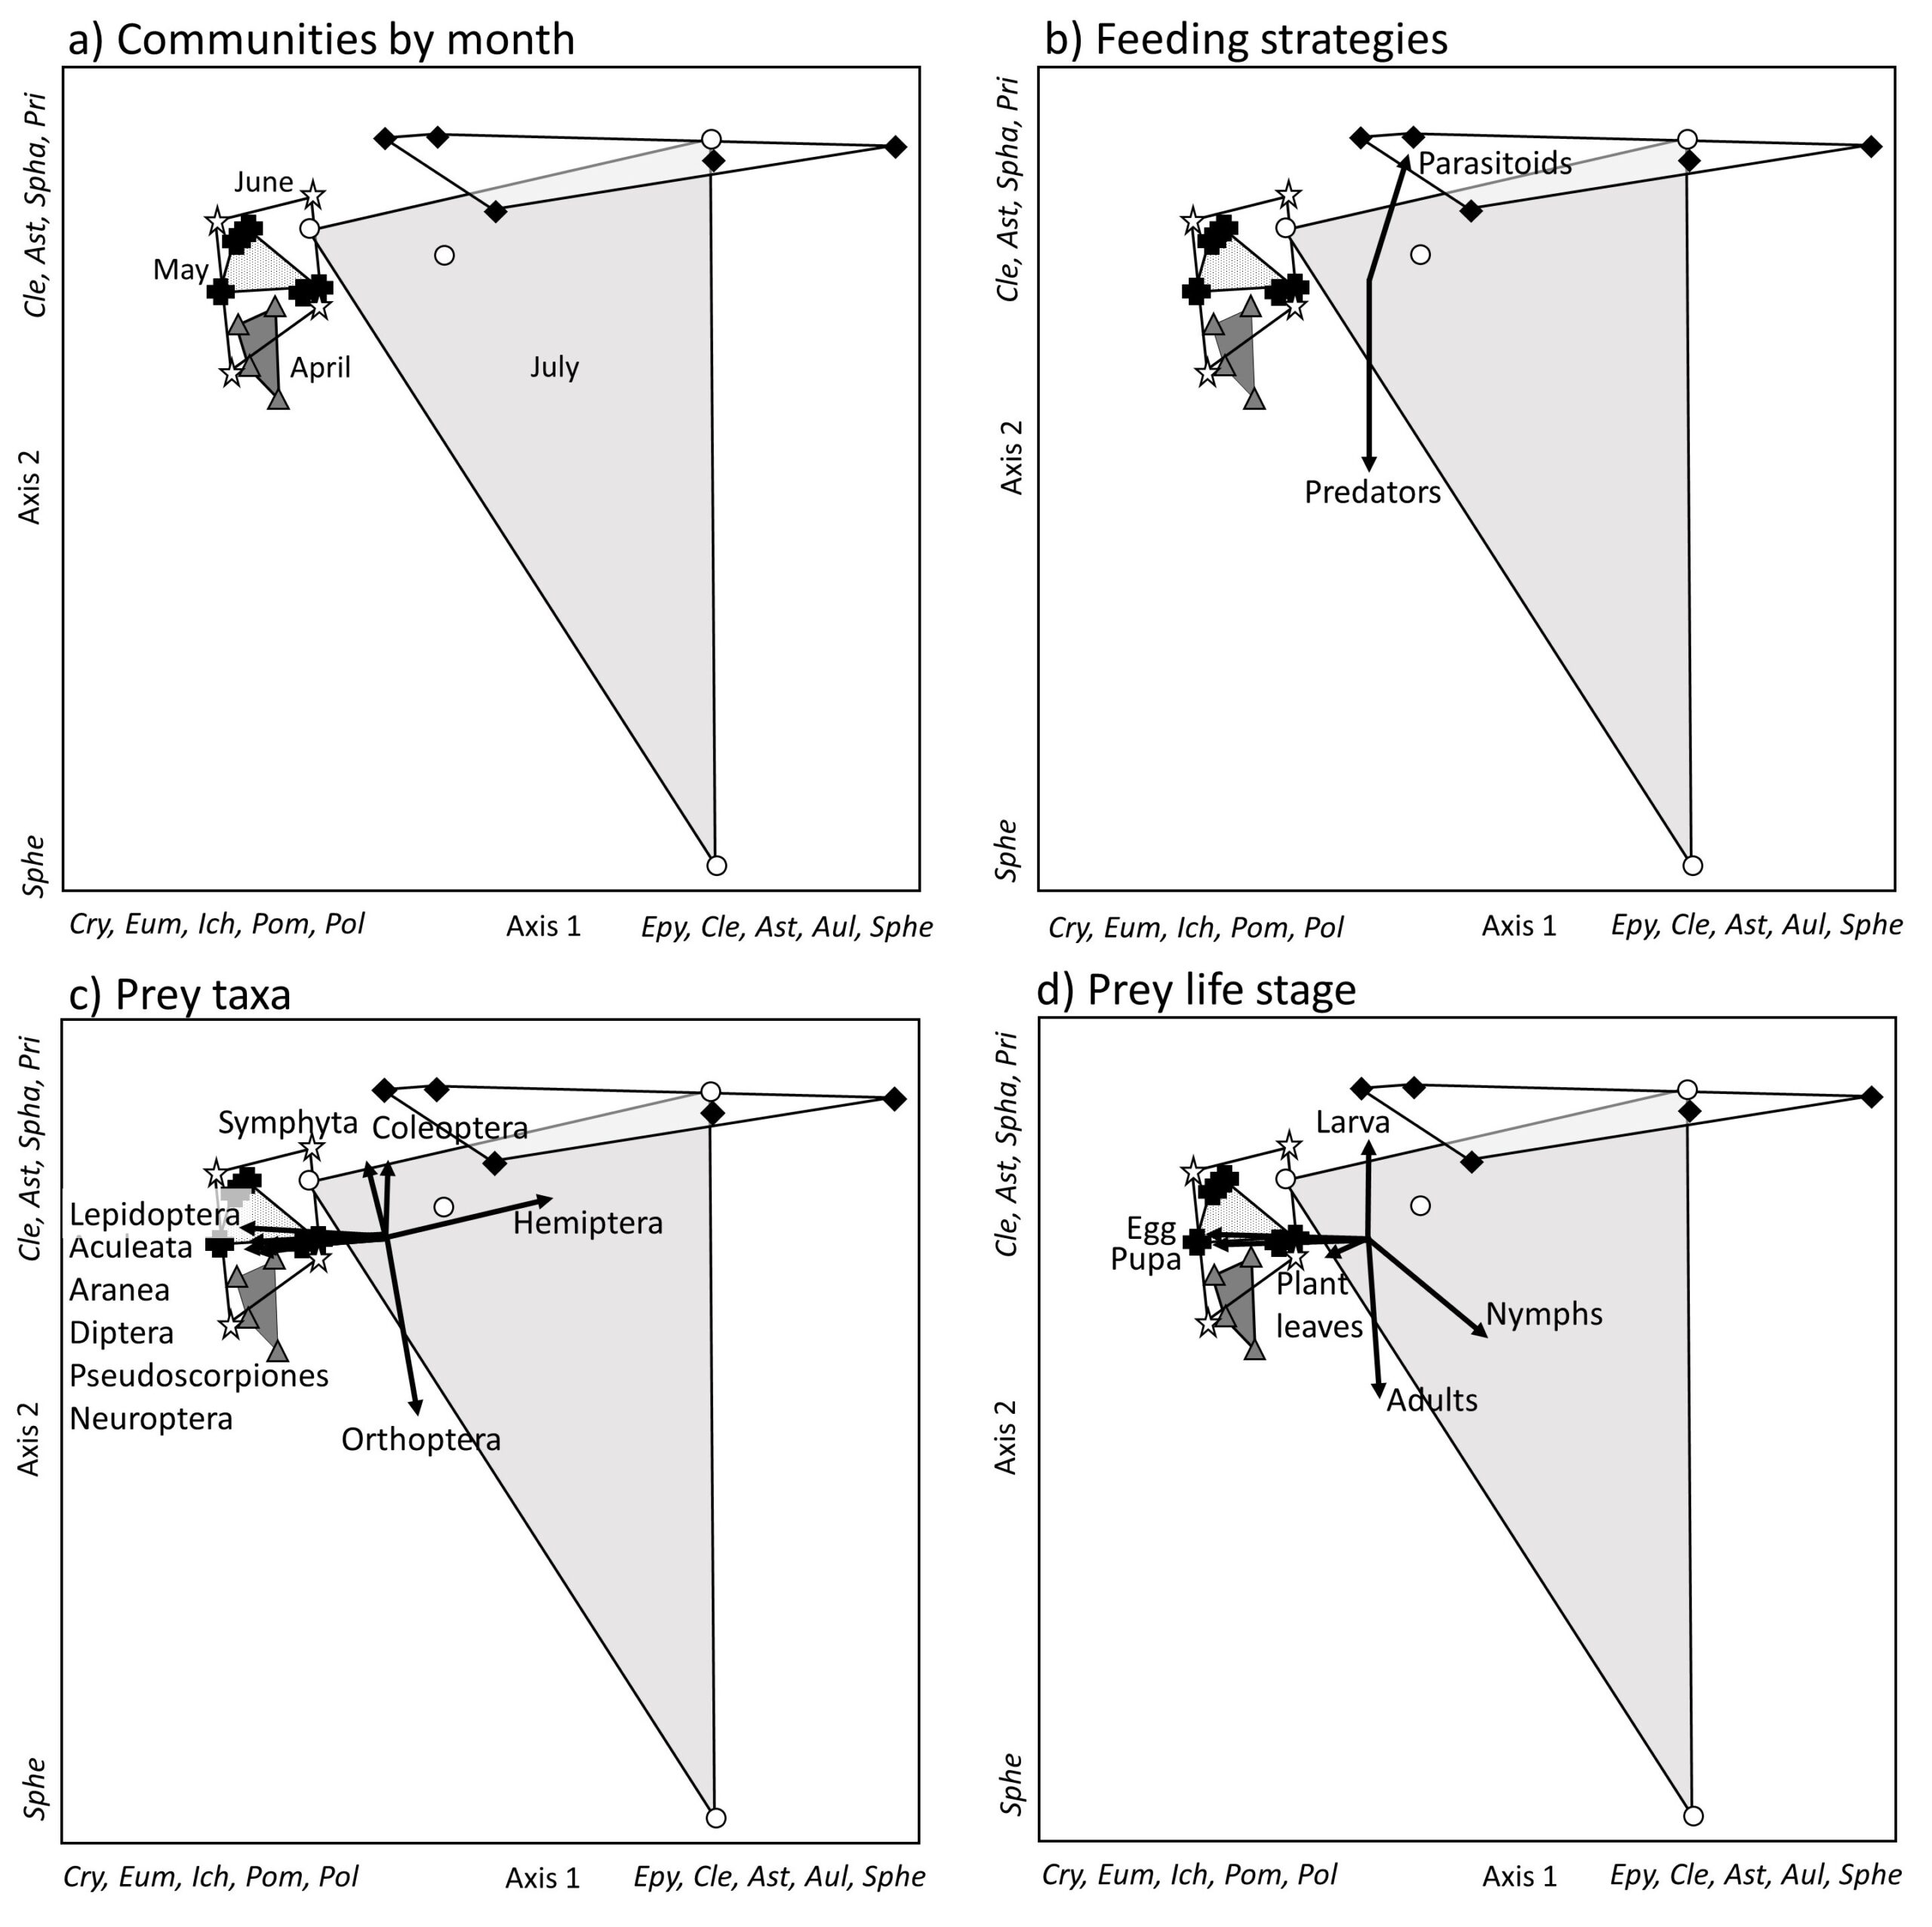
Figure 10: Sites in wasp subfamily space separated by month. a) communities clustered and labeled by month; b) biplot showing feeding strategies correlations to ordinations; c) prey taxa of wasp communities; d) prey life stages of wasp communities. Key to wasp subfamily abbreviations listed on axis 1 and axis 2: Cle = Cleptinae, Ast = Astatinae, Spha = Sphaeropthalminae, Pri = Pristocerinae, Cry = Cryptinae, Eum = Eumenianae, Ich = Ichneumoninae, Pom = Pompilinae, Pol = Polistinae, Epy = Epyrinae, Aul = Aulacidae, Sphe = Sphecinae.
Among smaller wasps captured in oak fragments(<5 mm, just counted, not identified), we found that the abundance of small wasps was highest in May and August with lowest abundance observed in June and July. A similar trend was observed with the larger wasps that we captured and discussed in the above NMS (non-metric multi-dimensional scaling) plot, with highest abundances collected early and late in the season. We are still investigating which environmental variables are likely to be related to this trend. We are also very interested to see if we observe similar trends in orchards and cover cropped sites but do not yet have enough sites counted to make statistical analyses reasonable.
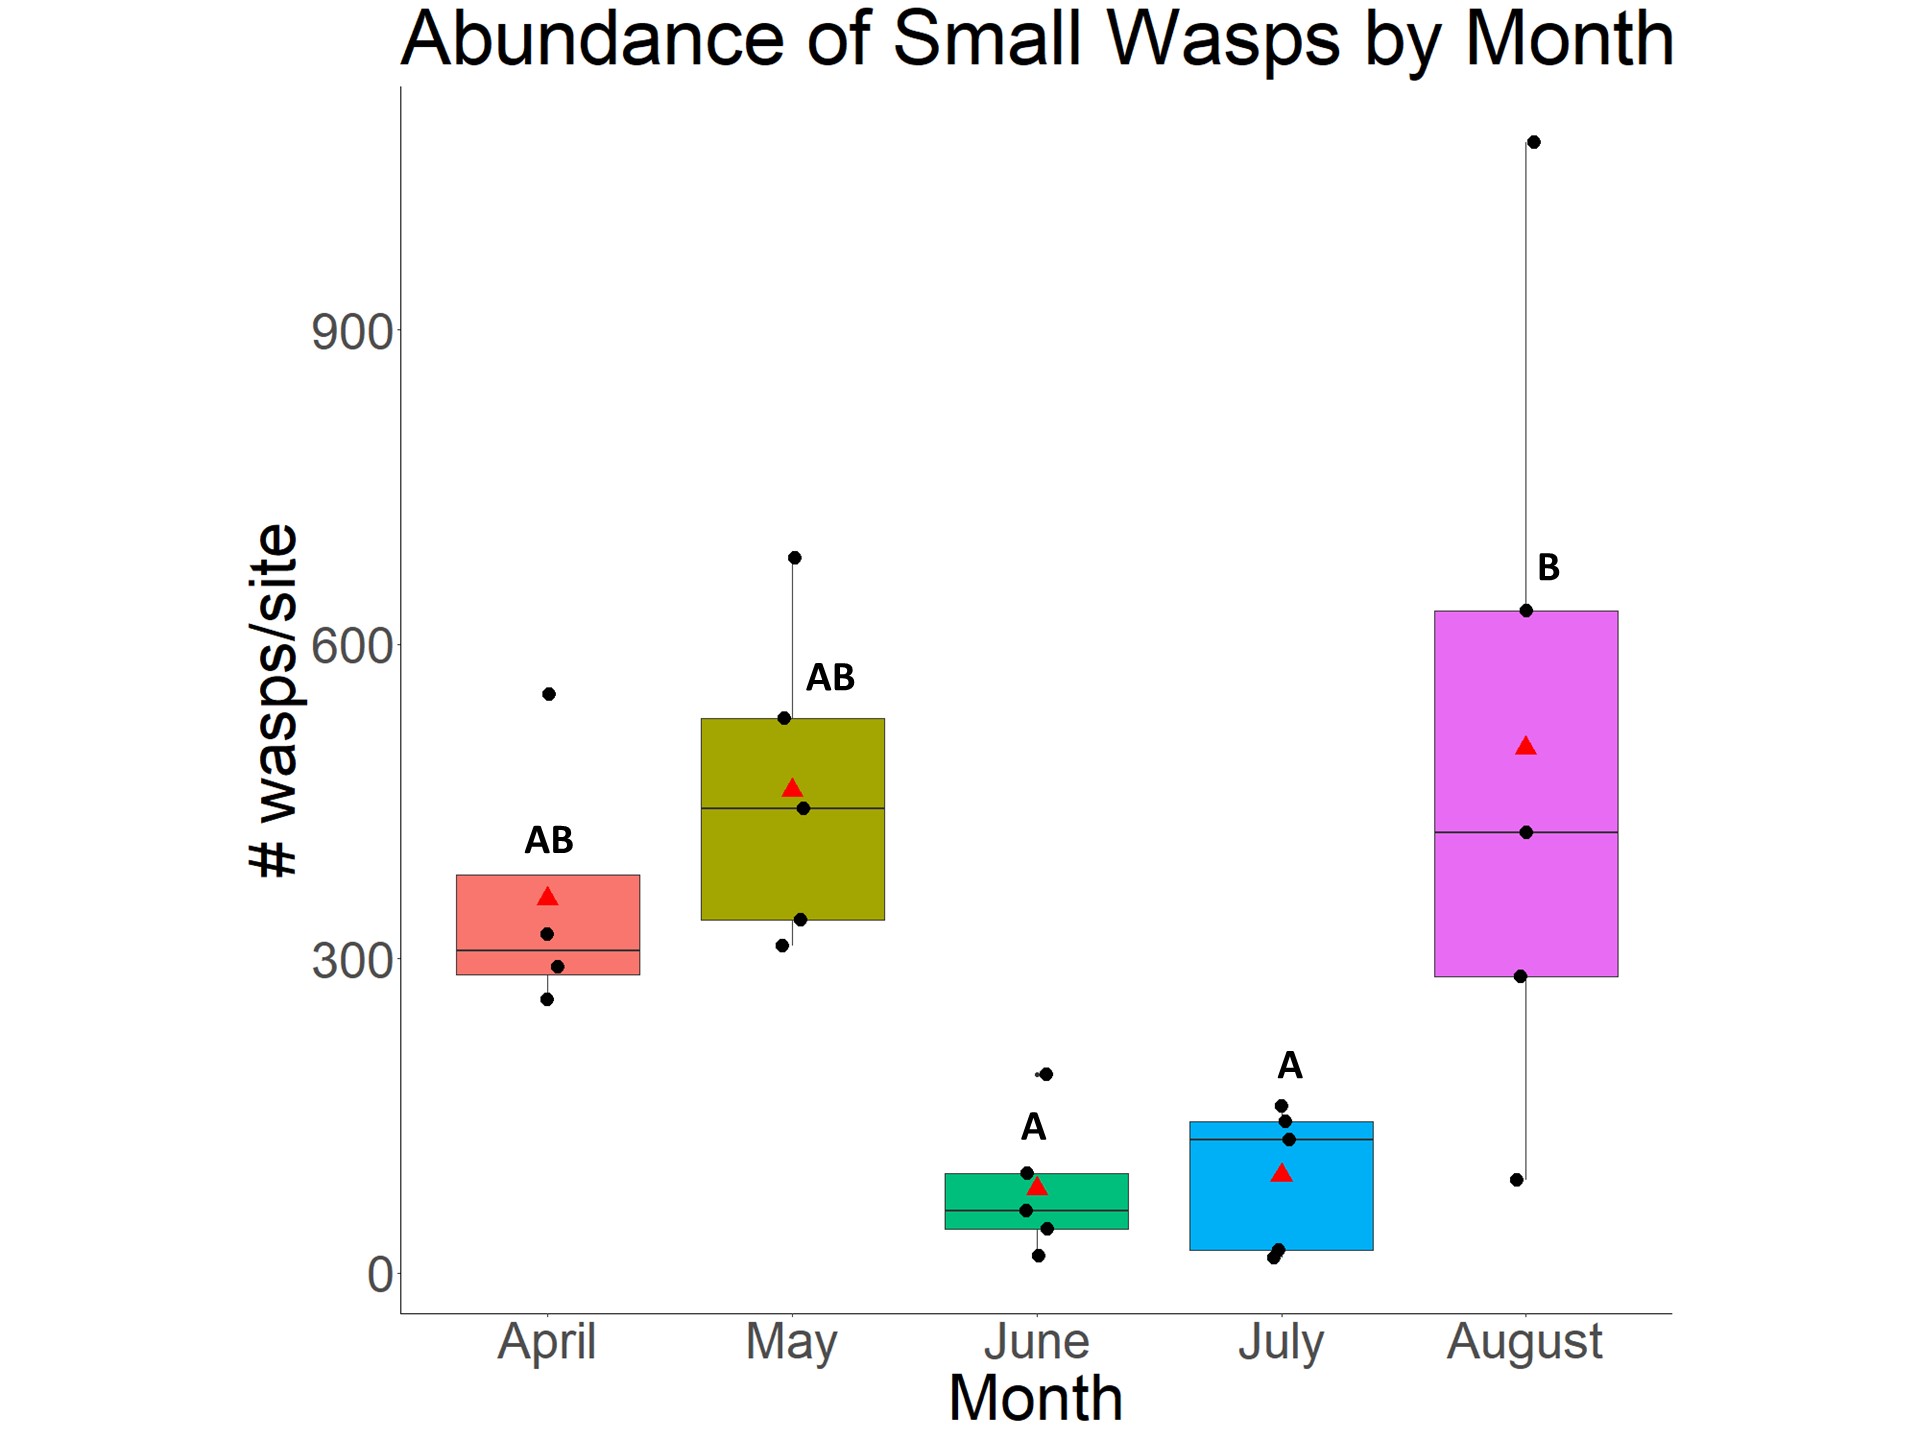
Figure 11: Small wasp abundance was highest in the early and late season. Letters relate to statistically significant (p < 0.05, ANOVA, Bonferroni adjusted for multiple comparisons).
Interestingly, we found that wasp small wasp abundance in oak fragments was tightly correlated with bloom abundance in May, but not in any other sample month. This suggests that beneficial wasp communities that are present in May could be particularly reliant on the presence of blooming plant resources (Fig. 12). Since we do not have complete counts of small wasps in other habitat types for all months, it is unclear if this trend will be true in orchards and orchard associated habitats.
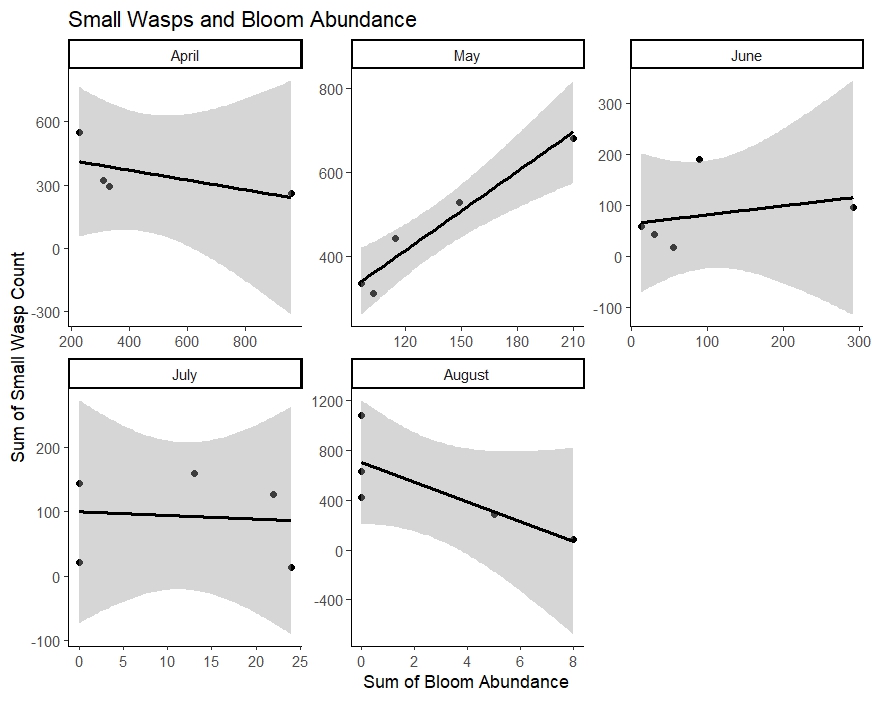
Figure 12: Wasp abundance and bloom abundance in oak fragments for each sample month. Wasp abundance was tightly, positively correlated with bloom abundance in May but not in other months. Dark lines show linear regression line through those points and gray area shows 95% confidence interval estimate around linear regression line.
Lacewing Phenology and Habitats:
We also found that in oak fragments (we have not finished counting for other site types), lacewings were most abundant early and late in the season and least abundant in June (Figure 13). In the early season, when lacewing abundance was observed to be the highest in oak fragments, we found that lacewing abundance was higher in oak fragments than in other habitat types, suggesting that oak habitats may be an important reservoir of these beneficial, predatory invertebrates. Lacewings are generalist predators that are capable of flying and could easily disperse from oak habitats into nearby orchards to provide pest control services in these orchards.
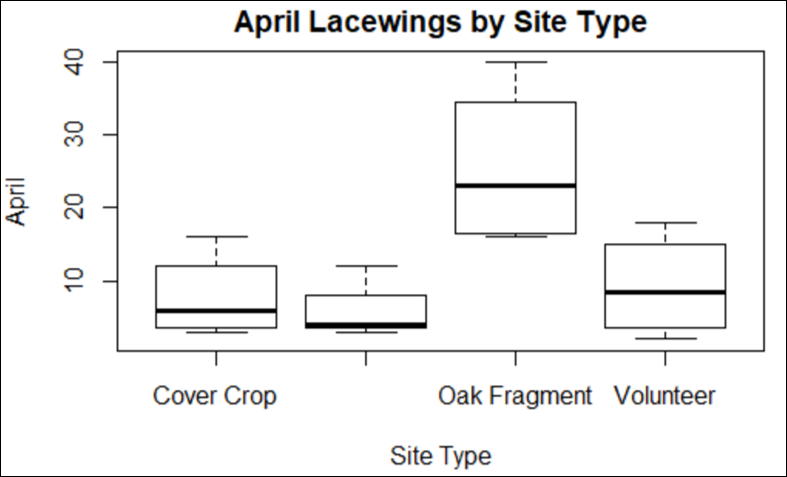
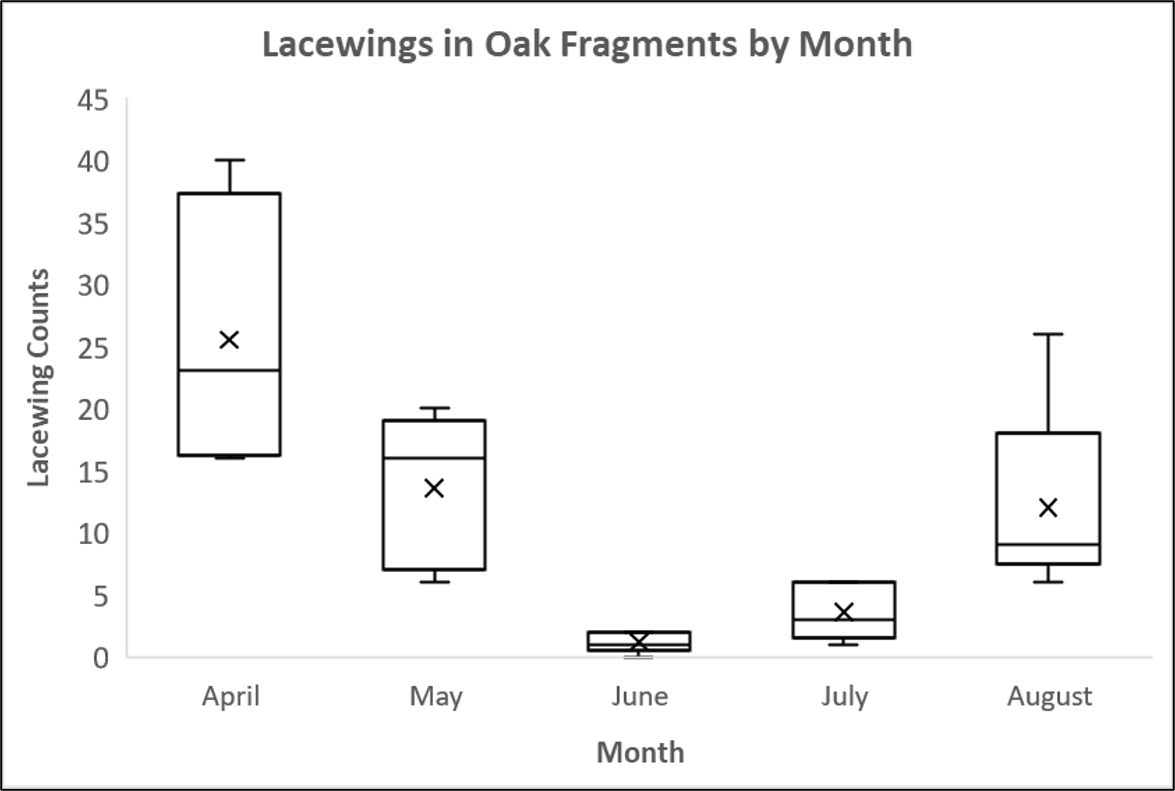
Figure 13: In April, lacewings were most abundant in oak habitat fragments. Within oak fragment sites, lacewings were most abundant in April and August and least abundant in June.
The seasonal trend in lacewing abundance in other habitat types seems to be more variable. For example, lacewings were most abundant in mature orchards in June, which could suggest that lacewings are moving from oak fragments into orchards where prey items may be more common (Figure 14). In other site types (e.g., cover crops and volunteer sites), lacewings appear to be much more common in the late season (July and August). This could again suggest that lacewings move throughout different habitat types to take advantage of resources on the landscape. While this is only suggestive, if this were the case, it would indicate that oak habitats provide important reservoirs of lacewings early in the season while cover crop and volunteer sites provide important habitat in the later season. Across all habitat types, it appears that lacewings are least abundant in the middle of the summer (June). These results are very preliminary and we will continue to explore these trends as we continue our data analysis.
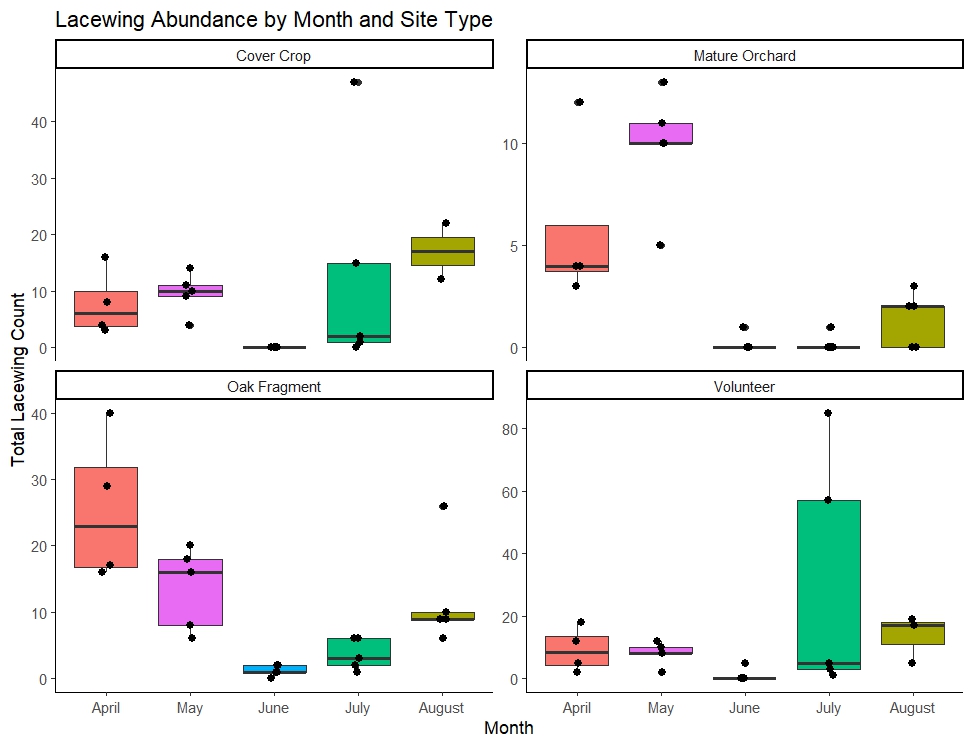
Figure 14: Lacewings abundance throughout the sampling season in various habitat types.
Native Bee Abundance (sticky cards)
Another beneficial invertebrate taxon that we have started to look at is native bees. While not included in our initial research plan, the abundance of bees collected in our pan traps seemed like a good opportunity to investigate some general trends in pollinator beneficial insect communities as well. As such, we counted native bees on sticky cards, as this step added very little handling time to card processing procedures. Similarly to lacewings and wasps, native bees were collected at variable rates across the season in various habitat types. In general, native bees were most abundant in the early season (April) and became continually less abundant throughout the season. Interestingly, native bees were collected at relatively high rates throughout the season in cover crop and volunteer sites, suggesting that these on-farm habitats could be serving as important habitats for at least some species of native bees (Fig. 15).
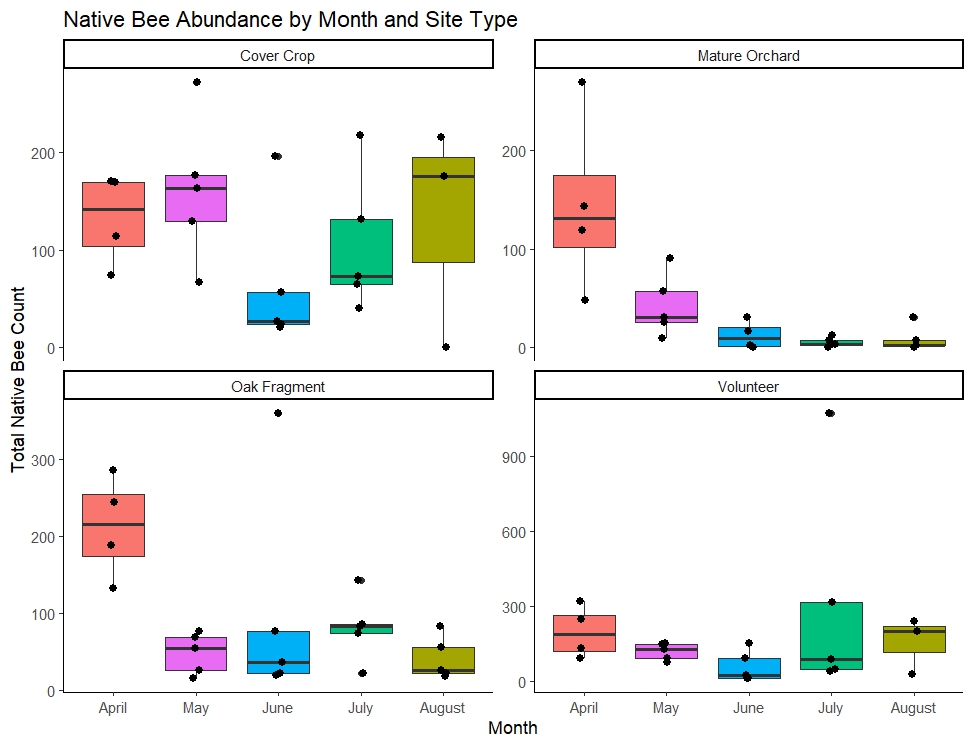
Figure 15: Native bee abundance on sticky cards was variable throughout the season. This graph shows unadjusted native bee abundance on sticky cards, so it is likely that some of the higher counts observed in April are a result of a slightly longer trap deployment time during this month. We are still working on processing these data more fully.
While our results are still preliminary, we are starting to see some interesting trends that we will continue to explore in our later analyses.
Objective #3 Results (Pest invertebrates):
Pest Taxa Preliminary Results (sticky cards)
We are still continuing to investigate how pest taxa vary throughout the season and throughout habitat types. In discussions with growers, extension agents, and entomologists working in the area, we learned that leafhoppers are one primary pest species of concern as there are certain leafhopper species known to transmit cherry X-disease. Since we also collected a substantial amount of data on this species, we decided to focus in on leafhoppers in our preliminary analyses. Some important trends that we found is that leafhoppers appear to be most abundant in orchard associated habitats and generally occur at very low abundance in adjacent natural habitats (Fig 16). This is good as it provides evidence to growers that these habitats are likely not contributing to leafhopper pest pressure in their orchards, while likely serving as a source of various beneficial invertebrates like lacewings.
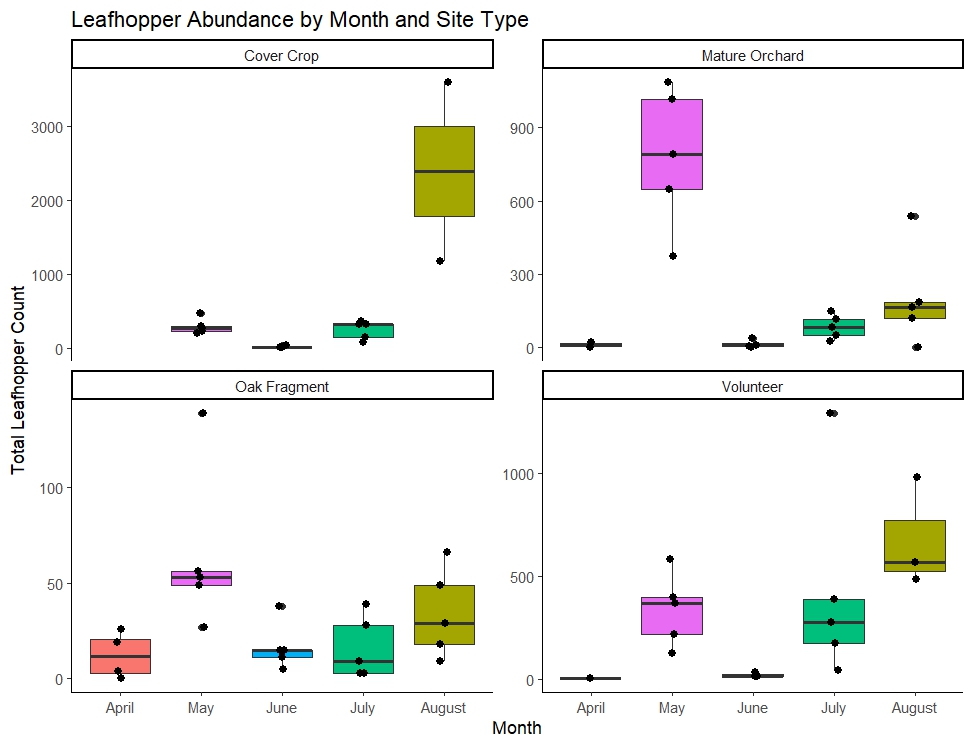
Figure 16: Leafhopper abundance by month on sticky cards in different site types.
What is interesting here is that leafhoppers appear to be most abundant in cover crop and volunteer sites in August, but were also very abundant in mature orchard sites in May (Fig. 16). This suggests that volunteer and cover crop sites may be important reservoirs of pests later in the season. If the leafhoppers present in these sites are harboring cherry x-disease, this may be an important time to control leafhoppers in these otherwise lightly managed sites. If growers were to manage leafhoppers using pesticides or some form of biocontrol during this part of the year, they would need to weigh the pros and cons associated with treating habitats that may harbor beneficial insects like lacewings. On the other hand, native bees are less common during this time of year, so managing cover crops and volunteer sites for leafhoppers late in the season is less likely to have a negative impact on native bees (Fig. 15).
Pitfall Results and Beetle Morphospecies.
We have started to look at beetles collected in pitfalls and started by looking at oak fragments (to parallel wasp analyses conducted above). So far, we've sorted beetles from April and May of 2021 and 2022 to morphospecies and identified each morphospecies to family (e.g., Tenebrionidae Morphospecies 1 or Carabidae Morphospecies 13). We found that between the morphospecies community composition of beetles in April and May of 2021 and May of 2022 were not statistically different from each other, but all were statistically different from the morphospecies communities collected in May of 2021 (Fig. 17). We think that this is because weather in May of 2022 was particularly cool (more similar to April 2021 and April 2022 than to May of 2021) and there were therefore, different beetles active in this month than there were in May of 2021 (when it was on average, much warmer).
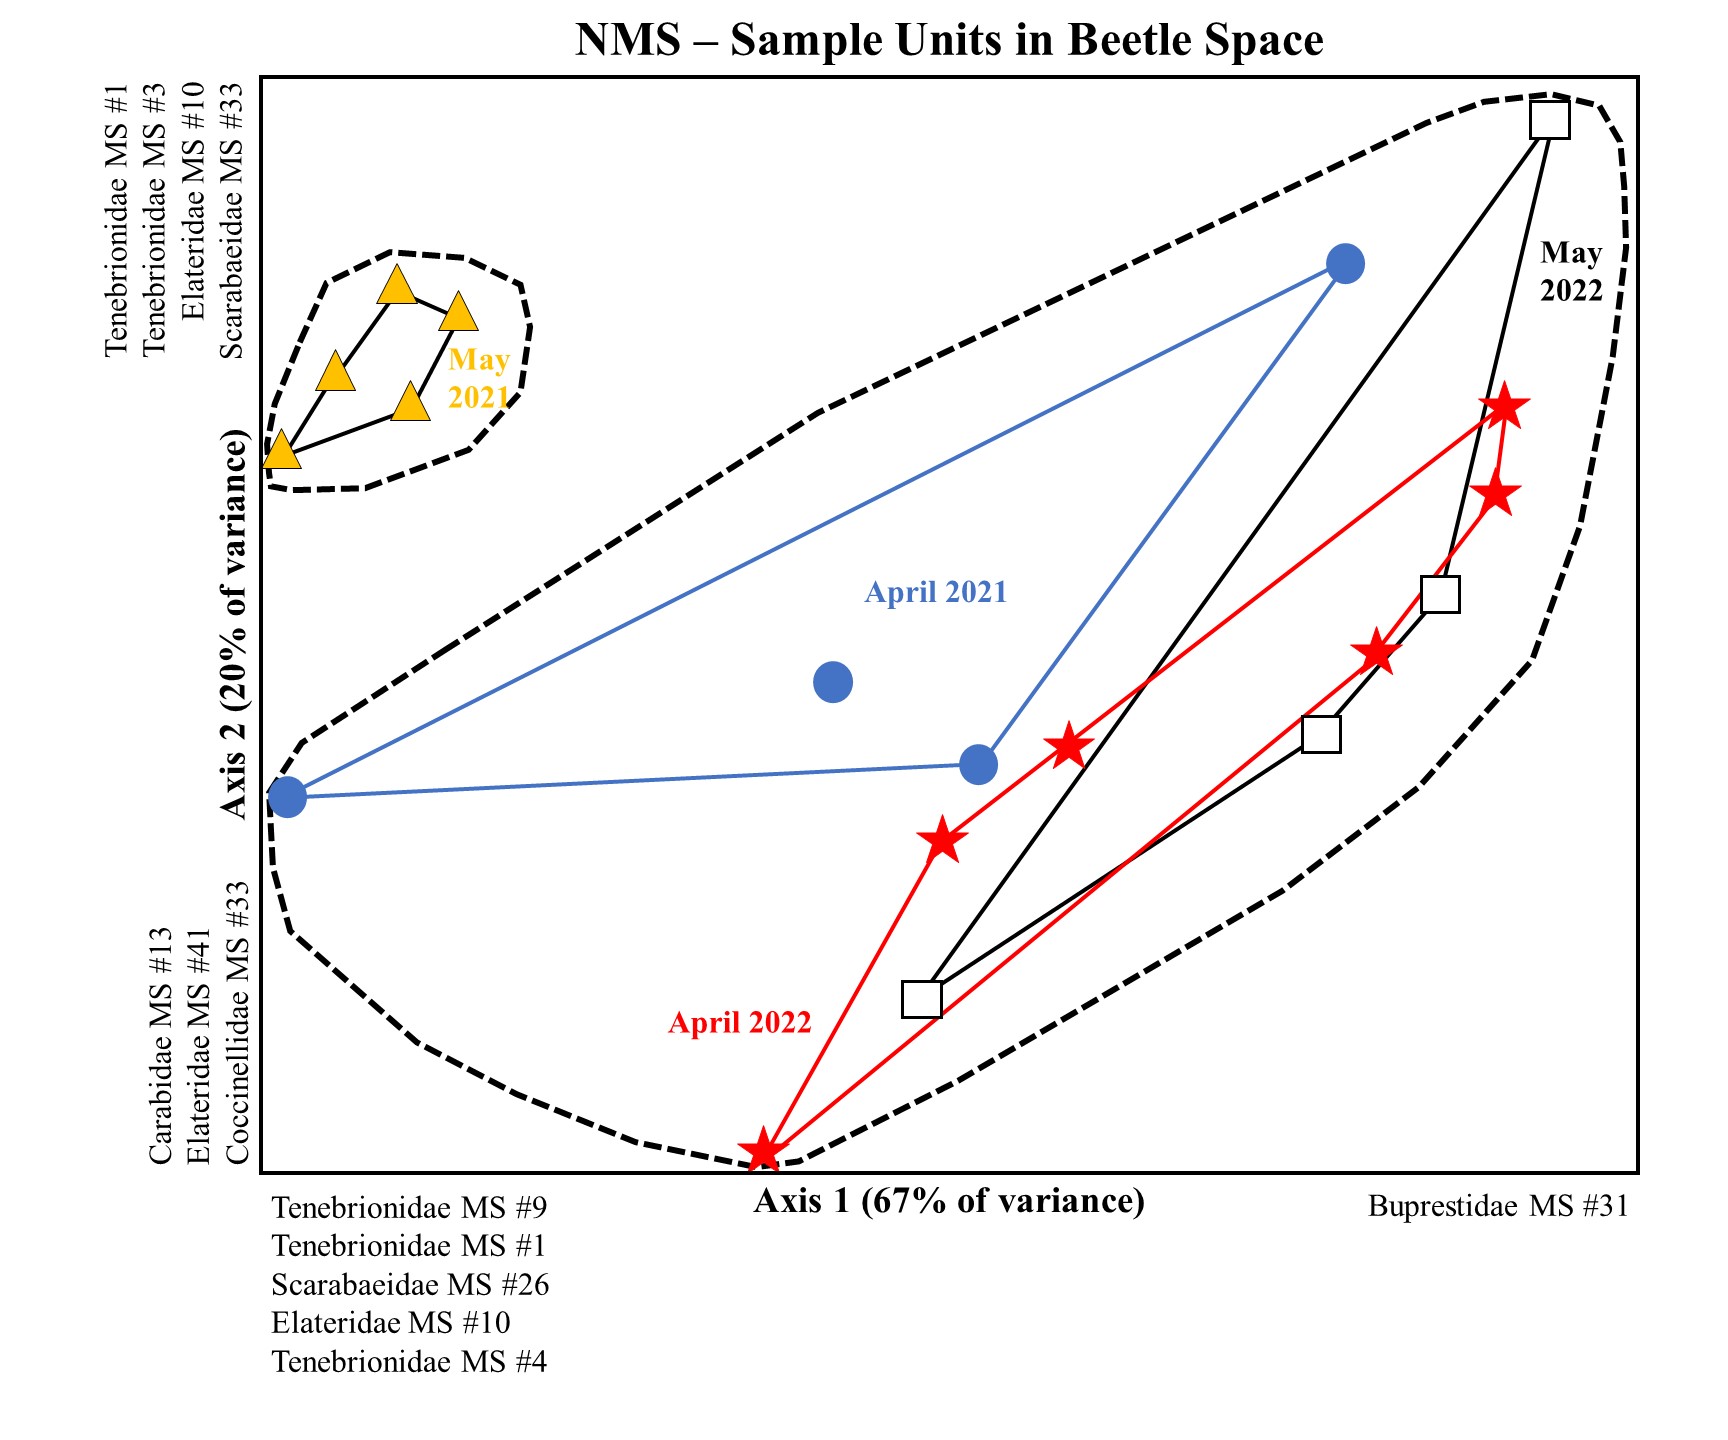
Figure 17: Sample sites in beetle morphospecies space, non-metric multidimensional scaling ordination.
Interestingly, we found that beetle abundance and morphospecies richness, but not morphospecies diversity, were positively correlated with the average temperature for the three days in which traps were left out (Fig. 18). This is not surprising as many invertebrates are ectothermic and activity levels may be closely tied to ambient temperature. Since these data were taken from just April and May, this would imply that early in the season, temperature is an important determinant of beetle activity.
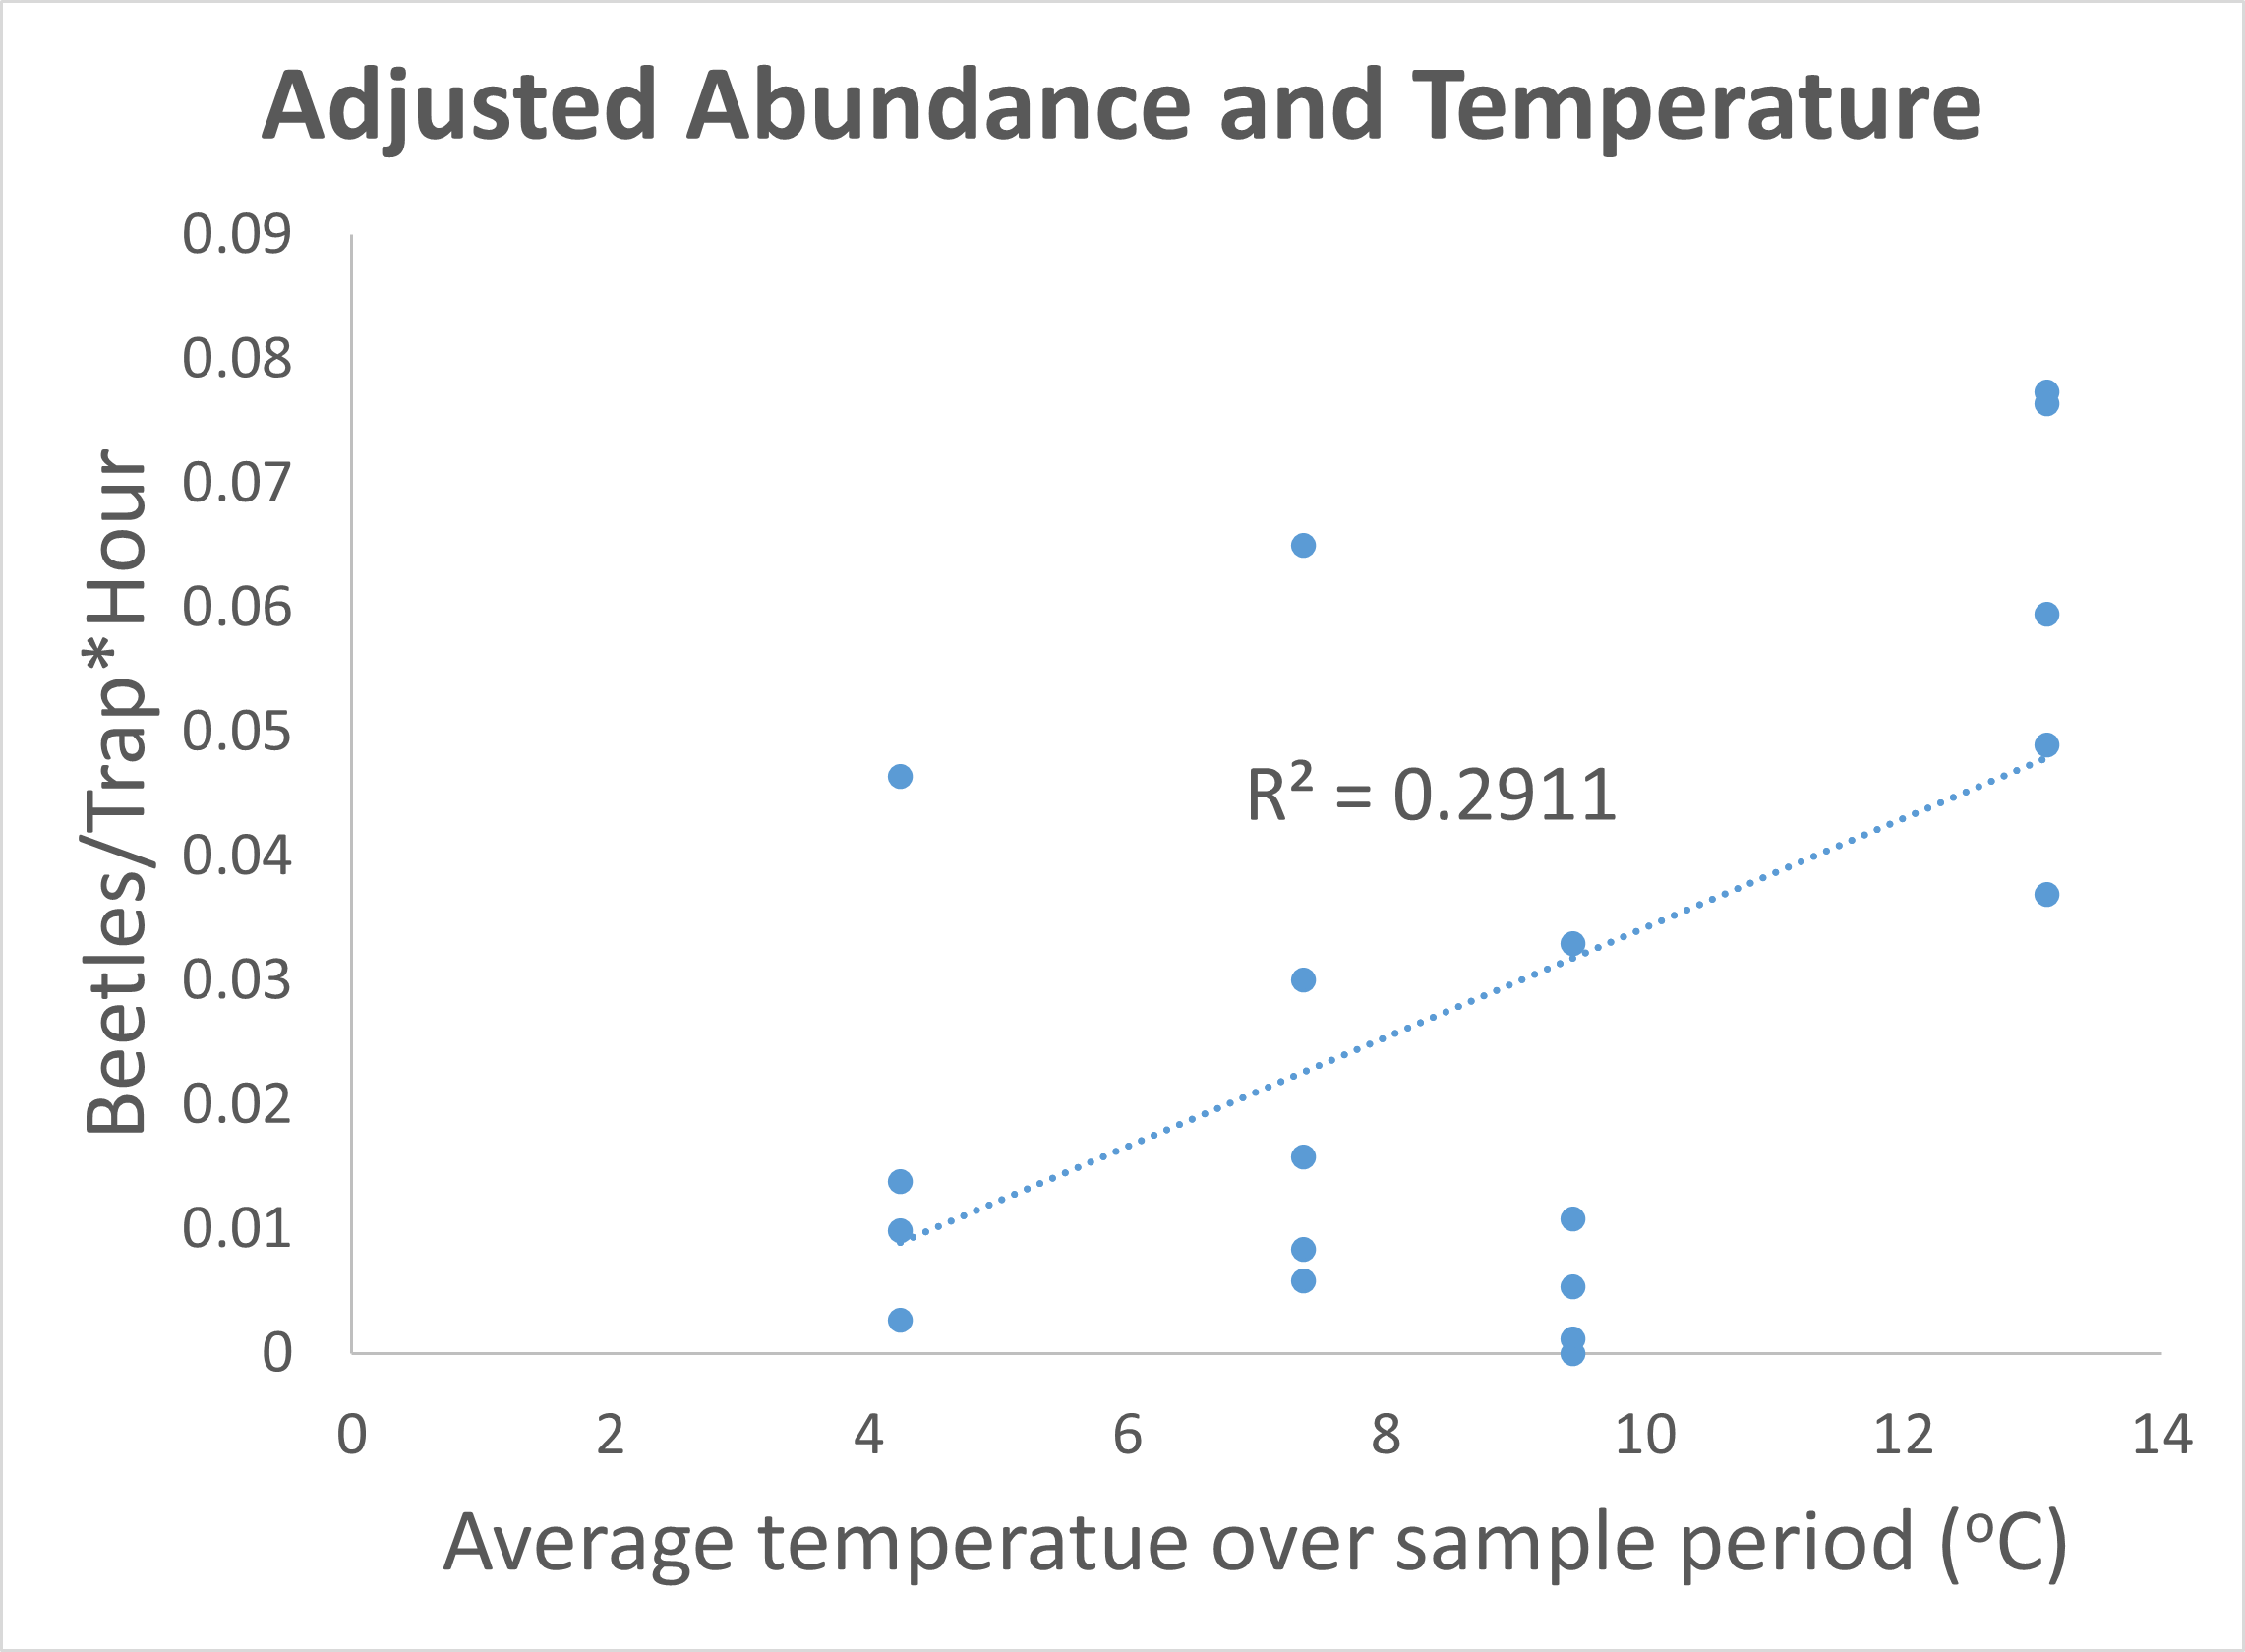
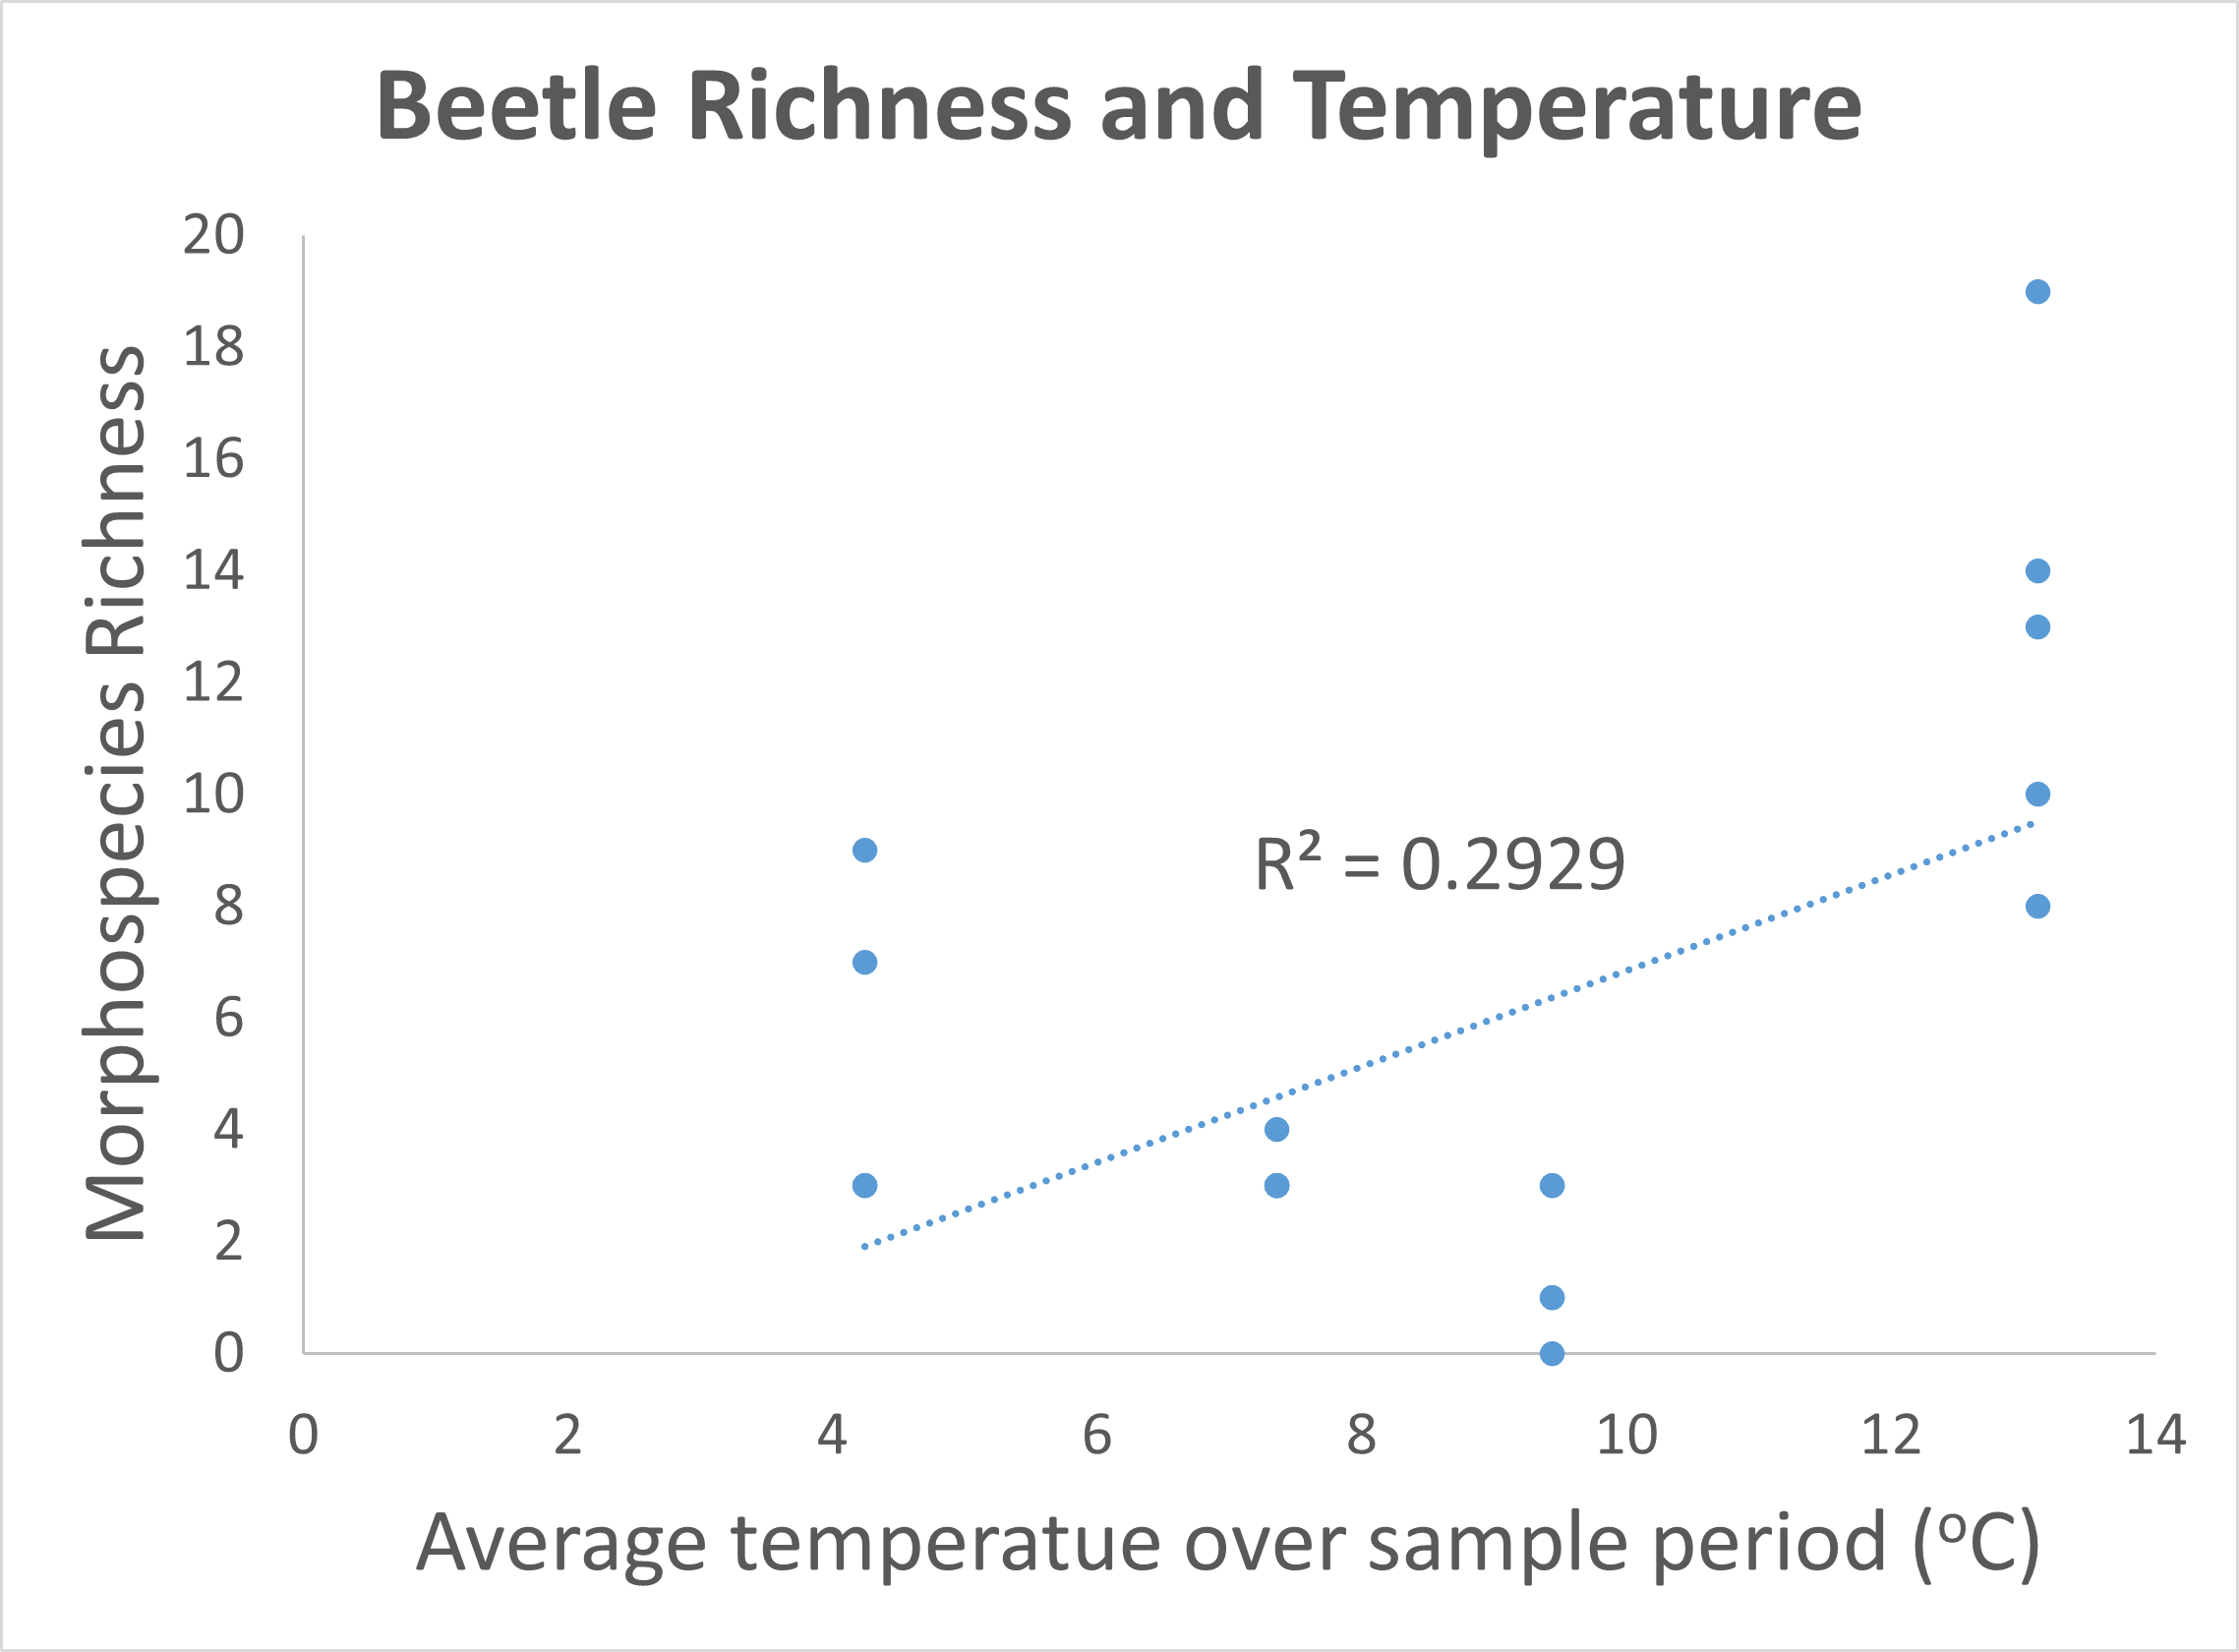
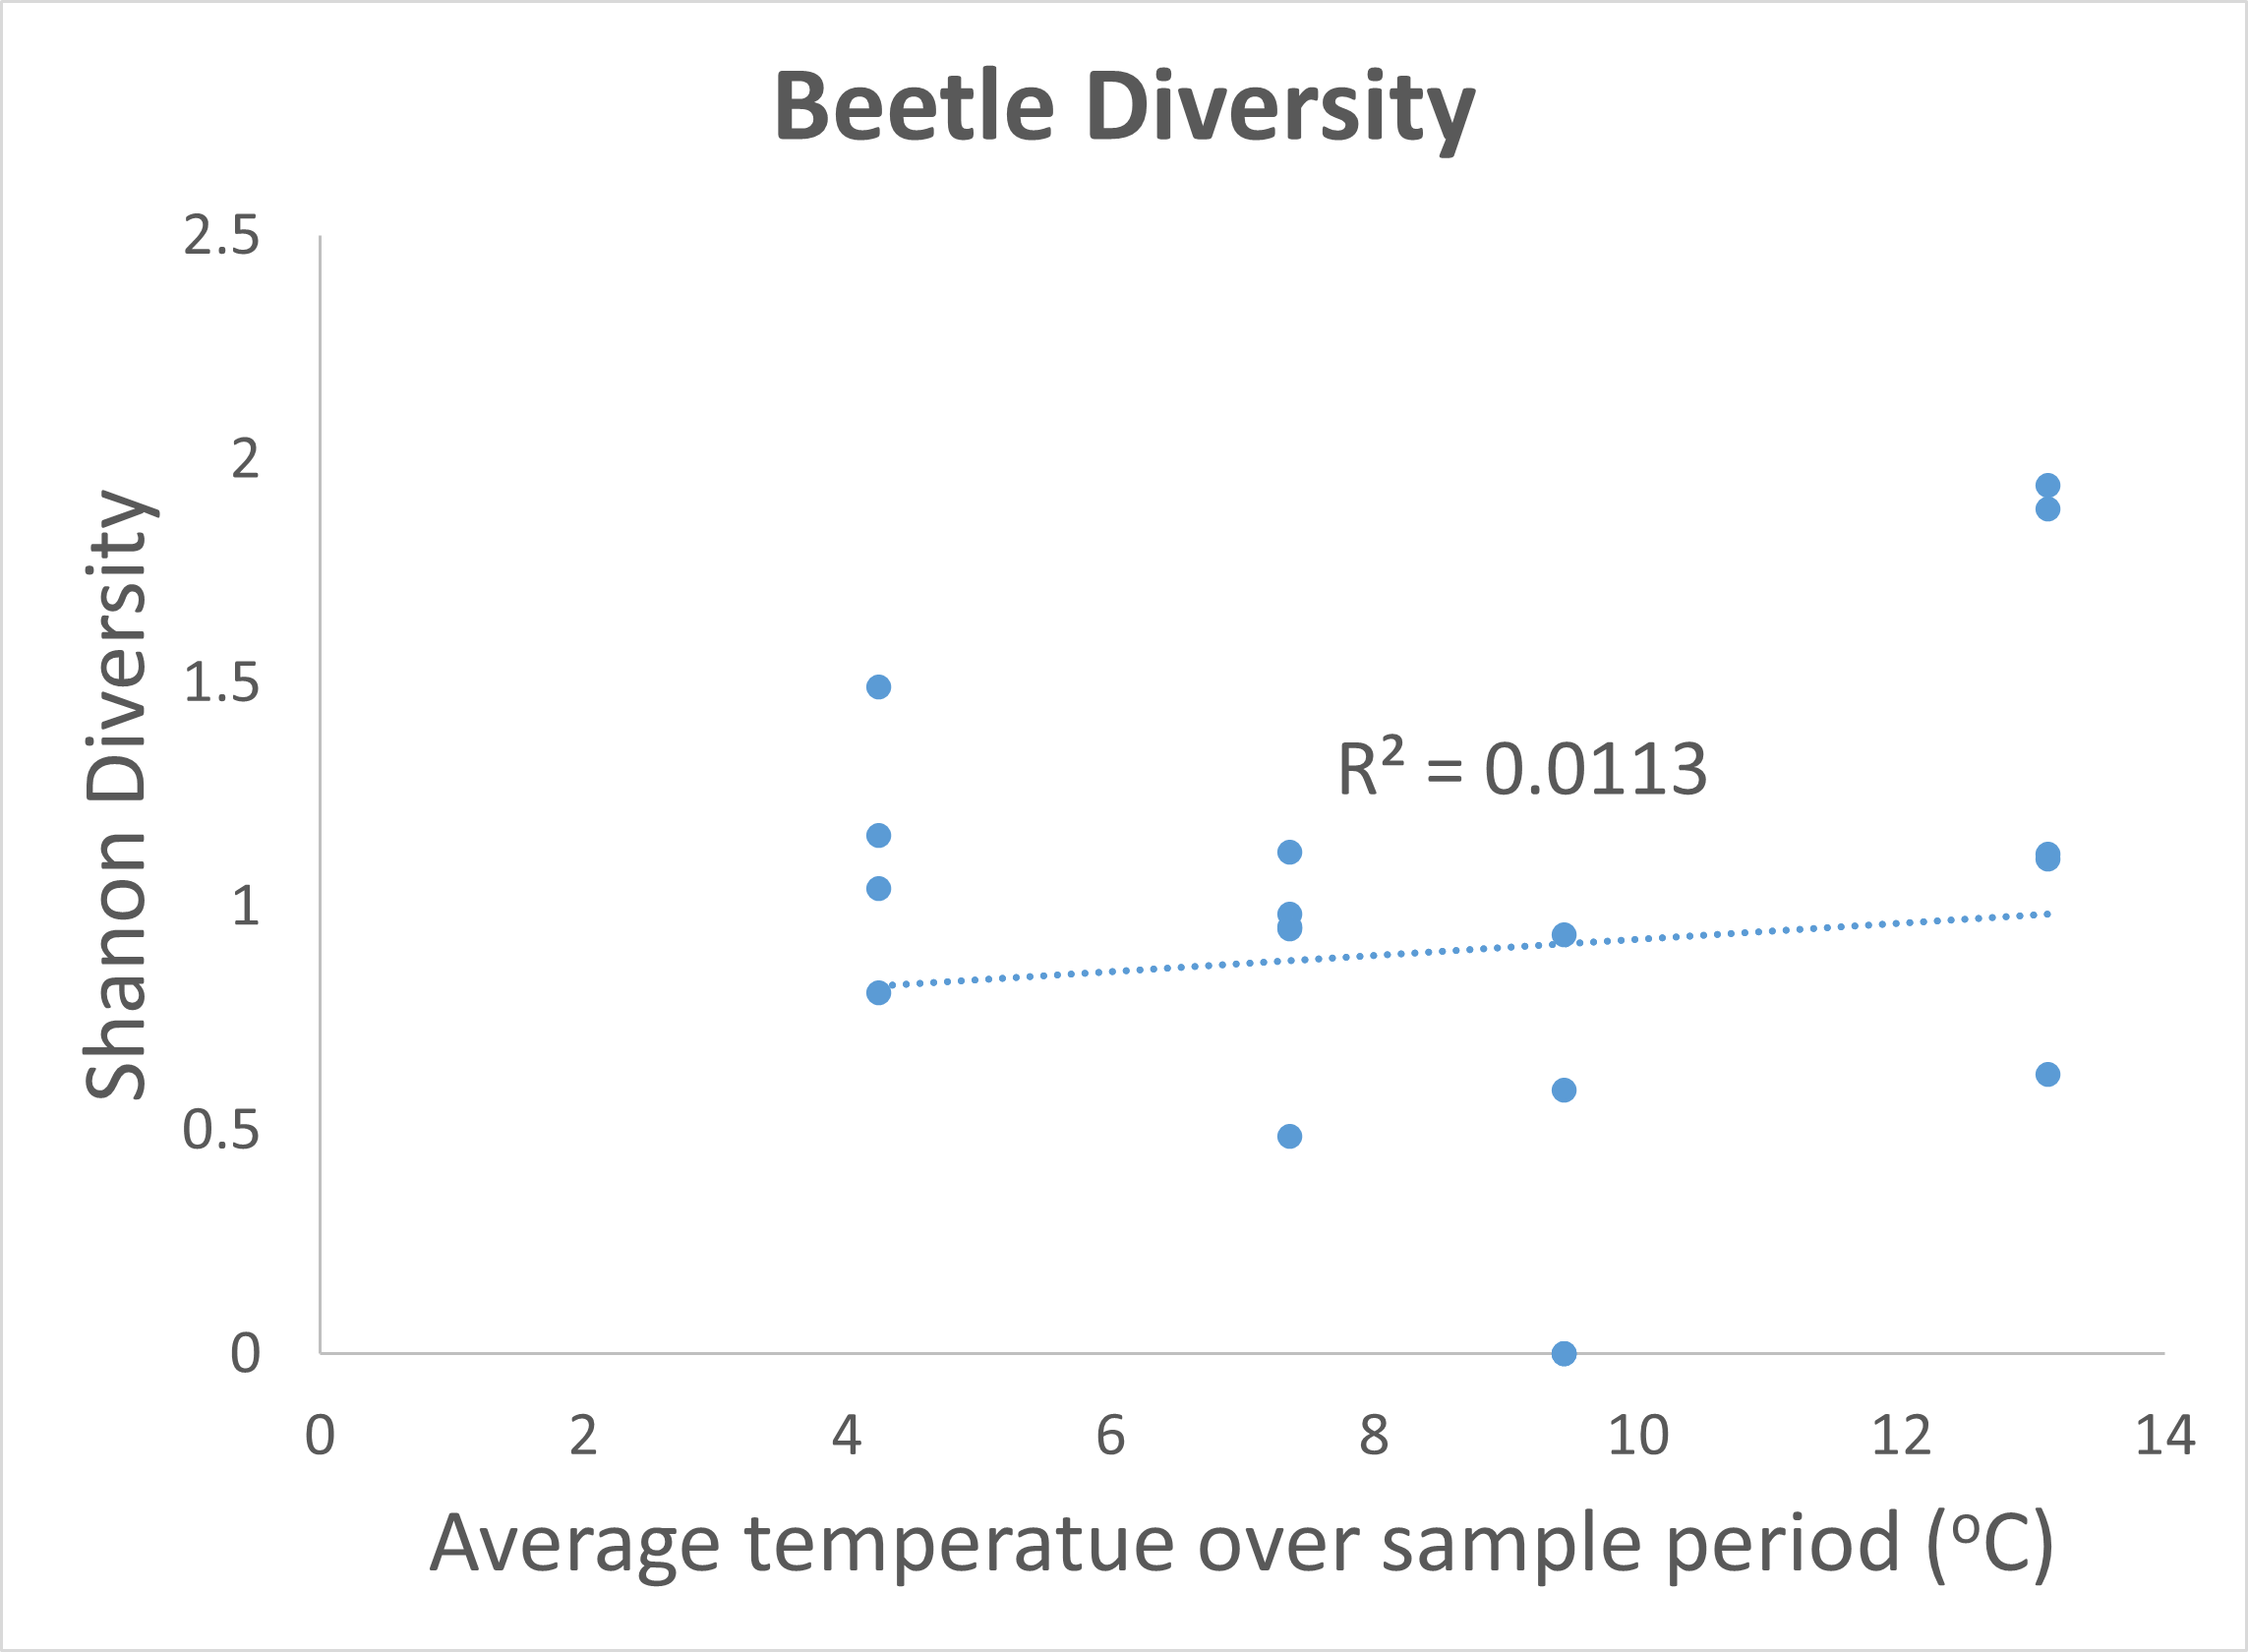
Figure 18: Beetles per trap hour, beetle morphospecies richness, and beetle morphospecies Shannon diversity as it relates to average temperature during sample periods in April and May for oak habitat fragment sites.
Of course, these results are currently preliminary and will be updated as we complete more analyses and come to understand the human-medieated factors that can influence beneficial invertebrates in agro-ecological systems.
Habitat Variables and Other Notes:
Pitfall and Pan Trap Wasp Taxa Notes
While we have not yet started data analysis on wasps collected in pitfall or pan traps, we have identified most of the wasp specimens that were collected in these trap types. Preliminary looks at this data suggest that different wasp communities are captured by the different sampling methods as we detected 4 new families of wasps in pitfalls traps that were not detected by sticky cards, delta traps, or pan traps. Part of this may be due to the fact that several of the taxa detected (e.g., Diapriidae) are quite small and may have occurred on sticky cards and in delta traps but were too badly damaged to resolve to the family level. It is particularly interesting that we are detecting taxa like Diapriidae since many species of Diapriidae are known to be parasitoids of flies, including some species that are parasitoids of economically significant flies like spotted wing drosophila (e.g., Trichopria drosophilae). While we do not have the ability to resolve wasps to species levels, this suggests that there are likely wasps in the environment in and around farms that provide pest control services to cherry orchards and may help control pests like spotted wing drosophila.
Habitat Factors Influencing Bloom Abundance:
One important habitat factor that seems to influence bloom abundance in orchard sites (mature orchards, volunteer, and cover crop sites), is the height of the vegetation. We observed that bloom abundance was positively correlated with herbaceous vegetation height in orchard sites (Fig. 19). This is a readily manipulatable factor as vegetation height is controlled by mowing in orchard sites.
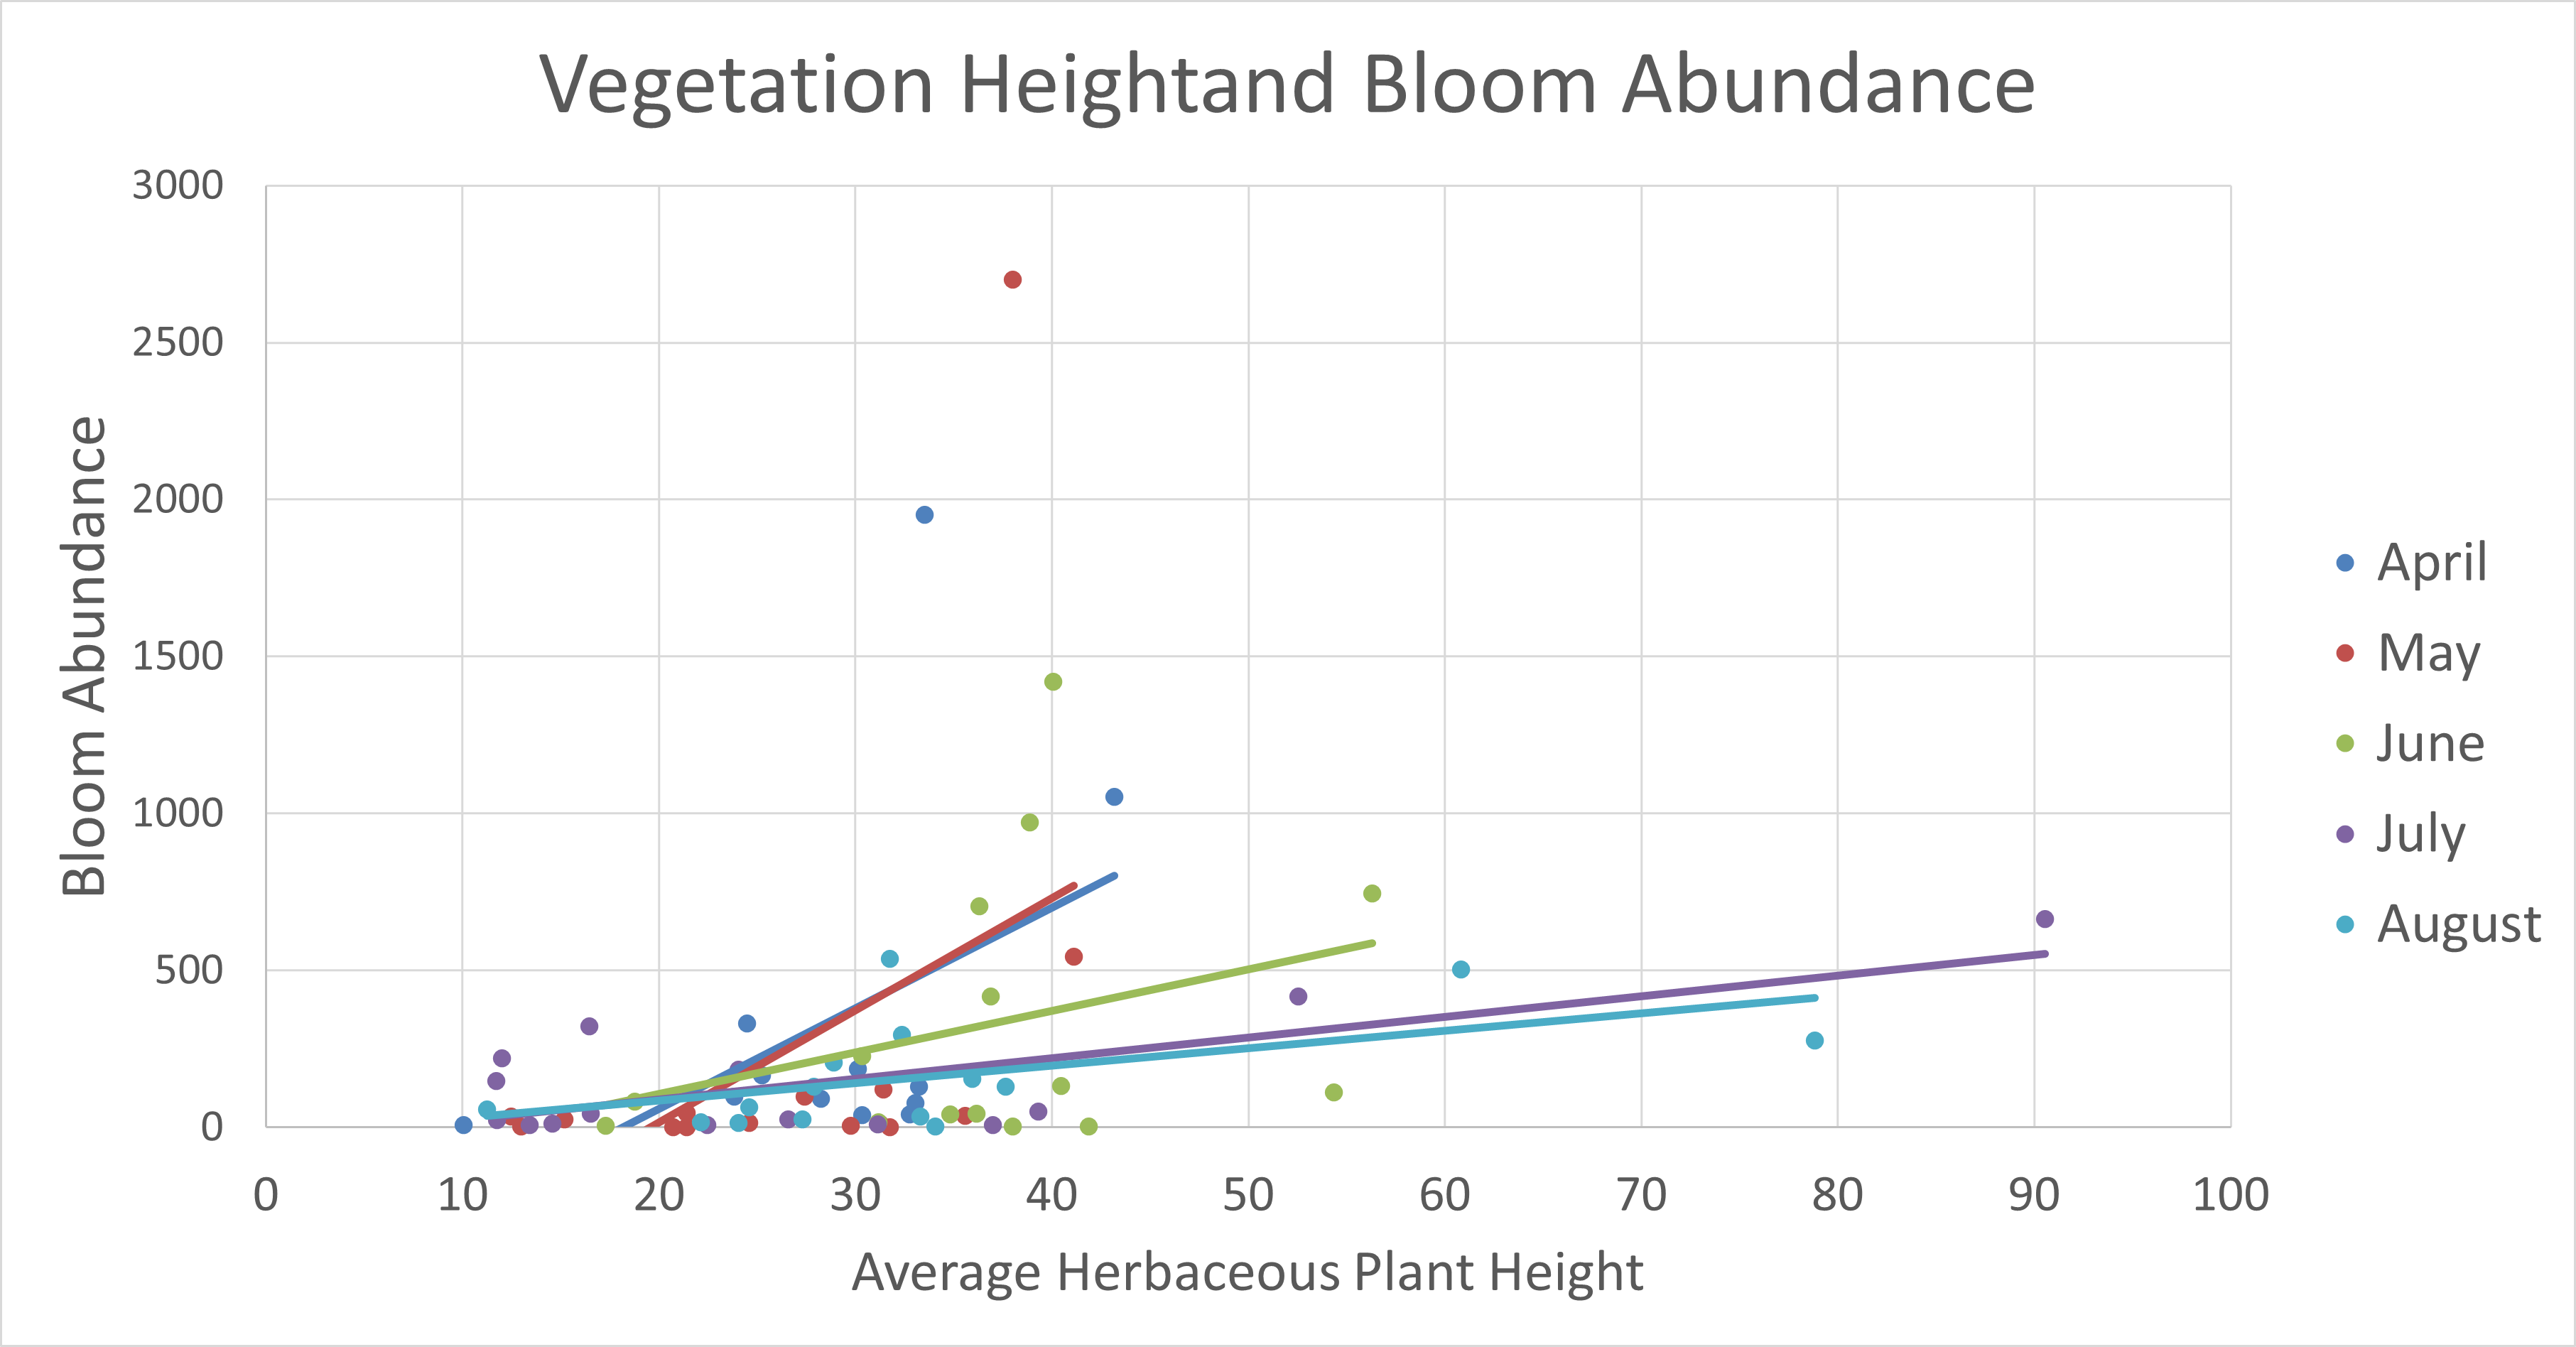
Figure 19: Generally, we observed a positive correlation between herbaceous plant height and bloom abundance in orchard sites (mature orchards, cover crop sites, and volunteer sites). This trend was consistent, but with a continually lower slope, throughout our sample period.
Research outcomes
Although we have not yet completed all lab work and analyses, we have three management recommendations based on our results so far:
- Oak habitat fragments do not seem to increase pest pressure of common pests like leafhoppers, but may serve as important sources for beneficial invertebrates such as native bees and lacewings. As such, protecting and enhancing (when possible) these habitat fragments may result in some on-farm benefits including increased pollination services (native bees are abundant in these habitats when cherries are in bloom), or increased pest control services from beneficial invertebrates like lacewings and wasps.
- Cover crops may provide important resources for beneficial invertebrates like wasps, lacewings, and bees when other farm habitats (e.g., mature orchards) lack floral resources important to nectar feeding adult insects. The value of these sites may be influenced by mowing regimes, as we found that vegetation height in orchard types was generally positively correlated with bloom abundance throughout the growing season (Figure 19).
- Cover crop sites may host pest taxa later in the season (August), as we observed higher leafhopper abundance in these sites late in the season. It is still unclear whether or not the leafhoppers present in these sites at this time of year are a species that can harbor cherry x-disease. Future research should seek to understand which species of leafhoppers are present in these sites at this time of year. Growers should evaluate the pros and cons of trying to control leafhoppers in these sites if it is found that these particular leafhoppers can harbor cherry x-disease.
Education and Outreach
Participation summary:
Education and Outreach Methods:
The main methods that we have used to communicate our research results to the broader agricultural and scientific communities has been through presentations at professional conferences, presentations at extension events, and through writing extension and scientific papers. We have used these methods to address each of our education and outreach objectives detailed below.
Our primary way of analyzing the effectiveness of our presentations was through the Western SARE Education Program Outreach Survey form and through embedded questions in our slides that participants responded to in real time during presentations.
Objective Specific Methods:
Our first education and outreach objective was to "Share research results about beneficial invertebrates, the value of adjacent natural habitat fragments, and project outcomes related to the use of cover crops in cherry orchards with fruit producers in the Columbia Basin." We accomplished this objective by presenting research at several events where producers were present and attending.
Our second education and outreach objective was "Present project results to the scientific community via conference presentations and publications in the primary literature." We accomplished this objective by presenting research findings at the Annual Ecological Society of America meeting in August of 2023.
Our third education and outreach objective was "Create targeted educational content related to beneficial invertebrates designed to connect urban audiences to sustainable agricultural research and practices." We accomplished this research objective through the production of an extension publication that discusses the benefits of wasps and talks about some of the major wasp groups that occur in Oregon. This publication is currently in press and should be available online soon.
Education and Outreach Objective #1 Results:
Our first education and outreach objective was to communicate our research to growers in the the Columbia Basin. We accomplished this through three main events and one extension publication detailed below.
The first outreach event we conducted was related to the preliminary research conducted in 2021 and included some data from our early 2022 sample periods. This was presented to a group of growers, producers, and sustainable agriculture practitioners through the Western Farms for Biodiversity Summit in June of 2022 (Figure 20). While this mostly reported on results not directly related to this grant, it helped build interest in the project and resulted in some positive conversations with participants..
The second event was at the Orchard Disease and Pest Management Conference in January 2023. This event was attended by approximately 80 people, including growers, extension agents and researchers. The third main outreach event that we held was on November 29, 2023, we presented some of our preliminary findings to approximately 40 growers, extension agents, and scientists at the Hermiston Agricultural Research and Extension Center's Farm Fair (Fig. 21). We've included some of the survey responses from the Hermiston Farm Fair presentation below.
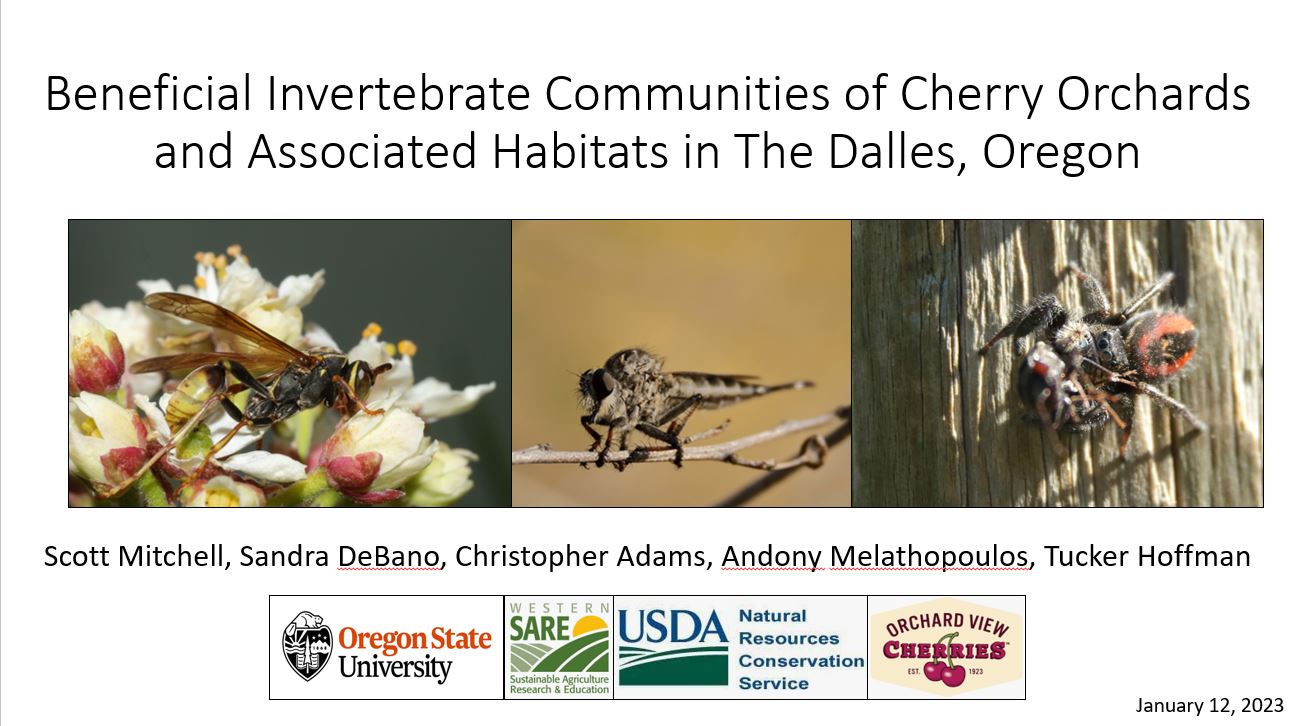
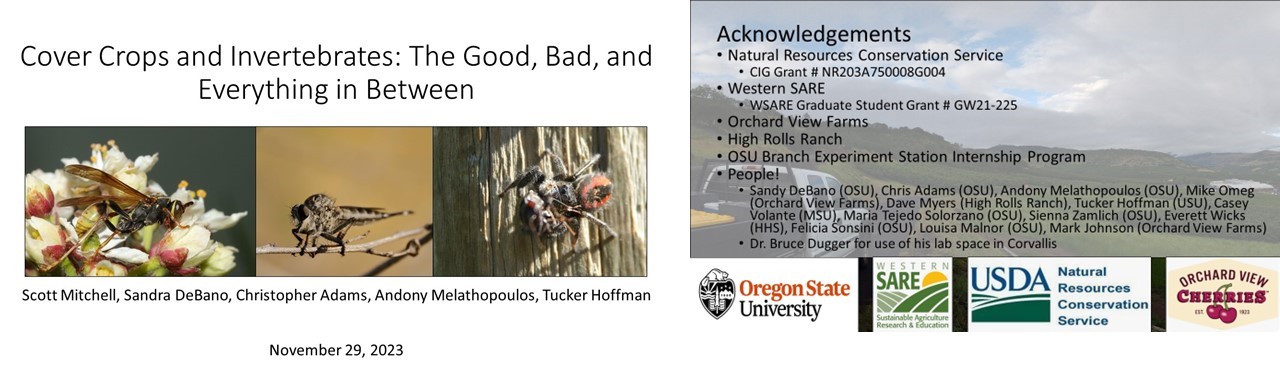
Figure 21: Top: title slide from the presentation given at the Annual Orchard Disease and Pest Management Conference. Bottom: title slide and acknowledgements for Hermiston Farm Fair presentation.
We solicited survey responses at the beginning of this talk from audience members (not all audience members participated) asking why they were using cover crops in their current farming practices and what they already knew about cover crops. We use this to help tune the rest of the presentation to be more helpful to audience members. The results showed that most folks were using cover crops for soil improvement, and that in general, most audience members knew a little but wanted to learn more about cover crops (Fig. 22). In conversations with growers and extension agents after these talks, we found that in general, participants found the presentations informative. Most participants were eager to learn more as we continue to produce results from this study. To this end, continued presentations as well as extension publications seemed to be the most effective options for communicating future results.
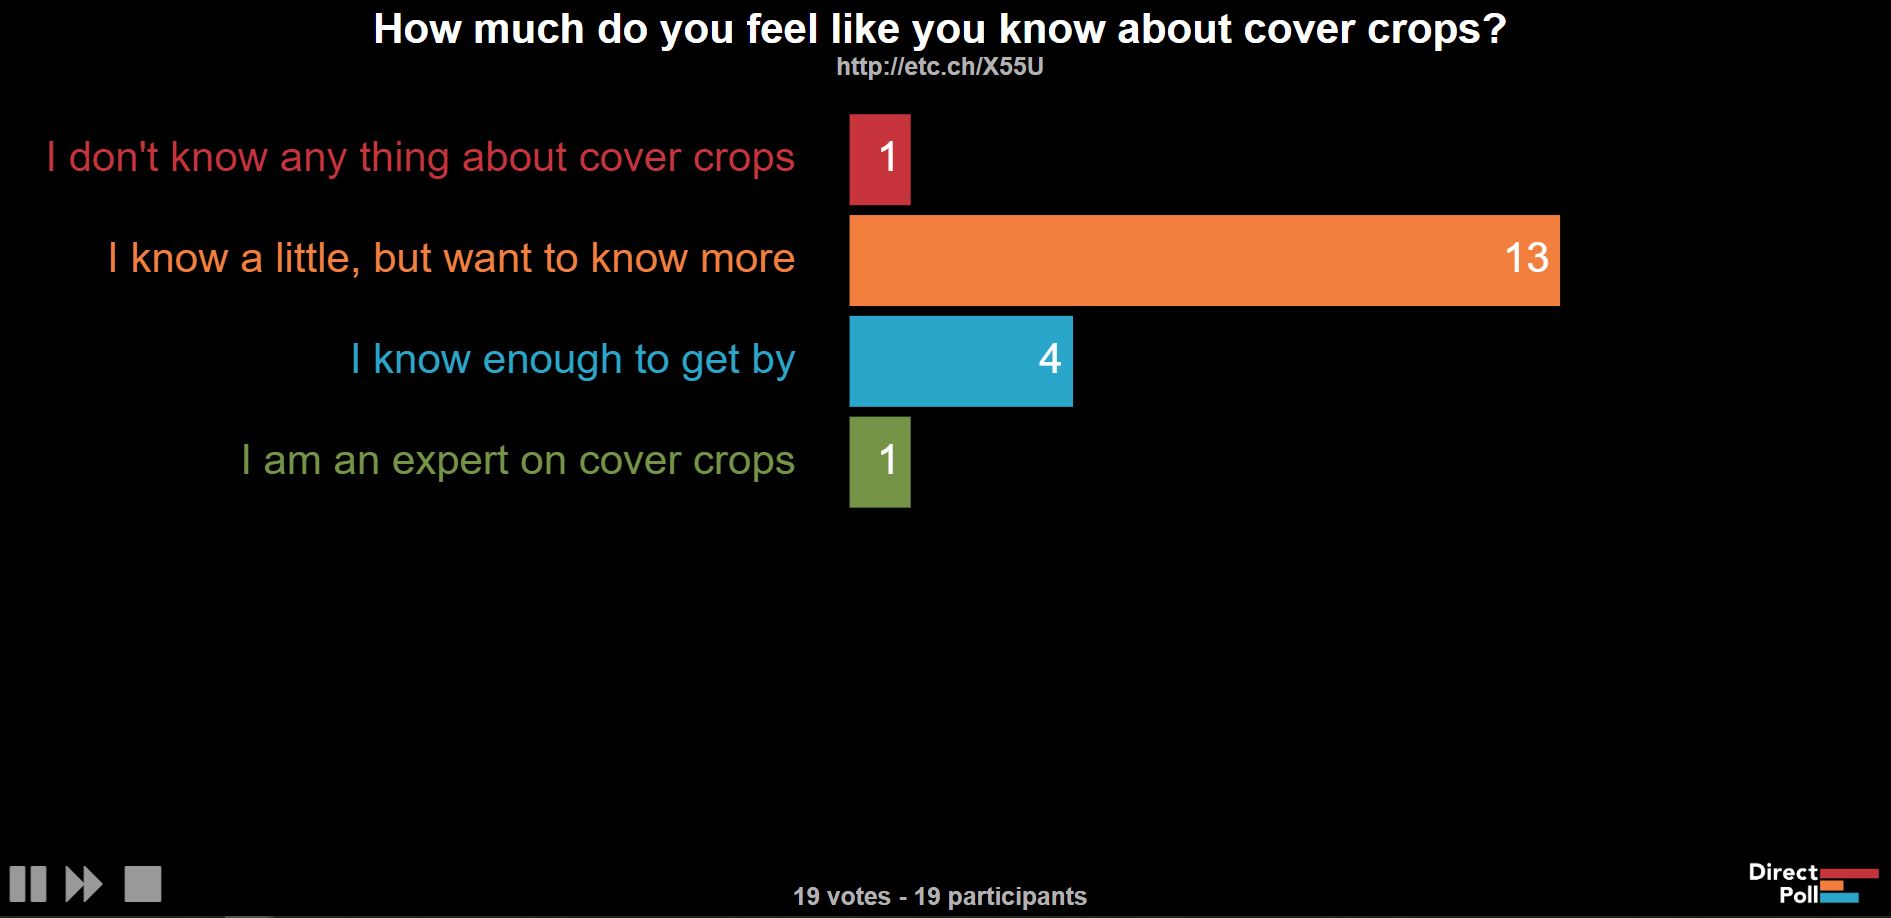
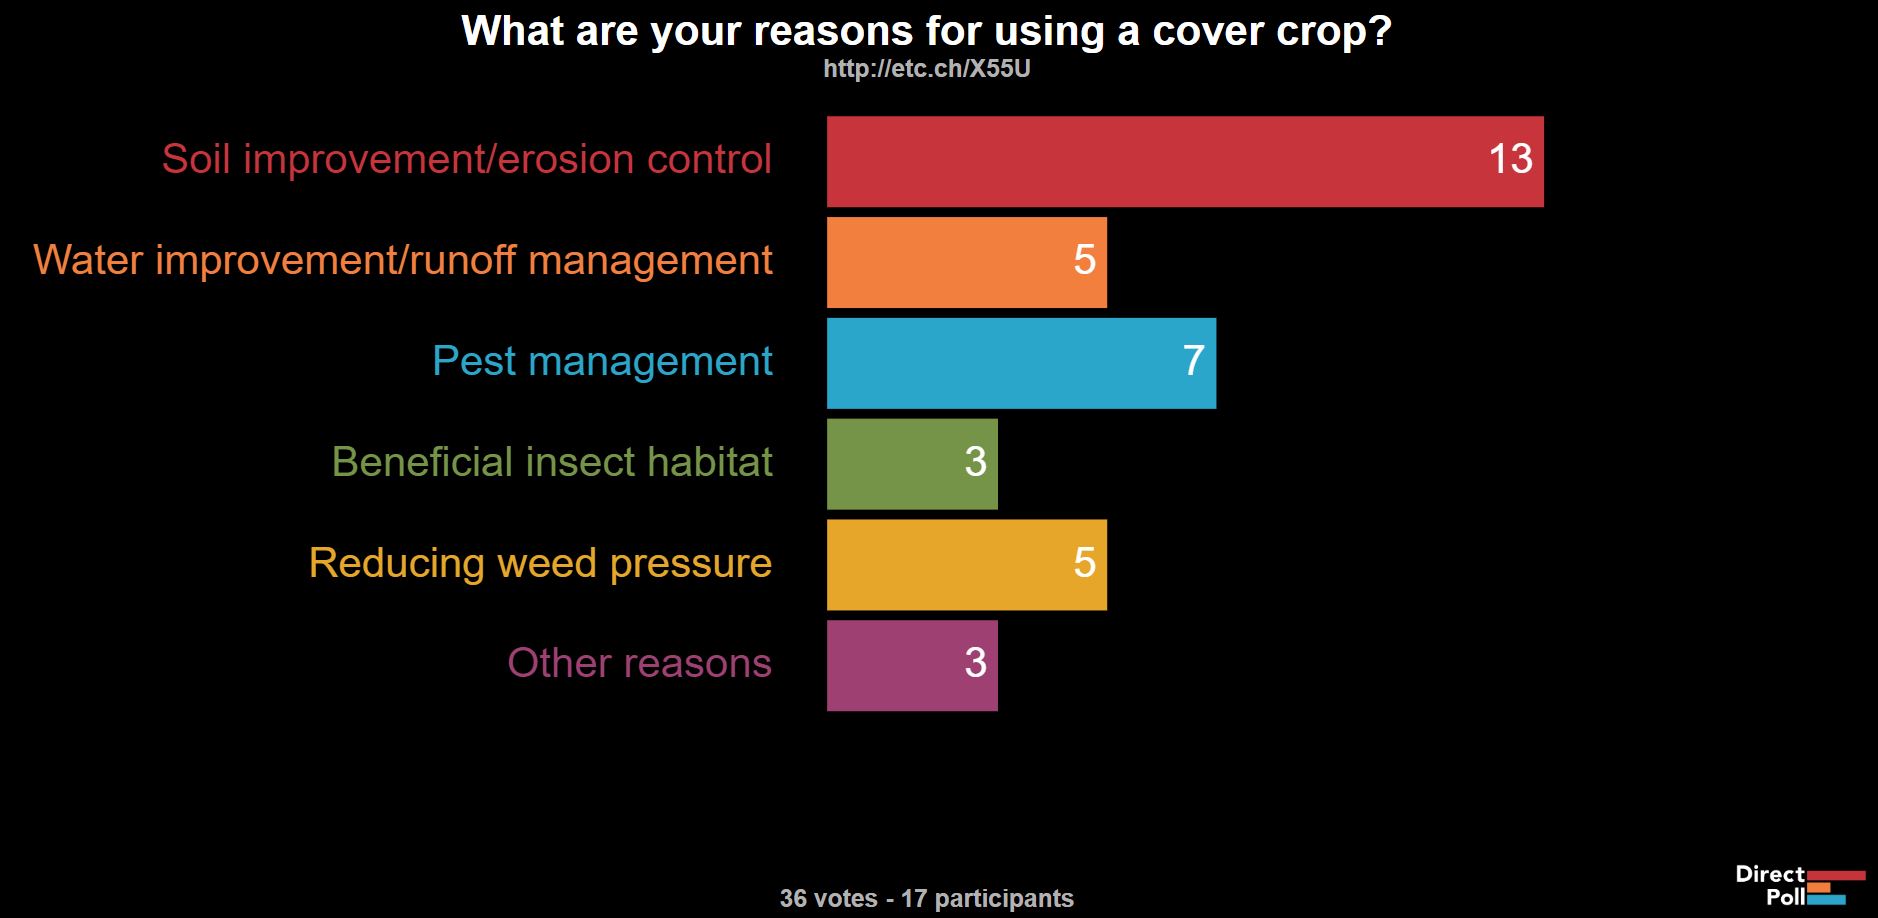
Figure 22: Each panel shows the results of the two questions asked at the start of the presentation to get grower feedback before starting the presentation.
We also had participants at the Hermiston Farm Fair presentation fill out the Western SARE survey form following the presentation. While not all participants left responses, we collected 15 responses from a mix of growers and extension personnel and received generally positive and interested feedback. The survey responses can be found at this link.
Education and Outreach Objective #2 Results:
Our second education and outreach objective was to communicate project results with the scientific community. We accomplished this both with our presentation at the Orchard Disease and Pest Management Conference and at the National Meeting of the Ecological Society of America. We are currently wrapping up edits on the first manuscript to be produced from this research and hope to submit this manuscript to a journal soon. Once this paper is made available, it will help accomplish this objective by communicating our research results with the broader scientific community.
Education and Outreach Objective #3 Results:
Our education and outreach objective was to communicate our results to a broader audience including people not connected to agriculture. We have accomplished this through several methods including presentations by student researchers at big events in Corvallis, OR and through written extension publications.
One of the interns that worked with us also presented a part of this research as her undergraduate research project last fall on October 19, 2022. This included some preliminary analyses on beetle morphospecies. The event was attended by several hundred students, faculty, and other staff at Oregon State University and was primarily attended by people in the College of Agricultural Sciences (Fig 23). This event was attended by many people who are not involved in agriculture and helped communicate some of our research results to a much broader audience.
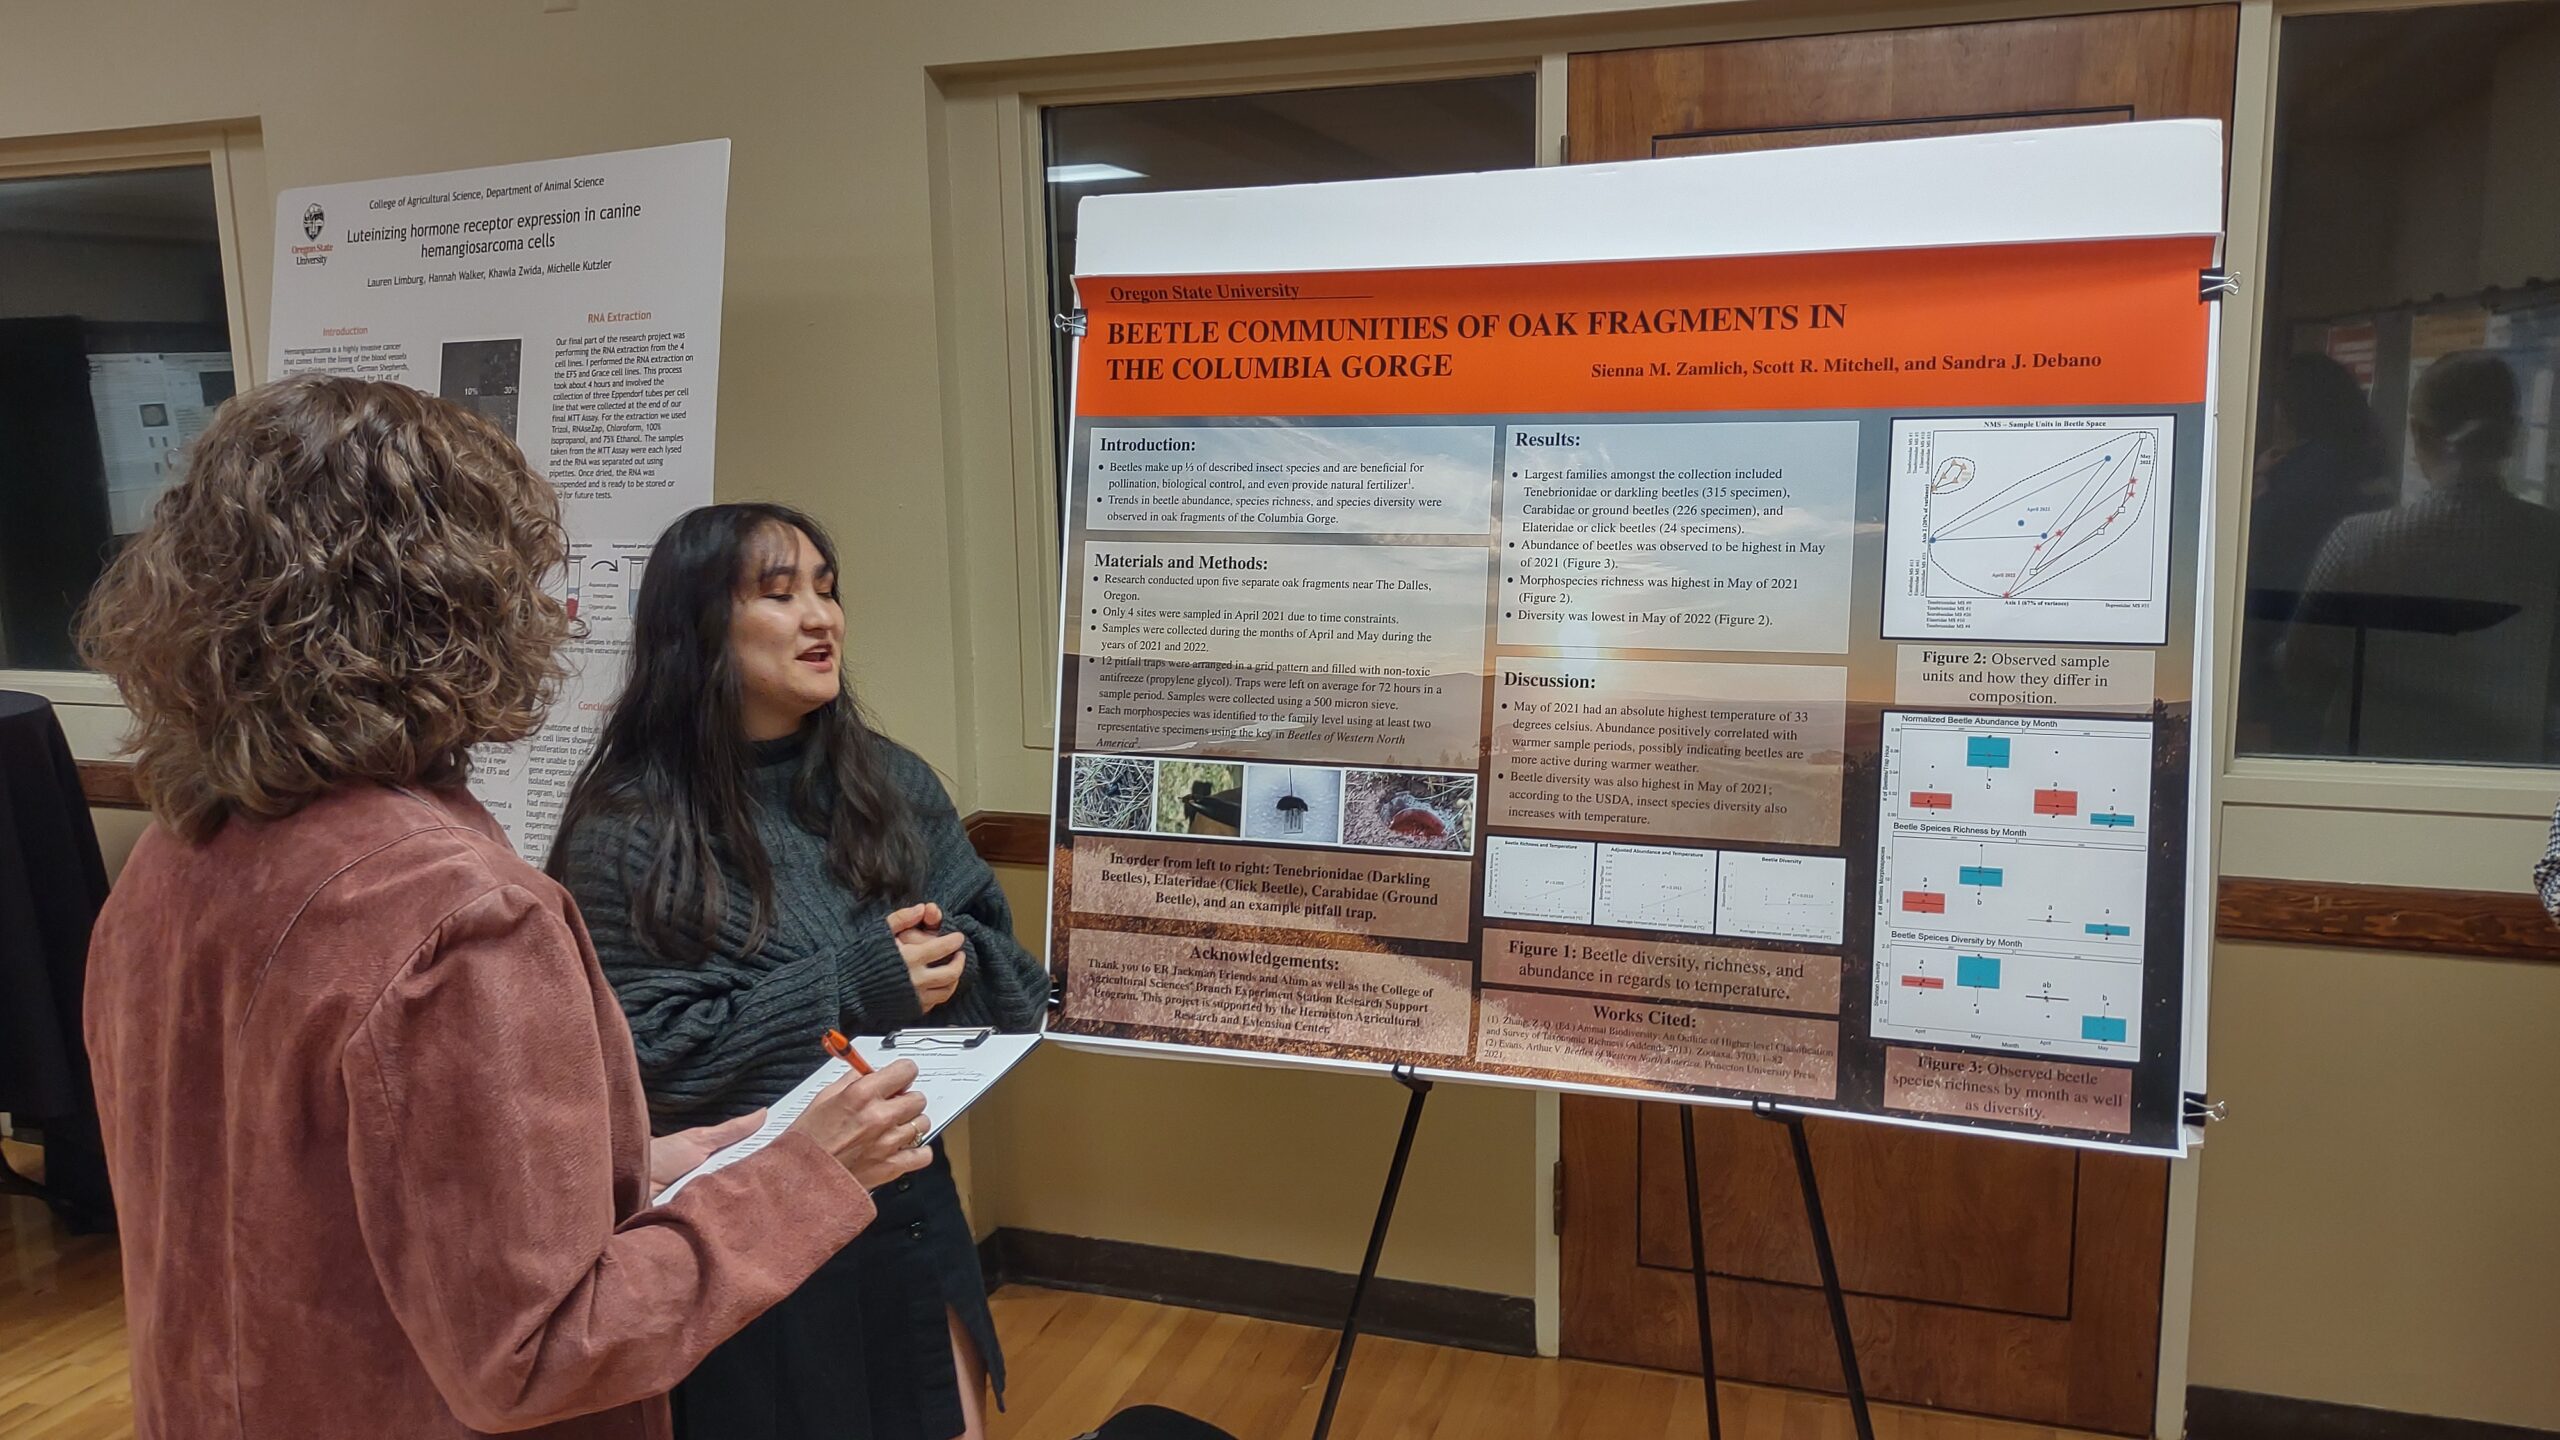
Figure 23: Research poster being presented by Sienna Zamlich, an undergraduate research assistant that helped on this project.
By presenting our research at the Ecological Society of America Annual National meeting in 2023, we also communicated our research results to a broader audience. While this audience was primarily scientists, we were able to communicate our results to a wide range of people who were not necessarily involved in agriculture, which helps address our goal of connecting urban (non-agricultural) audiences to sustainable agricultural research and practices.
Extension Publications and Scientific Journal Articles
Extension Publications
The extension publication on wasps in Oregon that we mentioned in the last progress report has been submitted and accepted by extension services for publication. The publication is still in press and has not yet come out, but we are just waiting for final proofs from extension services at OSU. This extension publication focuses on the diversity of wasps, wasp life histories, and the ecosystem services that wasps can provide to humans. This is a much needed addition to the extension literature as there are many products that focus on the benefits of other hymenopterans (specifically bees), but there are not extension publications that talk about the benefits of wasps or broadly explore the life history of this largely misunderstood group of insects. Wasps are really important as pest control agents in many agricultural systems and can provide many benefits to humans, but remain largely feared by people. This publication will be nearly 30 pages long and includes detailed descriptions of some of the major families of wasps in Oregon as well as a broad overview of wasp life histories and biology.
We currently working on creating additional extension products, but need to finish some more specimen processing and data analysis before we have scientifically sound conclusions to present in future publications.
Scientific Publications
We are also finishing up edits on a publication manuscript about wasps in oak fragments that we are planning on submitting in the next several months for publication in the journal Northwest Science. This manuscript will communicate some of our really interesting research findings about wasps in these small habitat fragments and will lay the groundwork for future manuscripts that we are working on or plan to work on in the coming months. This particular publication will be an important contribution to the scientific literature as it will represent one of the first comprehensive surveys of wasp diversity in Oregon oak habitats. These wasps are likely to provide spillover pest control services to neighboring agricultural areas and by cataloging what kinds of wasps are present in these habitats, it improves our understanding of the conservation value of oak fragments. Cataloging these wasp communities will help provide a scientific basis for our other papers as there are not currently any publications on native wasp communities in this habitat in the mid-Columbia basin.
Extension videos
Unfortunately, we lost most of the video footage we collected in 2022 on a hard drive that became corrupted (became corrupted in summer 2023). Because of this, we are planning on combining some of our originally proposed extension videos into several slightly longer productions that will convey all of the originally proposed topics. Because the hard drive failed in August of 2023, we were not able to re-film field footage for videos during the seasons when insects and farms are most active (April-July). Although we have made progress on scripts for videos, we are waiting to finalize and release videos until this summer when we can get back into the field to collect videos of farms and beneficial invertebrates in action. Without this kind of footage, we would really only be able to produce recordings of slideshows. In order to create a higher quality extension product, we are waiting until we can collect more footage to finalize and release videos.
Communication and Outreach Methods Notes
In our communication and outreach efforts associated with this project, we've found that presentations and outreach events are a really good way to communicate with growers and researchers first hand. This kind of venue allows for face-to-face conversations which seem to be an effective way of communicating with most people. We also believe that extension publications are an important method of communicating with a broader audience and of providing lasting materials that can be used much longer than just a presentation itself.
Literature Cited:
Daryanto S, Jacinthe PA, Fu B, Zhao W, Wang L. 2019. Valuing the ecosystem services of cover crops: barriers and pathways forward. Agriculture, Ecosystems, and Environment 270: 76-78
DuPont ST & Strohm CJ. 2020. Integrated pest management programmes increase natural enemies of pear psylla in Central Washington pear orchards. Journal of Applied Entomology 144: 109-122.
Goldberger JR & Lehrer N. 2016. Biological control adoption in western US orchard systems: results from grower surveys. Biological Control 102: 101-111.
Heimpel GE. 2019. Linking parasitoid nectar feeding and dispersal in conservation biological control. Biological Control 132: 36-41.
Jones VP, Horton DR, Mills NJ, Unruh TR, Baker CC, Melton TD, Milickzy E, Steffan SA, Shearer PW, Amarasekare KG. 2016. Evaluating plant volatiles for monitoring natural enemies in apple, pear and walnut orchards. Biological Control 102: 53-65.
McCune B, Grace JB, Urban DL (2002) Analysis of ecological communities. 1st edition. Gleneden Beach, Oregon: MjM Software Design.
Murphy AF, Rondon SI, Jensen AS. 2012. Population dynamics of the beet leafhopper (Hemiptera: Cicadellidae) in the Columbia Basin as influenced by abiotic variables. Population Ecology 41(4) 768-775.
Smith DiCarlo LA & DeBano SJ. 2019. Spider community responses to grassland restoration: balancing trade-offs between abundance and diversity. Restoration Ecology 27(1): 210-219.
Smith DiCarlo LA, DeBano SJ, Burrows S. 2019. Short-term response of two beneficial invertebrate groups to wildfire in an arid grassland system, United States. Rangeland Ecology and Management 72: 551-560.