Final report for GW21-227
Project Information
In recent meetings, growers have expressed a strong interest in understanding soil health for wine grape production systems. The problem is that we currently lack a comprehensive framework to assess soil health for the semi-arid Mediterranean soils of the western U.S. This problem is more challenging for the California wine grape production industry not only due to its large soil diversity but to this crop’s unique management practices and goals. Therefore, soil health for California vineyards might have a different definition and sustainable management requirements compared to other crops (Lazcano et al. 2020).
Therefore, we aim to 1) develop a definition of soil health for wine grape vineyards that meets the unique growers’ production goals, and 2) assess diverse soil health indicators in vineyards across the Napa Valley region.
With the collaboration of growers, this study will help us improve and do targeted sustainable recommendations for conserving soils while helping growers achieve their production goals. We expect to observe trends of soil health indicators among soil types and sustainable management practices.
The objectives of this project were:
- To develop a definition of soil health for wine grape vineyards that meets the unique production goals.
- To assess the variability of diverse soil health indicators in vineyards across the Napa Valley region.
The outreach objectives of this project were:
- To integrate growers' collaboration and participation in defining and assessing soil health for such unique crops as wine grapes.
- To provide several informational talks for growers and develop short farmer-friendly articles (i.e. factsheets) communicating about the importance of soil health, the role of the soil organic matter and soil microbial ecology in soil health, and the main findings of our project.
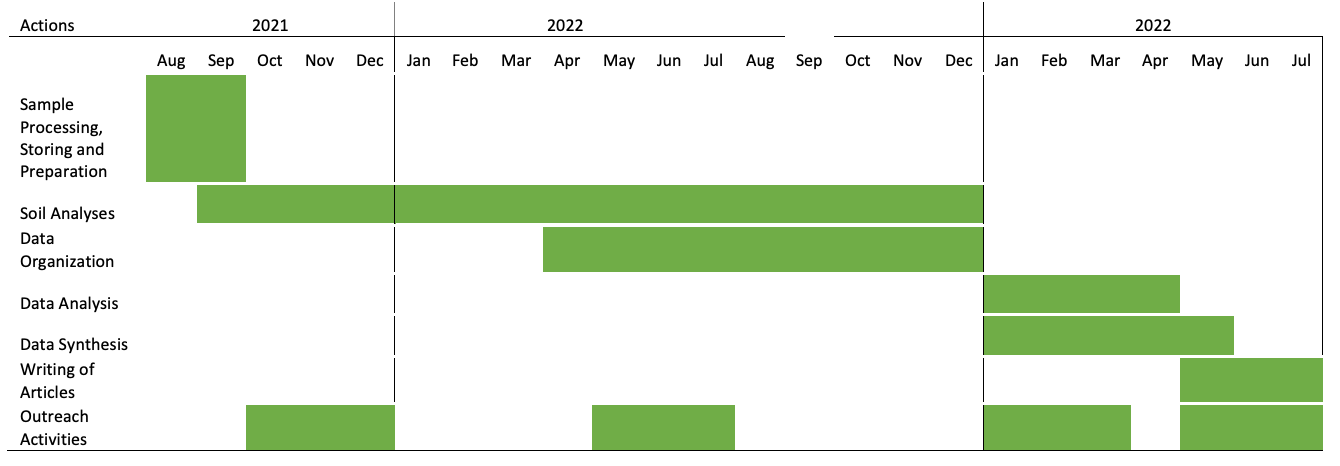
Samplings and ratings were performed during the spring of 2021, but for the purposes of this grant, we focused on the laboratory soil health testing and analysis that started in August of 2021. The sampling and rating happened during the spring because this is the time when growers are available to collaborate with us. The soil ratings (challenging vs ideal) will took place during the same sampling day on each farm. Following the soil health testing and analysis of samples, proceeded to organize, analyze, and synthesize the data and finally writing the findings in a farmer/industry friendly report, as well as a scientific paper. A detailed description of the timeline for this project is provided in Table 1. The major milestones that will be accomplished include developing a soil health assessment of the Napa Valley Region for the first time which will be helpful for growers to decide on performing sustainable soil management practices for sustainable agriculture.
Cooperators
- - Producer
- - Producer
- - Producer
- (Researcher)
- (Researcher)
- - Producer
Research
Objective #1: To develop a definition of soil health for wine grape vineyards that meets the unique production goals.
During the summer of 2020, we conducted semi-structured interviews to 15 wine grape growers of the Napa Valley region to understand their perception of soil health for wine grape production (Gonzalez-Maldonado et al., in preparation). These interviews were key for understanding the grower's knowledge, thoughts, and actions towards soil health and sustainable soil management practices. In addition, a quantitative approach was integrated to complement the assessment of grower’s perception of soil health for vineyards, a crop that requires unique and specific practices and goals compared to other crops. Therefore, , farmers were asked to rate two areas where they believe their soils better reflected their production goals (an ideal soil) and the opposite (a challenging soil) following Mann et al. (2019). After these soil ratings were made by farmers, we proceeded with the second objective of sampling soils and assessing soil health indicators in those exact sites. The purpose of rating soils is to quantify and understand the most important attributes of a soil for wine grape production by comparing them with quantitative soil health data. To complement the ratings, we asked growers to provide a set of detailed information on soil management practices to be integrated into the analysis.
Objective #2: To assess the variability of diverse soil health indicators in vineyards across the Napa Valley region.
Samplings
This project took place in 32 vineyards from Napa Valley, California, with the collaboration of the Napa Valley Grape Growers Association and 16 local wine grape growers. Soil sampling, preparation, and storage happened from late February to May of 2021 upon growers' availability for collaboration. Soil samples were taken from selected representative areas of each vineyard and rating (ideal and challenging soils) guided by the grower. Samples were taken for two depth intervals (0-10 cm and 10-20 cm) and two locations (vine row and tractor row). The sampling was divided into two depths and two locations due to organic material inputs and microbial activity usually being higher in the top depth of soils and differences in inputs from differing plants growing. For instance, growers grow cover crops in the tractor rows (or alleys) which might drive different results compared to the vines row. Three sample replicates were taken per vineyard leading to a total of 384 soil samples. The geographic coordinates of the sampling locations were recorded to categorize each vineyard into a soil type (or soil cluster) classification system. Additionally, soil taxonomy information was collected using the SoilWeb online tool (https://casoilresource.lawr.ucdavis.edu/gmap/) including soil textural class and soil series. For this grant, focus was given to the soil health indicators analyses performed in the laboratory.
Soil health analyses
Soil Physical Properties
The soil physical properties quantified in this study were gravimetric soil moisture, water holding capacity, and soil texture. We assessed soil infiltration and soil compaction in the field but these remained out of the scope of this grant due to time limitations. In California, water is an important limiting factor, so we need to assess how much moisture potential and availability there is in the soils. Gravimetric soil moisture was measured by calculating the difference between field moist soil and dried soil (105 C°). The available water holding capacity was quantified from capillary soil saturation at field capacity of dried soil. Soil texture was quantified to determine particle size following the rapid method described in Kettler et al 2001. The soil texture method allowed us to classify our soil types according to textural class.
Soil Chemical properties:
Soil pH and electrical conductivity (EC) were measured in a 2:1 (soil:water) paste using a pH and EC electrode (Fisher Scientific, Waltham, MA). Soil pH and salinity (obtained through EC) are important factors that drive soil biological processes including plant growth. Also, soil organic matter % was calculated from total C assessed through dry combustion. Permanganate oxidizable carbon (POXC) was assessed to estimate the active carbon pool of the soil organic matter (Culman et al., 2012). Organic matter has been shown to be an important factor in soil health, so total soil organic matter is an overall good indicator of soil quality. However, active carbon, in particular, has been shown to be sensitive to short and long-term management practices (Culman et al 2012) and is also related to the amount of carbon that could be mineralized; so, this indicator is important to determine how much soil organic carbon will be eventually lost as CO2 rather than being stabilized in the soil (Hurisso et al 2016). Quantifying both total and active soil organic matter is a good way of considering the spectrum of soil organic matter in the soil. Soil organic matter is one of the main drivers of soil health since it has the capacity to influence other soil properties for good like water infiltration, reduce soil erosion, increase soil microbial diversity, achieve higher yields in some crops, among others.
Soil Biological Properties:
Soil microorganisms are essential drivers of key soil processes for agriculture and environmental quality like nutrient cycling, soil organic matter turnover and stabilization, nutrient availability, aggregate stability and reduced soil erosion, water filtration, pest suppression, among others. We used several methods that have been shown to provide useful general information regarding microbial diversity and activity like soil respiration, potentially mineralizable nitrogen, and phospholipid fatty acid profiles (PLFAs). Soil microbial respiration was measured using a LICOR-850 infrared gas analyzer that quantifies CO2 respired by microorganisms from re-wetted soil samples to 50% water holding capacity and incubated (2 days) in an air-sealed gas jar. Microbial respiration is an indicator of how active soil microorganisms can be when adequate moisture is added. Also, potentially mineralizable N (PMN) was estimated by measuring ammonium produced in incubated soils under anaerobic conditions for 7 days in the laboratory (Moebius-Clune et al. 2016). Measuring PMN helps us understand potential nitrogen release, which is one of the most needed and limited nutrients, for cycling and availability for plants. Soil microbial diversity was analyzed by a commercial laboratory (WARD Laboratories, Inc.) through a phospholipid fatty acid (PLFA) assay from the 0-10 cm depth which is where typically most microorganisms are concentrated in the soil. The PLFA method provides information about the structure of the soil microbial community by differentiating bacterial and fungal microorganisms. Studying soil biodiversity helps us understand what type of organisms are present in the soil and obtain an idea of functions they could carry which can have different impacts on nutrient cycling and availability, soil carbon, and ultimately in soil health.
Data Analyses
The interviews were analyzed by following inductive coding using NVIVO. In summary, the codes are keywords identified and grouped as main ideas from the grower’s answers. Inductive coding means that codes were not predetermined prior to data analysis but emerged from the interviewee responses.
We evaluated growers’ soil rating factors and quantitative soil health data performing a general linear model using the soil health ranking as response variables, and grower rating, and depth as fixed effects using the "glmmPQL" function from the MASS package (Venables and Ripley, 2002) in RStudio (RStudio Team, 2020). The relationship between biological, physical and chemical soil health indicators is currently undergoing analysis through multivariate statistics such as Principal Component Analysis (PCA) and results will be shared in scientific article during 2024. Data visualization using the "ggplot2" (Wickham H, 2016) function from RStudio of descriptive statistics was performed to understand soil health indicators trends by soil type and grower rating in the Napa Valley Area.
Objective 1 Results
Most growers identified themselves as vineyard managers (12), others as both owners and managers (2), and few as only owners (2) leading to a total of 16 participants for the interviews.
Overall, soil health was described as important for the wine grape growers interviewed; however, it had descriptions unique to wine grape production goals. A healthy soil for wine grape production was defined as one that:
1) Allows adequate vine vigor control
2) Produces high-quality grapes
3) Maintains vine health
4) Allows to reach yield targets
5) Has adequate water holding capacity and good infiltration
6) Has “balanced” fertility
7) Resists erosion
8) Needs minimal inputs and interventions
Most growers prioritized vigor control and vine health when describing a healthy and ideal soil for red wine grape production. Many growers stated that inducing water stress to control the vine vigor through deficit irrigation is a technique they use for producing the desired grape quality. They described that the soil plays an essential role in this action through the water holding capacity (WHC) and infiltration. For red wine grape varieties (which is the grape we focused on in this project), growers want a soil that does not excessively retain or infiltrate water. Like the WHC, growers described a healthy soil as one that is “balanced” in terms of soil fertility. Often, increasing soil health was related to high fertility which was cataloged as undesirable since it would challenge vine vigor control. A few growers mentioned that low fertility was preferred for vines to thrive and produce high-quality grapes.
- “I would say that I think there’s probably a spectrum of soil health. It’s very rare that anything is black and white, y’know so I think as long as your soil health is somewhere near the center of maybe the two ends... I don’t know what exactly the ends would be.”
- “I think it’s very important. But not in the sense that it has to be super fertile soil, I just like that it needs to be healthy soil.”
In addition to maintaining healthy vines and allowing adequate vigor control, some growers mentioned that a healthy soil would allow them to reach yield targets and minimize inputs and interventions. Most growers stated that a healthy soil should be self-sustaining and resilient to erosion and other environmental threats.
The most important soil properties highlighted as ideal by growers were:
- Coarse soil texture
- Adequate water holding capacity
- Good infiltration
- Adequate (not high) levels of nutrients, especially Nitrogen
- Sufficient (not excess) organic matter
Soil texture was the most highlighted soil property among growers. Fine-textured soils were perceived as undesirable and coarse/gravelly soils were preferred for achieving quality goals. The reason for this is that fine-textured soils have higher water holding capacity which could disbalance vine vigor by increasing it, which is undesired. So, growers tended to prefer coarser and gravelly soils over clayey soils that have lower infiltration.
- “I guess a balanced soil with a little bit more umm, larger particles. I’ve always seen that slightly gravelly loam soil … it’ll retain a decent amount of water but will also drain decently well. And you can get umm, you can umm reduce vigor a little bit in this kind of soil. So you have the ability to control vigor.”
The main barriers for the adoption of sustainable or regenerative practices to build soil health include lack of targeted and clear information and thoughts of potential negative economic impacts for grape production. Growers were generally interested and willing to change management practices and invest in building soil health if beneficial (mostly in terms of economical benefits) and practical information was provided. Some of the research gaps found in this assessment that can guide future research and outreach efforts include understating (1) what are the optimal soil health indicator values by soil type for wine grape production in California?; (2) how does regenerative soil management practices influence soil health functions particularly related to soil water cycling?(3) what is the role of soil microbial diversity in soil and vine health? (4) how can improving soil health in vineyards could economically benefit grape growers? (5) how can regenerative soil management practices could influence vine balance and wine grape quality?
Objective 2 Results
As expected, most soil health indicators values were significantly different between the two depth intervals (0-10, 10-20 cm) including Permanganate Oxidizable Carbon (POXC), Microbial Biomass Carbon (MBC), Mineralizable Carbon (Min C), Potentially Mineralizable Nitrogen (PMN), and inorganic Nitrogen (N) except for MBC that was not significantly different between depths at the tractor row (Table 2, Figure 1 and Figure 2). Biodiversity indicators from PLFA analysis like Bacterial and Fungal biomass were only measured in the top depth. Values were generally higher in the top depth for most of these indicators (Figure 1 and Figure 2).
The soil health indicators that were significantly different between grower ratings in general include Min C, PMN, and Inorganic N (Table 2). Here, mean values for Min C appeared to be slightly higher in the challenging soils; however, mean values for the nitrogen indicators seemed similar and data variability was high between grower ratings (Figure 1 and Figure 2). POXC and wet aggregate stability were significantly impacted by grower rating only in the vine row (Table 2) where mean values appear slightly higher in the challenging soils (Figure 2). On the other hand, MBC was influenced by grower ratings only in the tractor row with mean values being higher in the ideal soils. Soil PLFA bacterial and fungal biomass and fungi:bacteria ratio were not significantly different between grower ratings. Higher levels of labile C and N soil health indicators in the challenging soils might be due to overall higher clay content in these soils (Figure 3). In fact, higher clay content was one of the factors that growers highlighted as part of challenging soils rating criteria. Higher levels of MBC in the ideal soils might reflect higher carbon stabilization or sequestration processes potentially due to presence of cover crops.
|
Table 2. Generalized linear mixed model analysis p values for the soil health indicators measured in the tractor and vine rows at two depths. The sites were set as the random effect and Depth and Grower Ratings were set as the fixed effects. |
|||||||||
|
Tractor |
|||||||||
|
Factors |
POXC |
Min C |
MBC |
PMN |
Bacterial biomass (PLFA) |
fungal biomass (PLFA) |
Fungi:Bacteria ratio |
WAS |
Inorganic N |
|
Depth |
<0.001 |
<0.001 |
0.0927 |
<0.001 |
NA |
NA |
NA |
0.1530 |
<0.001 |
|
Grower Rating |
0.1768 |
<0.001 |
<0.05 |
<0.05 |
0.5246 |
0.6193 |
0.4947 |
0.9610 |
<0.05 |
|
Depth x Grower Rating |
0.1278 |
<0.05 |
<0.05 |
<0.05 |
NA |
NA |
NA |
0.4752 |
<0.05 |
|
Vine |
|||||||||
|
Depth |
<0.001 |
<0.001 |
<0.05 |
<0.001 |
NA |
NA |
NA |
0.7630 |
<0.001 |
|
Grower Rating |
<0.001 |
<0.05 |
0.7606 |
<0.05 |
0.9917 |
0.9931 |
0.8572 |
<0.05** |
<0.05 |
|
Depth x Grower Rating |
0.2286 |
0.4750 |
0.5135 |
0.3278 |
NA |
NA |
NA |
0.6541 |
0.3278 |
Figure 1. Soil Health box-plots Tractor Row
Figure 2. Soil Health indicators box-plots Vine Row
Research outcomes
Based on our results, we strongly recommend scientists to adopt a participatory approach to assess soil health with agricultural stakeholders. For instance, the needs assessment conducted in this study, particularly using semi-structured interviews, allowed us to understand current research gaps, motivations or incentives, and barriers for growers to adopt practices that could benefit soil health. The main barrier for adoption of beneficial soil health practices in vineyards of Napa Valley was lack of information on how regenerative or sustainable soil management practices could influence not only soil health properties but also water management, grape quality, and production costs.
We also recommend for soil health indicators to be evaluated by soil type which encompasses inherent soil properties like soil texture and mineralogy. Also, soil health and must be assessed and recommendations should be made considering the agroecosystem goals; for example, recommendations for soil management might differ in grain crops compared to wine grapes. Our results suggests that for wine grape production in Napa Valley, growers prefer a soil with coarser texture which is associated to functions such as higher water infiltration for grapevines to have the desired water stress during the growing season. It is important to say that these preferences are particular to our region of study (North Coast) and might differ from other winegrowing regions of California. Although soil health indicators trends mostly showed challenging soils as the ones with higher values, these could be due to these soils having higher clay content. The higher the clay content, the more capacity the soil will have to retain soil organic matter and soil C and N pools. Future research should evaluate soil health indicators by soil type categories and by including the long-term effects of diverse sustainable soil management practices. Focus should be given in assessing soil health focusing on vineyard resiliency, longevity, and sustainability especially since these are areas growers showed strong interest and as these agroecosystems are strongly vulnerable to negative impacts from climate change.
Education and Outreach
Participation summary:
The educational and outreach objectives were:
- To conduct presentations in field day workshops and growers’ conferences.
- To produce a publication of a factsheet targeted for farmers
The following educational/outreach activities were conducted to satisfy the objectives:
- Sonoma UCCE Grape Day: Vineyard Soil Health. Educational talk about the importance and relevance of soil health for wine grape production and preliminary results from Napa Valley soil health study – February 2023. Audience: Wine grape growers of the North Coast of California. Attendance estimate: 15o. Link: https://ucanr.edu/sites/ChenLab/Events/Speaker_Presentations/
- Water Talk podcast: Invited to talk about soil health and regenerative viticulture, and discuss our Napa Valley Vineyard Soil health research – February 2023. Audience: general. Link: https://www.watertalkpodcast.com/episodes/episode-42
- Outreach Presentation [Spanish]: Evaluación de indicadores de Salud del Suelo en Viñedos del Valle de Napa en California. UC Davis Chile Life Sciences Innovation Center (October 2022). Audience: farmers.
- Outreach Presentation [Spanish], Indicadores de salud de suelos, ejemplos prácticos. UC Davis Chile Life Sciences Innovation Center (August 2022). Audience: farmers Audience: farmers
- Outreach Presentation [Spanish], Evaluación de indicadores de salud de suelos importantes para viñedos en Napa, California. 2do Congreso Arte-Suelo-Ser, San Juan, PR (December 2021). Audience: general.
Individual reports with results from our soil health study were shared with all participating growers (15 reports). Instead of the publication of a factsheet, more efforts are being applied to developing a grower-focused vineyard soil health booklet with the collaboration of the Napa Valley Grape Growers Association, the Napa Resource Conservation District (RCD) and UC Davis. The estimated publication date for this booklet is December of 2023.
In addition to outreach activities, our research dissemination efforts continued through scientific presentations in professional societies conferences:
- 2 Oral presentations of preliminary results in the Agronomy Society of America 2021 annual meeting (Tri-Societies) in Salt Lake City, UT.
-
- Growers' Perceptions of Soil Health for Wine Grape Production in Napa Valley. Link: https://scisoc.confex.com/scisoc/2021am/meetingapp.cgi/Paper/138206
- Evaluating Important Soil Health Indicators for Winegrape Production in Napa Valley. Link: https://scisoc.confex.com/scisoc/2021am/meetingapp.cgi/Paper/138191
- Research poster of preliminary results at the 2022 Soil Science Society of America annual meeting (Tri-Societies) in Baltimore, MD
- Is microbial diversity related to soil health? A study in Mediterranean vineyards. Link: https://scisoc.confex.com/scisoc/2022am/meetingapp.cgi/Paper/144159
- Research Presentation at the 2023 Global Soil Biodiversity Conference in Dublin, Ireland
- Assessing the soil microbiome's role on soil health in the context of Napa Valley terroirs. Link to abstracts book (p.475): https://gsb2023.org/media/pdf/G/S/B/GSB-2023-Abstract-Book.pdf
- Research poster of preliminary results at the 2023 American Society for Enology and Viticulture in Napa Valley, CA
- Assessing the variability of Soil Health indicators across California Vineyards. Link (P43): https://www.asev.org/session/2023-poster-sessions
Based on our outreach activities, we recommend more participation in grower-focused outreach activities like the University of California Cooperative Extension Grape Day. We also strongly recommend for researchers to collaborate with wine grape growers by doing needs assessments and including growers in the research design.
Although we weren't able to conduct a formal survey as planned, we had conversations with attendants from the outreach activities. Some suggestions growers provided at the outreach events included: doing more on-farm collaborative research, providing information on how they can assess soil health in the field, and also making sure soil health information is accessible in terms of language and format (for example, some growers suggested for researchers to record talks and upload them to a podcast channel so they could listen to it while they worked).Growers also suggested the production of a guide or booklet, which is already in progress with the collaboration of diverse stakeholders, about vineyard soil health that included information on ranges of values across diverse soil types, and educational information about different regenerative soil management practices impacts.