Final report for GW21-229
Project Information
Certain traits that comprise successful snap bean cultivars, such as high productivity and stress resistance, are similar across agricultural management systems. Others are unique to organic systems alone, such as high early season vigor to compete with weeds or root systems that support nutrient foraging and robust microbial relationships. Cultivars available to organic farmers have historically been developed for and within conventional systems, however snap beans intended for organic farming must be bred within the organic environment to maximize adaptation.
The proposed project will improve our understanding of the characteristics that benefit snap bean varieties in organic systems and will incorporate these phenotypes into new cultivars. Broadly, we will quantify relevant traits, associate these traits with improved SNP genetic maps, characterize the root and rhizosphere microbiomes, and commercialize new varieties from our research populations.
Farmers are the primary beneficiaries of new cultivars. As such, their input is essential to create varieties that are well suited to the target growing environments. Accordingly, the proposed breeding work involves seed company and farmer participation throughout the selection and evaluation of candidate cultivars. We will reach out to producers not directly involved in the project through the development of new Extension materials and multiple field day presentations.
This project will build upon existing research regarding snap bean performance in organic systems by quantifying pertinent phenotypes for use in varietal improvement, associating genotypic information with these phenotypes, and utilizing the combined information in new cultivar development.
Research Objectives:
- To understand how population-wide differences in germination rate and seedling vigor relate to previous breeding under organic or conventional management
- To quantify differences in functionality of plant-rhizobia interactions within and between populations with comparisons made to the breeding histories of each population
- To characterize the root microbiome within a subset of each of the four populations through the use of 16S and ITS sequencing
- To utilize the existing four populations to develop a new snap bean variety in collaboration with a regional seed company and local vegetable farmers
Education/Outreach Objectives:
- To engage with producers via field days, feedback meetings, and the creation of an organic snap bean cultivation guide for the maritime Pacific Northwest.
- To conduct outreach to the regional rural and urban communities. This includes STEM (science, technology, engineering, math) youth outreach and educational digital media creation.
- To communicate our research findings with the academic community via poster presentations, public seminars, and publications.
- To propose and organize a panel presentation on organic grain/vegetable legume breeding for the biennial Organic Seed Growers Conference that will be held in the spring of 2022
- To organize and conduct a stakeholder needs assessment for organic legume breeding
Cooperators
- - Producer
Research
Four populations of snap beans were utilized in this experiment as a result of two initial crosses made in the winter of 2015. The parents used in crosses were selected in a manner that pairs a modern, elite snap bean to an older variety with good performance in organic and low-input conditions. All of the parental populations are determinate (bush) beans and produce medium sized pods. The seed color in the elite parental cultivars, Hystyle and OR5630, ranges from white to light green (persistent color). The seed color in the traditionally organic parental lines, Provider and Black Valentine, ranges from purple to black. The parental inbreds were crossed as follows: Hystyle x Provider (HYPR) and OR5630 x Black Valentine (ORBV). Following the F1 generation of these crosses, each of the two recombinant inbred populations was separated into two groups and grown in parallel under conventional and organic conditions. This process resulted in four populations, two from each cross and two under each management system. Within each population there are approximately 90 families, or groups of inbred lines. Our breeding method applied selection pressure on each of the four breeding populations, creating two sets of populations that can be used to discern breeding management system effects from population genome structure. T
Research sites for our studies included a field location associated with Oregon State University, the university greenhouses, as well as on-farm sites for each of the producer cooperators. The OSU Vegetable Research Farm, located two miles directly east of the university campus, was be the location of field trials under parallel conventional and organic management. Our root architectural experiments were carried out at the OSU greenhouse facilities. Our primary collaborator, Territorial Seed Company, grew subsets of beans at their farm outside of Cottage Grove, OR.
Objective 1:
The first objective of this study aimed to understand how population-wide differences in germination rate and seedling vigor relate to previous breeding under organic or conventional management.
Germination rate and seedling vigor were evaluated in each of the four populations of Phaseolus vulgaris, with replication of all populations in both organic and conventional fields. The F8 generation of each population was planted in the spring of 2022 in an incomplete block design. Two fields, one under each management regimen, were planted at the OSU Vegetable Research Farm. An early sowing date, when soil temperatures are at the germination threshold of 10C for beans, was chosen so as to enact selective pressure on the populations. All populations grown in the conventionally managed system were treated with a fungicide (Captan) seed treatment. The populations grown in the organically managed system received no seed treatment. Emergence date, seedling counts, and seedling vigor data were collected for all populations in both fields.
Objective 2:
The second objective of our research sought to quantify differences in functionality of plant-rhizobia interactions within and between populations with comparisons made to the breeding histories of each population.
Quantity and functionality of plant-rhizobia interaction were assessed within each population through multiple controlled greenhouse experiments. In the winter of 2022, a subset of the F8 generation of each population was grown in the greenhouse with a uniform, organic soil mix. In the first experiment, three treatments were applied to replications of each population subset: conventional fertilizer, organic fertilizer, and no fertilizer. Data was collected on the root architecture, number of root nodules, and proportion of functional nodules for the plants grown under each treatment. In a second experiment the seed of all populations will be treated with either appropriate or inappropriate rhizobia inoculum, along with a control treatment. Rhizobia is considered appropriate if the symbioses with the legume leads to nitrogen fixation, which can be assessed through the internal color of the nodules. Root architecture data was also taken on the entire F8 population in the summer of 2022 using shovelomics techniques.
Objective 3:
The third objective involved the characterization of the root microbiome within a subset of each of the four populations through the use of 16S and ITS sequencing. The community composition of each root system was compared within and between population subsets.
In order to understand how breeding history relates to the ability of snap beans to control their proximal and internal microbiomes, the bacterial and fungal community composition within the root and rhizosphere was characterized. Root samples were collected in the summer of 2022 from a random subset of 10 inbred families within each population, for a total of 40 families. The rhizosphere soil, which is located immediately outside of the root cells, was separated from the roots through centrifugation. Root samples were then extensively sterilized. Two samples from each family, one from the rhizosphere and one from the sterilized root, provided environmental DNA (eDNA) that underwent amplification and sequencing to identify the genes encoding the 16S and ITS rRNA components. These genes are highly conserved across bacterial and fungal taxa, respectively, and are therefore useful in determining microbial identities to the genus, and sometimes species, level.
Samples weresequenced in the fall of 2022 through Illumina MiSeq services offered by Oregon State University’s Center for Genome Research and Bioinformatics. Post-sequencing analysis provided information regarding the community composition of both bacterial and fungal species within the root and rhizosphere microbiomes. Following analysis of community composition, comparisons were made between the root and rhizosphere microbiomes within and between populations.
Objective 4:
Our fourth objective utilized the existing four populations to develop a new snap bean variety in collaboration with a regional seed company and local vegetable farmers. This process included the use of a participatory plant breeding framework, which includes focus groups, mother-daughter breeding sites, and in-vivo data collection.
To achieve this final objective of developing new snap bean cultivars we designed a participatory plant breeding project. Our producer collaborator, Territorial Seed Company, evaluated a subset of bean families from our four populations in the summer of 2022. In the fall of 2022, we met to winnow the subset down to a candidate list of families. With the input of Territorial Seed Company, we focused on selecting the top cultivar/cultivars from the list of candidates to bring into commercial production.
Objective 1: Our first objective was to gain understanding on how population-wide differences in germination rate and seedling vigor relate to previous breeding under organic or conventional management.
To achieve this, we grew each of the four research populations in two fields, one under management conventional and one under organic management. Emergence date, seedling counts, and seedling vigor data was collected for all populations in both fields. Collected data was analyzed, and any traits of significance related to early-season performance were explored through QTL (quantitative trait loci) analysis.
We SNP genotyped all families from the four populations and generated a set of linkage maps was generated for each population. SNP mapping, or single-nucleotide polymorphism mapping, involves identifying genetic markers (polymorphisms) within all of the individuals of a population. This allows for comparison of phenotypes across a large population, and the determination of genetic regions that are associated with certain phenotypes. Our new maps provided remarkably more markers compared to the original maps generated for these populations, shown in Table 1. The new ORBV maps are still under development but are expected to show similar improvements in market density and coverage.
Table 1: Numbers of markers pre-and post-JoinMap, individuals used in map after removing heterozygous and identical individuals, and overall cM (centimorgans) of each map (modified from (King, 2019).
|
Mapping Population |
Generation |
Year |
Polymorphic Markers (no.) |
Markers in Final Map (no.) |
Population size in Final Map (no.) |
Coverage (cM) |
Reference Map Coverage (%)y |
Creator |
|
ORBV-O |
F5 |
2018 |
1635 |
445 |
85 |
1153 |
96 |
King, 2019 |
|
ORBV-C |
F5 |
2018 |
1635 |
388 |
84 |
798 |
67 |
King, 2019 |
|
HYPR-O |
F5 |
2018 |
1088 |
272 |
91 |
590 |
49 |
King, 2019 |
|
HYPR-C |
F5 |
2018 |
1088 |
268 |
88 |
566 |
47 |
King, 2019 |
|
HYPR-O |
F7 |
2020 |
2207 |
383 |
92 |
793 |
66 |
Park, present work |
|
HYPR-C |
F7 |
2020 |
2207 |
366 |
88 |
751 |
63 |
Park, present work |
yBased on 1,200 cM (centimorgan) average genetic map length.
Germination data were explored for significance using ANOVAs. Significance tests were run on the F7 and F8 generations of the four populations to explore the main effects (i.e., seed color, cotyledon color, breeding history, cross, production system, and production system by breeding history interactions), shown in Table 2.
Table 2: Mean squares and degrees of freedom from ANOVA on early-season phenotypic data from F7 and F8 generations of four recombinant-inbred line snap bean populations, from data collected in 2020 and 2021 at the Vegetable Research Farm in Corvallis, OR.
|
Days to Germination |
Percent Germination |
Vigor |
||
|
Source |
df |
MS |
MS |
MS |
|
Seed Color |
1 |
91.34*** |
2.85*** |
130.38*** |
|
Cotyledon Color |
2 |
36.69*** |
0.60*** |
12.96*** |
|
Breeding History |
1 |
49.74*** |
0.98*** |
8.57** |
|
Cross |
1 |
250.39*** |
4.91*** |
27.60*** |
|
Production System |
1 |
1974.92*** |
0.38*** |
2.81* |
|
Breeding History * Production System |
1 |
3.89* |
0.11* |
17.671*** |
|
Error |
|
0.74 |
0.02 |
0.85 |
|
Error df |
|
2133 |
2133 |
2133 |
|
Adjusted R2 |
0.607 |
0.209 |
0.102 |
Significance codes: * indicates significance at <0.05; ** indicates significance at <0.01; *** indicates significance at <0.001.
We then utilized the data collected on the F7 and F8 generations, as well as F6 data from that was previously taken on the same populations to explore relationships between the main effects. Figure 1 depicts germination percentage in relation to other main effects of interest.
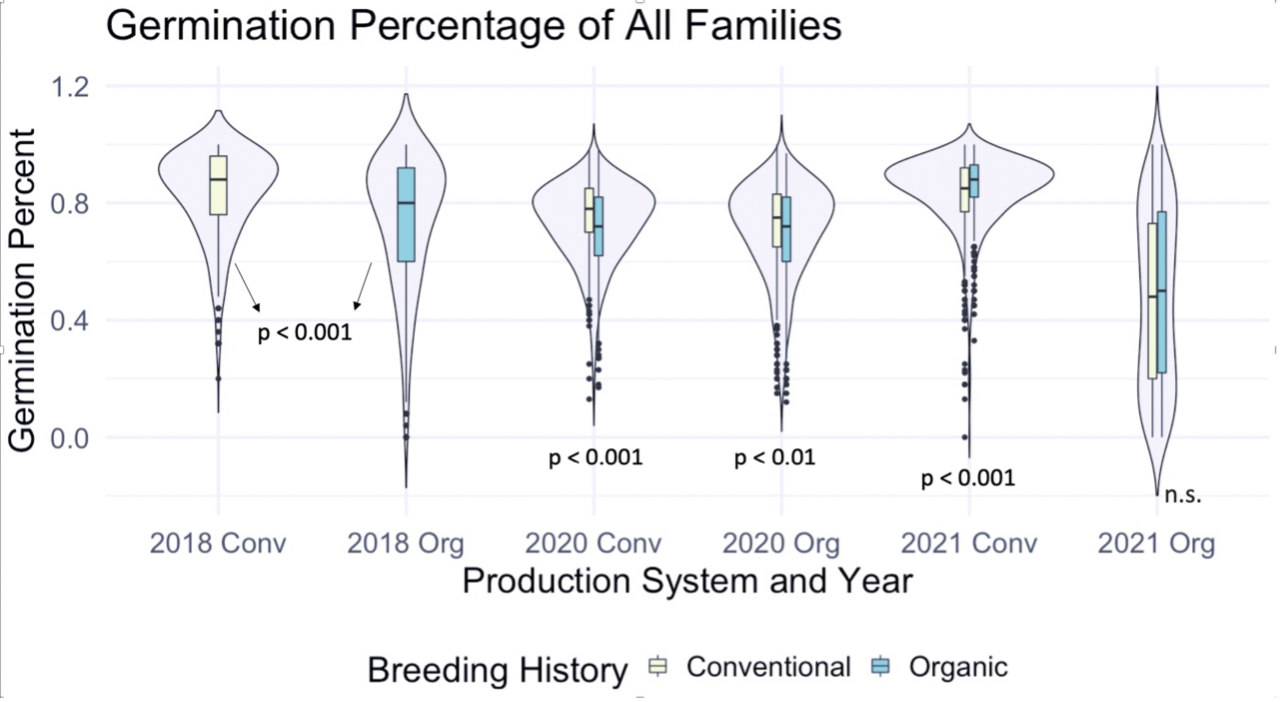
Figure 1: Germination percentage of all families from all populations within various treatments, collected from the F6-F8 generations of snap bean populations grown in conventional and organic production systems at the OSU Vegetable Research Farm in 2020 and 2021.
We also sought to understand how seed color related to germination percentage specifically, so a corresponding figure was produced using data from the white-seeded families within each population. Within the white-seeded families, organically bred populations had higher germination in the 2020 organic environment as well as both 2021 environments, as described in Figure 2. In 2018 and the 2020 conventional environment the conventionally bred populations had higher germination. This suggests that white-seeded families from an organic background were performing better than their conventional counterparts, unlike the trends we saw in the populations overall.
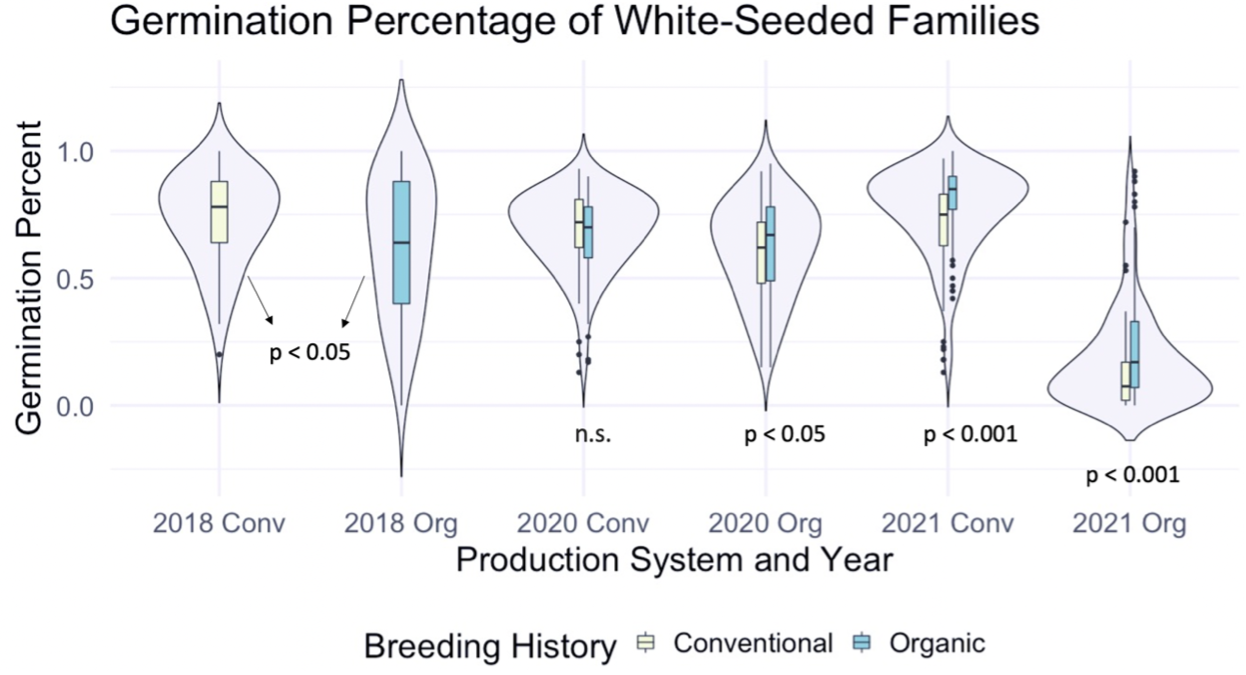
Figure 2: Germination percentage of white-seeded families from all populations within various treatments, collected from the F6-F8 generations of snap bean populations grown in conventional and organic production systems at the OSU Vegetable Research Farm in 2020 and 2021.
We compared the days to germination for the same data within all families of all populations and the white-seeded families alone. For both, a significantly faster rate of germination was observed in organic populations, at the p<0.001 level. In terms of scale, the difference between the white-seeded families of varying breeding histories was twice as large as the difference between all families of the same breeding histories. This comparison can be seen between Figure 3 and Figure 4.
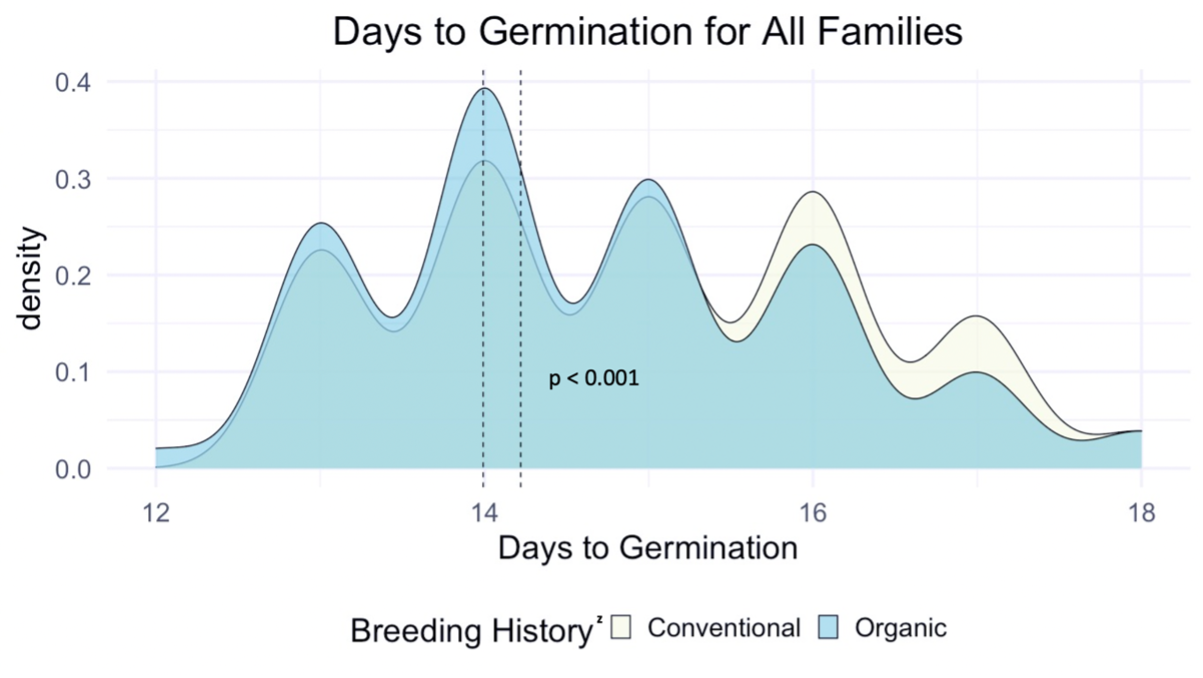
z For each breeding history group, mean days to germination for each population is represented by a dotted vertical line. Color is shown according to breeding history, or as a blended color where the density values overlap.
Figure 3: Days to germination of all families from all populations within various treatments, collected from the F6-F8 generations of snap bean populations grown in conventional and organic production systems at the OSU Vegetable Research Farm.
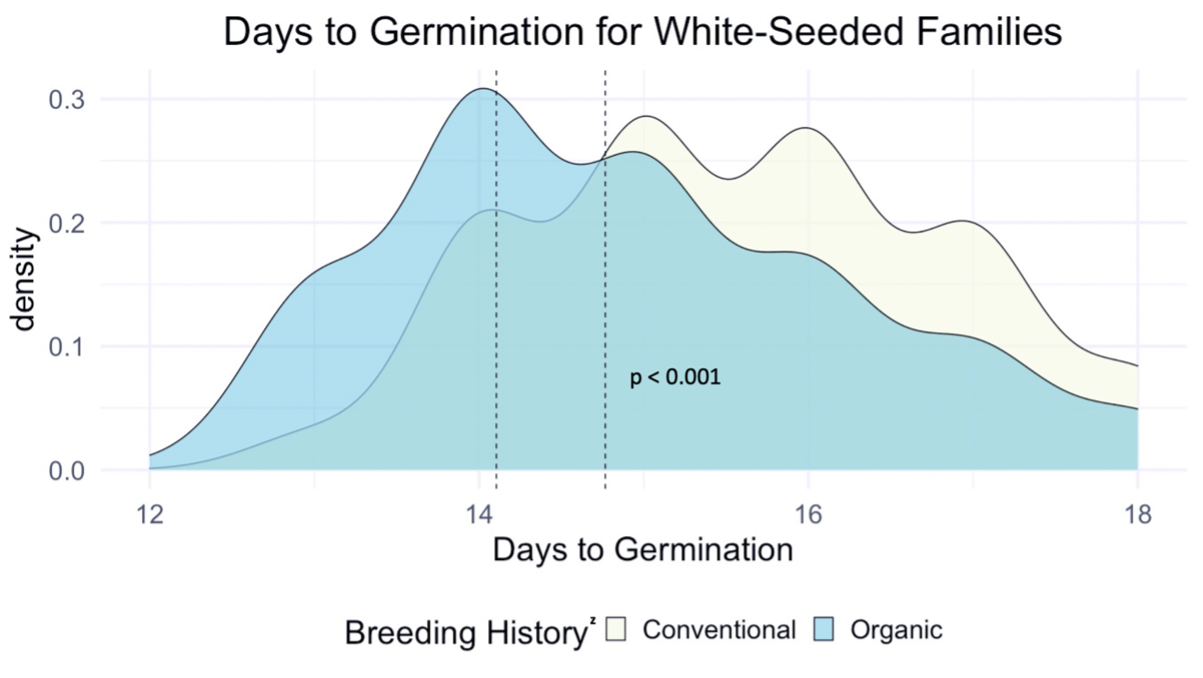
z For each breeding history group, mean days to germination for each population is represented by a dotted vertical line. Color is shown according to breeding history, or as a blended color where the density values overlap.
Figure 4: Days to germination of white-seeded families from all populations within various treatments, collected from the F6-F8 generations of snap bean populations grown in conventional and organic production systems at the OSU Vegetable Research Farm.
This reduction in days to germination was observed within organically bred, white-seeded families suggests possible adaptation to reduce the risk of pathogen exposure during pre-emergence. Heritability estimates for these traits, shown in Table 3, indicate moderate potential for pursuing improvement of these traits via plant breeding.
Table 3: Narrow-sense heritability estimates (h2±SE) for early-season performance traits in the F7 and F8 generations of snap bean populations, derived from ANOVA tables generated from data collected on replicated trials, separated by production system.
|
Population |
Production System |
Days to Germination |
Germination Percentage |
Vigor |
|
ORBV-O |
Conventional |
0.33±0.05 |
0.21±0.05 |
0.30±0.05 |
|
ORBV-C |
Conventional |
0.15±0.05 |
0.12±0.05 |
0.32±0.05 |
|
HYPR-O |
Conventional |
0.16±0.05 |
0.14±0.05 |
0.28±0.05 |
|
HYPR-C |
Conventional |
0.21±0.05 |
0.38±0.05 |
0.30±0.05 |
|
ORBV-O |
Organic |
0.28±0.05 |
0.16±0.05 |
0.20±0.05 |
|
ORBV-C |
Organic |
0.21±0.05 |
0.18±0.05 |
0.24±0.05 |
|
HYPR-O |
Organic |
0.26±0.05 |
0.23±0.05 |
0.26±0.05 |
|
HYPR-C |
Organic |
0.33±0.05 |
0.34±0.05 |
0.33±0.05 |
Using the improved linkage maps, QTL were identified related to early season performance traits within each of the four populations.
In the ORBV-O population many QTL related to early season performance were identified on chromosomes 7 and 8. Four QTL were identified in the ORBV-C population related to early season performance.
In the HYPR-O population, QTL associated with days to germination were identified on Pv02 and Pv08. These were observed across multiple years in the organic production system. The additive effect for each of these was negative, indicative of faster germination when an allele of Provider is substituted for Hystyle. QTL related to germination percentage and vigor were also identified on Pv02 and Pv08, as well as on Pv10. These had predominantly positive additive effects, indicative of higher germination and vigor when an allele of Provider is substituted for Hystyle.
In the HYPR-C population, QTL related to days to germination were identified on linkage groups Pv01, Pv02, Pv07, Pv08, Pv10, and Pv11. QTL identified on Pv01, Pv02, Pv07, and Pv11 had positive additive effects, indicating longer days to germination associated with an allele of Provider substituted for that of Hystyle. These trends were observed across multiple years and production systems. QTL associated with germination percentage and vigor were located primarily on linkage groups Pv02, 08, and 10, and had positive additive effects across years and production systems.
Objective 2:
Our second objective was to quantify differences in functionality of plant-rhizobia interactions within and between populations with comparisons made to the breeding histories of each population.
To achieve this, we explored root architecture in a field environment, followed by greenhouse studies. Our work revealed notable changes across production systems, indicative of altered resource-seeking behaviors between the two environments. Notably, the roots within the organic productions system had shallower taproot angles, and larger basal root diameters. These changes may be explained by plastic phenotypic responses to phosphorous availability, as well as an increased mycorrhizal dependency. Previous findings have indicated a reduced orientation, or shallower root angle associated with reduced phosphorous availability in the soil (Bonser et al., 1996). Further, thicker roots may have reduced water and nutrient uptake, but result in greater root longevity and increased mycorrhizal relationships (Eissenstat, 1992).
Contrary to expectations the organically bred populations had reduced nodule numbers in comparison with their conventional counterparts, however these observations do not account for variation in functionality of the nodules. Given evidence of loss of specificity in conventionally bred legumes, the higher number of nodules may actually be a factor of heightened promiscuity in nodulation as opposed to an increase in functional symbiotic relationships (Kiers et al., 2007).
Narrow-sense heritability estimates generated for the root morphological data were highly variable both across and within the two production environments. Most traits had negative or very low heritability, indicative of the predominant role of the soil environment in shaping root architecture.
Loss of specificity in root-associated nodules in the conventionally bred populations of snap beans is the predominant question remaining following our inquiry and analysis of root morphology.
Objective 3: Our third objective was to characterize the root microbiome within a subset of each of the four populations using 16S and ITS sequencing.
Sequence analysis of the 16s rRNA gene from rhizosphere soil samples provided evidence of a non-significant trend towards increases in within-group microbiome diversity tied to breeding history. Comparing between-group diversity, however, revealed significant shifts in the microbial community in samples from either organic or conventional breeding histories. These shifts are visually represented in Figure 5 and Figure 6.
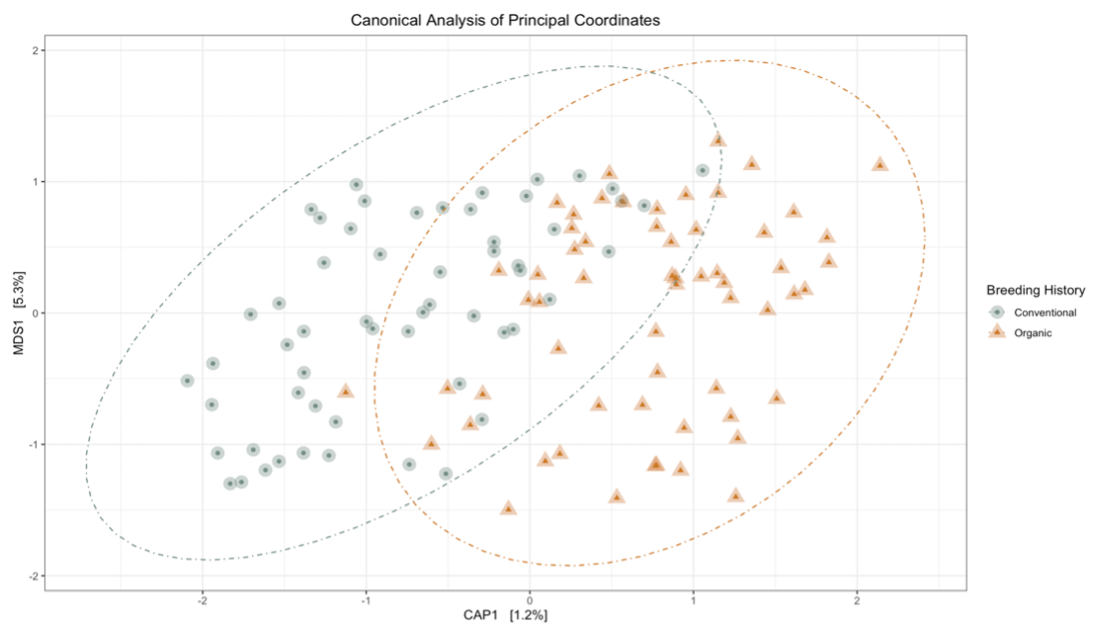
|
Df |
Sum of Squares |
F |
Pr(>F) |
|
|
Model |
1 |
0.440 |
1.356 |
0.011* |
|
Residuals |
115 |
37.282 |
Figure 5: Canonical analysis of principal components ordination of snap bean rhizosphere samples based on breeding history, generated from 16s sequences, with ANOVA of the model shown in the table.
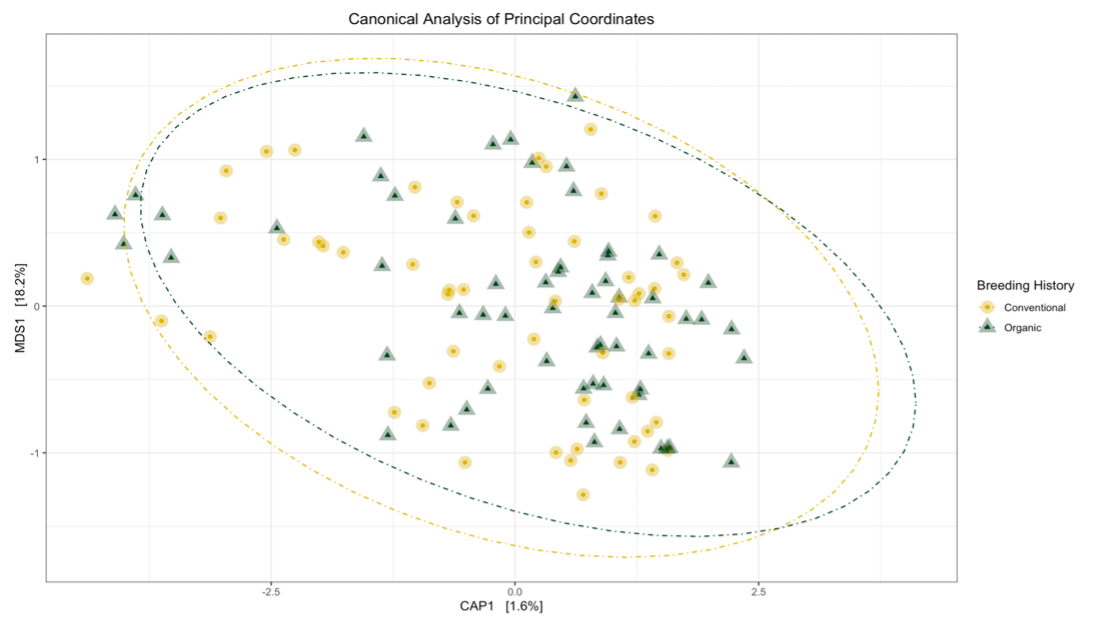
|
Df |
Sum of Squares |
F |
Pr(>F) |
|
|
Model |
1 |
0.2019 |
0.9681 |
0.452 |
|
Residuals |
115 |
23.9825 |
Figure 6: Canonical analysis of principal components ordination of snap bean rhizosphere samples based on breeding history, generated from ITS sequences, with ANOVA of the model shown in the table.
Exploring these significant relationships further, a sPLS-DA (sparse Partial Least Squares for Discriminant Analysis) model was tuned to fit the data described. Using the classification that was developed through this model tuning, it was possible to estimate the predicted ordination area for each class, shown in Figure 7 and Figure 8.
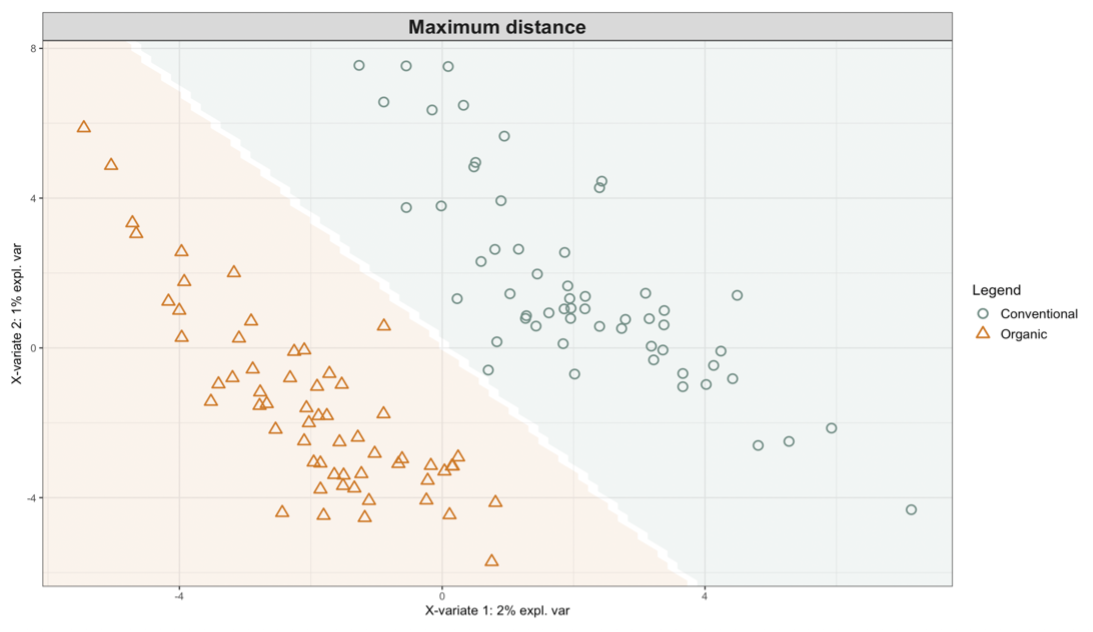
Figure 7: Background prediction areas shown with sample ordinations from snap beans of variable breeding histories, as calculated from maximum distance methods within the sPLS-DA for 16s data of rhizosphere bacteria in organically managed plots at the Lewis Brown Research Farm.
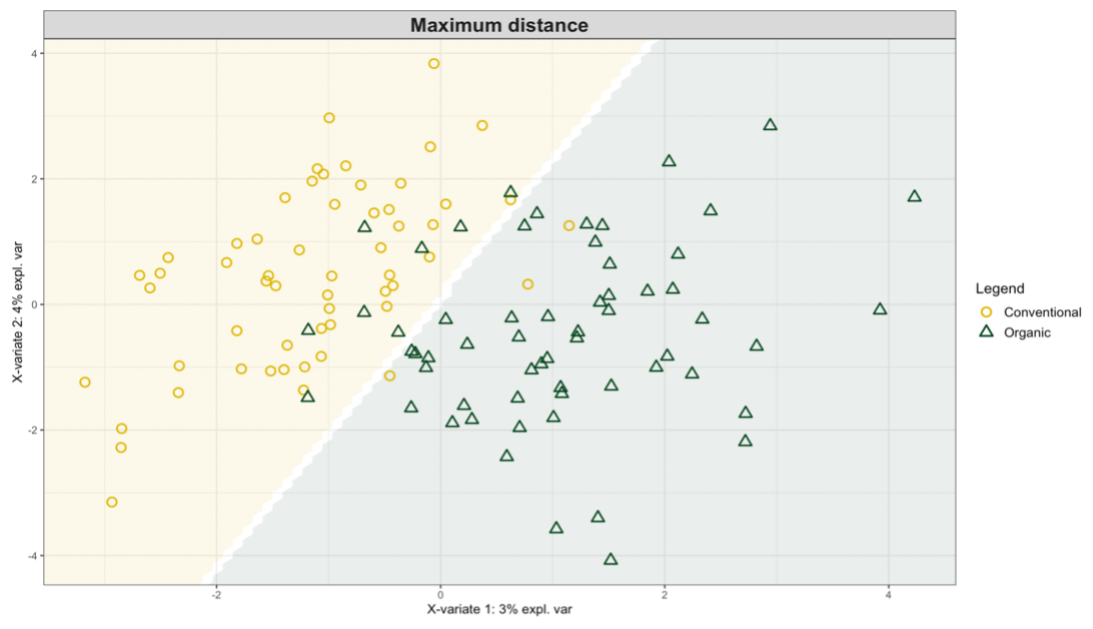
Figure 8: Background prediction areas shown with sample ordinations from snap beans of variable breeding histories, as calculated from maximum distance methods within the sPLS-DA for ITS data of rhizosphere fungi in organically managed plots at the Lewis Brown Research Farm.
From the ordination loadings it was possible to identify the sequence information for the taxa that were most responsible for shifts between each of the two classes in each data set. Changes in the mycobiome between groups revealed the communities to be significantly shifted by both breeding history and parentage. Both pathogenic and potentially beneficial fungi were identified in the rhizosphere communities of organically and conventionally bred beans. Among the beneficial taxa with increased abundance in the organically bred bean rhizospheres were an ectomycorrhizal species and an arbuscular mycorrhizal species. Although functionally quite different, both of these fungal symbionts are known to aid host plants in nutrient acquisition, disease resistance, and abiotic stress tolerance (Parniske, 2008; Lehmann et al., 2012; Hohmann & Messmer, 2017).
Objective 4: Our fourth objective was to utilize the existing four populations to develop a new snap bean variety in collaboration with a regional seed company and local vegetable farmers.
Using data from two field seasons at two locations (a university research farm and a collaborator’s farm), along with data from a taste test with 20 participants, we were able to identify 3 candidate lines for release. The attached Participatory Plant Breeding PowerPoint discusses that status and future steps of these lines.
Sources Cited:
Bonser, A. M., Lynch, J., & Snapp, S. (1996). Effect of phosphorus deficiency on growth angle of basal roots in Phaseolus vulgaris. New Phytologist, 132(2), 281–288. https://doi.org/10.1111/j.1469-8137.1996.tb01847.x
Eissenstat, D. M. (1992). Costs and benefits of constructing roots of small diameter. Journal of Plant Nutrition, 15(6–7), 763–782. https://doi.org/10.1080/01904169209364361
Hohmann, P., & Messmer, M. M. (2017). Breeding for mycorrhizal symbiosis: Focus on disease resistance. Euphytica, 213(5), 113. https://doi.org/10.1007/s10681-017-1900-x
Kiers, E. T., Hutton, M. G., & Denison, R. F. (2007). Human selection and the relaxation of legume defences against ineffective rhizobia. Proceedings of the Royal Society B: Biological Sciences, 274(1629), 3119–3126. https://doi.org/10.1098/rspb.2007.1187
King, R. M. (2019). Breeding Snap Beans for Organic Agriculture: Genomic Shifts under Different Agricultural Management Systems [Masters Thesis, Oregon State University]. https://ir.library.oregonstate.edu/concern/graduate_thesis_or_dissertations/kp78gn560
Lehmann, A., Barto, E. K., Powell, J. R., & Rillig, M. C. (2012). Mycorrhizal responsiveness trends in annual crop plants and their wild relatives—A meta-analysis on studies from 1981 to 2010. Plant and Soil, 355(1–2), 231–250. https://doi.org/10.1007/s11104-011-1095-1
Parniske, M. (2008). Arbuscular mycorrhiza: The mother of plant root endosymbioses. Nature Reviews Microbiology, 6(10), 763–775. https://doi.org/10.1038/nrmicro1987
Research outcomes
Our findings regarding shifts in early-season performance among white-seeded, organically-bred snap beans provides a compelling case for target-environment-based breeding initiatives. The goal of improving crops for organic environments is highly discussed, however an insufficient amount of breeding work is currently done within the organic environment. Hopefully this study, and others, will provide a science-based case for breeding organic varieties on organic ground.
Our work also provided substantial insight into the structure of snap bean rhizosphere microbiomes, and the relationship between community composition and crop breeding history. As work to develop resilient crop varieties for the future of sustainable agriculture continues, it is essential that an understanding of the plant microbiome is foundational to plant breeding initiatives. Future research will hopefully generate useable information regarding genetic markers that can be leveraged to influence the plant-associated microbiome in beneficial ways.
Education and Outreach
Participation summary:
Curricula, factsheets or educational tools:
- OMSI presentation (2 in-person events at the Oregon Museum of Science and Industry as of 7/23/2022)
- Snap bean hand pollinations video (356 views on Youtube as of 9/25/2023)
- 2 additional videos on snap bean cultivation and cooking are in progress
Published press articles, newsletters:
- Updated Oregon Vegetables website to include organic production is in progress
Webinars, talks and presentations:
- ASHS (American Society of Horticultural Science) presentation in Denver, CO in 2021
- BIC (Bean Improvement Cooperative) presentation at virtual conference in 2021
- Seminar to Horticulture Department at OSU in 2021
- Seminar to Plant Breeding and Genetics working group at OSU in 2022
- Seminar to Agricultural Microbiomes working group at OSU in 2022
- Breeding organic vegetable legumes panel at Organic Seed Alliance conference in 2022 (paired with stakeholder needs assessment)
Workshop / field days:
- Snap bean taste test, held remotely using "CSA" style tasting bags in 2021
Journal articles
- 1 journal article (Influence of Organic Plant Breeding on the Rhizosphere Microbiome of Common Bean (Phaseolus vulgaris); authors: Hayley E. Park, Lucas Nebert, Ryan M. King, Posy E. Busby, & James R. Myers) in review for a special issue of Frontiers in Plant Science on breeding for organic systems
- 2 journal articles planned/in progress
Consultations
- In-person visit to Territorial Seed Company in 2021 to gauge snap bean breeding work progress
- Winter 2021/2022 meeting with Territorial Seed Company to plan 2022 season
- Visit to Territorial Seed Company planned for 2022 to see final candidate lines in the field
- In 2023, Territorial trialed selections at their London Spring, OR site as well as on farm in New York state