Final report for GW22-234
Project Information
The Varroa mite is an ecto-parasite of honeybees which feeds on developing and adult bees, however, the devastating impact is the link between mites and the spread of a deadly RNA virus (Deformed Wing Virus). The combination of mites and Deformed Wing Virus has resulted in large-scale colony losses across the world. Exploratory research in Hawaii indicates that honeybees are developing Varroa-resistance. The traits that increase colony survivorship and reduce the success of this parasite represent a breakthrough in identifying “survivor” stock. Surviving colonies have specialized behaviors, including detection and removal of mite infested worker brood, this causes a reduction in mite reproductive output, leading to reduced mite populations (Grindrod and Martin, 2021). The behavior can be quantified via brood inspection, thus a numerical score of the behavior is obtained for each colony. This project contributed to the creation of a database on varroa-resistance of Oahu’s colonies that will help us understand how this process develops and will give the producers the ability to collaborate with researchers on topics that are interesting to both groups. Additionally, it examines the relationship between mite population levels inside of colonies practicing recapping behavior to assess whether they may be used by stakeholders as a proxy tool to identify resistant colonies. Learning how to best utilize natural elements of bee behavior, confirm that these colonies can survive without treatment for long periods of time, and examining how to manage field interventions to obtain the best possible result, are all exciting prospects that derive from the proposed survey of Oahu’s bees.
1- Determine the prevalence of Natural Varroa Resistance (NVR) behavior among the managed bees on Oahu, Hawaii
2- Test the heritability and viability of NVR through field experiments
3- Develop educational materials about resistant stock and examine how to manage local bee stock with the help of Oahu beekeepers
Cooperators
- - Producer
Research
Data Collection Techniques
- Collection of material for mite-resistance assays
To establish a recapping rate for the studied colonies, a single frame of worker brood comb was removed from each and taken to the lab to be frozen and later assessed. Frames were only selected for removal if they contained older brood (dark pink or purple eyes) to ensure that nurse bees have had a chance to perform their recapping behavior. Any bee pupae that are too young or those that have started to emerge were not included in the sampling.
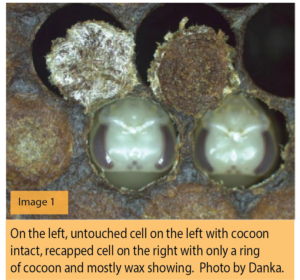
A total of 100 cells per colony were examined under a binocular scope. The procedure involved slicing the wax cover and flipping it to determine if the silk cocoon spun by the pupae remained intact or if the cocoon has been disrupted. If the shiny underside of the cap has been disturbed it means that the cell was opened by a nurse bee and subsequently recapped with wax (See Image 1).
Each bee pupa was removed from the cell, and mite presence and number of mites within the cell were recorded for each developing bee.
- Measurement of phoretic mite infestation rate
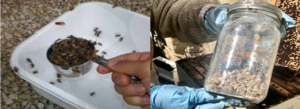
Phoretic mite levels were sampled from each colony using the “sugar shake” method monthly throughout 2023. This involved scooping ½ cup of nurse bees (200 bees) from the brood frames of the hive. Removing bees from brood frames ensured that most bees collected were nurse bees on which Varroa mites are most likely to be found during phoresis. Collected bees were placed in a mason jar and coated with powdered sugar. The sugar dislodges the mite from the body of the bee, allowing the mites to be sifted through a 1/8th inch mesh placed over the opening of the jar. Mites were shaken into a basin of water, separating mites from the sugar and allowing them to be counted. The total number of mites counted was then divided by 2, giving us a rate of phoretic mite infestation per 100 bees.
- Measurement of daily passive mite fall
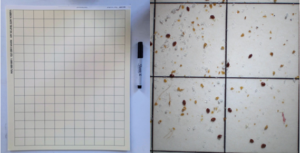
Daily passive mite fall was measured using sticky boards placed on the bottom board of each colony. Mites that fall due to death or honeybee grooming are caught on the board while a plastic mesh prevents bees from also becoming trapped on the board. Sticky boards were left in each colony for 3 days before being removed and taken to the lab for analysis. The total number of mites caught on the boards were then divided by 3, giving the daily passive mite fall for the colony.
1-Determine the prevalence of mite-resistant behavior among the managed bees on Oahu Hawaii
During this project we gathered data on brood infestation and recapping behavior on O’ahu’s colonies. We also confirmed via PCR that the bees sampled were of European ancestry. Although not previously included in the methods we decided to add this step because of two important reasons: 1-Africanized bees are not present in Hawaii and 2- Africanized bees have strong resistance to Varroa and high recapping rates, therefore it was critical to confirm that the bee stock we were working with was of pure European ancestry and that the observed resistance was not the result of hybridization. Our molecular tests of mitochondrial DNA showed all the bees sampled came from a European ancestry queen.
The team, including Dr. Martin, is considering working on review that focuses on a historical perspective of the Bee-Varroa-Virus interactions that have occurred in Hawaii, and the data collected during this project will play a large role in that effort.
Results:
Resistance and mite levels
In 2022-2023 we collected and examined brood samples from beekeepers across O’ahu and found that Varroa resistance was present on the island. We surveyed a total of 36 colonies from 14 apiaries on Oahu belonging to 11 beekeepers. These consisted of a mix of non- treated and treated colonies. The average mite infestation level of the worker brood was 3% reflecting that nine colonies were recently treated, but when the treated colonies were excluded the infestation rate only increased to 4%. Despite that nine colonies been recently treated had average recapping level was 49% well above 40% that indicates resistance and indicated that 72% of the colonies surveyed were mite resistant. When the data of recapping in infested and non-infested cells from this study was compared with that from other recent studies the data strongly suggested that mite-resistance is widespread on O’ahu. We subsequently sent individualized reports to the beekeepers. More recently, we added 10 more colonies to our totals, these new colonies also showed high levels of recapping and on average a low brood infestation rate. One of the apiaries sampled belongs to the new collaborator (Tadd R.) and his bees had zero mites in the brood and an average recapping rate of 70.7%, with one colony scoring 87.2%. This beekeeper was, and still is, very interested in rearing resistant queens for export. The other colonies sampled belong to UH, the average mite infestation level in worker brood was 5.76% and the average recapping rate for those colonies was 72.57%. Among those colonies the lowest recapping rate was 43.66% and it was associated with a colony that had no mites in the brood.
We plan to continue gathering data on the levels of brood infestation and recapping for individual colonies at the Waimanalo apiary. We also plan to sample more apiaries on O’ahu and expand to Big Island, where queen breeder stock is commonly used by small-scale beekeepers. We are however, very encouraged by the low level of brood infestation across O’ahu’s colonies, even when compared to well established resistant populations such as the ones in Cuba.
In addition to levels of recapping and brood infestation, we have also collected data on mite-reproduction. The bee pupa in each cell examined is carefully removed and the number of adult female mites in reported along with the presence or absence of mite offspring. We will use this data, along with the age of the bee pupa, to estimate how many daughters could be produced from each mite that was not removed. Looking into the reproductive ability of the mite will help us understand the effect of hygienic behavior on mite populations.
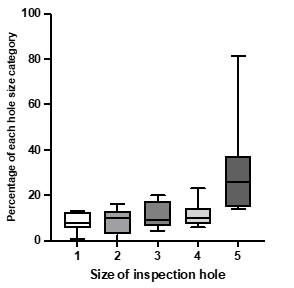
Nurse bees make inspection holes of variable sizes on the cell caps. During our examination of worker brood on O’ahu we recorded the size of the recapping hole for each cell since it could be linked to presence or absence of the mite inside the cell.
There are significant differences in frequency between different size categories of inspection holes in the Waimanalo colonies (ANOVA, p<0.02). The larger holes (size 5) seemed to be more commonly found in these colonies even when no mites were present in the cell.
We will be summarizing and analyzing the data to compare this behavior with that of other resistant populations, in particular the honeybees from Cuba. Preliminary data suggests that some colonies on Oahu tend to create very large holes when inspecting the cells even when the cells have no mites in them (see graph of 7 colonies from the latest Waimanalo recapping data). Analysis of all the data still pending, but here we present a snapshot summary.
Phoretic mites:
The threshold for mite treatments in Hawaii has always been different than the mainland, where mite populations are somewhat regulated by seasonal bee brood availability. Hawaii’s subtropical climate, which allows bees to continue to produce brood year-round presents a challenge for Varroa control. When the mite first arrived and the DWV levels increased producers were treating at least 3 times a year to keep the colonies alive, while the mainland beekeepers had a winter period where treatments were not needed.
Even to this day, the phoretic mite levels that are considered borderline acceptable for the mainland colonies are too difficult to maintain in our environment. The queen breeders in Hawaii must treat aggressively against the mite to be able to pass the health screening for export permits. Given that mite treatments represent an additional expense, but also most have deleterious impacts on the bees, it is important for beekeepers that do not have to adhere to the queen exportation standards to explore what are reasonable thresholds for Hawaii’s honeybee colonies.
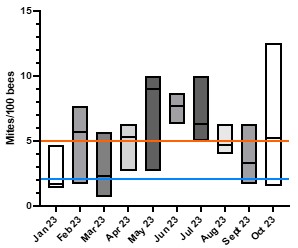
The monthly phoretic mite data collected at the Research Apiary in Waimanalo in 2023 confirm that, as suspected, colonies in Hawaii generally have higher mite levels than the recommended mainland thresholds for treatment. The mainland US recommended thresholds are to treat if the colony has more than 2 mites/100 bees in the fall (blue line on graph), or 3 to 5 mites/100 bees (orange line on graph) for those that are conservative on when to treat. These threshold levels are unrealistically low for treatment- free colonies and even for some treated colonies in Hawaii.
Our monthly phoretic mite counts in Waimanalo were taken using “sugar-shakes”, a technique that is slightly less accurate than alcohol washes but preferred by many local beekeepers. The average mite levels per colony up to the writing of this report was 4.98 mites/100 bees and 7/8 colonies sampled experienced at least one period in which the mite levels were over 5% during the study. During May, June, and July, phoretic mite levels were higher, with an average of 7.29 mites/100 bees. Based on the most recent data it also appears that the fall levels might be increasing, but we need to wait for more data to complete an annual cycle. So far, there is no statistical difference between the monthly phoretic mite levels at this site (Kruskal-Wallis test, p>0.05). The lack of significant differences between the months is in great part due to the high variability, both inter and intra-colony, with respect to infestation levels.
The fact that in the same month one colony can have low mite numbers while another one has high, only to have that situation reverse itself the next month suggests that in the spring and summer, the number of phoretic mites is more likely to reflect internal colony conditions, such as queen laying strength and amount of brood of the right age at the time of sampling, rather than conforming to external seasonal factors. In the late fall and winter, we know that brood levels are reduced in Hawaii’s colonies, and we anticipate that the variability in mite levels between colonies may be reduced.
The average phoretic mite levels recorded in Waimanalo were not unique to our apiary. The average phoretic mite level in Dennis’ apiary was 4.46 mites/100 bees, suggesting these levels are representative of resistant colonies on O’ahu in 2022-2023. It is also important to note that when we compare the Oahu mite levels to those of Big Island colonies kept under various kinds of treatments, we notice that although the average mite level of the 5 apiaries sampled was lower, 3.50 %, there was still ample variation in infestation among the sites, ranging from 0.66 to 6.2%, possibly due to the time that had passed since the last treatment. Some colonies among the Big Island apiaries had averages up to 15.5 mites/100 bees, which indicates mite populations are still a concern.
If we were to use mainland thresholds of mite infestation as the standard for bee management on O’ahu, we would find ourselves treating for mites as frequently as we did when Varroa and DWV became established. What has changed over time is still unclear and our data brings forth a lot of questions and potential avenues for future research:
1- According to the mainland recommendations, the levels of Varroa infestation we observed should result in the decline and death of untreated colonies within 2 to 3 years. The colonies at the UH apiary, however, are not declining, they are producing honey, and have not been treated for about 3 years. The ones from our collaborator Dennis Takata, have not been treated in over 5 years. So, how can colonies that survive without treatment for years have mite levels higher than the limits recommended for the rest of the US? The answer for some of these questions are not black and white. It is possible that the mite fertility in Hawaii is lower (as it has been shown for areas with resistant honeybees) and the detailed information gathered during brood inspection will contribute valuable information towards our understanding of this aspect of resistance.
2-Given the observed high recapping levels, which signal that there is mite resistance on this island, one might expect an average lower phoretic mite infestation. The Hawaiian honeybees have on average a high recapping rate and they also are highly efficient at detecting and removing mites, however, the bees in Hawaii have been exposed to the mites for a relatively short time compared to Europe or the mainland US. Research conducted on other parts of the world has shown that levels of mite infestation in bee brood, and the associated phoretic mite levels, gradually decrease as the resistant behavior on the colonies becomes stronger over successive generations of bees, so we would expect that the mite levels in Hawaii’s resistant colonies will continue to go down over time. Long term data collection will help us piece together this change.
3-Is there another way that beekeepers could use to estimate Varroa mite levels and use their colony selection process? Examining worker brood infestation is too time consuming to make it the standard, so is it possible to use the passive mite fall as a proxy to understand mite levels dynamics and resistance?
Passive mite fall levels.
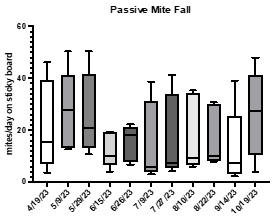
Sampling mite-fall levels is an old technique in Varroa research. The use of a sticky board (under a screen) on the hive floor was very attractive to beekeepers in Hawaii when the mite first arrived. The technique is non-invasive, and bees are not killed during sampling. We used this method intensively when testing some of the first organic mite treatments on O’ahu in 2010 so we are deeply familiar with the procedure, and we understand the limitations of this method. Interpreting the results can be tricky because it can be affected by the location, quantity, and age of the brood during the sampling period and the bees can sometimes attempt to remove the cardboard and thus removing the mites as well. Nevertheless, it does help beekeepers visualize the internal condition of the hive.
The data collected so far indicates that the summer months have a low mite fall, to be expected as many mites are reproducing inside cells. We expect to see an increase in mite fall as the brood quantity decreases in winter and mites are found more on adult bees. As with phoretic mites, the variability between colonies is very large and possibly reflects colony cycles of brood production.
What is the relationship, if any, between brood recapping, phoretic mite levels, and passive mite fall?
The project started to gather comparative information on how brood infestation, recapping, phoretic mites, and passive mite fall may interact. This holistic approach will help with the characterization and selection of breeder stock in future studies. The data suggest that these indices may in fact reflect in-hive dynamics of bees and Varroa populations, and that by using multiple tools it is possible to understand more clearly the variation in Varroa infestation.
2- Test the hereditability and viability of mite-resistance through field experiments
The project encountered multiple field related difficulties when attempting to study of hereditability of the mite-resistant behavior. One of the major problems was climatic events, and these unforeseen issues affected both NM and HI. There were problems with forest fires at the NM site, and Melanie Kirby had to move hives and the situation affected her queen operation. On our side we also encountered problems related to drought, and although the colonies survived reasonably well, they required supplemental feeding. We attempted to promote cell building in the strongest colonies at our apiary but failed and only a few colonies grew large enough to attempt to split them to attempt to conduct successful queen rearing experiments. The prolonged drought affected not only Oahu, but all of Hawaii. Casual conversations with hobbyist beekeepers and the owner of large companies confirmed the trend. The largest honey producer on the Big Island, recently mentioned that he has not gotten a decent honey harvest of Macadamia honey, his biggest honey source, in the last 2 years.
The queen producer that was expected to collaborate on Oahu, had difficulties with his business partner and decided to not participate. This problem was resolved with the addition of another beekeeper collaborator who owns over 300 colonies and who is willing to participate in queen selection experiments (Tadd R.). This beekeeper has highly resistant bees based on our assessments, but unfortunately with the drought we could not proceed. Finally, our long-time collaborator Dennis Takata, was forced to relocate his apiary because of issues with the landowner. This resulted in Dennis having to move most of his bees to various locations and sell some of his colonies at the time we were hoping to do some work at this site. One final blow to our queen rearing efforts is that Dennis never feeds his colonies which this time resulted in considerable colony losses towards the end of 2022 and early 2023.
Nevertheless, Dr. Martin and Dr. Villalobos tested naïve queens from Kauai and conducted a “queen swap” study which was submitted to Apidologie and is currently in review. That study is a comparative field trial (HI vs UK) and clearly supports the idea of a genetic link to resistant behavior. WSARE is acknowledged in the article. Kevin, however, was not included in that work as an author as he was just learning the ropes during that field season. We had hoped to continue with the work and have Kevin take on a larger role, but the multiple problems encountered hindered our plans. Nevertheless, Kevin is now taking the lead with the information we have collected during this project and has been gathering more data to complement past and future work.
Research outcomes
Because we had such unfavorable conditions for queen rearing, we decided to address the issue in two ways: 1-We work from the perspective of queen longevity and follow the survivorship of colonies at the Waimanalo Research Apiary. We visit the hives frequently enough to know when a queen is replaced. Natural queen replacement, although not the same a queen selection, will allow us to track the performance of individual colonies as their queens age and are subsequently replaced. This type of study takes more time, but we are confident we will get interesting data from it. 2- To gather longitudinal data on colonies that can be used in the characterization of mite resistance performance. Characterizing a colony with respect to behavioral traits is difficult due to natural intra and inter colony variation. Colony performance in almost any “task” varies depending on the colony health condition, the abundance of floral resources, which may “distract” workers from certain tasks, the time of the year, and the paternal genetic mixture of the worker brood when a colony is sampled. A colony that performs well on a task, including hygienic behavior in one sampling period, may change suddenly when sampled again. And although it is best to have multiple readings for each colony, longitudinal studies are extremely rare. For this reason, our assessments of varroa resistance, are based on an apiary level valuation, including multiple colonies for each site to categorize the apiary, and accept that there will be a few “deviant” points at each site.
Beekeepers, however, want to know how each colony is doing and tend to place “good” or “bad” labels on individual colonies based on a single reading, which may not be ideal for stock selection. Partially to respond to that extension need we decided to focus on gathering data on individual colonies over time and examine how 2 different mite sampling strategies may correspond to the observed Varroa resistance. In addition, because recapping is not a “beekeeper friendly” technique but rather more of a research tool, we collected data on mite levels (using phoretic mite samples and passive mite-fall) which are easy sampling tools that beekeepers already know how to employ.
In hindsight, although very disappointed that we could not produce/test queens as expected, we feel that we learned a lot of useful information, and we know how to improve future queen assessments and mite infestation surveillance. The longitudinal study of colony performance we have begun in this project is continuing post-grant period and will constitute a much-needed reference point to proceed with queen selection when the climate allows us to continue the queen swap trials. We expect to continue working through our winter and Dr. Martin and another colleague from the UK, Dr. Brettell, will be here in the Spring of 2024.
Education and Outreach
Participation summary:
Informal and formal presentations
The team has been making informal and formal presentations about our work throughout the course of the project and we have succeeded in reaching a large segment of the beekeeping community on O’ahu. In addition, we have participated on online meetings with mainland beekeepers and queen breeders and attended and presented at one of the largest beekeeping meetings in the world (APIMONDIA). Dr. Martin has also been conducting a series of lectures across Europe, and Hawaii’s data has been used in these discussions and presentations.
Educational materials
We have developed and shared preliminary versions of the handouts with beekeepers and are now working on refining the handouts and the educational booklet. The educational booklet (16 pages) will be posted online and printed for distribution at local gatherings once we have received beekeeper feedback. The draft version is included with the report. We are really interested in what the beekeepers and some scientist collaborators have to say about the booklet, and we decided to wait until we get comments on some sections.
The materials produced have original artwork which are used in the diagrams and will be incorporated in pptx and video presentations. We include information based on data collected in Hawaii, and the educational materials are designed to be easy to read but not oversimplified. An additional list of technical references will be posted on our website to be available for those who want to go more in depth on these topics.
We have filmed and partially edited live footage of beekeeping and sampling activities. We are currently working on the diagrams and animation. We hope to have a short video ready by early next year. In the meantime, we will offer links to Dr. Martin talks to European beekeepers which are online in YouTube.
Local presentations:
November 19th, 2022
- Presentation by Dr. Stephen Martin to 30 beekeepers from across O’ahu at UH
- Presented on mite biology, Varroa resistance, early results from O’ahu, project goals etc
- Solicited producers to participate in sampling efforts
November 22nd – December 2nd, 2022
- Field visits with 9 producers across 13 apiaries
- Information on Varroa resistance, mite biology, transferred “organically” while sampling.
January 21st, 2023
- Ken Hertmeyer meeting, ~15 beekeepers present
- Brief project update, some initial results from sampling discussed.
March 19th, 2023
- Ken meeting, ~13 beekeepers present
- Recapping results from November sampling distributed to some participating beekeepers.
- Initial Varroa treatment survey distributed.
March 27th, 2023
- CTAHR Symposium
- Presented on NVR and results so far to ~15 students/faculty of UH
April 26th, 2023
- Meeting with HISC members, ~18 people
- Presented on mite biology and the development of NVR, the role of genetic isolation in its development and the importance of biosecurity etc.
April 29th, 2023
- Katie - beekeeper meeting, Invited presentation for local beekeeper audience (15 participants)
- Presented on mite biology and Varroa resistance.
May 18th, 2023
- Ken – beekeeper meeting, 20 attendees. Discussed swarm capture and bee genetics.
Sept 22th, 2023
Thesis proposal defense, UH
20 in person but meeting streamed online.
Other Presentations:
Sept 8th, 2023
48th APIMONDIA congress – held in Santiago, Chile
International meeting, presented on Varroa Resistance in Hawaii (PPTX link included)
