Final report for GW23-249
Project Information
Regenerative agricultural practices in almond orchards include recycling resources, improving soil health, protecting pollinators, improving harvest practices, and minimizing synthetic fertilizer inputs. The complexity of perennial crops requires specific strategies to manage different zones in almond orchards where tree rows are fertigated and irrigated in addition to alleyways which are utilized for growing companion crops or cover crops. Conventional almond orchards typically leave the orchard floor bare and there is a need to use organic matter amendments (OMA) including hulls and shells (HS) as a mulch to protect the soil without compromising profits. Nutshell amendments have been shown to influence soil physical, chemical, and biological properties in almond orchards. Planting cover crops (CC) also has benefits in almond orchards specifically in improving soil quality, nutrient and water preservation, reduced soil erosion risks and weed suppression. Project outcomes addressed soil physical, chemical, and biological properties with HS and CC interactions. Nutrient cycling and decomposition of both practices were analyzed in the first and second years. Field day workshops and demonstrations, articles written on the UCANR Sacramento Valley website, and 4-H college readiness events disseminated information to stakeholders and offered engagement with community members.
Soil Health Objective: Measured soil physical, chemical, and biological properties under HS OMA. Analyzed short term effects of HS OMA on CC biomass and nutrient status in the soil. Cover crop aboveground biomass sampling measured carbon impacts on the soil and nitrogen uptake that assisted in understanding the relationship between HS OMA and CC.
Educational Objective: Provided informed data to all stakeholders and members of the industry that include media presentations, conference presentations, and on site field days. Presented research findings at UC Davis and with 4-H high school students interested in studying agricultural science in college. Collected data from grower and farm manager surveys to assess current and potential practices using HS OMA and CC.
Cooperators
- (Researcher)
- - Producer (Researcher)
- (Researcher)
Research
1.1 Research methods and analyses
Soil health objectives included measuring soil physical, chemical, and biological properties under HS OMA. The next objective assessed the short term effects of HS OMA on CC biomass and nutrient status in the soil. Cover crop aboveground biomass sampling measured carbon impacts on the soil and nitrogen uptake that assisted in understanding the relationship between HS OMA and CC.
Objectives were studied using a randomized complete block design at an almond orchard (Westwind Farms) in Woodland, CA with San Ysidro loam soil. The field study site is a total of 10 acres of the cultivar Nonpareil, with 30 tree rows by 40 trees. There are four treatments four each of the four blocks. Three treatments were used to compare to a control of standard best management practices (HS CC Map_Woodland):
Treatment 1: no amendment, on-ground harvest
Treatment 2: no amendment, cover crop, catch-frame harvest
Treatment 3: 8 tons/ac hull and shell amendment, on-ground harvest
Treatment 4: 8 tons/ac hull and shell amendment, catch-frame harvest
The main treatments used were HS OMA broadcast spread from in tree row and alleyway with on-ground harvest (Treatment 3), CC planted in the alley (Treatment 2), and HS OMA broadcast spread with catch-frame harvest (Treatment 4). Tree rows were defined as spacing between trees down the same row. The alleyway was defined as spacing across tree rows also known as row widths. The trees planted at Westwind Farms measured 15 inches by 22 inches and the CC were planted within 10 feet of the center alleyway. The CC mix was made up of 60% peas (spring forage), 35% oats, and 5% black mustard (brassica juncea). Grass species have important benefits in soil physical properties that include reduced bulk density, increased water infiltration, and dry aggregates in addition to their capacity to prevent soil erosion. Legume species are able to form symbiotic relationships with bacteria in root nodules to fix atmospheric N that is beneficial to building soil N to supply it to other crops. Non-leguminous broadleaf species are an important source of food for insect pollinators and their ability to rapidly decompose increases plant residue and microbial diversity (Koudahe, Allen, & Djaman, 2022).
HS OMA was applied in October 2022 and has been applied at this site for the past three years. Resident vegetation has grown in the alleyway at this site, but this was the first year of seeding a CC and analyzing potential interactions from HS OMA and CC. Potential benefits of mulches and CC include reducing soil compaction and soil temperature which is beneficial to overall crop growth (Iqbal, Raza, & Valipour, 2020; Mennan & Ngouajio, 2012).
Soil sampling and analysis occurred before HS OMA application in Fall 2022, prior to cover crop seeding and during cover crop growth in 2023. Soil samples at 0-10 cm depth were taken in the Fall (October 2022) and in the Spring (May 2023) and analyzed via a full soil fertility panel that included total organic carbon (TOC) and total nitrogen (TN) at the UC Davis Analytical Lab in the Department of Plant Sciences. One set of samples were taken in Fall 2022 before HS OMA and before CC termination in Spring 2023. Three subsamples were taken for each treatment row, dried, and ground separately in a soil pulverizer. Each of the three subsamples per treatment row from 0-10 cm depth were combined for analysis. Bulk density and aggregate stability soil samples were collected at the same time point in Fall 2022 to measure for soil physical properties under historical HS OMA application. Bulk density measurements were taken using a 8.3 cm wide by 6 cm tall metal ring and mallet with soils being air dried, weighed and expressed as g cm-3. The same metal ring and mallet were used to take samples for aggregate stability and mineral associated organic matter/particulate organic matter (MOAM/POM) to look for potential changes in these two distinct pools of organic matter. Three samples were taken within the sprinkler zone from the control, treatment 3, and treatment 4 in all four blocks, totaling 36 soil samples. In Fall 2022 and May 2023, 36 samples were taken at these same locations, from the top 0-10 cm of soil, placed in Ziplock plastic bags, packaged on dry ice, and sent to Ward Laboratories (Kearney, NE) for phospholipid fatty acid (PLFA) analysis to identify microbial coarse functional groups. The costs for shipping and analyses were funded from other resources by Dr. Khalsa and Dr. Brown to complete all research objectives.
All data analyses were performed using R statistical software. Soil analyses were performed using ANOVA and Tukey’s HSD (honestly significant difference) in R. Combined soil data and evaluation of directional shifts of microbial community composition as environmentally constrained by fertility and physical variables were analyzed using Canonical Correspondence Analysis (CCA) with assistance from Dr. Gaudin. Multivariate statistical analysis were performed in the R statistical environment that evaluated patterns in composition and abundance of microbial taxa.
HS OMA nutrients were analyzed in Fall 2022 for nutrients including carbon, nitrogen, and potassium. HS were oven dried, ground, and sent to the UC Davis Analytical lab for analysis. Long term decomposition of the HS were studied by stapling 3 mm nylon mesh layer squares 1 m-2 in diameter (Memphis Net & Twine) into the tree rows using the cohort layered screen technique to compare control and amended rows with HS OMA and CC. The mesh layers were installed in Fall 2022 and placed on top of previous Fall 2021 mesh layers. Subsamples were collected, weighed, and oven dried to assess HS OMA decay. Litter bags with dimensions of 20 by 20 cm in diameter made of mesh nylon with material size 0.79 mm were filled with approximately 95 grams of oven dried HS. These litter bags were installed in Fall 2022 in the alleyway on the soil surface to measure decomposition of amendments by mass loss over time in Treatment 3 and 4 tree rows. In Spring 2023, contents in the litter bags were analyzed for nutrients before CC termination.
In Fall 2022, CC seed mix were planted using a no-till seed drill at the recommended rate from Kamprath Seeds at 100 lb/acre in a 10-foot strip in the alleyway. Prior to CC termination in Spring 2023, aboveground CC biomass were collected and separated by species by placing one random 0.76 m-2 quadrat (Florence, Higley, Drijber, Francis, & Lindquist, 2019) in each treatment row. Samples were dried at 60 °C until a stable weight has been reached. Samples were ground using a Thomas Model 4 Wiley Mill with a 1 mm sieve. Subsamples of 30 g were taken and submitted to the UC Davis Analytical Lab for nutrient analysis including carbon and nitrogen.
2.1 Results
Soil health indicators
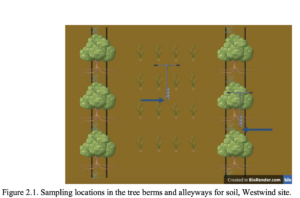
Prior to Fall amendment application, baseline soil samples were collected on 9/13/22 from all treatments in all four blocks at depths of 0-10 cm, 10-20 cm, and 20-30 cm within a 24-inch circumference of the tree base (approximately halfway between the micro-sprinkler and the base of the tree) in the tree rows (Figure 2.1). Soil samples were measured for baseline soil fertility status by inductively coupled plasma atomic emission spectrometry (ICP-AES) that included: nitrate-nitrogen (nitrate-N), Olsen phosphorus (Olsen-P), exchangeable potassium (XK), exchangeable sodium (XNa), exchangeable calcium (XCa), exchangeable magnesium (XMg), cation exchange capacity (CEC), SOM percent by the Walkley-Black Method, and pH by saturated paste extract (UC Davis Analytical Lab, 2024). Three subsamples were taken from each treatment row for each depth, air-dried, and aggregated for each experimental unit prior to submitting for analysis at the University of California, Davis Analytical Lab.
Soil samples for bulk density, aggregate stability, particulate organic matter (POM), and mineral associated organic matter (MAOM) measurements were collected on 9/13/22 and sampled in the control, AHS on-ground, and AHS off-ground treatments. All soil samples were collected using an 8.3 cm diameter by 6 cm tall metal ring and mallet and soil were air dried. Soil wet aggregate stability was measured with an automatic soil sieve with an overhead rainfall simulator (Fritsch Analysette 3 Vibratory Sieve Shaker) (Kemper, 1965). All aggregate stability samples were prepared by passing through an 8 mm mesh sieve and then prepared further by separating into 30-gram subsamples. Each subsample was evenly spread across a stack of three mesh sieves beginning with the largest to the smallest sieve size 1) >2 mm (large macroaggregates) 2) 250 µm (small macroaggregates) 3) >53 µm (microaggregates) 4) <53 µm (small microaggregates) (Six et al., 2000). Each sieve was removed after the water ran clear (~15-30 seconds) and the remaining soil aggregates on the sieve were gently sprayed with deionized water from a wash bottle to capture all small aggregates into labeled aluminum disposable loaf pans of size 8.5 by 4.5 inches. All samples in pans were placed into a 60 ℃ oven for one to two weeks or until weights stabilized.
Soil organic matter fractions (POM and MAOM) were weighed to 10 grams. Each 10-gram subsample was put into falcon tubes with 30 ml of 5% sodium hexametaphosphate and five, 4 mm glass beads, and put on an oscillating shaker for 18 hours. After shaking, the soil slurry samples were placed on a stack of mesh sieves beginning with the larger size >53 µm (POM) and then following the smaller size <53 µm (MAOM) with an overhead rainfall simulator (Fritsch Analysette 3 Vibratory Sieve Shaker) and shaken until the water ran clear (~ 30 seconds). All samples were placed into a 60 ℃ oven for one to two weeks or until weights stabilized (Jilling et al., 2020; Midwood et al., 2021). Floating debris and AHS pieces were removed before placing the samples into the oven. Aggregate stability, POM, and MAOM samples were transferred from loaf pans and encapsulated into tin capsules for total C and N analysis via combustion method at the University of California, Davis Stable Isotope Laboratory. Mean weight diameter (MWD) was calculated by averaging the sum of the products of aggregate fractions and the mean diameter of each aggregate sieve, excluding floating material, to determine the stability of soil aggregates in the three treatments sampled.
Soil microbial analysis for coarse functional group community composition analyzed via phospholipid fatty acid (PLFA) were collected on 5/15/23 in the control and the AHS off-ground harvest treatments in the tree rows sprinkler zone. Three subsamples were taken from the control and the amended off-ground treatments in all four blocks totaling 24 soil samples. The AHS amended samples were scraped back before sampling so only soil was collected. Samples were placed into Ziplock bags, packaged on ice in a styrofoam cooler, and immediately shipped overnight to Ward Laboratories (Kearney, NE) for analysis.
Soil moisture monitoring
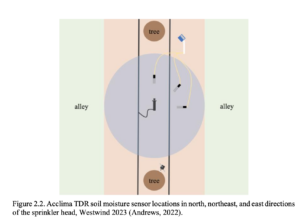
Acclima Time Domain Reflectometry (TDR-315 N) soil moisture sensors were installed in the control and amended off-ground treatments in tree rows with the Acclima Solar DataSnap SDI-12 Data Logger. Installation occurred on 2/25/23 with three soil moisture sensors and one data logger per treatment and block, totaling 24 TDR probes and 8 dataloggers measured monthly from March through August 2024. The TDR sensors measured volumetric moisture (percent), temperature (°C), permittivity (ε, the ability to hold an electric charge), conductivity (μS cm-1), and pore water electrical conductivity (PWEC, μS cm-1). All Acclima TDR sensors were installed approximately 0.91 m (3 ft) from each micro-sprinkler, halfway between the micro-sprinkler and the edge of the irrigation zone at three locations: in the center of the row between the sprinkler and the north tree, toward the alley directly east of the sprinkler, and on the northeast diagonal between the other two sensors (Figure 2.2). Soil moisture data were downloaded on 5/3/23, 7/18/23, and 8/8/23 and all sensors were removed on 8/8/23 before harvest to prevent equipment damage.
2.1.1 Baseline soil fertility
Prior to treatment establishment in Fall 2022 and after 2 years of applied AHS OMA, XK was significantly higher in the amended treatments than the two unamended treatments (Table 2.1). The pH values were significantly higher in the unamended off-ground treatment compared to the amended on-ground treatment. Organic matter trended higher in the amended treatments compared to the unamended treatments, although not significant. Average Olsen-P was slightly lower in amended treatments, although not significant. Soil samples indicated that the largest significant soil XK increased in the amended treatments compared to unamended treatments (Table 2.1). Cation Exchange Capacity (CEC) was slightly higher in the amended off-ground treatment with no significant differences between the other three treatments. Average pH was significantly higher in the unamended off-ground treatment compared to the amended on-ground treatment.
Table 2.1. Fall baseline soil samples at a depth of 0-10 cm were collected on 9/13/22 at Westwind in the control on-ground soil (T1), unamended catch frame soil (T2), amended on-ground soil (T3), and amended catch frame soil (T4). Letters indicate significant differences between treatments using a threshold of p=0.05.
|
Treatment |
NO3-N (ppm) |
Olsen-P (ppm) |
XK (ppm) |
XNa (ppm) |
XCa (meq 100g-1) |
XMg (meq 100g-1) |
CEC (meq 100g-1) |
% OM |
pH |
|
T1: Control On-Ground Soil |
2.25 |
3.23 |
125.17 a |
1355.75 |
11.25 |
4.11 |
21.58 |
1.78 |
7.83 ab |
|
T2: Unamended Catch Frame Soil |
1.57 |
3.45 |
116.17 a |
1334.92 |
12.58 |
4.50 |
23.18 |
1.87 |
7.94 b |
|
T3: Amended On-Ground Soil |
1.89 |
2.55 |
200.67 b |
1365.17 |
11.23 |
4.23 |
21.91 |
2.01 |
7.62 a |
|
T4: Amended Catch Frame Soil |
1.74 |
2.35 |
182.58 b |
1254.58 |
12.53 |
4.54 |
23.01 |
1.97 |
7.85 ab |
2.1.2 Initial nutrients (hull/shell and soil) before AHS application
Initial average AHS amendment nutrient concentrations are provided in Table 2.2 and 2.3. K concentration of AHS was approximately 1.89% with an average C:N ratio of 64:1. At the given rate, AHS application supplied more macronutrients than micronutrients.
Table 2.2. Average applied nutrient concentrations in hull/shell mix and rates at Westwind, 10/7/22. The hull/shell mix was 25% hulls and 75% shells.
|
Application Date: 10/7/22 |
||||||||||||
|
|
(%) |
(ppm) |
||||||||||
|
C:N |
C |
N |
P |
K |
Ca |
Mg |
S |
B |
Zn |
Mn |
Fe |
Cu |
|
64:1 |
47.1 |
0.745 |
0.07 |
1.89 |
0.253 |
0.081 |
401.3 |
73.1 |
7.9 |
16.4 |
401.6 |
3.95 |
|
Nutrient rate applied 16,812 dry kg/ha |
||||||||||||
|
-- |
11130 |
176 |
16 |
447 |
59 |
19 |
94 |
17 |
1.86 |
3 |
94 |
0.9 |
Table 2.3. Average hull/shell amendment nutrient concentrations sampled 201 days after application. Letters indicate significant differences between sampling time points, using a threshold of p=0.05.
|
Nutrient |
Initial Time: 10/7/22 |
Final Time: 4/25/23 |
|
N (%) |
0.745 a |
0.927 b |
|
P (%) |
0.0700 b |
0.0495 a |
|
K (%) |
1.894 b |
0.107 a |
|
S (ppm) |
401 a |
982 b |
|
B (ppm) |
73.1 b |
20.8 a |
|
Ca (%) |
0.253 a |
0.577 b |
|
Mg (%) |
0.0810 |
0.0922 |
|
Zn (ppm) |
7.89 a |
62.60 b |
|
Mn (ppm) |
16.4 a |
55.4 b |
|
Fe (ppm) |
402 a |
2218 b |
|
Cu (ppm) |
3.95 a |
6.87 b |
|
C (%) |
47.1 b |
45.4 a |
|
C:N Ratio |
64.5 b |
49.4 a |
2.1.3 Amendment and cover crop decomposition
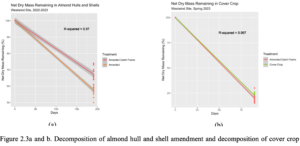
192 days after litter bag application, 62% of the average AHS dry mass remained and 38% of the material decomposed (Table 2.4) (Figure 2.3a).
The dry mass remaining in the amended catch frame treatment was slightly higher compared to the amended on-ground harvest treatment, although not significant. Ninety days after CC termination and installation of the CC litter bags, 31% of the average CC dry mass remained and 69% of the material decomposed (Table 2.4) (Figure 2.3b). The dry mass remaining in the cover crop catch frame treatment was slightly higher compared to the amended treatment with on ground harvest, although not significant. The AHS amendment and CC mix both declined relatively linearly over the 192- and 90-day time periods, respectively.
Table 2.4. After Fall 2022 AHS application, final dry average percent net mass remaining in AHS and CC litter bags in 2023 at given time points.
|
Treatment |
C:N Ratio |
Time Length (Days) |
Total Water Applied (inches) |
Avg. % Net Mass Remaining |
|
Hull/Shell Mix |
49:1 |
192 |
38.37 |
62% |
|
Cover Crop Mix |
18:1 |
90 |
16.16 |
31% |
2.1.4 Soil aggregate stability
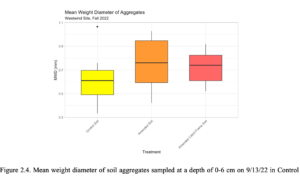
There were no significant differences in mean weight diameter between soil treatments from aggregate stability soil samples collected in Fall 2022 (Figure 2.4). However, in the small macroaggregate fraction, the amended and amended catch frame soil were significantly larger than the control. In the microaggregate fraction, the amended catch frame soil was significantly smaller than the amended and control soils (Table 2.5).
Table 2.5. Distribution of macroaggregates and microaggregates sampled on 9/13/22 in control on-ground soil (T1), amended on-ground soil (T3), and amended catch frame soil (T4). Letters indicate significant differences between treatments within fraction size and sampling time point, using a threshold of p=0.05.
|
Treatment |
Large macroaggregates >2mm (%) |
Small macroaggregates 2mm-250µm (%) |
Microaggregates 250µm-53µm (%) |
Small microaggregates <53µm (%) |
|
T1: Control Soil |
17.0 |
18.0 a |
38.6 a |
26.4 |
|
T3: Amended Soil |
21.0 |
25.7 b |
32.0 a |
21.3 |
|
T4: Amended Catch Frame Soil |
18.2 |
26.6 b |
31.7 b |
23.4 |
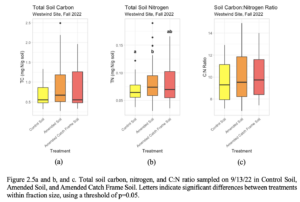
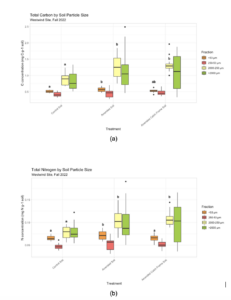
There were no significant differences across soil treatments in Total Carbon (TC) or in C:N ratios, but there was significantly higher Total Nitrogen (TN) in the amended soil compared to the amended catch frame and control soil (Figure 2.5). However, when soils were separated across four fraction sizes, the TC, TN, and C:N ratio indicated largest contributions to the amended soil and amended catch frame soils from the large and small macroaggregate fractions (Figure 2.6, Table 2.6). TC was significantly higher in the amended catch frame and amended soil compared to the control in the small macroaggregate fraction (2mm-250µm). There was also significantly higher TC in the amended soil compared to the control in the small microaggregate fraction (<53µm), although there were no significant differences between amended catch frame and amended soils in the smallest fraction (Figure 2.6a). TN was also significantly higher in the amended catch frame and amended soil compared to the control in the small macroaggregate fraction (2mm-250µm). However, TN was significantly higher in the amended soil compared to the amended catch frame and control soils (Figure 2.6b). The C:N ratio was significantly higher in the amended catch frame and amended soils when compared to the control in the small macroaggregate fraction (2mm-250µm) (Table 2.6).
Figure 2.6a and b. Total soil carbon and nitrogen sampled on 9/13/22 in Control Soil, Amended Soil, and Amended Catch Frame Soil and separated by fraction sizes. Letters indicate significant differences between treatments within fraction size and sampling time point, using a threshold of p=0.05.
Table 2.6. Average C:N ratio of macroaggregates and microaggregates sampled on 9/13/22 at Westwind in control on-ground soil (T1), amended on-ground soil (T3), and amended catch frame soil (T4). Letters indicate significant differences between treatments within fraction size and sampling time point, using a threshold of p=0.05.
|
Treatment |
Large macroaggregates >2mm (%) |
Small macroaggregates 2mm-250µm (%) |
Microaggregates 250µm-53µm (%) |
Small microaggregates <53µm (%) |
|
T1: Control Soil |
10.5 |
11.4 a |
8.81 |
7.77 |
|
T3: Amended Soil |
11.5 |
12.4 b |
8.73 |
7.82 |
|
T4: Amended Catch Frame Soil |
10.7 |
12.3 b |
9.19 |
8.04 |
2.1.5 Soil organic matter fractions
Initial Fall 2022 soil data showed that % TC was significantly higher for mineral associated organic matter (MAOM) fractions in the amended catch frame and amended soils compared to the control. While % TC was significantly higher for particulate organic matter (POM) fractions in the amended catch frame and amended soils compared to the control, there were no significant differences between amended catch frame and amended soils (Table 2.7). Whereas %TN was significantly higher for MAOM fractions in the amended catch frame and amended soils compared to the control. There were no significant differences in % TN for POM fractions across all treatments (Table 2.7). The C:N ratio was significantly higher in the amended soil in the POM fraction compared to the control soil, however there were no significant differences between the amended and amened catch frame soils (Table 2.7).
Table 2.7. Average % Total C, %, and C:N ratio of POM (macroaggregates) and MAOM (microaggregate) fractions sampled on 9/13/22 at Westwind in control on-ground soil (T1), amended on-ground soil (T3), and amended catch frame soil (T4). Letters indicate significant differences between treatments within fraction size and sampling time point, using a threshold of p=0.05.
|
Fraction |
Treatment |
% TC |
% TN |
C:N Ratio |
|
POM |
T1: Control Soil |
1.23 a |
0.149 |
8.26 a |
|
T3: Amended Soil |
1.56 b |
0.179 |
8.64 b |
|
|
T4: Amended Catch Frame Soil |
1.51 ab |
0.177 |
8.52 ab |
|
|
MAOM |
T1: Control Soil |
0.571 a |
0.0450 a |
12.5 |
|
T3: Amended Soil |
1.035 b |
0.0761 b |
13.3 |
|
|
T4: Amended Catch Frame Soil |
1.157 b |
0.0845 b |
13.6 |
2.1.6 Soil microbial community
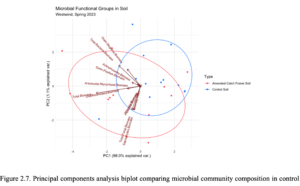
After 8 months of AHS OMA application, soil samples were collected for phospholipid fatty acid analysis (PLFA). The amended catch frame soil had significantly higher average total biomass, total fungi biomass, saprophyte biomass, protozoa biomass, gram (+) biomass, undifferentiated biomass, and microbial diversity index compared to the control soil. The fungi:bacteria, gram (+):gram (-), and saturated:unsaturated, monounsaturated:polyunsaturated ratios were slightly higher in the amended catch frame soil compared to the control, although not significantly different. In the principal components analysis (PCA) biplot, increased gram-negative biomass and total bacteria biomass were the most distinct vectors that characterized the amended catch frame soil (Figure 2.7, Table 2.8). These vectors appeared to be correlated with actinomycetes biomass and gram-positive biomass, and less correlated with arbuscular mycorrhizal biomass, total biomass, and undifferentiated biomass.
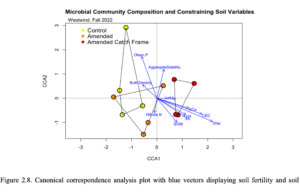
The canonical correspondence analysis (CCA) plot showed that soil variables XK, XCa, pH, SOM, XMg, XNa, and CEC were changing along the axis towards the amended catch frame treatment which may indicate that microbial community composition was correlated to these variables, while less correlated with bulk density and nitrate (Figure 2.8). While nitrate indicated separation between amended and amended catch frame treatments, bulk density did not. Aggregate stability did not contribute significantly to the amended catch frame cluster, but the direction of the vector is trending towards that treatment, which may indicate potential microbial community shifts driving aggregate stability over time. There were no significant differences using an ANOVA with the CCA.
Table 2.8. PLFA response variables from soil sampled on 5/22/23 at Westwind from the top 0-10 cm of the soil in control on-ground soil (T1) and amended catch frame soil (T4). Letters indicate significant differences between treatments within each response variable and sampling time point, using a threshold of p=0.05.
|
Response Variable |
Microbial Biomass (ng g-1) |
|||
|
T1: Control Soil |
T4: Amended Catch Frame Soil |
|||
|
Mean |
Std. Dev. |
Mean |
Group |
|
|
Total Biomass |
2662 a |
771.15 |
3523 b |
1192.36 |
|
Diversity Index |
1.35 a |
0.04 |
1.43 b |
0.09 |
|
Total Bacteria Biomass |
1083 |
377.71 |
1462 |
607.62 |
|
Actinomycetes Biomass |
173 a |
47.71 |
233 a |
106.30 |
|
Gram Negative Biomass |
754 a |
292.07 |
948 a |
354.35 |
|
Rhizobia Biomass |
0 a |
0 |
17.8 a |
34.25 |
|
Total Fungi Biomass |
609 a |
187.11 |
814 b |
213.94 |
|
Arbuscular Mycorrhizal Biomass |
95 a |
34.36 |
131.5 a |
61.98 |
|
Saprophytes Biomass |
514 a |
159.15 |
683 b |
169.54 |
|
Protozoa Biomass |
7.69 a |
5.55 |
36.03 b |
41.09 |
|
Gram Positive Biomass |
329 a |
94.02 |
515 b |
273.76 |
|
Undifferentiated Biomass |
961 a |
225.96 |
1210 b |
365.06 |
|
Fungi:Bacteria Ratio |
0.584 a |
0.11 |
0.595 a |
0.12 |
|
Gram (+):Gram (-) Ratio |
0.456 a |
0.07 |
0.525 a |
0.11 |
|
Saturated: Unsaturated Ratio |
0.852 a |
0.09 |
0.881 a |
0.07 |
|
Monounsaturated: Polyunsaturated Ratio |
2.66 a |
0.78 |
2.87 a |
1.08 |
2.1.7 Soil-water relations
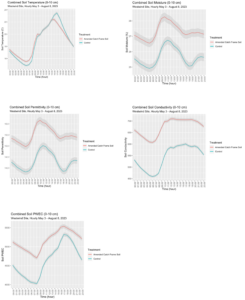
Soil moisture, permittivity, soil conductivity, and PWEC increased, and soil temperature was moderated from May to August 2023 in the top 0-10 cm of soil (Figure 2.9). Combined and monthly average soil moisture, permittivity, and conductivity were significantly higher in the amended catch frame soil compared to the control. The monthly average differences were greatest during the month of June with a soil moisture difference of 2.9%, a soil permittivity difference of 2.4, and a soil conductivity difference of 280. Although monthly average soil temperature was not significantly different between the control and amended catch frame soil, the combined soil temperature across the months measured showed more moderated temperature during 10:00 until 14:00. During peak heat hours at 13:00 until the evening, the amended catch frame soil had lower overall soil temperature than the control which indicated that the amendment provided soil temperature relief. Combined monthly and hourly average soil conductivity was generally higher during early mornings before 06:00 and in the evenings in the amended catch frame soil. Combined monthly average soil PWEC was generally higher during wetter months and hourly average soil PWEC showed a steep decline approximately at 08:00, with a linear increase until 18:00, and finally a decrease towards the initial values in the evening. Combined monthly soil moisture and permittivity showed similar trends with the most significant difference in the month of June. Average hourly soil moisture and temperature showed the most significant differences during mid-day when the maximum air temperature was the hottest. In June the average maximum air temperature was 30.4 °C (86.7 °F). Additionally in July, the average maximum air temperature was 35.5 °C (95.9 °F) and the monthly average soil moisture was significantly higher in the amended catch frame soil.
From 5/3/2023 to 8/8/2023, the overall control soil was drier than the amended catch frame soil at a depth of 0-10 cm. The Acclima TDR probes indicated that the amendment increased soil moisture, moderated soil temperature, and increased soil permittivity, conductivity, and pore water electrical conductivity (PWEC). Average monthly soil moisture, temperature, permittivity, conductivity, and PWEC were higher in the amended catch frame soil compared to the control (Table 2.9). However, hourly average soil temperature appeared to have no differences during mid-day but indicated decreased soil temperature in the amended catch frame soil compared to the control as the day progressed (Figure 2.9).
Figure 2.9. Hourly average soil moisture, temperature, permittivity, conductivity, and PWEC across all dates measured in the upper 0-10 cm (0-4 inches) soil with Acclima TDR probes.
Table 2.9. Monthly average soil moisture, temperature, permittivity, conductivity, and PWEC across all dates measured in the upper 0-10 cm (0-4 inches) soil with Acclima TDR probes at Westwind in the control on-ground soil (T1) and amended catch frame soil (T4). Letters indicate significant differences between treatments and sampling time point, using a threshold of p=0.05.
|
Month |
Treatment |
Moisture (%) |
Temperature (℃) |
Permittivity |
Conductivity |
PWEC |
|
May 3-31 |
T1: Control Soil |
32.1 a |
11.5 |
18.5 a |
437 a |
2541 |
|
T4: Amended Catch Frame Soil |
33.1 b |
11.7 |
19.5 b |
459 b |
2544 |
|
|
June 1-30 |
T1: Control Soil |
27.5 a |
20.4 |
15.4 a |
685 a |
5026 a |
|
T4: Amended Catch Frame Soil |
30.4 b |
21.4 |
17.6 b |
965 b |
6210 b |
|
|
July 1-31 |
T1: Control Soil |
20.8 a |
19.8 |
11.2 a |
405 a |
4556 |
|
T4: Amended Catch Frame Soil |
23.3 b |
20.0 |
12.7 b |
538 b |
4932 |
|
|
August 1-8 |
T1: Control Soil |
22.2 |
23.0 |
12.1 |
644 a |
6392 a |
|
T4: Amended Catch Frame Soil |
22.4 |
23.4 |
12.2 |
729 b |
6957 b |
2.1.8 Cover crop biomass, nutrients, and soil fertility
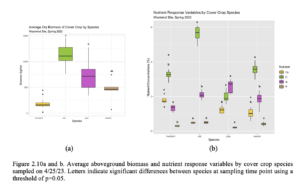
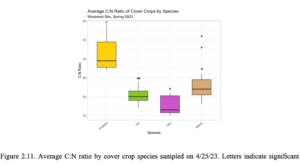
After 5 months since the CC were seeded, average aboveground cover crop biomass separated by species was significantly higher in oat, followed by pea, and mustard. The dominant weed species was filaree, and its average biomass was slightly less than pea and slightly greater than mustard (Figure 2.10a). Plant nutrients N, P, K, and Ca were assessed across pea, oat, mustard, and weed species on 4/25/23 upon termination (Figure 2.10b). Across all species, % N in peas were significantly greatest, while %N in oats and weeds were significantly greater than mustard. The % P were statistically different across all species with the greatest value in oats, followed by weeds, mustard, and peas. Additionally, % K was significantly greatest in oats, while % K in in mustard and weeds were significantly greater than peas. Across all species, % Ca was significantly greatest, while % Ca was significantly greater in pea and weeds compared to oats. Average C:N ratio was significantly higher in mustard compared to oats, peas, and weeds (Figure 2.11). Average C:N ratio was significantly lower in peas compared to the other species. Although, average C:N ratio of oats were slightly higher than peas and weeds were slightly higher than oats, there were no significant differences. Soil samples were collected immediately after aboveground biomass was removed on 4/25/23 (Table 2.10). Nitrate-N was significantly higher in the control soil compared to the CC catch frame soil, while XMg was significantly higher in the CC catch frame soil compared to the control soil.
Table 2.10. Soil samples at 0-10 cm depths, were collected on 4/25/23 at Westwind following cover crop termination in control on-ground soil (T1) and cover crop catch frame soil (T2). Letters indicate significant differences between treatments within sampling time point, using a threshold of p=0.05.
|
Treatment |
NO3-N (ppm) |
Olsen-P (ppm) |
XK (ppm) |
XNa (ppm) |
XCa (meq 100g-1) |
XMg (meq 100g-1) |
CEC (meq 100g-1) |
% OM |
pH |
|
T1: Control Soil |
5.29 a |
2.25 |
115 |
21.0 |
15.4 |
3.02 a |
18.8 |
2.27 |
7.14 |
|
T2: Cover Crop Catch Frame Soil |
2.03 b |
1.55 |
106 |
14.2 |
15.4 |
2.75 b |
18.5 |
2.20 |
7.05 |
2.1.9 Yield and harvest equipment
During harvest in August 2023, yield in every individual tree row was collected with a weigh wagon for on-ground harvest treatments (T1 and T3), and a catch frame TOL harvester (Twin D T4 Shaker) for off-ground treatments (T2 and T4). Yield was impacted in the third year of applied AHS amendments. Average dry kernel yield was significantly higher in the amended treatment compared to the control, CC off-ground harvest, and amended off-ground harvest treatments. In contrast, average dry kernel yield was significantly lower in the CC off-ground treatment compared to the control, amended on-ground, and amended off-ground treatments. The average dry kernel yield was significantly lower in the amended off-ground treatment compared to the amended on-ground treatment, however, the control treatment was not significantly different compared to both the amended on and off-ground treatments. There were no significant differences in average dry kernel yield, average percent crack out, or average percent dry hull/shell trash in the yield samples. However, the average percent of total dry trash in the yield samples was significantly higher in the amended on-ground treatment compared to the off-ground treatment (Table 2.11). In summary, average total trash and average kernel yield was highest in the amended on-ground treatment.
Table 2.11. Average yield data was collected on 8/14/23 at Westwind in the control on-ground treatment (T1), cover crop off-ground treatment (T2), amended on-ground treatment (T3), and amended off-ground treatment (T4). Letters indicate significant differences between treatments within sampling time point, using a threshold of p=0.05.
|
Treatment |
Avg. Dry Kernel (lb/ac) |
Std. Dev. (lb/ac) |
Avg. % Crack Out |
Avg. Dry HS Trash in Yield Samples (%) |
Avg. Total Dry Trash of Yield Samples (%) |
|
T1: Control On-Ground |
2238 bc |
158 |
27.5% |
4.02% |
12.7% a |
|
T2: Cover Crop Off-Ground |
1752 a |
305 |
27.3% |
4.34% |
11.3% a |
|
T3: Amended On-Ground |
2421 c |
554 |
27.4% |
2.54% |
23.2% b |
|
T4: Amended Off-Ground |
2100 b |
229 |
27.4% |
2.46% |
4.58% a |
References
Florence, A. M., Higley, L. G., Drijber, R. A., Francis, C. A., & Lindquist, J. L. (2019). Cover crop mixture diversity, biomass productivity, weed suppression, and stability. PLOS ONE, 14(3), e0206195. https://doi.org/10.1371/journal.pone.0206195
Iqbal, R., Raza, M. A. S., Valipour, M., Saleem, M. F., Zaheer, M. S., Ahmad, S., Toleikiene, M., Haider, I., Aslam, M. U., & Nazar, M. A. (2020). Potential agricultural and environmental benefits of mulches—A review. Bulletin of the National Research Centre, 44(1), 75. https://doi.org/10.1186/s42269-020-00290-3
Jilling, A., Kane, D., Williams, A., Yannarell, A. C., Davis, A., Jordan, N. R., Koide, R. T., Mortensen, D. A., Smith, R. G., Snapp, S. S., Spokas, K. A., & Stuart Grandy, A. (2020). Rapid and distinct responses of particulate and mineral-associated organic nitrogen to conservation tillage and cover crops. Geoderma, 359, 114001. https://doi.org/10.1016/j.geoderma.2019.114001
Kemper, W. D. (1965). Aggregate Stability. In Methods of Soil Analysis (pp. 511–519). John Wiley & Sons, Ltd. https://doi.org/10.2134/agronmonogr9.1.c40
Koudahe, K., Allen, S. C., & Djaman, K. (2022). Critical review of the impact of cover crops on soil properties. International Soil and Water Conservation Research, 10(3), 343–354. https://doi.org/10.1016/j.iswcr.2022.03.003
Mennan, H., & Ngouajio, M. (2012). Effect of Brassica Cover Crops and Hazelnut Husk Mulch on Weed Control in Hazelnut Orchards. HortTechnology, 22(1), 99–105. https://doi.org/10.21273/HORTTECH.22.1.99
Midwood, A. J., Hannam, K. D., Gebretsadikan, T., Emde, D., & Jones, M. D. (2021). Storage of soil carbon as particulate and mineral associated organic matter in irrigated woody perennial crops. Geoderma, 403, 115185. https://doi.org/10.1016/j.geoderma.2021.115185
Six, J., Elliott, E. T., & Paustian, K. (2000). Soil macroaggregate turnover and microaggregate formation: A mechanism for C sequestration under no-tillage agriculture. Soil Biology and Biochemistry, 32(14), 2099–2103. https://doi.org/10.1016/S0038-0717(00)00179-6
Research outcomes
Applied fresh almond hulls/shells at a rate of 8 tons/acre improved soil moisture, increased microbial diversity, improved soil aggregate stability and with continued applications, will continue to build upon these positive outcomes. However, utilizing mixtures of hulls/shells or solely hulls and shells should be studied at different application rates to determine soil health benefits for long term almond sustainability and as an alternative potassium source. Future research is needed to study the implications of measuring soil water dynamics at different depths, soil types, climates, and irrigation management practices. Our study did not grind the AHS amendment before application, but long-term studies are needed to assess the decomposition of ground materials and the implications of the overall tree status from crop residues. Future research can assess microbial communities across AHS OMA and various CC species to identify specific microbe functions from targeted ecological management strategies. Future research should consider how off-ground harvest effects yield while also measuring additional soil health benefits including improving aggregate stability, organic matter, and microbial community functions. To answer our second question about how Fall applied AHS OMA impacted CC biomass, nutrient status, and short-term composition, we found that overall decomposition was rapid and that the CC acted as a buffer from soil nitrate. Further research can investigate different species of CC mixes and interactions with AHS OMA as potential strategies to manage nutrient inputs for overall water savings and soil benefits.
Education and Outreach
Participation summary:
With the assistance of the 4-H Regional Program Coordinator Jose Campos, I presented and hosted a college readiness workshop for underserved high school students in Merced County in Winter 2023. Information about preparing for college and college major decisions were discussed in an open and collaborative format including topics about tuition, robust writing for admission, identifying programs of interest including agriculture, and scholarship opportunities.
Farm field days were hosted in Fall 2023 and Spring 2024 at our field site. Demonstrations of seeding CC and AHS OMA applications were shown via videos and handouts. Photos of seeding drills and broadcast spreaders were shown as options for application as well as alternative machinery for specific farms. Audience members included growers and managers, seeding companies, pest control and certified crop advisers, extension specialists, researchers, and the general public. Sign in sheets were available and qualtrics surveys were sent to record public interest and future interest in the following field day in Spring 2024. In Spring 2024, our final field day occurred after data collection and research objectives were close to completion. Public engagement was advertised through social media platforms from the UC Davis Plant Sciences Department and announcements to local community members from scientists including Dr. Sat Darshan S. Khalsa and Dr. Patrick H. Brown as well as UC ANR Orchard Systems Advisor Katherine Jarvis-Shean. All stakeholders and producers were provided all data and knowledge gained from this project in addition to activities that were conducted at field days. Handouts with information and images about AHS OMA and CC implementation were created in advance so that audience members can easily read the important facts at the event. Multiple speakers including myself, researchers, and industry leaders will be invited to present current and future research to better understand areas of improvement for regenerative practices in almond orchards in California. Access to our field site was shared in advance with information regarding the agenda, parking, accessibility, and food and resources for a successful field day.
Worksheets were created collaboratively and provided to 4-H members at the college readiness workshop with resources available after the event and I was able to continue conversations via email with two of the 15 students who attended our workshop. Students expressed interest in applying to colleges with a major emphasis in agriculture, plant sciences, dairy science, and soil science. (College Readiness Surveys 1.25.23)
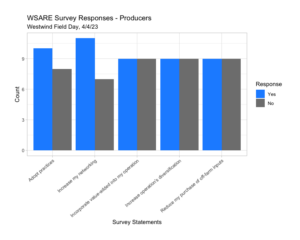
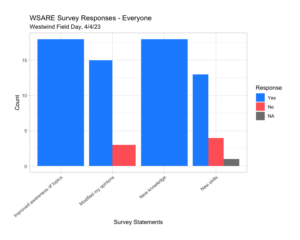
We found that our audience at our first Spring 2023 field day stated that there was improved awareness of the topics presented, modified their opinions, and they learned new skills. Producers also responded that they would adapt practices that were discussed (off-ground harvest, almond hulls and shells, and cover crops) and increased networking. Professionals responded that our event would be used as a resource and advice for producers while also used as a professional development tool (Westwind Field Day 4.4.23, Westwind Field Day Surveys 4.2.24).
