Progress report for GW24-009
Project Information
California's agricultural scene is diverse, harvesting hundreds of crops despite a notoriously variable climate[1]. As groundwater transitions to a regulated resource according to SGMA legislation of 2018[3], smaller operations are more likely to suffer under uniform application due to typically having less resources to adapt[2]. Small farms are associated with overall higher crop and non-crop biodiversity and higher yields [4], and these growers deserve consideration as SGMA is implemented through 2040.
Since 2018 regulations, noninvasive satellite-based platforms have emerged to effectively normalize crop water use for farms as small as one-quarter acre. While OpenET has been integrated into irrigation management and compliance strategies, the theory behind the equations used to produce ET field maps assumes homogeneous canopies and expansively large area. In contrast, growers in this study operate diverse cropping systems on less than 50 acres, thus they are interested in ensemble performance under these constraints. We partnered with 7 small farms in the critically overdrafted Kings Watershed Basin to perform aerial and ground surveys at 100-1000 times satellite’s spatial resolution in thermal bands and evaluate predictions of ET from their perspective. Doing this, our project aims to support regulations that keep small farms viable.
This project invited grower collaboration and two-way education by staging micro extension events and developed Digital ET Product Packages for participating farms. Initial research findings have been published at academic conferences, with submissions expected at future conferences and in peer reviewed journals. Once complete, workflows and processing code will be published for stakeholder access.
Research Objectives
1. Estimate the seasonal vapor flux of small farms using physical and energy balance methods
2. Evaluate the performance of satellite based models
3. Review relevant Groundwater Sustainability Plan in support of equitable groundwater management and preserving a natural resource
Educational Objectives
1. Dissemination of products, information, and ideas among growers and researchers
2. Collaboration among growers, researchers and community stakeholders
3. Community building among those interested in and impacted by Sustainable Groundwater Management
Cooperators
- (Researcher)
- (Researcher)
- (Educator)
- - Producer (Educator)
- (Educator)
Research
Two of seven small farms in California's San Joaquin Valley participated in Intensive Observation Periods (IOPs) during the 2024 season. Some of these farms exemplify highly diverse production systems, cultivating hundreds of specialty vegetable crop varieties including bell pepper, opo squash, Chinese eggplant, luffa, bitter melon, sunchoke, gai lan (broccoli), sinqua (luffa), moqua squash, lemongrass, mustard greens, water spinach, yam, snow peas, bok choy, artichoke, carrot, onion, asparagus, broccoli, blackberries, blueberries, strawberries, and many others. This level of crop diversity, along with a patchwork of fallow and active fields, presents a dynamic irrigation landscape that is poorly represented in academic research and by coarse-resolution satellite data.
Research Objectives
1. Estimate seasonal evapotranspiration (ET) flux in multi-crop farms using physical and energy balance methods
Models to estimate spatial ET are being developed to generate seasonal consumptive water flux curves for 2024 and 2025. These will allow for both spatial and temporal analyses and comparison with OpenET estimates. Groundwater use was periodically recorded using flow meters that captured applied volume and pressure. To support model development, 24 field IOPs are scheduled during the hot, dry summer months (June–October) of 2024–25. Although small farms produce crops year-round, this window represents the period when snowpack- and precipitation-driven variability in water supply is most critical.
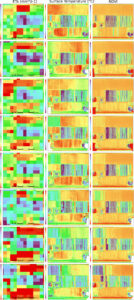
During 16 IOPs conducted in 2024, leaf-level measurements included stomatal conductance and chlorophyll fluorescence parameters. Following midday UAV flights, imagery and data were backed up to two hard drives provided by the Conservation Irrigation Lab. Photogrammetry processes produced thermal and single-band orthomosaics, from which NDVI orthomosaics were derived (see Figure 2).
Ground-based thermal cameras, funded by Western SARE, were deployed at each IOP to capture surface temperature data for model calibration.
2. Evaluate the performance of satellite-based models
The project will evaluate satellite-derived ET estimates against metered water use and high-resolution imagery using consistent algorithms. Given that ensemble ET models are typically developed using data from large, uniform farms (e.g., tomatoes, almonds), this study aims to address their applicability to smaller, more diverse operations. To strengthen comparative analysis, archival thermal imagery from the Conservation Irrigation Lab (CIL) and web-based platforms may be utilized. Ideally, imagery will be collected across three farm types:
-
Diverse crops < 50 acres
-
Uniform crops < 50 acres
-
Uniform crops > 50 acres
A staggered evaluation and analysis phase begins after imagery processing, and will continuing through Spring 2026. Imagery and outcomes are shared with participating farms as packaged digital and print products, including:
-
At the end of the 2024 season aerial imagery was printed in color and delivered to each grower. The lookbook included multi-band imagery, digital elevation model, and funding acknowledgements.
-
With time, lookbooks will be revised to include high-resolution aerial imagery and ET maps and digital products on thumbdrive.
-
Seasonal vapor flux curves
-
Leaf-level metrics
-
An assessment of ensemble ET methods for small, diversified farms in the subbasin watershed.
For direct comparison, satellite imagery used by OpenET will be oversampled and aligned with UAV imagery, then downscaled to simulate ensemble ET estimates at higher resolution.
3. Review Groundwater Sustainability Plans in support of sustainable groundwater users and natural resource management
This project prioritizes farms that are not typically represented in both agricultural research and water resource policy. Small-acreage, artisanal farms grow an array of specialty fruits and vegetables year-round, for local and regional markets. To our knowledge, this is the first time evapotranspiration has been estimated in U.S. jujube orchards and lemongrass fields—both of which were extensively sampled in 2024.
In collaboration with project educators, we've engaged in holistic review of the Kings Subbasin Groundwater Sustainability Plan (GSP). Originally submitted in 2020 and approved by the Department of Water Resources (DWR) in 2023, the plan underwent public comment this year and further revisions are expected. Of particular interest is whether—and how—it addresses farm-size disparities in the accuracy of land and water use estimation. Compiled reports and visualizations will be shared with small farm producers and agricultural professionals at the project’s final extension event, scheduled for Spring 2026.
In pursuit of the first two objectives—(1) estimating seasonal consumptive water use on small, diverse farms and (2) evaluating the performance of satellite-based ET models—comprehensive data collection, processing, and curation were completed for the first of two field seasons. Towards developing evapotranspiration (ET) maps, we generated and analyzed surface temperature and NDVI orthomosaics.
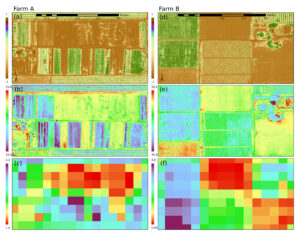
Figure 1 was produced for a manuscript (in progress) and displays imagery for Farm A and B from August 2023. The imagery displays NDVI (a, d) alongside OpenET estimates of ET for the same day (c, f). ET models depend heavily on surface temperature (b, e), therefore for areas like Farm A upper-left and Farm B lower-left, the ET estimates may be respectively under and over estimated.

In 2024, a total of 16 intensive observation periods (IOPs) were conducted in collaboration with Small Farms B and C. Figure 2 uses cool, violet and blue colors to indicate high ET (left column), cool surface temperatures (center) and NDVI defined vegetation (right). In the top two plates, peak relative ET occurs with peak growth, yet ET values are also high during the harvest phase corresponding to the last two plates. This and a similar analysis to include leaf stomatal conductance, fluorescence, and Farm B is ongoing.

Farm B and C contrast as examples of system diversity:
-
Farm B (Figure 1, right) consists of larger, more uniform field blocks with moderate diversity across fewer crops.
- Farm C (Figure 2) represents ultra-diverse row crops with 50–100+ varieties cultivated simultaneously
IOPs occurred semi-monthly from July through October 2024, coinciding with or closely follow LandSat satellite overpasses. This strategy enabled comparison between UAV-derived surface temperature and NDVI time series and ET estimates generated by OpenET, and Figure 2 shows the complete imagery set along with OpenET model estimate.
The Two Source Energy Balance model for UAV imagery was used to generate a summary report for University of California Agriculture and Natural Resources annual reporting. ET analysis was initiated to observe differences in satellite- and drone-based ET for the jujube fruit orchard at Farm B.
Finally, preliminary findings were presented at two conferences in 2024. A poster was presented at the third annual international conference, Toward Sustainable Groundwater in Agriculture: Linking Science and Policy in June 2024, which highlights metered water use compared to OpenET ensemble estimates at Farm B. A short talk describing the research and results, Small Farms and OpenET was given at the Western Groundwater Congress in October 2024.
Research outcomes
Our findings highlight the critical importance of calibrating remotely sensed ET models, particularly in heterogeneous agricultral canopies. Figures 1 and 2 present sample imagery from the 2023 and 2024 field seasons, illustrating spatial discrepancies between satellite-based ETa and key influencing variables -- surface temperature and NDVI -- both shown at much finer spatial resolution. These comparisons emphasize the need for careful model tuning to account for sub-pixel variability in canopy structure and function.
Research activity continues to test and reinforce the prevailing understanding that remote sensing model validation is most robust when supported by multiple proximal measurements rather than any single observation. Initial findings demonstrate that incorporating ground-based leaf measurements improves the reliability, and spatiotemporal representativeness of validation efforts.
Future efforts will focus on machine learning techniques for classification and to downscale spatial resolution of satellite-based ET, leveraging the high-resolution aerial imagery.
Education and Outreach
Participation summary:
To support the educational objective of exchanging and disseminating information, ideas, and products between growers and educators, we conducted 12 on-site visits to Farm B and Farm C. During these visits, growers shared valuable insights into farm operations, timelines, varietals, and irrigation infrastructure. In return, we provided color-printed aerial imagery from IOPs 1–7, delivered in person on three occasions. While an oral presentation was planned as Year 1 outreach strategy, activities were modified for communication and scheduling challenges. A single extension event to close the project may be prove to be a more realistic and beneficial approach for our gorwers. Importantly, these experiences underscored the value placed on consistent, one-on-one engagement and preferrence for printed materials over digital formats at this stage. Through these exchanges we have begun to address the second objective of fostering collaboration among growers, farm workers, community stakeholders and educators — both local partners with UCANR and those traveling from UC Davis. The third educational objective, focused on local interests in groundwater planning under the Sustainable Groundewater Management Act is scheduled to begin this year and continue through the remainder of the project.