Final Report for LNC08-297
Project Information
Comparing results from the past three years we have found that the abundance of both native bees and insect natural enemies increased while herbivorous insects did not change in crop fields adjacent to conservation strips. There were significantly more of these beneficial insects in fields and orchards adjacent to the wildflower plantings compared to those adjacent to control (unenhanced) perimeters. Measuring the ecosystem services from these beneficial insects, after two years of wildflower establishment, in the third year of measurements we found a significant increase in percent fruit set, average berry weight, number of mature seeds per berry in blueberry fields adjacent to the conservation strips, compared with the control fields. We used the average berry weight and percent fruit set to calculate a predicted fruit yield for our blueberry farms, and although not statistically significant, the fruit yield was higher in blueberry fields adjacent to the wildflower plantings. In fields adjacent to conservation strips we also found an increase in biological control of sentinel corn earworm eggs (in blueberry) and of leafminer larvae (in apple) compared to crop fields adjacent to grass field margins. The establishment of native, perennial wildflowers along the borders of crops fields in the form of conservation strips is an initially costly practice, but with time these conservation strips will lead to an increase in the number of native bees and natural enemies. Form the data collected in this project, we can conclude that this practice will ultimately increase pollination and decrease pests in adjacent crop fields.
In order to improve grower knowledge of beneficial insect identification and how to support these insects with the use of flowering plots, we provided presentations at numerous extension meetings and conference during the past three years. These presentations generally included information on beneficial insect identification and biology, establishment and maintenance of wildflower plantings, and current results from this ongoing project. At the field days we invited growers, extension agents, government agency representatives, and anyone interested beneficial insect conservation to come learn about our project. The project team surveyed growers in attendance at the field days before and after the meetings, finding that their level of knowledge of conservation practices for building biodiversity in fruit farms increased after the training. These meetings have generated much interest in the use of conservation strips to help conserve beneficial insect, with growers taking the initiative to adopt this approach on their own. Adoption of this practice is increasing in Michigan, with increasing sales of native plant seed, and greater enrollment in government programs for pollinator conservation. These include two of our project growers who are establishing additional USDA-supported plantings in their farms after seeing the results of this project.
Introduction:
There has been a growing interest in recent years about the economic and ecological benefits of re-incorporating natural resources into agricultural systems (Landis et al. 2000, Kleijn and Sutherland 2003, Bianchi et al. 2006), in part because of the documented declines in populations of beneficial insects (e.g. Beismeijer et al. 2006). Crop fields within the North Central Region used for fruit and vegetable production have strips of land around them that are typically mown, tilled, or treated with herbicide. These headlands are potential areas for re-integrating flowering plants to support natural enemies and pollinators, if the benefit of these practices are documented and demonstrated to growers. In a review of the response of farmland biodiversity to set-aside schemes in the Europe and North America, Van Buskirk and Willi (2004) found evidence for increases in farm biodiversity in the presence of set-aside areas that provide non-sprayed, non-tilled areas for flowering plants. Deliberate integration of flowering plants in farms has been employed to achieve similar effects in the available field margin land (reviewed by Wratten and Van Emden, 1995). Manipulation of the environment around cropped areas by establishing flowering plants can increase natural enemy populations (Long et al. 1998, Rebek et al. 2005) and provide forage for wild bees to increase their abundance (Kells et al. 2001, Buchi 2002).
Providing a broad range of flowering plants is an essential component of rebuilding a strong beneficial insect community in farmland. These insects are dependent on access to pollen and nectar for their food and reproduction, and these can only be provided by flowers. The provision of plants that flower before and after the crop is in bloom will provide resources for native bees throughout their emergence period, and will also provide some diversity of food sources within the crop monoculture. Natural enemies will also benefit from the availability of pollen and especially nectar that can be used to fuel their flight to feed on pest insects in the crop. By providing these resources close to crop fields the insects spend less time flying to search for these resources and more time engaged in the activities that will provide benefit to producers.
A well designed flowering field border would provide nectar and pollen to natural enemies of crop pests during periods when pest numbers are low, thus maintaining high populations of predators and parasites supported by provision of nutrients throughout the season (Landis et al. 2000, Büchi 2002, Ahern 2002, Sanchez 2003, Wanner et al. 2006a,b). Selection of plants to provide these resources is an important first step in development of this tactic. Funded by a recent NC-SARE Research Grant to Doug Landis, 43 species of herbaceous perennial plants adapted to grow in full sun and tolerant of varying soil moisture were evaluated at Michigan State University for their relative attraction to natural enemies (Fiedler and Landis, 2007) and pollinators (Tuell, Fiedler, Landis, and Isaacs, in review). This research was conducted in a corn-soybean dominated landscape at the MSU campus farms, and the project has identified 26 highly-ranked species out of the 43 native flowering Midwest prairie plants that were tested. The plants that received high ranks were A) highly attractive to one or more beneficial insect group and B) easy to grow and not weedy. The results from this previous work provided us with the information necessary to design a field margin treatment with flowering plants that will support beneficial insects at farms in the North Central Region. While increasing beneficial insects is seen as a valuable goal, a critical question is “Does increasing beneficial insects lead to a benefit to the grower?”. It is important to determine and understand the benefits of resource strips for reducing pests and increasing pollination in adjacent crop fields.
The North Central Region contains the nation’s largest concentration of blueberry and cherry producers and a high proportion of the eastern apple industry. By increasing the diversity and abundance of native pollinators and insect natural enemies, fruit growers will increase the long-term sustainability of their production. Through this project, by re-integrating native flowering plants with overlapping blooms into agricultural landscapes, we determined the effectiveness of relatively inexpensive seeded conservation strips to achieve increases in beneficial insect populations and the services they can provide to fruit producers. This was done at a diverse group of fruit farms (blueberry, cherry, and apple) where we established native wildflowers in the farm landscapes for evaluation to support farm productivity and enhancement of farm environmental stewardship. We hypothesized that the artificially-planted native wildflower strips will provide an economic benefit to growers by increasing local populations of beneficial insects and the services they provide. To determine how these conservation strips affect beneficial insects we used various techniques to sample insects in crop fields adjacent to established conservation strips, as well as in fields adjacent mown grass field margins as a control. We also measured pollination parameters and biocontrol of sentinel pest eggs as techniques to evaluate how ecosystem services are affected by the existence of conservation strips. This work provides some much-needed research that will help lead to recommendations for owners of agricultural lands about practices they can adopt to enhance farm biodiversity, and the degree of economic benefit they may expect in return.
References:
Ahern, R.G., and Brewer, M.J., 2002. Effect of different wheat production systems on the presence of two parasitoids (Hymenoptera: Aphelinidae; Braconidae) of the Russian wheat aphid in the North American Great Plains. Agriculture, Ecosystems, and Environment. 92: 201-210.
Bianchi, F.J.J.A.,Booij, C.J.H., & Tscharntke, T. 2006. Sustainable pest regulation in agricultural landscapes: a review on landscape composition, biodiversity and natural pest control. Proc. R. Soc. B. 273, 1715-1727.
Büchi, R., 2002. Mortality of pollen beetle (Meligethes spp.) larvae due to predators and parasitoids in rape fields and the effect of conservation strips. Agriculture, Ecosystems, and Environment. 90:255-263.
Fiedler, A. 2006. Evaluation of native Michigan perennial plants to provide resources for natural enemies. M.S. Thesis, Michigan State University.
Gardiner, M. M., D. A. Landis, C. Gratton, C. D. DiFonzo, M. O'Neal, J. M. Chacon, M. T. Wayo, N. P. Schmidt, E. E. Mueller, and G. E. Heimpel. 2009. Landscape diversity enhances biological control of an introduced crop pest in the north-central USA. Ecological Applications 19: 143-154.
Kells, A.R., Holland, J.M., Goulson, D. 2001 The value of uncropped field margins for foraging bumblebees. Journal of insect conservation. 5: 283-291.
Kleijn, D., & Sutherland, W.J., 2003. How effective are European agri-environment schemes in conserving and promoting biodiversity? Journal of Applied Ecology. 40: 947-969.
Landis, D.A., Wratten, S.D., & Gurr, G.M., 2000. Habitat management to conserve natural enemies of arthropod pests in agriculture. Annu. Rev. Entomol. 45: 175-201.
Long, R.F., Corbett A., Lamb C., Reberg-Horton, C., Chandler J., Stimmann, M., 1998. Beneficial insects move from flowering plants to nearby crops. Calif. Agric. 52: 23-26. Michigan State University IPM Program. 2005. Financial incentives for IPM. Michigan State University IPM Program, Lansing, MI. www.ipm.msu.edu/farmbill.htm
Rebek, E.J., Sadof, C.S., & Hanks, L.M., 2005. Manipulating the abundance of natural enemies in ornamental landscapes with floral resource plants. Biological Control. 33: 203-216.
Sanchez, J.A., Gillespie, D.R., McGregor, R.R., 2003. The effects of mullein plants (Verbascum thapsus) on the population dynamics of Dicyphus hesperus (Heteroptera:Miridae) in tomato greenhouses. Biological Control 28: 313-319.
Van Buskirk, J. and Willi, Y. 2004. Enhancement of farmland biodiversity within set-aside land. Conservation Biology 18, 987-994.
Wanner, H., Gu, H., Dorn, S. 2006a. Nutritional value of floral nectar sources for flight in the parasitoid wasp, Cotesia glomerata. Physiological Entomology. 31: 127-133.
Wanner, H., Gu, H. Gunther, D., Hein, S., Dorn, S. 2006b. Tracing spatial distribution of parasitism in fields with flowering plant strips using stable isotope marking. Biological Control. 39: 240-247.
Wratten S.D. and Van Emden, H.F. 1995. Habitat manipulation for enhanced activity of natural enemies of insect pests. In: Glen, D.M., Greaves, M.P. and Anderson, H.M. (Eds.) Ecology and Integrated Farming Systems. Wiley, Chichester, pp. 117-145.
Our objectives of this project were to 1) increase pollination and reduce pest abundance in fruit crops by deploying native plant conservation strips to support native bees and natural enemies, 2) increase producer and public awareness of using flowering plant diversity in farms to support beneficial insects including natural enemies and pollinators, 3) improve producer knowledge of beneficial insect identification and biology, and 4) develop guidelines for increased implementation of insect conservation strips in farmland.
Cooperators
Research
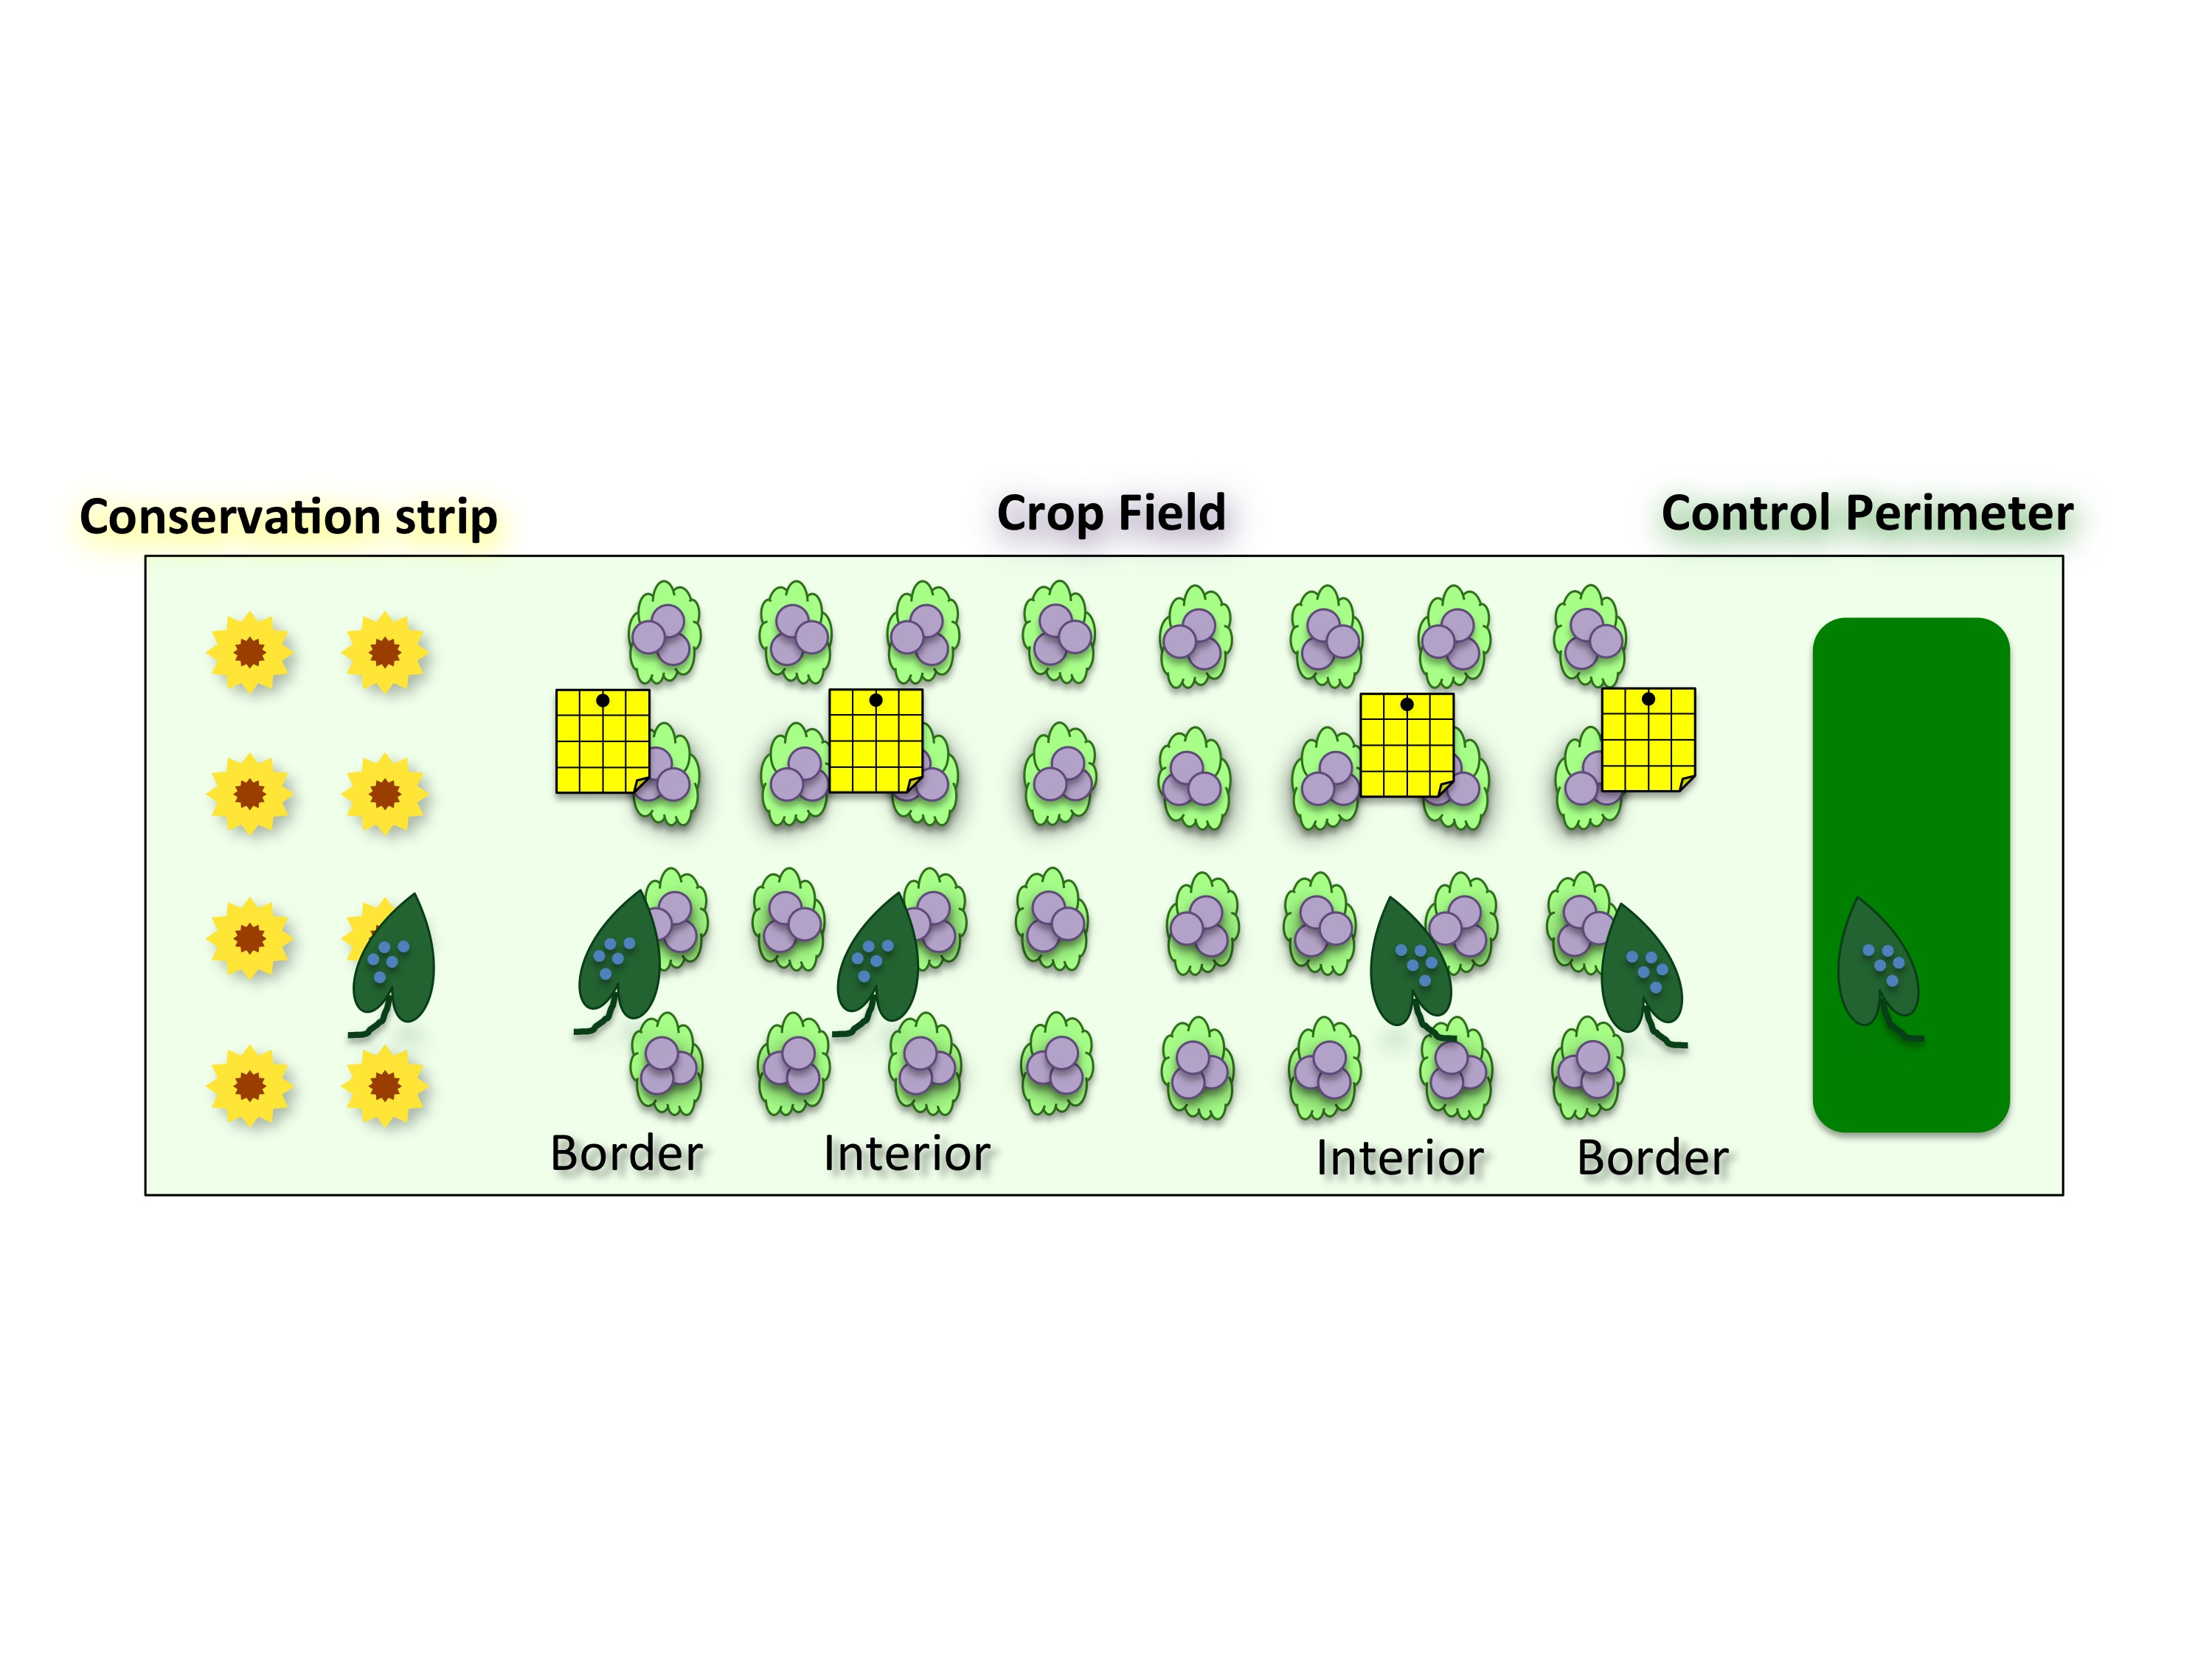
We established replicated wildflower conservation strips at 13 farm sites: five blueberry, four apple, and four cherry fields. Each field that had a conservation strip also had a comparison control perimeter of mown grass without native wildflowers (Figure 1). Thus, we established a total of 13 conservation strips and the same number of control perimeters. Each of the 13 conservation strips were at least 10 x 200 ft and are placed at the edge of the crop field.
To establish the perennial plants, the land sites for these strips were cleared of weeds in the fall of 2008 and again in early spring of 2009. The methods of weed removal varied throughout the farms. One organic apple orchard used Berkshire hogs as a type of natural tiller to remove weeds in the conservation strips prior to sowing wildflower seeds. Other organic growers tilled the conservation strip areas and then sowed with a cover crop of oat seed. Conventional growers sprayed the conservation strip sites with broad-spectrum herbicide (glyphosate) to kill the weeds without the use of tilling.
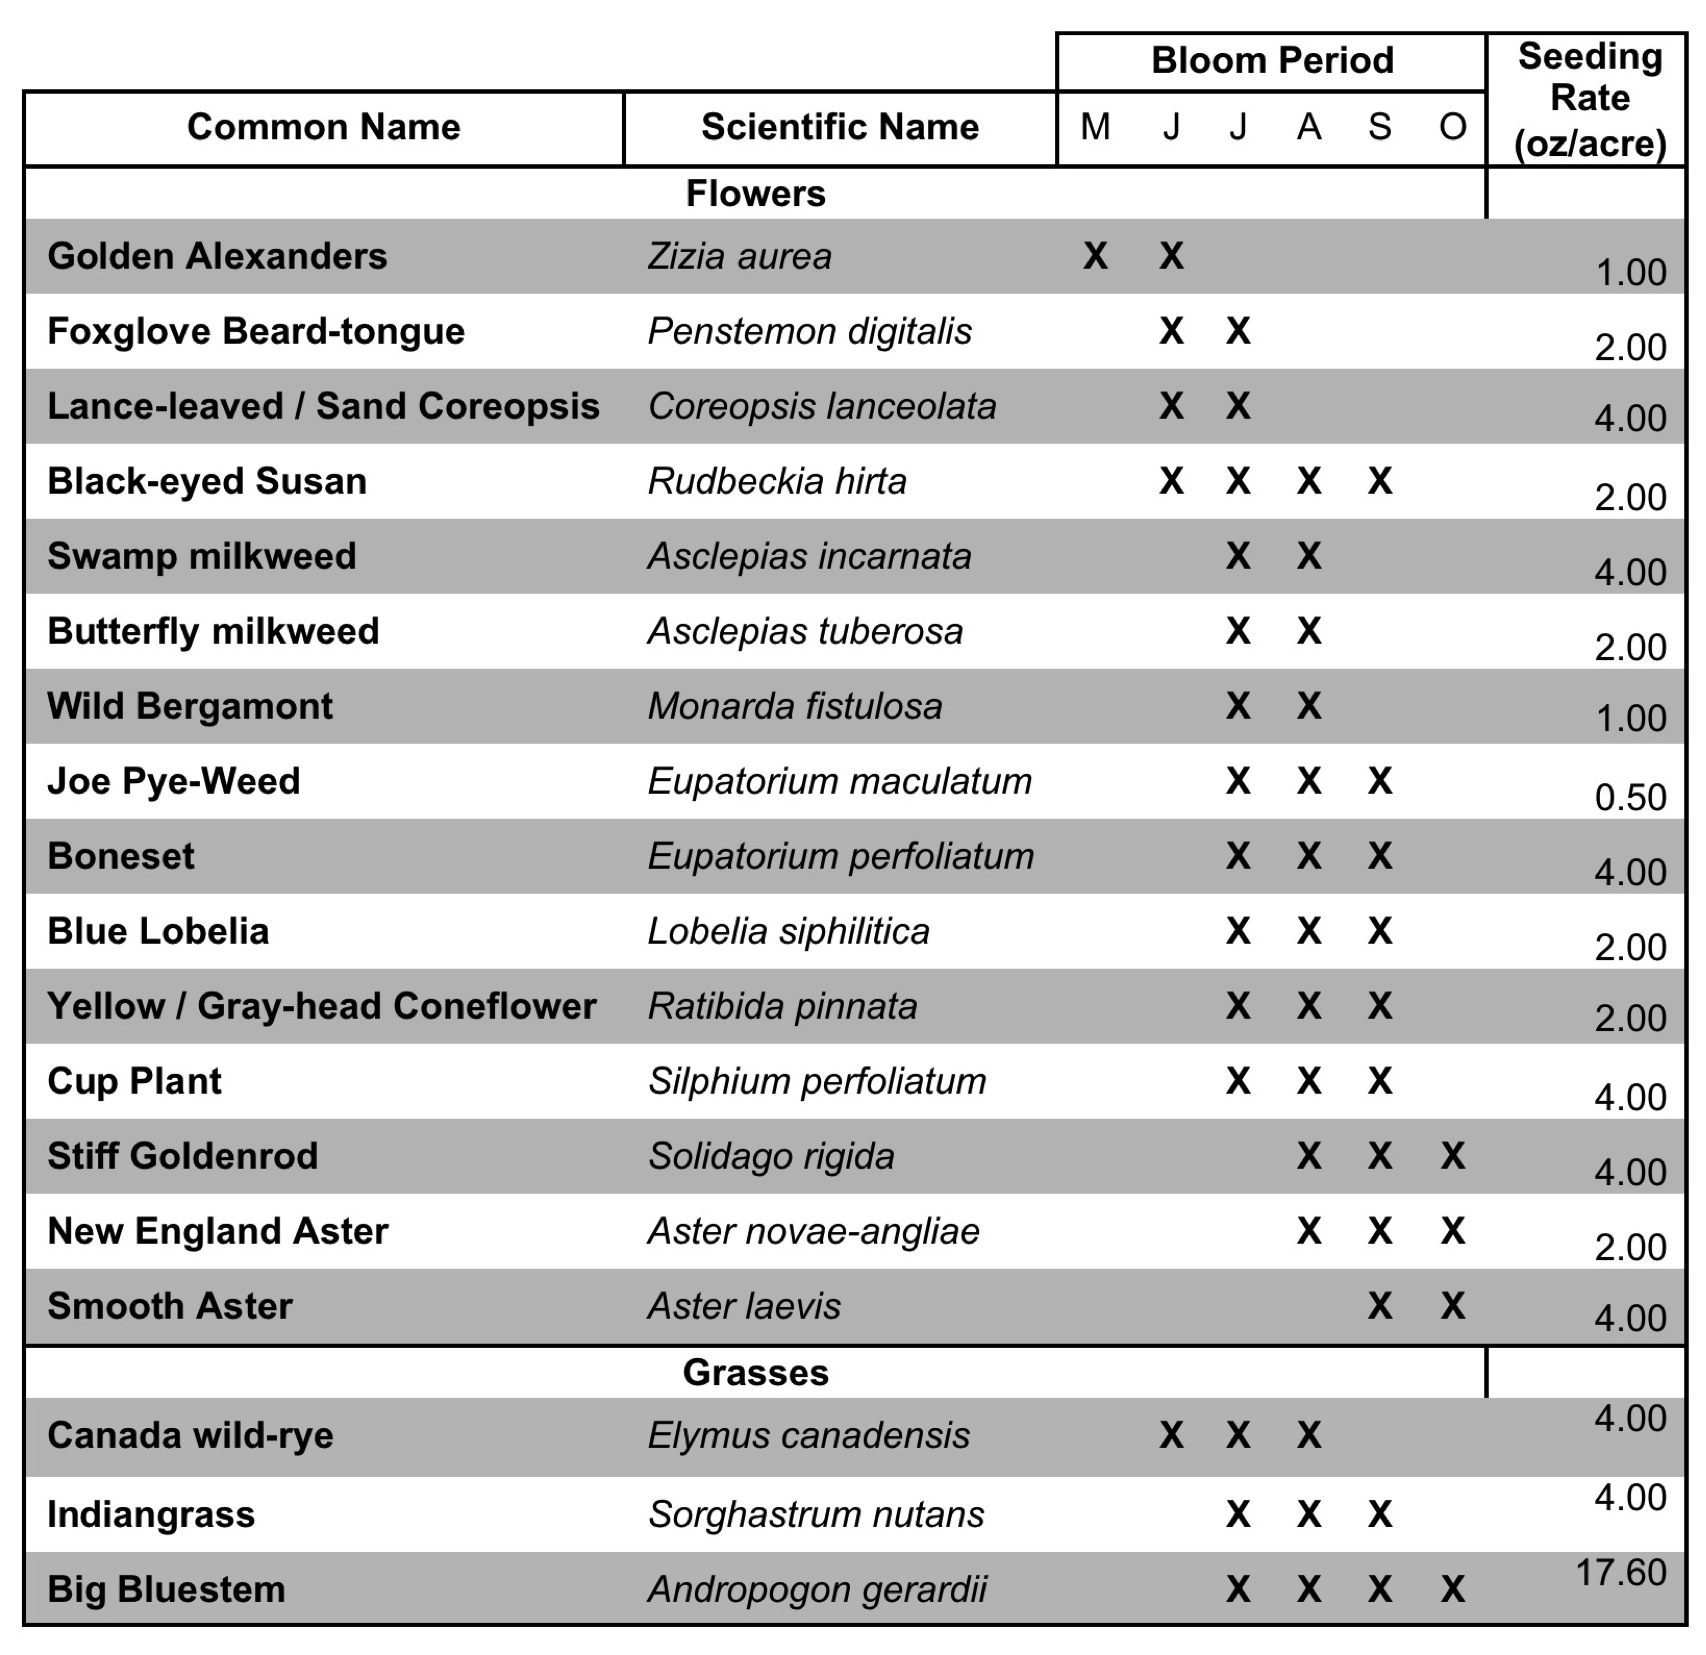
A perennial wildflower seed mix was selected that consisted of 15 species of Michigan native wildflowers with bloom periods that together spans the months of May through October (Table 1). To aid in competition with invasive plants and provide fuel for potential prescribed burnings, three Michigan native grass species were also included in the seed mix (Table 1). The perennial seed mix was hand-sown into the prepared conservation strip sites in early May of 2009 at a rate of two pounds of seed per acre, and the sites were then lightly raked, rolled, or “cultipacked” in order to maximize soil-seed contact. After monitoring the first year of wildflower growth, the seeding rate was deemed too small, so we sowed each site again in the spring of 2010 adding another two pounds of seed per acre, for a total of four pounds of seed per acre (Table 1).
Conservation strip maintenance and weed control was performed mechanically with monthly mowing of the sites. According to standard prairie plant establishment procedures in Michigan, the conservation strips were mowed (4-6 in height) two to three times per season with a brush hog or flail type mower during the first two years of establishment to prevent seed set by annual weed plants.
In years 2009 through 2011 to determine whether conservation strips lead to improved pollination within adjacent fields, compared to fields without this treatment, components of crop yield and the bee community were sampled in all fields involved in this project.
On two separate days during peak crop bloom, two 15-minute observations were made at each of the crop fields adjacent to the conservation and control strips. This was done by walking along the border of the crop field and then 15 m into the crop interior parallel to the border. The identity and number of bees were recorded during warm, calm, and sunny days between 10am and 5pm.
To measure pollination levels in each crop field, three flower clusters on each of 5 trees or bushes per location (border and interior) adjacent to conservation strips and control strips were tagged and three more flower clusters on each of the trees or bushes were enclosed with a fine mesh bag to exclude animal pollinators. The number of flowers tagged in the unbagged and bagged treatments were counted at the beginning of bloom. After bloom, prior to harvest the bagged and unbagged clusters were collected and the number of fruit that had set was counted to calculate percent fruit set. The collected fruit was weighed to determine average fruit weight and the number of mature seeds was counted to help evaluate pollination success. Because these plants are able to set fruit without the aid of insects, by comparing the difference of fruit set, fruit weight, and number of mature seeds between bagged and unbagged samples we were able estimate the magnitude of pollination done by insect pollinators.
Using the average percent fruit set, fruit weight, and an estimation of fruit per acre, we were able to calculate an estimation of crop yield comparing fields adjacent to conservation strips and those adjacent to control strips:
Estimated yield calculation = (% fruit set) * (berry weight in lbs) * (bushes per acre) * (flowers per bush)
We estimated 1210 bushes per acre and 3667 flowers per bush. Pollinator abundance and diversity and pollination parameters were each compared between the treatments using one-way analysis of variance, and/or appropriate non-parametric techniques (Kruskal-Wallis analysis).
In years 2009 through 2011 to determine the effect of conservation strips on insect natural enemies and herbivores in the crop fields, every two weeks from May through September, observational sampling was conducted along the crop border as well as 15 m into the interior of the crop fields that were adjacent to the conservation strips as well as those adjacent to control perimeters. Ten trees (for apple and cherry) or bushes (for blueberry) were selected along the crop border and the interior and observed for one minute per plant. All natural enemies and herbivores observed on each of the plants were recorded.
Further insect natural enemy and herbivore sampling was done with yellow sticky traps deployed for one week (middle of month) per month for five months (May, June, July, August, and September). Each of the crop fields adjacent to conservation strips fields adjacent to control perimeters received eight yellow sticky traps: four traps along the border and four along the interior (Figure 1). After one week deployed in the field the traps were collected and taken back to the laboratory for evaluation. Insects were identified to major taxonomic groups were compared between the areas with and without the conservation strip, using one-way analysis of variance, and/or appropriate non-parametric techniques (Kruskal-Wallis analysis).
Leafminer larvae. During the 2010 and 2011 growing seasons, large numbers of spotted tentiform leafminers were observed infesting leaves at our apple orchard sites. To determine how wildflower plantings affect biocontrol in crop fields, at the peak of infestation, between 50 and 100 infested leaves were collected from apple trees along the crop border as well as 15 m into the interior of the crop fields that were adjacent to the conservation strips as well as those adjacent to control perimeters (Figure 1). The leaves were brought back to the laboratory and the leafminer mines were dissected and evaluated for the presence of a parasitoid. Parasitization was compared between the samples collected adjacent to the conservation strips and those collected adjacent to the control perimeters using the Kruskal-Wallis analysis.
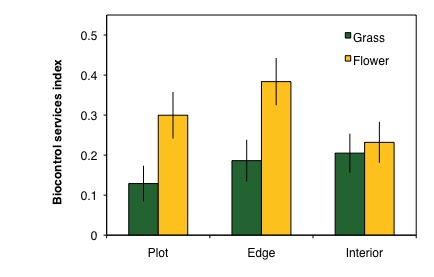
Corn earworm eggs. In 2011 as another approach to determine how wildflower plantings affect biocontrol in crop fields we used sentinel corn earworm eggs (Lepidoptera) as a prey item. Although corn earworms are not pests of blueberries, eggs were killed by freezing to ensure that they would not hatch or pose a threat to the crop. The eggs were glued onto cardstock squares and deployed only at the five blueberry farms that have established conservation plantings. Two egg cards were placed at three positions: in the wildflower planting, along the border of the crop field, and 15 m into the interior of the crop field (Figure 1). Egg cards were also placed at the three corresponding positions in crop fields adjacent to the control perimeter.
We measured biocontrol services by comparing egg damage/removal before being placed into the field with the egg damage/removal after being in the field exposed to natural enemies for four days. The number of damaged or missing eggs was used to calculate the biocontrol services index (BSI):
(see attached equation)
The resulting BSI value ranges from 0-1, with values increasing as the level of predation increases. Ec = the number of eggs prior to being in the field, Eo = the number of eggs remaining in the open treatment after four days, p = plot, and n = the number of replicates. BSI values were compared between cards placed in blueberry fields adjacent to conservation strips and cards in fields adjacent to control perimeters. This experiment was conducted three times during the summer, in early June, July, and August.
To determine if biocontrol of corn earworm eggs is higher in blueberry fields adjacent to conservation strips than in fields adjacent to control perimeters, data from the three months of sampling were pooled and the medians of the BSI values were compared among treatments using the Kruskal-Wallis analysis.
To aid in understanding the overall cost of conservation strip establishment, all the expenses involved in establishment, including site preparation, wildflower seeds and subsequent sowing, and site maintenance, were measured over the three-year period of this project. This was done with a yearly questionnaire sent to all the growers involved with this project, asking what expenses they had encountered during the previous growing season relating to the conservation strips.
- Figure 1. Layout of typical sampling locations at one of our fruit farms with conservation strip and a grass control perimeter.
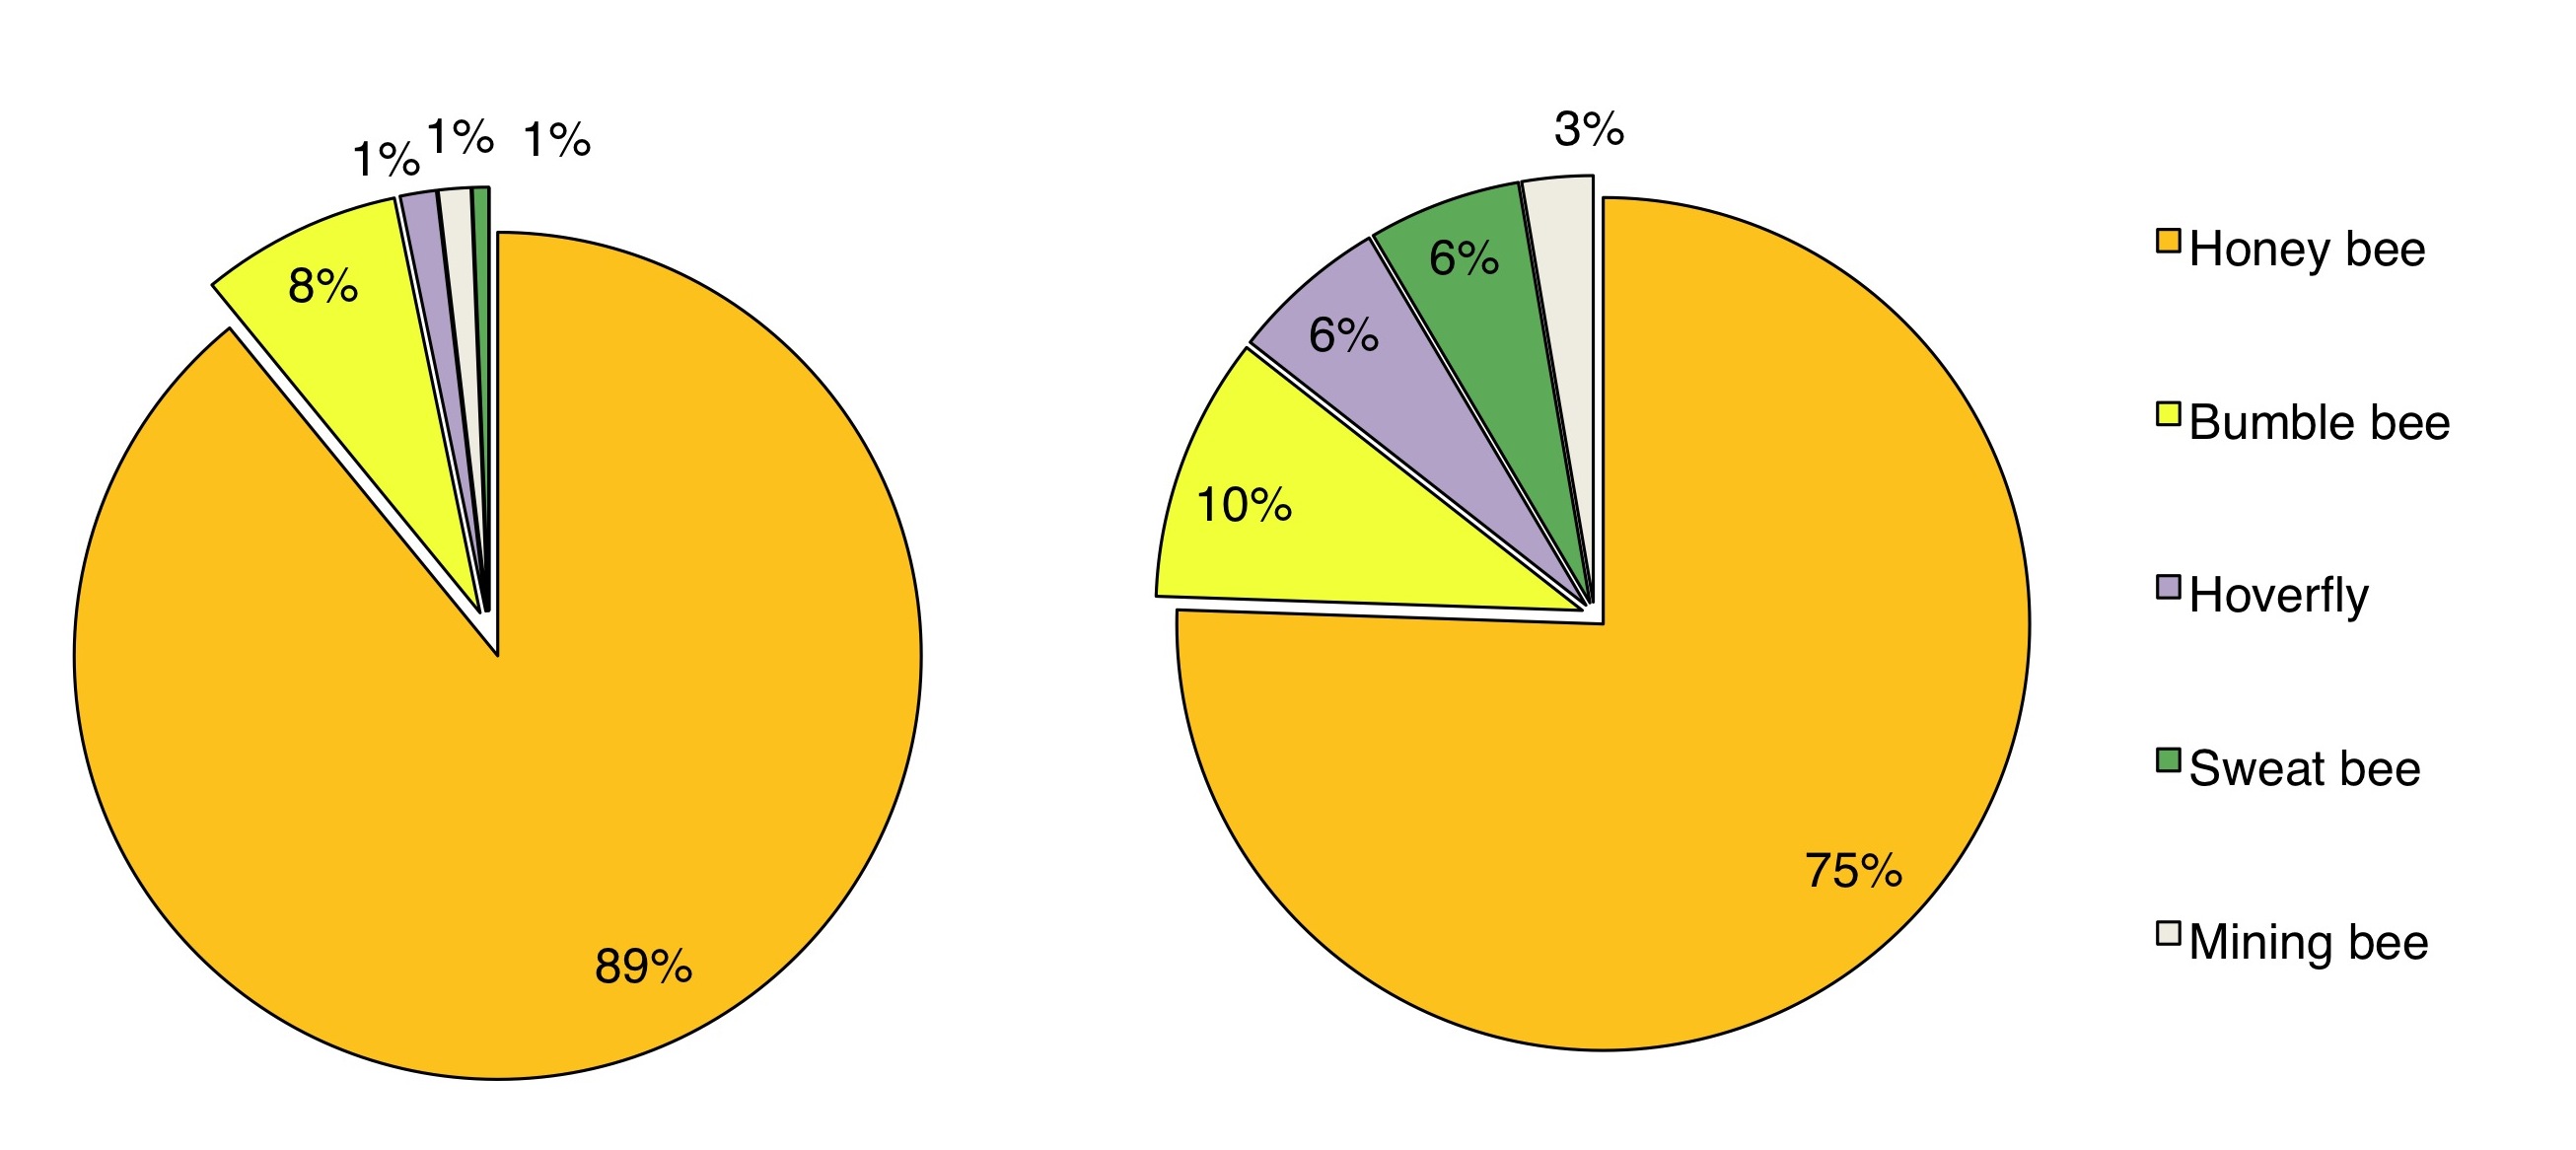
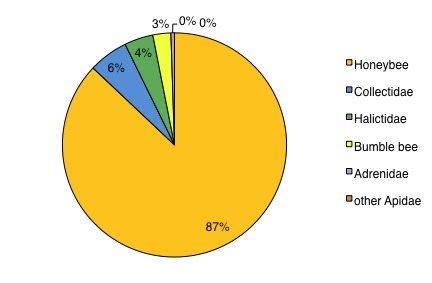
- Figure 4. Observed pollinator community. The proportion of native bees observed visiting crop flowers in blueberry fields has increased since 2009.
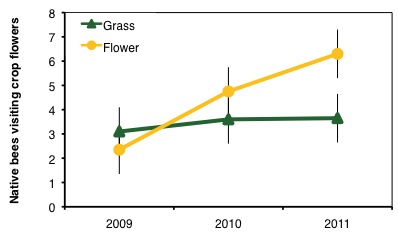
- Figure 5. The abundance of native bees observed visiting blueberry flowers during bloom increased over time in fields adjacent to wildflower plantings.
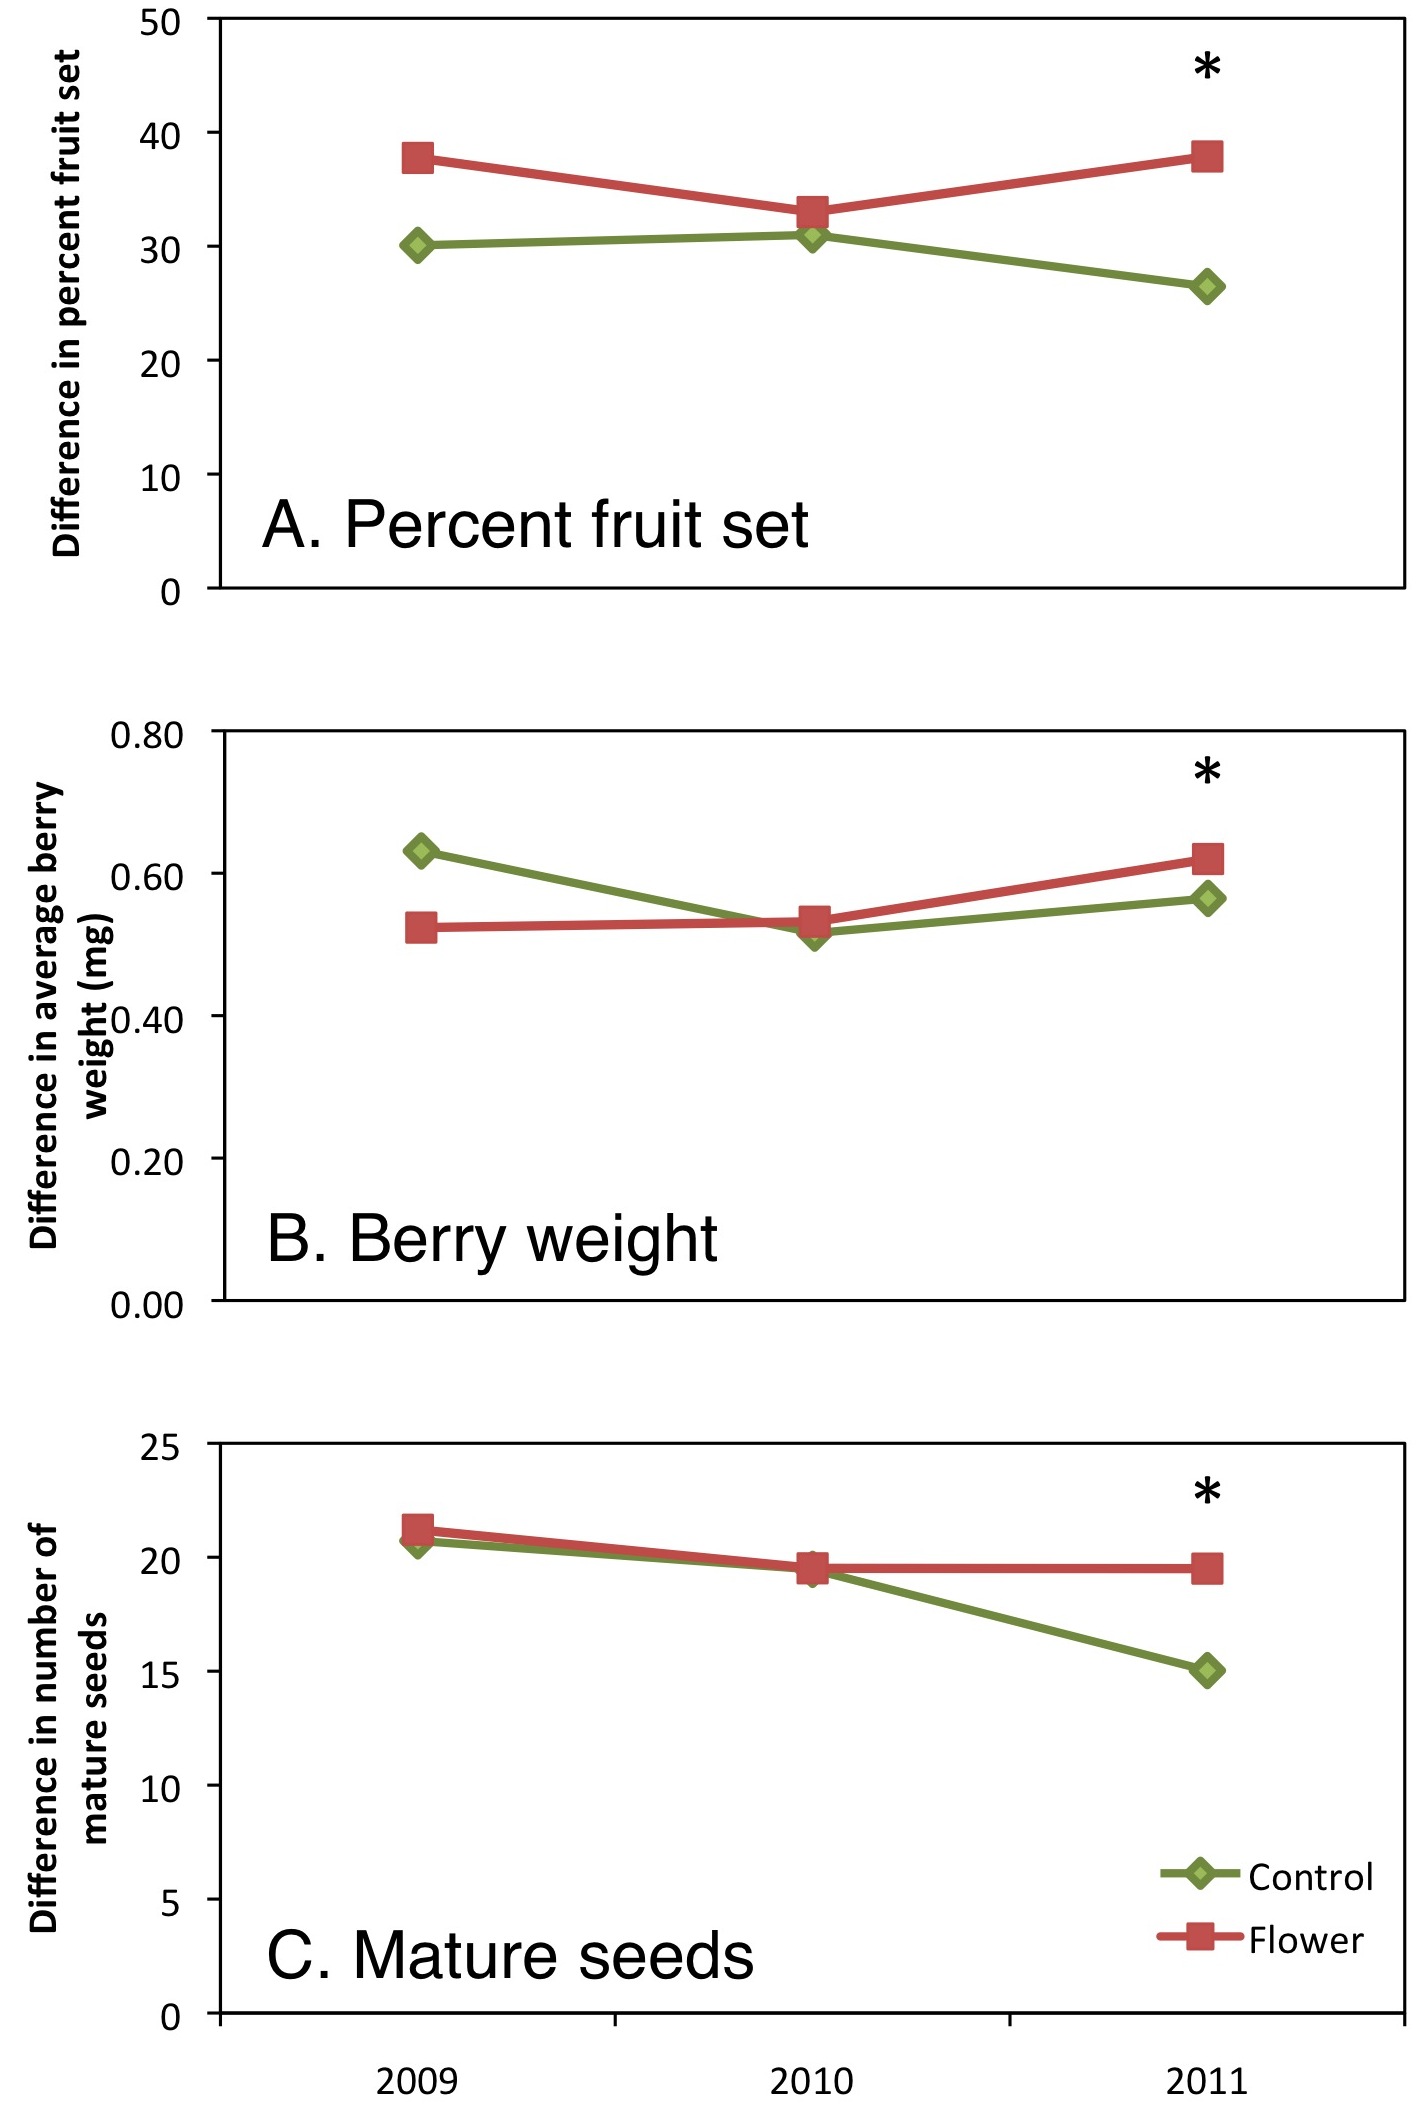
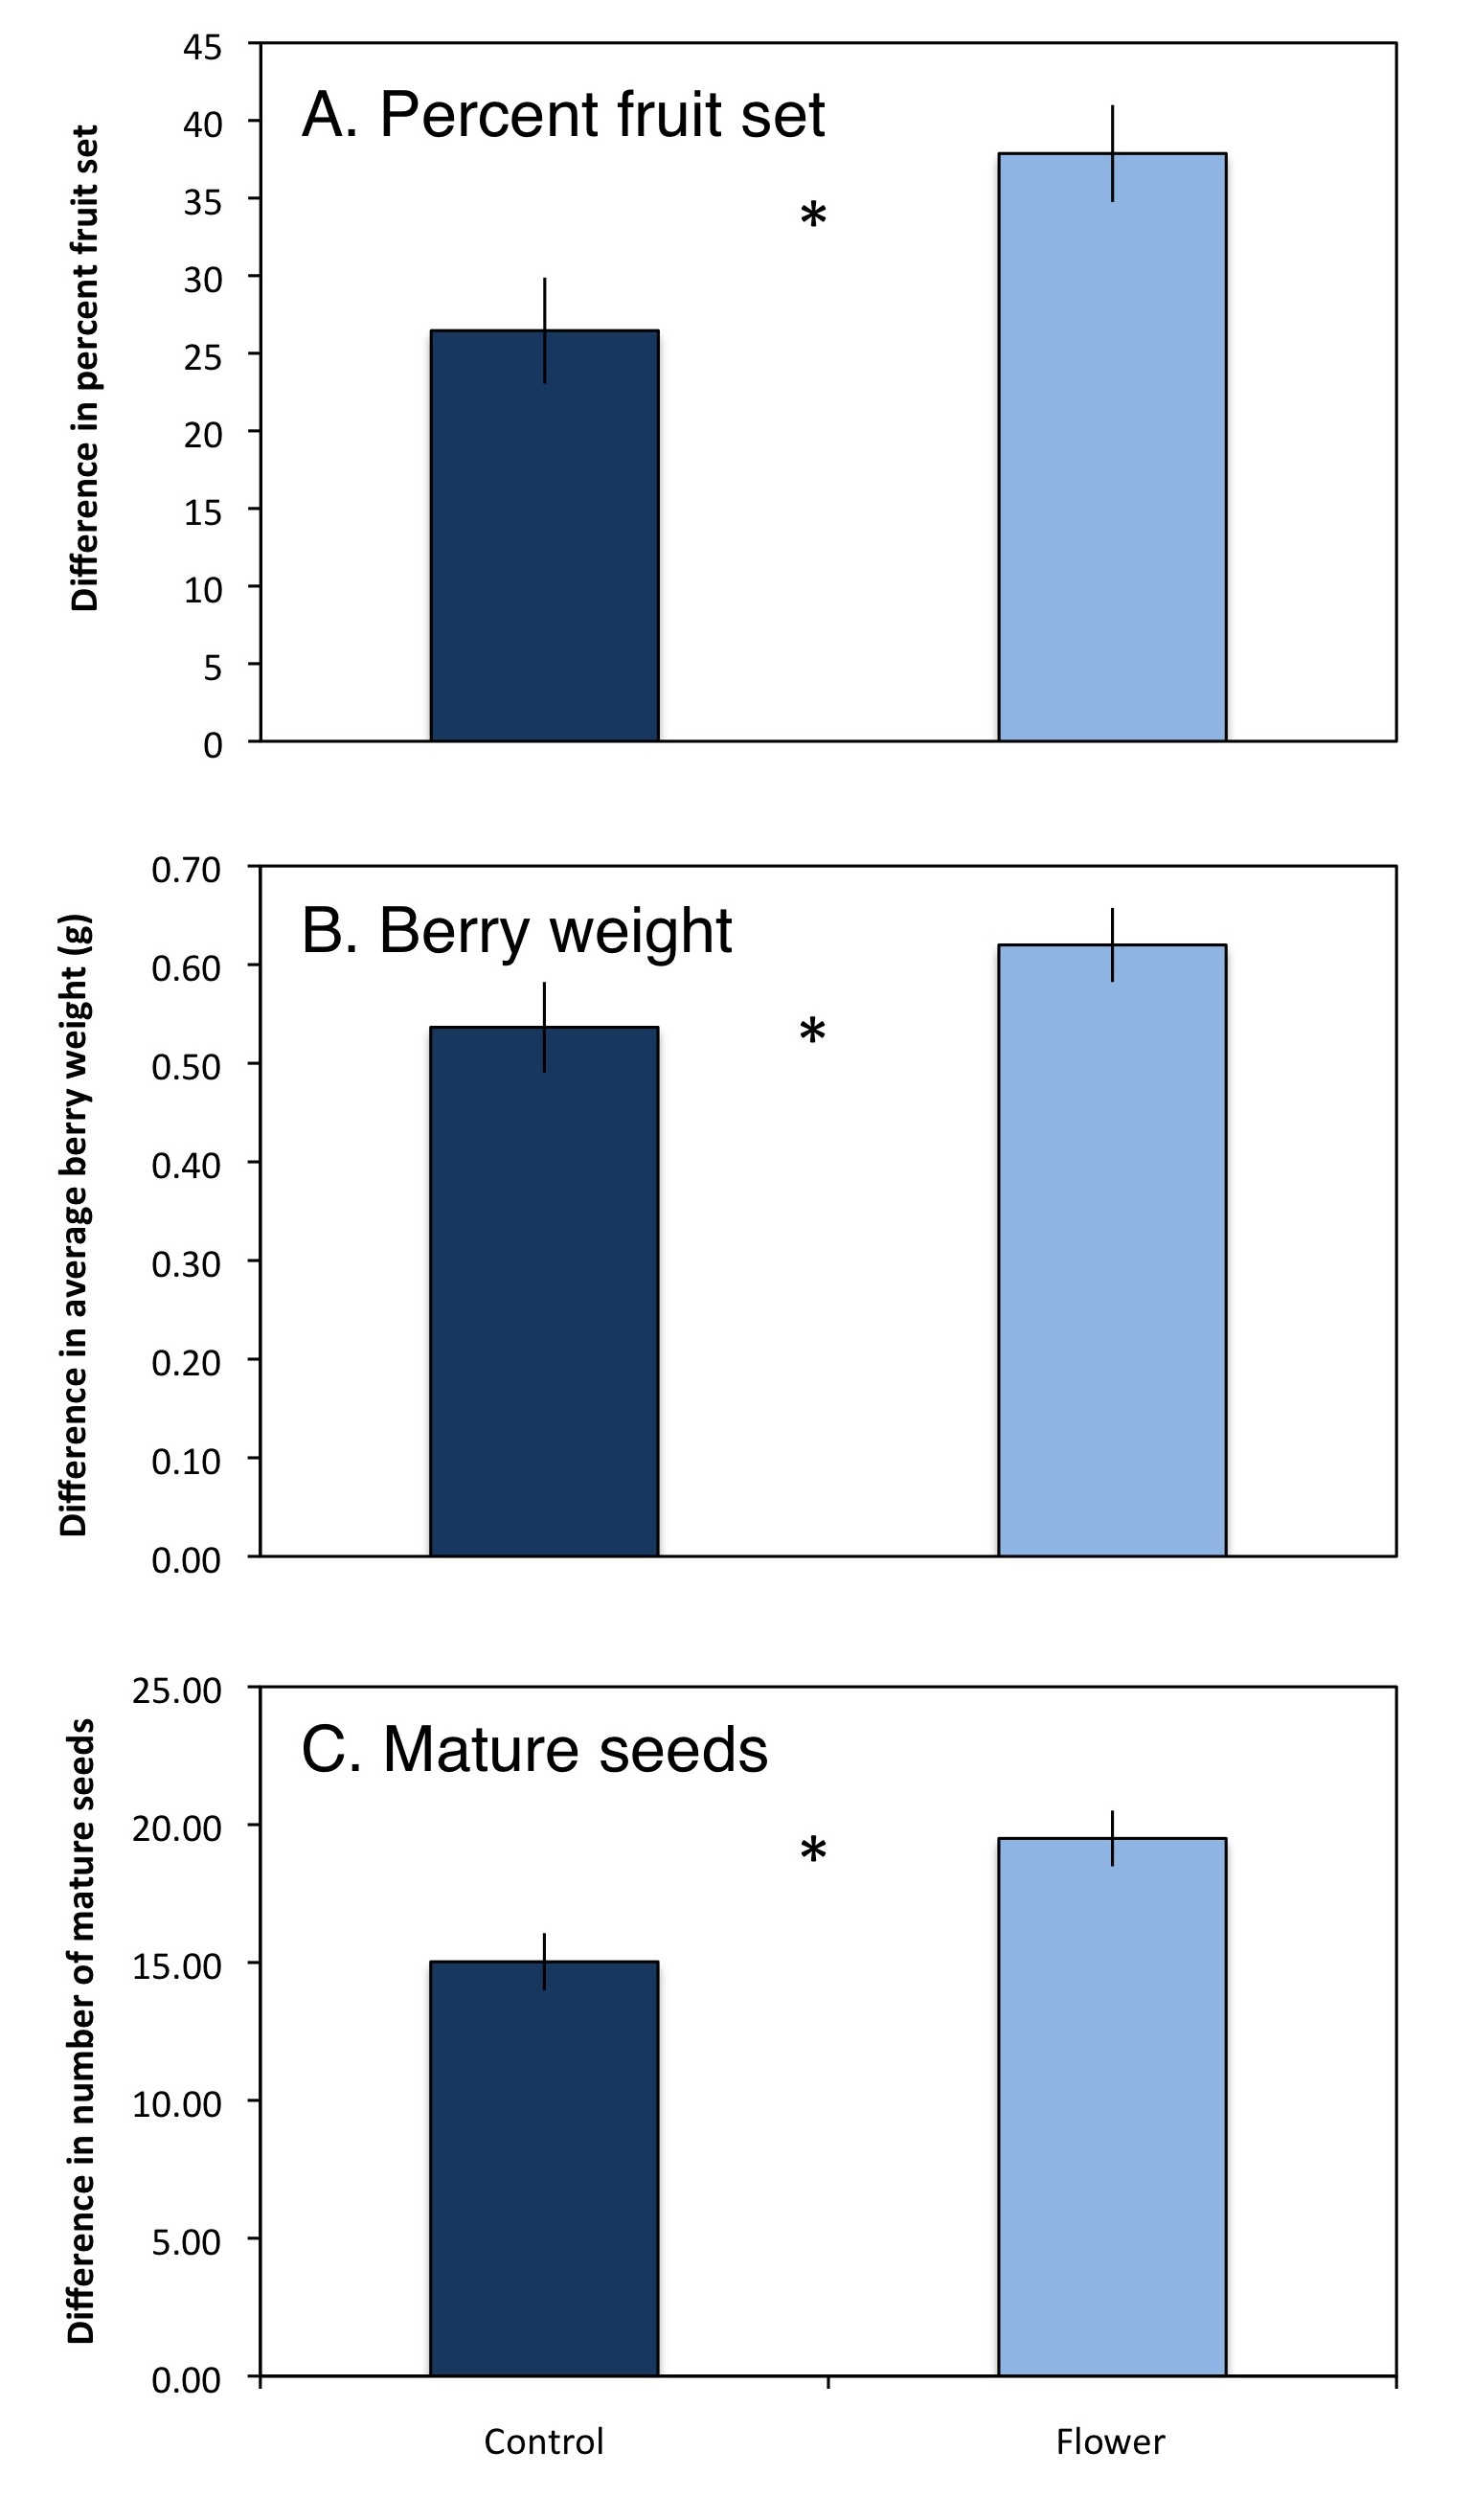
- Figure 7. Change in pollination parameters due to insect pollinators over a three-year period; A) percent fruit set, B) average berry weight, and C) average mature seeds per berry. An asterisk indicates a significant difference between control and flower treatments.
- Figure 8. In 2011 the predicted blueberry yield was higher in blueberry fields adjacent to conservation plantings.
- Figure 9. Top ten most abundant natural enemies observed in blueberry fields in 2011.
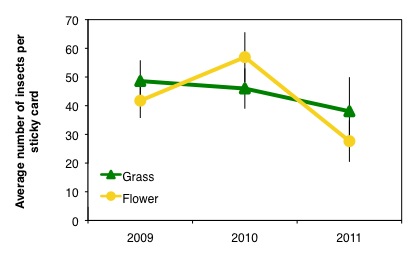
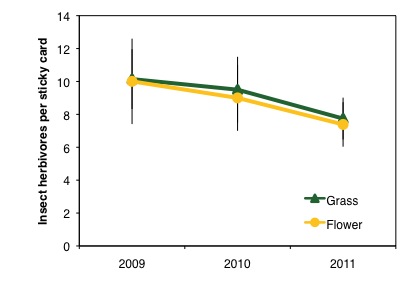
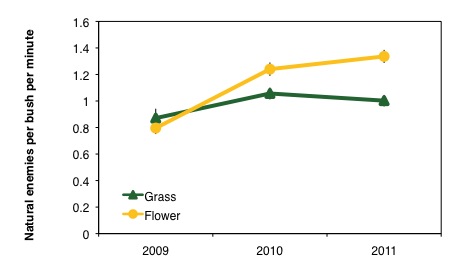
- Figure 11. The average number of insect natural enemies collected on sticky cards in fields adjacent to conservation strips (Flower) and control perimeters (Grass) over a three-year period.
- Figure 12. Top ten most abundant insect herbivores observed in blueberry fields in 2011.
- Figure 14. The average number of insect herbivores collected on sticky cards in fields adjacent to conservation strips (Flower) and control perimeters (Grass) over a three-year period.
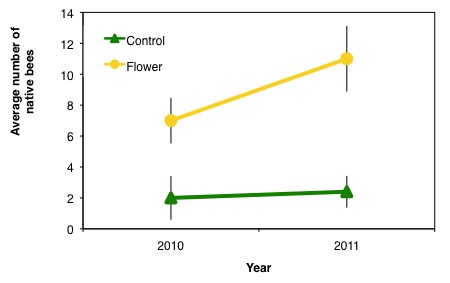
- Figure 15. The average number of native bees collected per 30-second suction sample from conservation strips (Flower) and control perimeters (Control) over a two year period.
- Figure 18. Biocontrol of corn earworm eggs was higher in wildflower plantings and in blueberry fields adjacent to wildflower plantings.
- Figure 19. Observed pollinator community in 2011.
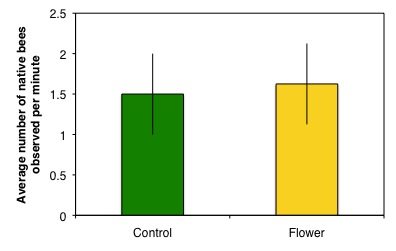
- Figure 20. The average number of native bees observed visiting cherry flowers per minute in 2011.
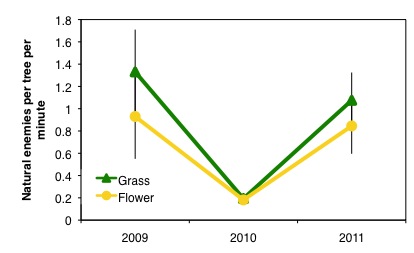
- Figure 22. The abundance of insect natural enemies observed in cherry fields adjacent to conservation strips (Flower) and control perimeters (Grass) over a three-year period.
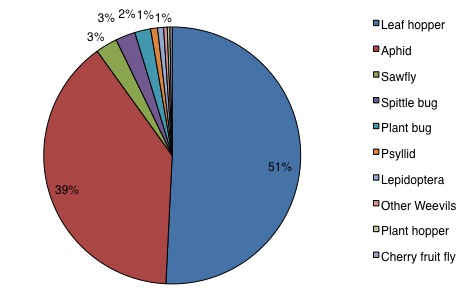
- Figure 24. Top ten herbivores collected in cherry fields in 2011.
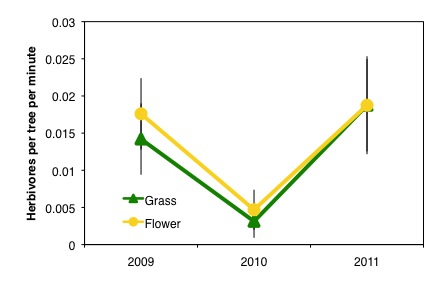
- Figure 25. The abundance of insect herbivores observed in cherry fields adjacent to conservation strips (Flower) and control perimeters (Grass) over a three-year period.
- Figure 27. Observed pollinator community. The proportion of native bees observed visiting crop flowers in apple orchards has increased since 2009.
- Figure 30. Top ten natural enemies observed in apple orchards in 2011.
- Figure 31. The abundance of insect natural enemies observed in apple orchards adjacent to conservation strips (Flower) and control perimeters (Grass) over a three-year period.
- Figure 36. Parasitism of leafminer larvae in apple orchards was higher in trees adjacent to wildflower plantings.
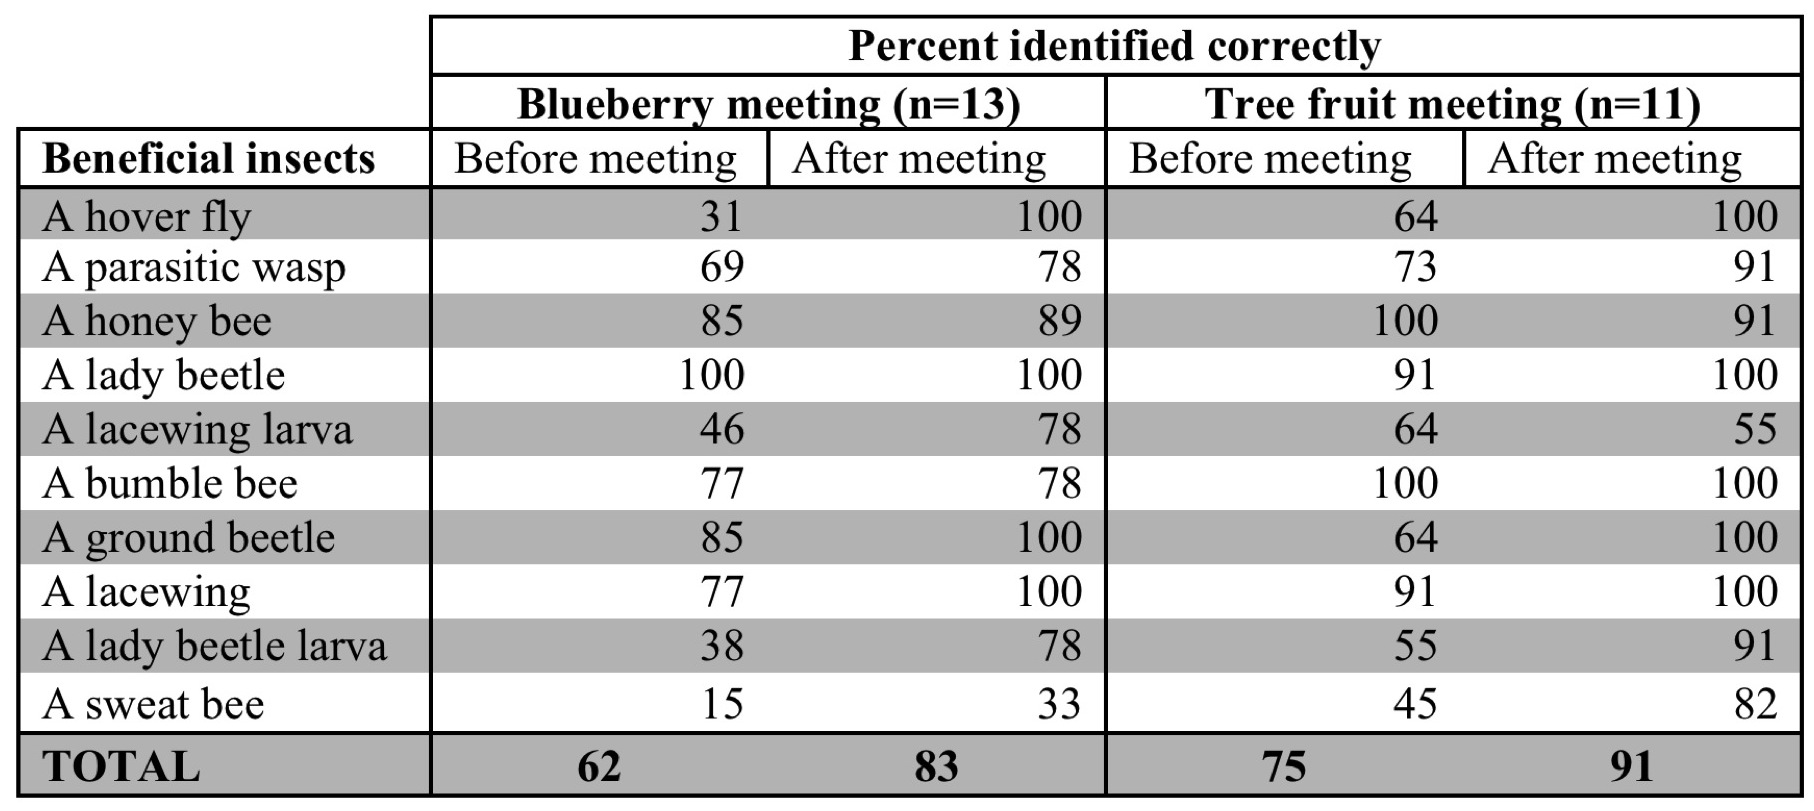
- Table 4. Questionnaire results taken at the 2010 summer field days showing an increase in ability of participants to correctly identify beneficial insects.
- Equation: Biocontrol services index
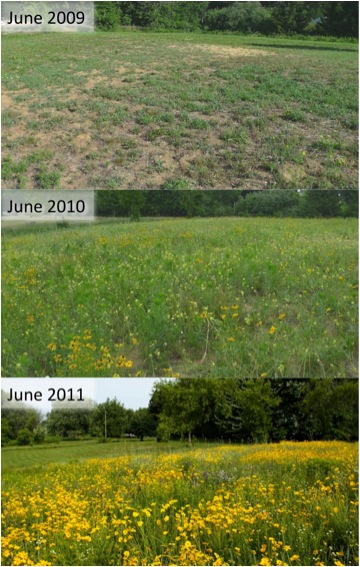
- Figure 2. Wildflower establishment over the duration of this project.
- Table 2. Comparison of the changes (un-bagged-bagged) in pollination parameters for control and flower treatments over a three-year period.
- Figure 26. The average number of insect herbivores collected on sticky cards in fields adjacent to conservation strips (Flower) and control perimeters (Grass) over a three-year period. There was no significant difference in fields adjacent to wildflower plantings and those with typical field perimeters.
- Figure 28. The average number of native bees collected on sticky cards in fields adjacent to conservation strips (Flower) and control perimeters (Grass) over a three-year period.
- Figure 34. The abundance of insect herbivores observed in apple orchards adjacent to conservation strips (Flower) and control perimeters (Grass) over a three-year period.
- Table 3. Summary of questionnaire results taken at grower meetings throughout the duration of this project.
- Table 1. Native wildflower and seed mix with bloom period and seeding rate.
- Figure 3. Wildflower planting establishment costs over a three-year period.
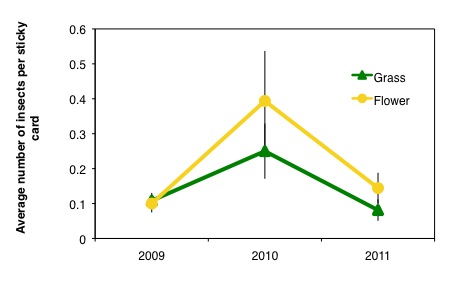
- Figure 13. The abundance of insect herbivores observed on blueberry bushes did not increase over time in crop fields adjacent to wildflower plantings.
- Figure 16. The diversity of native bee groups collected per 30-second suction sample from conservation strips (Flower) and control perimeters (Control) over a two year period.
- Figure 33. Top ten insect herbivores observed in apple orchards in 2011.
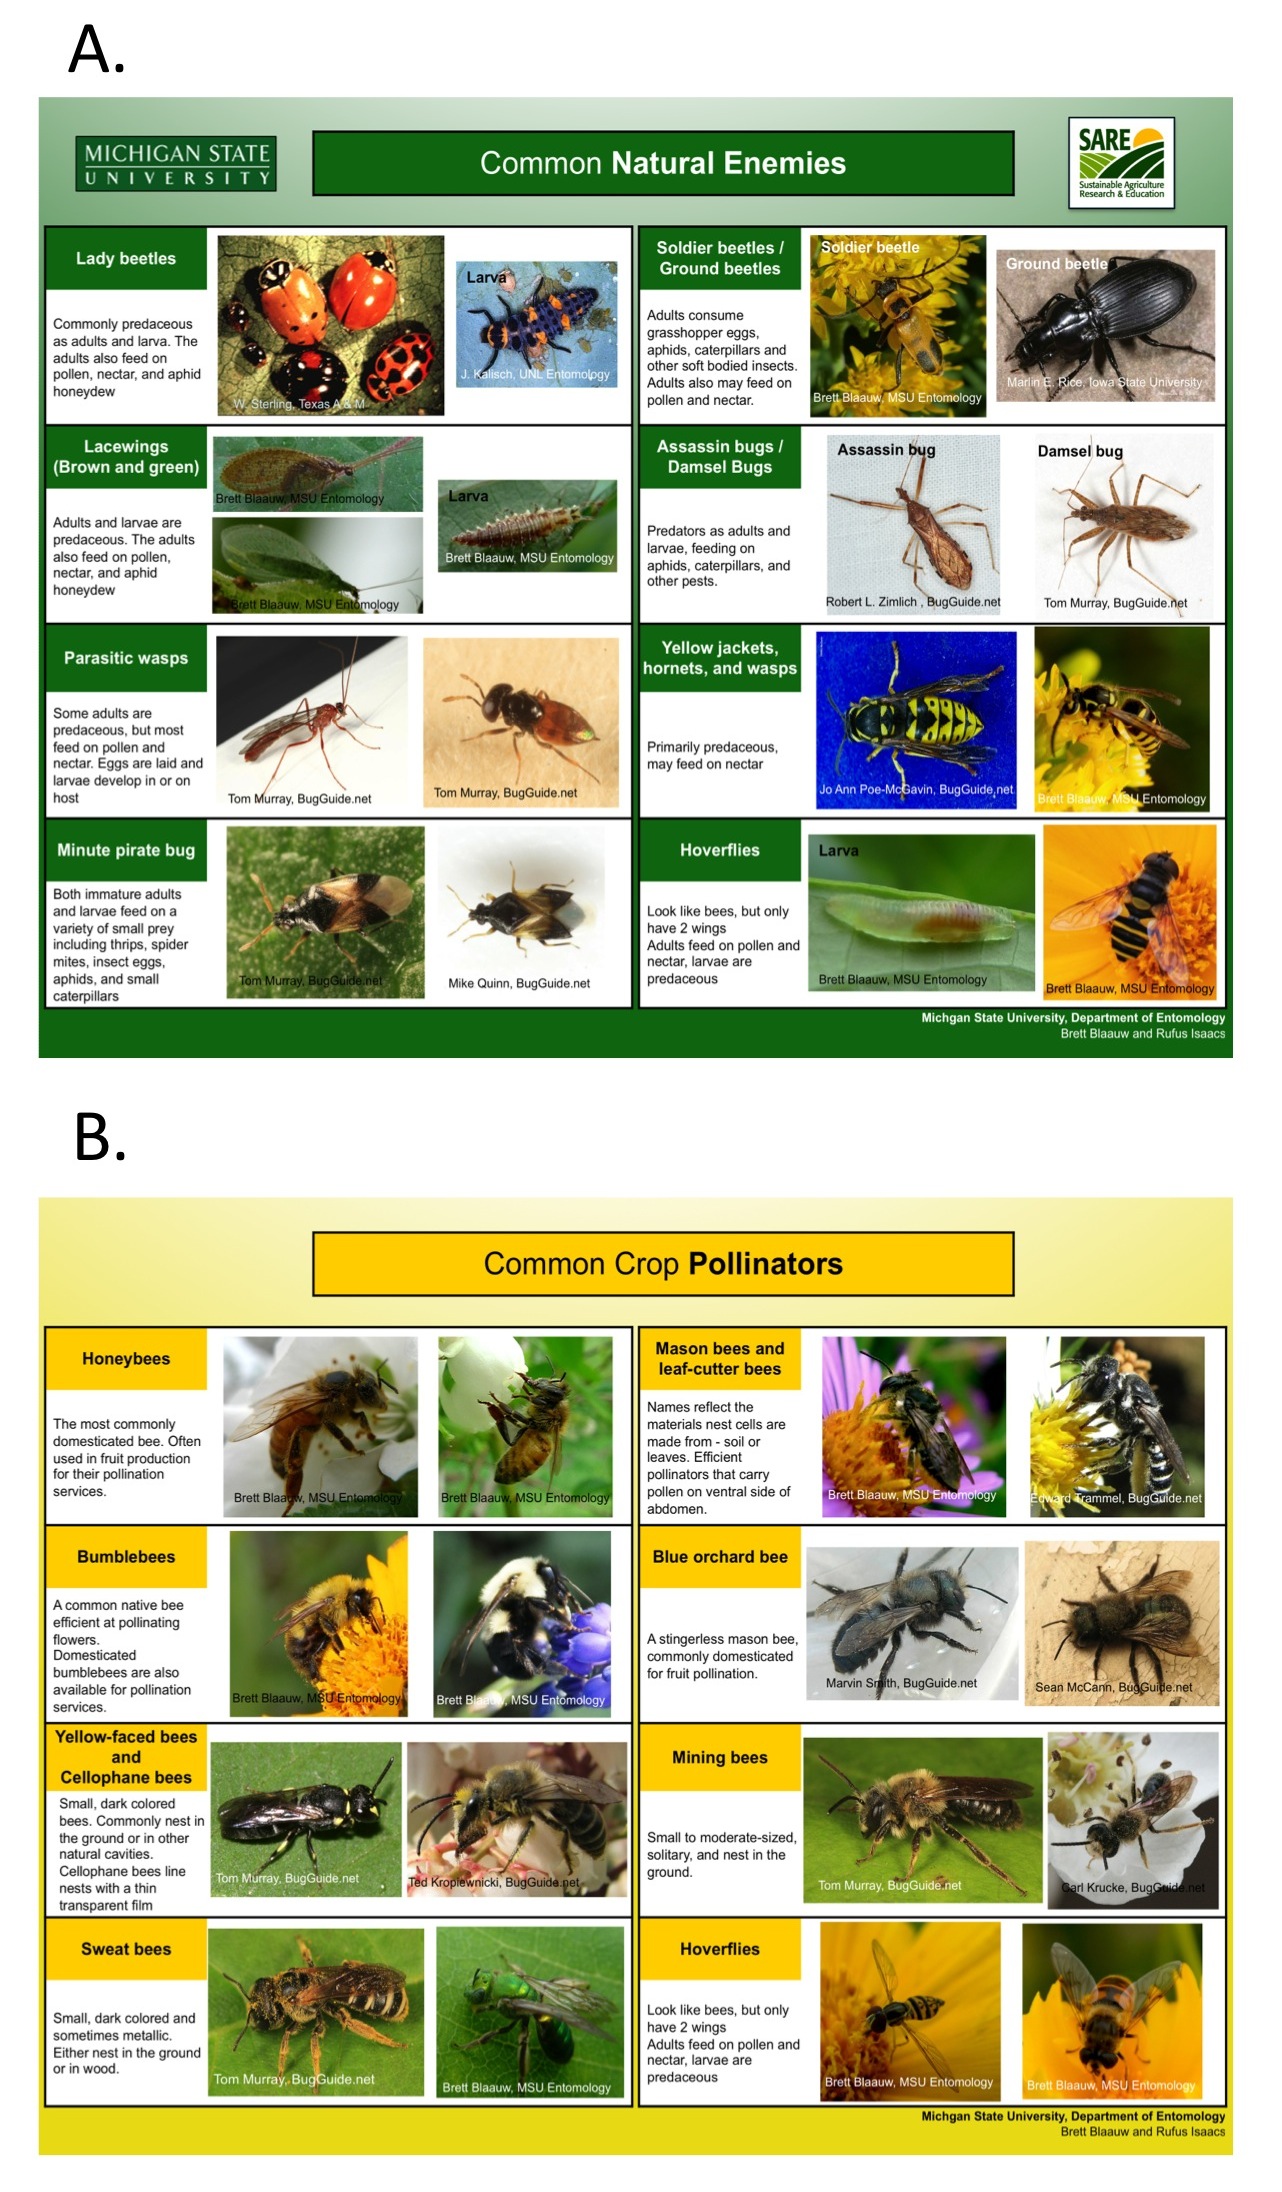
- Figure 38. Beneficial insect guide given to growers and extension meetings, depicting common A) insect natural enemies and B) crop pollinators that growers are likely to observe on their farms.
- Figure 6. Change in pollination parameters due to insect pollinators; A) percent fruit set, B) average berry weight, and C) average mature seeds per berry. An asterisk indicates a significant difference between control and flower treatments.
- Figure 10. The abundance of natural enemies observed in blueberry bushes throughout the growing season increased over time in crop fields adjacent to wildflower plantings.
- Figure 17. The average number of insect natural enemies collected per 30-second suction sample from conservation strips (Flower) and control perimeters (Control) over a two year period.
- Figure 21. Top ten natural enemies collected in cherry fields in 2011.
- Figure 23. The average number of insect natural enemies collected on sticky cards in fields adjacent to conservation strips (Flower) and control perimeters (Grass) over a three-year period.
- Figure 29. Change in pollination parameters due to insect pollinators in 2011; A) percent fruit set and B) average fruit weight.
- Figure 35. The average number of insect herbivores collected on sticky cards in fields adjacent to conservation strips (Flower) and control perimeters (Grass) over a three-year period.
- Figure 37. Example of an informational project sign placed at wildflower plantings and designed for our grower cooperators as an introduction to the project for visitors to the farm.
Blueberry:
Effect on pollinators and pollination.
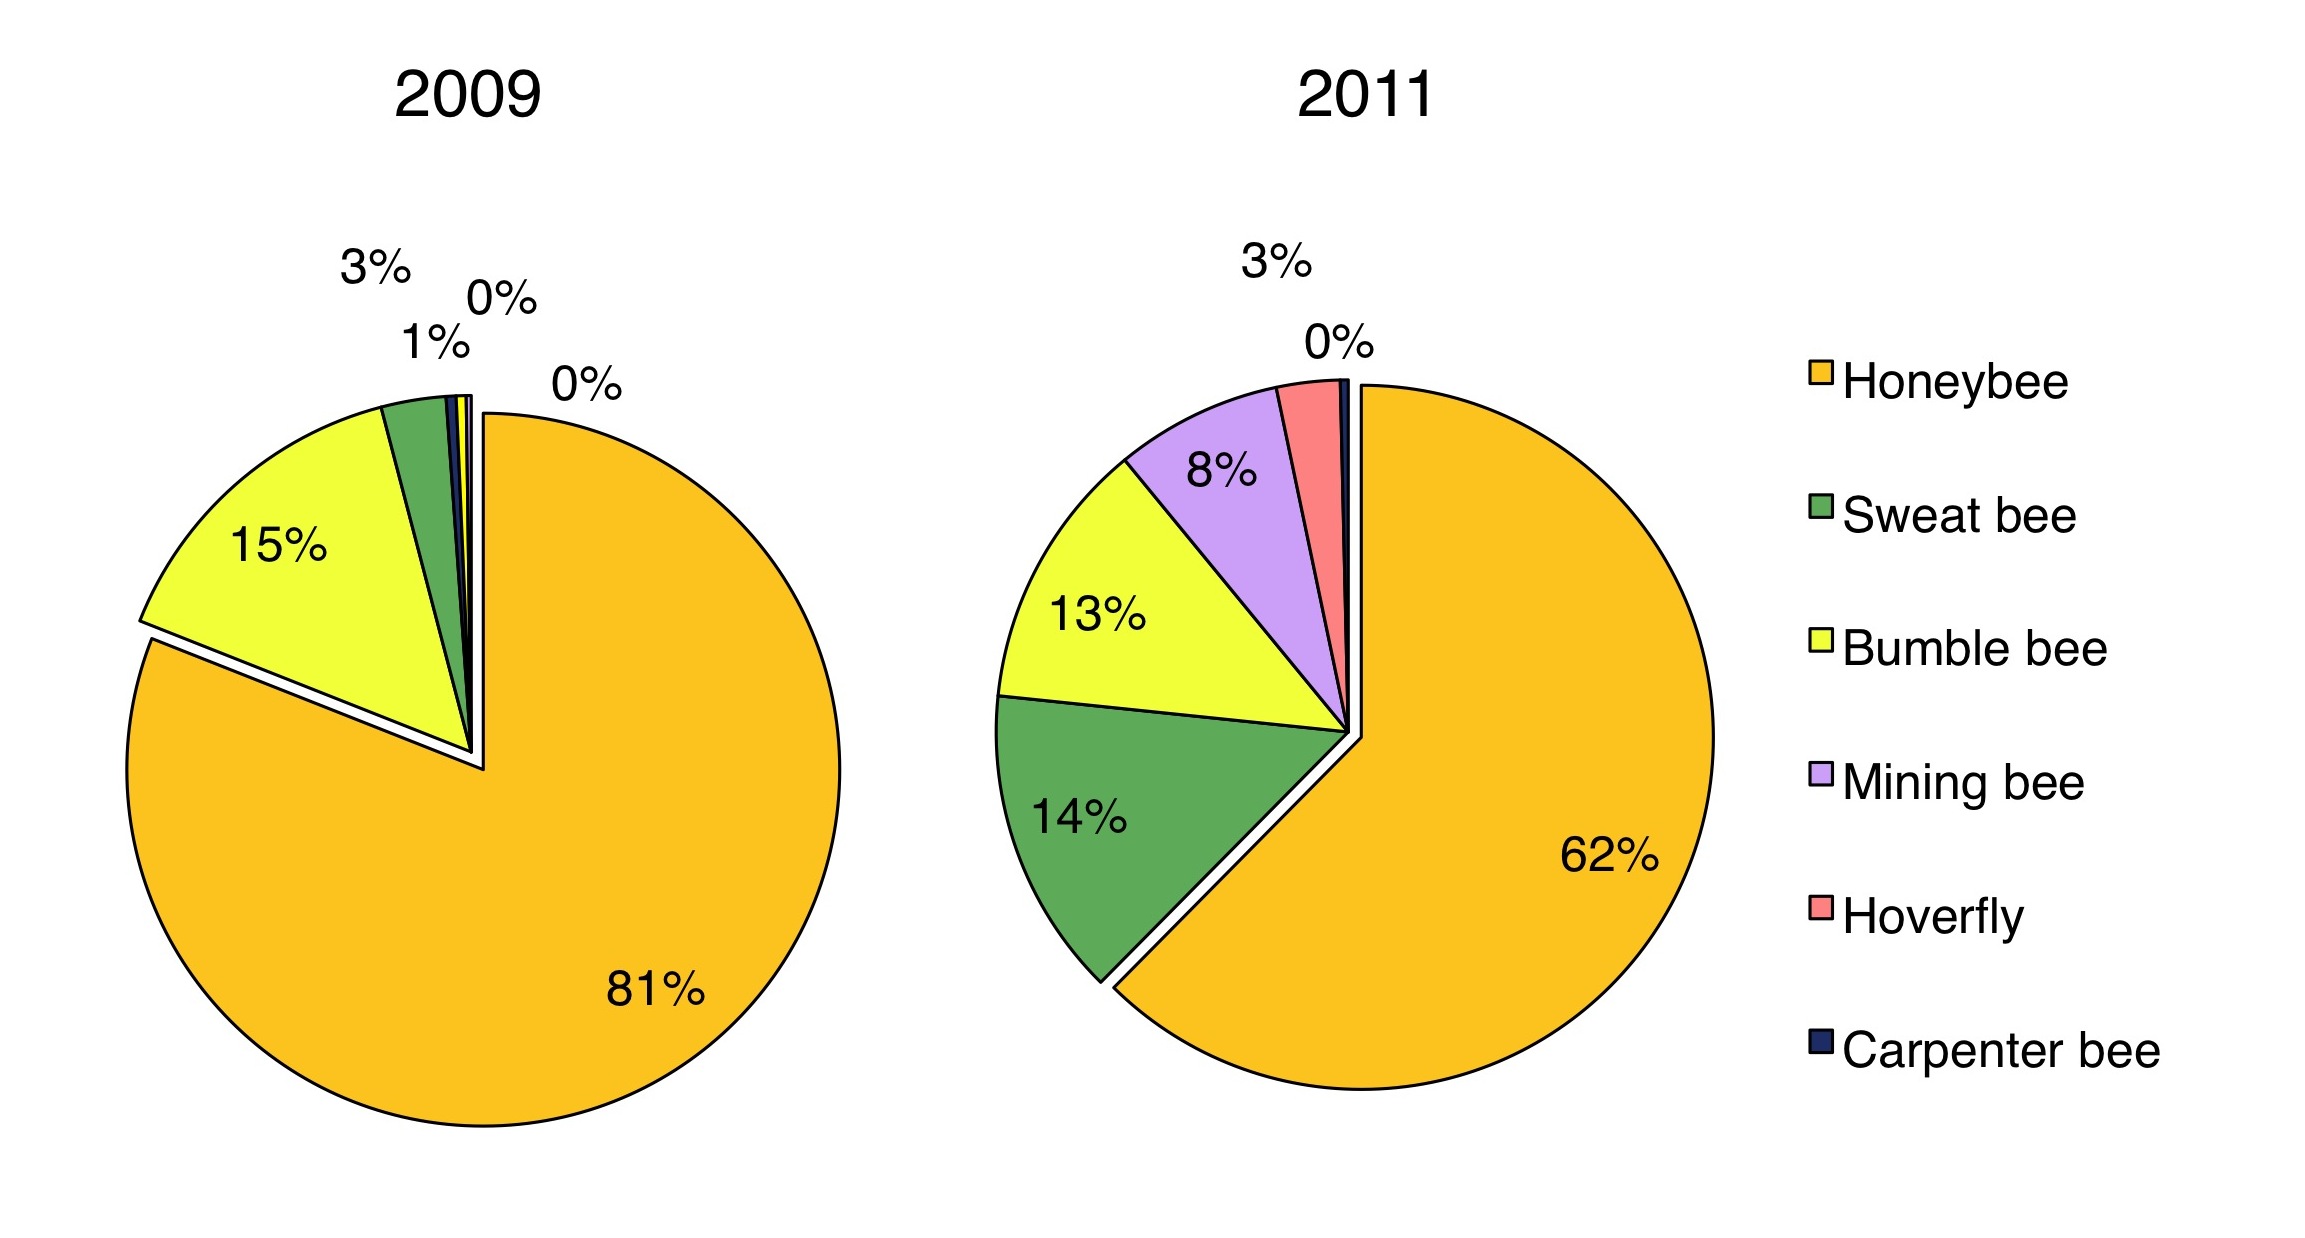
Timed observations were made at each of the crop fields adjacent to the conservation strips and the control perimeters, recording the identity and number of flower-visiting insects (bees, flies, wasps, etc.) to determine how conservation strips affect pollinators in agricultural landscapes. Compared to the 2009 results, in 2011 at blueberry fields we observed a higher proportion of native bees visiting crop flowers (Figure 4). Comparing over a three-year period, the abundance of native bees observed visiting blueberry flowers was significantly higher in crop fields adjacent to conservation plantings in 2011 (Figure 5; ?2 = 8.24, p = 0.0041).
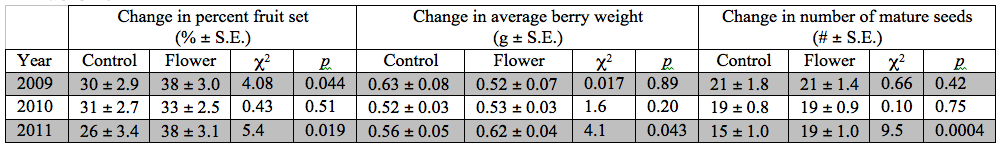
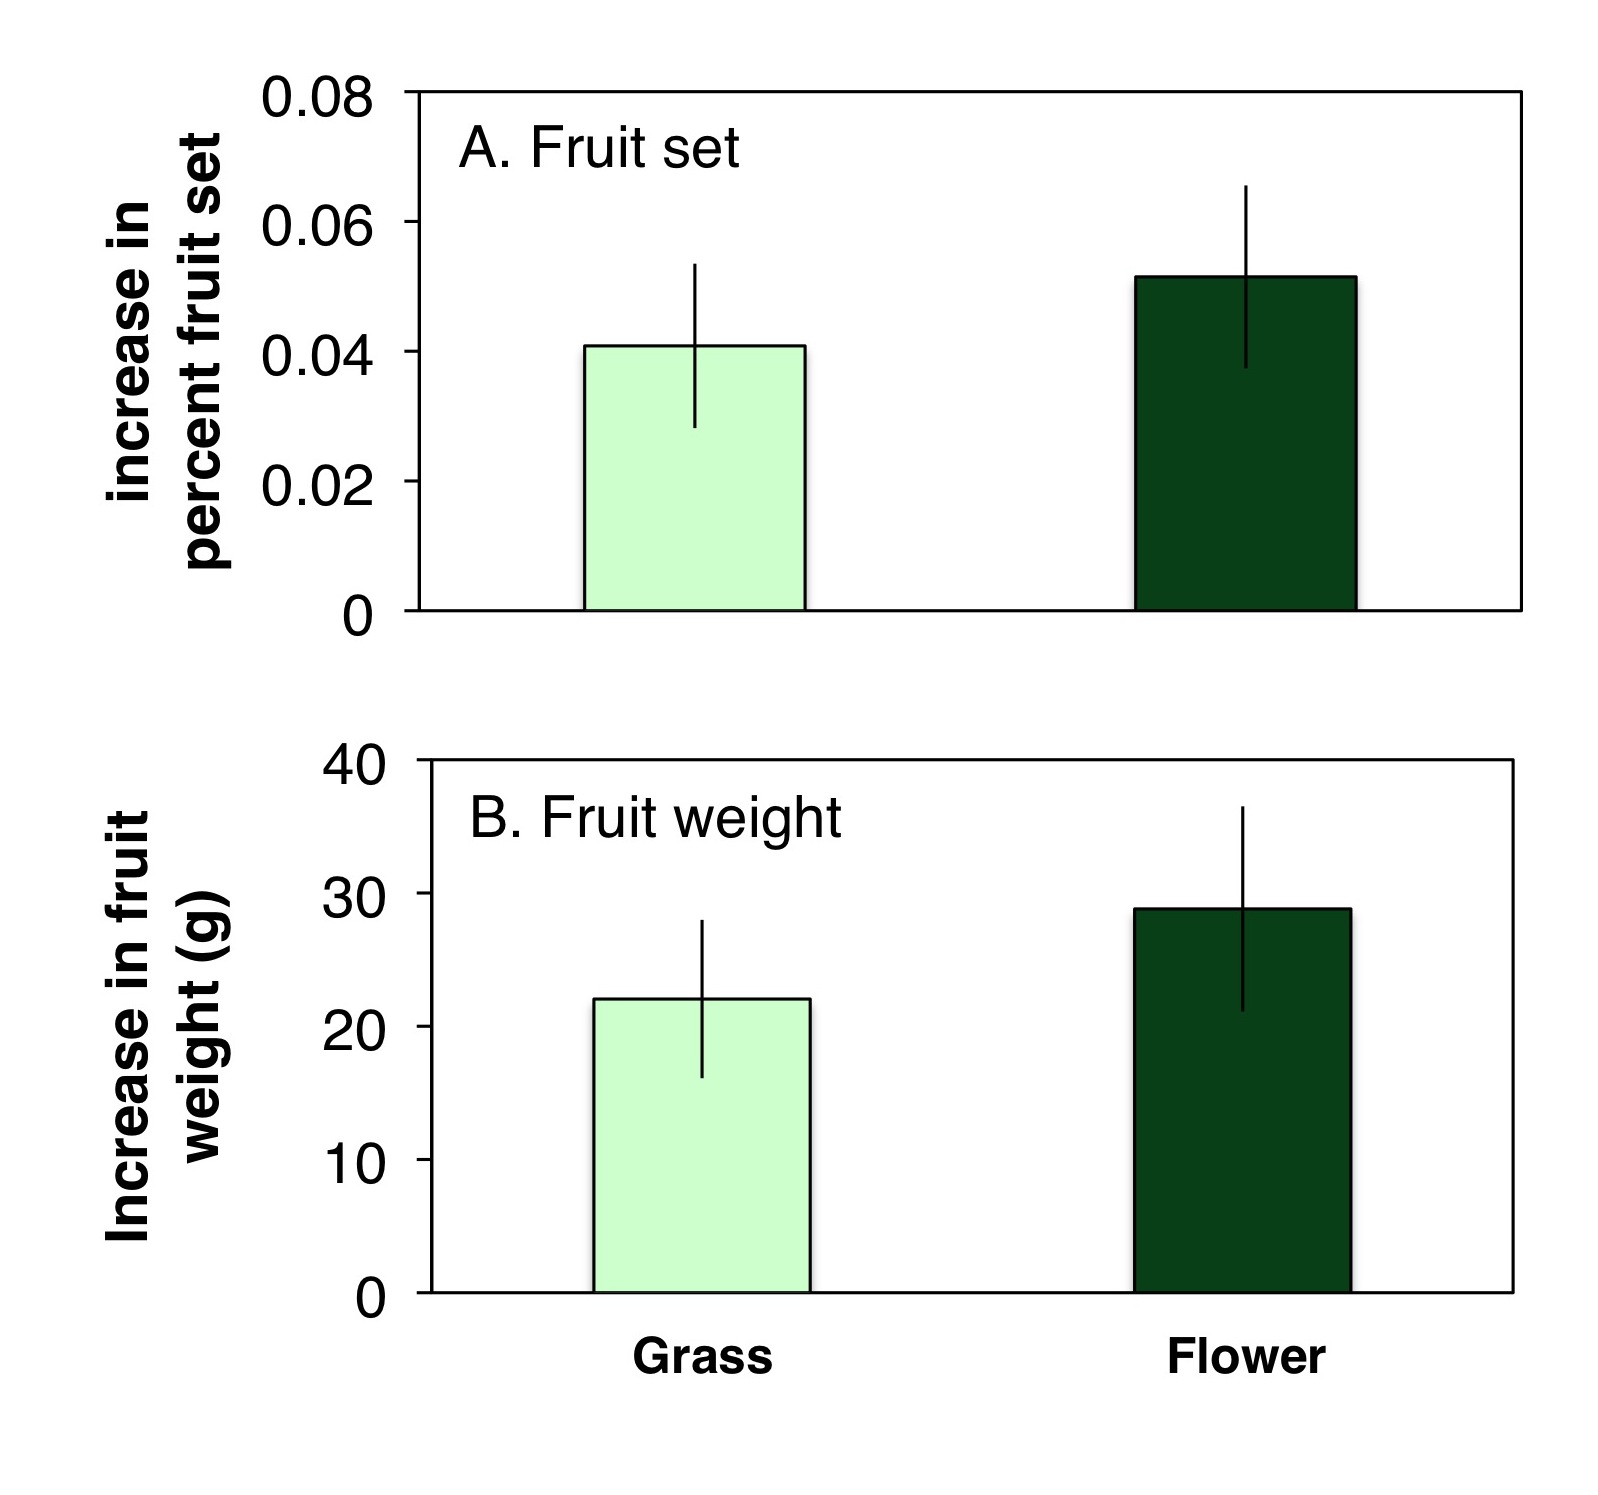
To evaluate the effect of conservation strips on pollination levels in blueberry fields, we compared the pollination parameters (percent fruit set, berry weight, and number of mature seeds) for fruit from the bagged and unbagged samples to calculate the magnitude of pollination from insect pollinators in crop fields adjacent to conservation strips and those adjacent to control perimeters. After the third year of this project we found significantly higher percent fruit set (?2 = 5.45, p = 0.0196), average berry weight (?2 = 4.09, p = 0.043), and number of mature seeds (?2 = 12.5, p = 0.0004) in blueberry fields adjacent to the conservation plantings (Figure 6). Given the time it takes for the perennial wildflowers to establish and first bloom, and the subsequent time for pollinators to inhabit theses areas, it is expected that it may take multiple years before we see an effect from conservation plantings on crop pollination (Table 2). While the pollination parameters were higher in blueberry fields adjacent to conservation strips in 2011, pollination levels in general did not increase over time, rather in 2011 pollination levels in blueberry fields adjacent to the control perimeters had decreased from the previous years (Figure 7). This trend may imply that within the first three years, conservation strips and the increase in native bees act as insurance for crop pollination in years that would otherwise yield poor pollination from managed honey bees and low numbers of native bees.
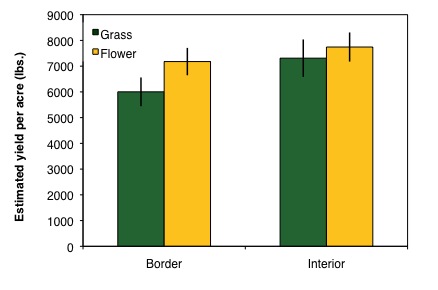
Although not statistically significant, the predicted fruit yield calculated from the measured pollination parameters was higher in blueberry fields adjacent to the conservation strips in 2011 (Figure 8). This trend was observed along the crop border as well as 15 m into the crop interior. It is expected that as the wildflower plantings continue to establish, the benefits observed will continue to increase. Even a slight increase in fruit yield may potentially cover the costs of establishing and maintaining these conservation strips.
Natural enemies and herbivores in the crop.
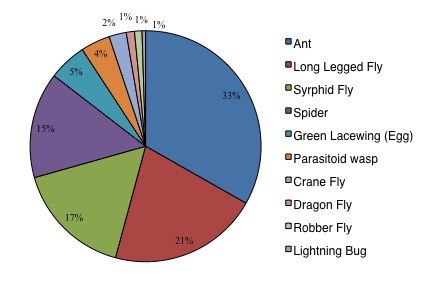
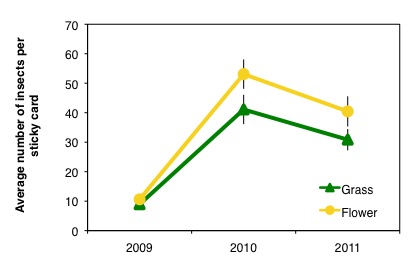
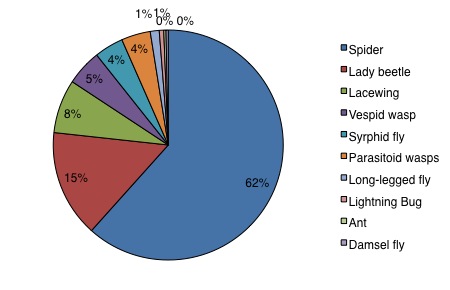
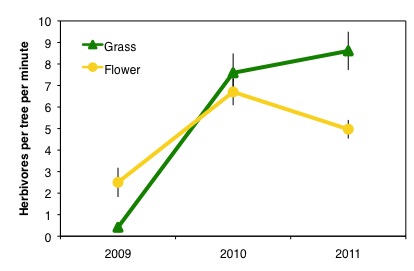
The abundance of natural enemies and pest insects were measured in each of the blueberry fields adjacent to the conservation strips and also those adjacent to the control perimeters using observational and yellow sticky trap techniques. In 2011 we observed a diverse community of natural enemies in crop fields, which included ants, long-legged flies, and hoverflies (Figure 9). Comparing over a three-year period, the abundance of natural enemies has increased over time in crop fields adjacent to conservation strips, with the abundance not being significantly different in 2009 (Figure 10; ?2 = 0.042, p = 0.837), and in 2010 and 2011 the observed abundance was significantly higher in fields adjacent to these plantings compared to fields adjacent to the control perimeters (Figure 10; ?2 = 5.44, p = 0.019 and ?2 = 26.7, p < 0.0001, respectively). In addition to these observations, we also sampled natural enemies within the crops using yellow sticky traps. Although 2010 was the only year where there were significantly more natural enemies collected using yellow sticky traps in fields adjacent to conservation strips (Figure 11; ?2 = 8.46, p = 0.0036), we did see a trend in 2011 with more natural enemies collected in traps adjacent to conservation strips (Figure 11; ?2 = 1.16, p = 0.218), similar to the observational data.
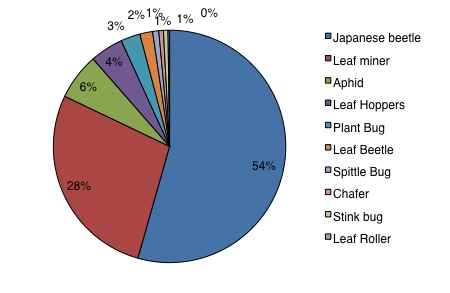
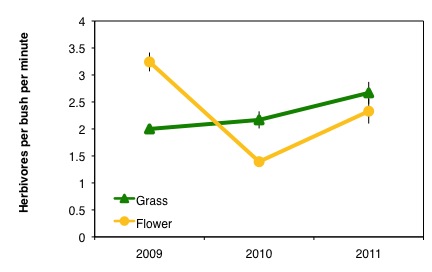
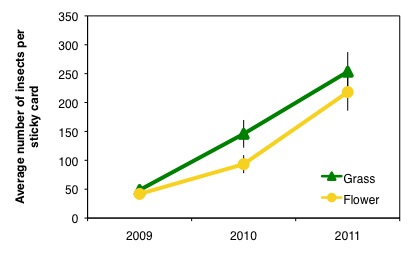
In order to determine how potential pest insects respond to conservation strips in agricultural landscapes, we also measured the community and abundance of insect herbivores in crop fields adjacent to wildflower plantings. In 2011 we observed primarily Japanese beetles, leafminers, and aphids in blueberry fields (Figure 12). Comparing observed herbivore abundance over a three-year period the abundance of insect herbivores in the crop fields adjacent to conservation strips was significantly higher than that in control perimeters (Figure 13; ?2 = 16.75, p < 0.0001) during the first year. In 2010 and 2011, although not significantly different (Figure 13; ?2 = 0.286, p = 0.606 and ?2 = 3.64, p = 0.056, respectively), there were fewer herbivores observed in blueberry fields adjacent to the conservation strips than those in the control perimeters. We also measured herbivore abundance with yellow sticky traps. The trend for herbivore abundance was a little different with the sticky traps, with more herbivores collected in blueberry fields adjacent conservation strips in 2010, and fewer herbivores in those fields in 2009 and 2011 when compared to fields adjacent to control perimeters (Figure 14). While the herbivore abundances collected with sticky traps fluctuated over the three-year period, the differences between treatments were not statistically significant (2009: ?2 = 0.286, p = 0.606; 2010: ?2 = 3.64, p = 0.056; 2011: ?2 = 3.64, p = 0.056). Although insect herbivores were still present, conservation strips do not significantly increase herbivore abundance in adjacent crops fields.
Beneficial insects in the perimeter.
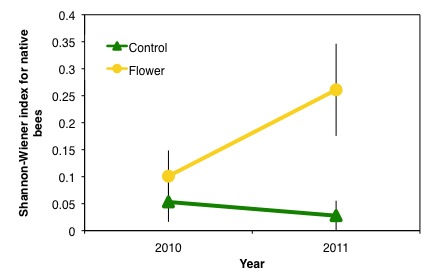
In order to understand how beneficial insects respond to the wildflowers in conservation plantings, during the growing seasons in 2010 and 2011, the abundance of beneficial insects in the conservation strips and unplanted control perimeters were suction sampled once a month for five months (May, June, July, August, and September). We found that in the presence of wildflowers in both years, 2010 and 2011, there were significantly more native bees collected in the conservation strips than in the control perimeters (Figure 15; ?2 = 11.9, p = 0.0006 and ?2 = 18.01, p < 0.0001, respectively). The diversity of native bee groups (see Figure 4 for groups) in 2010 was not different between the conservation strips and control perimeters (Figure 16; ?2 = 0.709, p = 0.399), but in 2011 the diversity of native bee groups increased in the conservation strips making it significantly different than that from the control perimeter (Figure 16; ?2 = 6.43, p = 0.0113). Because it takes time for bees to be attracted to an area and establish populations there, the diversity of native bees found in conservation plantings may be partially dependent on the flower abundance from the previous year. With few flowers in bloom during 2009 and many more blooming in 2010, this may explain why we saw a more diverse community of native bees in 2011 than we did in 2010 (Figure 16).
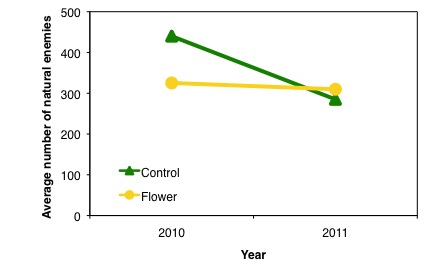
Unlike the native bees, the natural enemy abundance collected from the conservation strips was significantly smaller than that collected in the control perimeter in 2010 (Figure 17; ?2 = 4.41, p = 0.0356). Although not significant, in 2011 the number of natural enemies collected in the control perimeter decreased from the previous year and the abundance was smaller than that collected in the conservation strips (Figure 17; ?2 = 1.23, p = 0.267). It is predicted that with time as the wildflowers continue to establish, the abundance of natural enemies in the conservation strips will also continue to increase at the farms.
Biocontrol services.
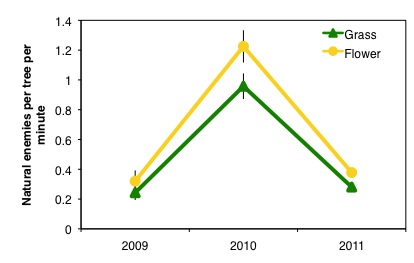
We were able to observe and measure an increase in insect natural enemies in both the conservation strips as well as in the crops adjacent to those strips, so next wanted to determine how these plantings affected biocontrol services at these farms. To do this we measured biocontrol services of corn earworm eggs by comparing egg damage/removal before being placed into the field with the egg damage/removal after being in the field exposed to natural enemies for four days. The number of damaged and missing eggs was used to calculate the biocontrol services index (BSI; Gardiner et al. 2009). We calculated significantly higher BSI values and hence higher biocontrol of corn earworm egg in the conservation strips and along the crop border adjacent to the wildflower plantings than those in the corresponding positions in the grass control perimeter and adjacent crop border (Figure 18; ?2 = 6.396, p = 0.012 and ?2 = 10.246, p = 0.001, respectively). Although it was not statistically significant, BSI for the crop interior positions was also higher in crop fields adjacent to conservation strips compared to those adjacent to the control perimeter (Figure 18; ?2 = 0.965, p = 0.326). Overall, biocontrol of corn earworm eggs was significantly higher in fields that were adjacent to conservation strips (?2 = 15.055, p < 0.0001).
Cherry:
Effect on pollinators and pollination.
Due to unforeseen problems, such as bad weather and crop damage, we were unable to get a full data set for cherry pollinators and pollination, but in 2011 we observed a diverse community of native bees visiting cherry flowers during crop bloom (Figure 19). Timed observations were made at each of the cherry fields adjacent to the conservation strips and the control perimeters, and we recorded the identity and number of flower-visiting insects (bees, flies, wasps, etc.). In 2011, although not significantly, we observed a slightly higher abundance of native bees visiting flowers in crop fields adjacent to conservation plantings in 2011 (Figure 20; ?2 = 0.109, p = 0.741). While this is only one year of pollinator data, it is promising to see that native bees are indeed present in the landscape and are visiting cherry flowers, meaning that over time their populations may be enhanced by the conservation strips.
Natural enemies and herbivores in the crop.
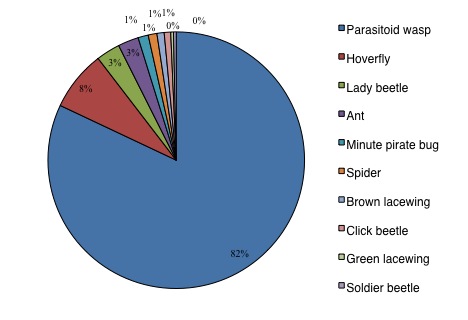
As with the blueberry portion of this project, the abundance of natural enemies and pest insects were measured in each of the cherry orchards adjacent to the conservation strips and also orchards adjacent to the control perimeters using observational and yellow sticky trap sampling methods. In 2011 we collected a diverse community of natural enemies in crop fields, which included parasitoid wasps, hoverflies, and lady beetles (Figure 21).
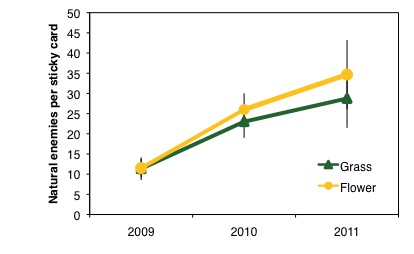
Comparing over a three-year period, the abundance of natural enemies observed in the orchards fluctuated from year to year with generally more natural enemies being observed in orchards adjacent to the control perimeters (Figure 22), but this trend was not significant (2009: ?2 = 0.0443, p = 0.833; 2010: ?2 = 0.0001, p = 0.99; 2011: ?2 = 0.0228, p = 0.879). This trend was contrasted by the abundance of natural enemies collected using sticky traps in the orchards, which expressed a trend of increasing numbers of natural enemies collected in all treatments over time (Figure 23). Although not significant, abundances of natural enemies collected via yellow sticky traps were greater in orchards adjacent to conservation strips (Figure 23; 2009: ?2 = 0.159, p = 0.689; 2010: ?2 = 0.06, p = 0.806; 2011: ?2 = 1.43, p = 0.232). These contrasting findings are potentially due to the high proportion of parasitoid wasps that were collected on yellow sticky traps, making up the majority of natural enemies collected. These wasps are generally small in size, making them harder to see when performing observational sampling, which may have led to an underestimation of parasitoid wasps in crop fields due to observational sampling. While there were no definitive data on how natural enemies respond to conservation strips, the increasing numbers of insects collected on sticky traps over time is a promising result that may indicate that sufficient amount of time has not passed yet before a measurable affect of conservation strips on natural enemies can be determined.
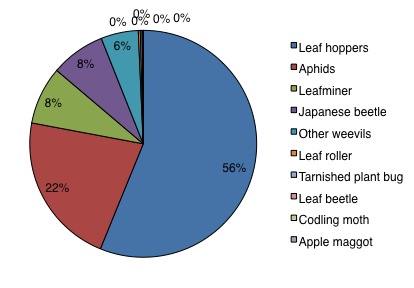
In order to determine how potential pest insects respond to conservation strips in cherry orchards, we also measured the community and abundance of insect herbivores in orchards adjacent to conservation strips and those adjacent to control perimeters. In 2011 we collected primarily leaf hoppers and aphids (Figure 24), and comparing observed herbivore abundance over a three-year period we found that the abundances of insect herbivores fluctuated similarly to the observed abundances of natural enemies (Figure 25). We observed more insects herbivores on average in orchards adjacent to the conservation strips (Figure 25), but this trend was not significant (2009: ?2 = 0.0284, p = 0.866; 2010: ?2 = 0.201, p = 0.654; 2011: ?2 = 0.0514, p = 0.821).
We also measured herbivore abundance with yellow sticky traps. The trend for herbivore abundance was a little different with the sticky traps, with the abundance of herbivores collected in cherry orchards adjacent conservation strips and adjacent to control perimeters decreased over time (Figure 26). Although not statistically significant, there was a general trend of fewer insect herbivores collected with sticky traps in orchards adjacent to conservation strips compared to those adjacent to control perimeters (2009: ?2 = 0.837, p = 0.36; 2010: ?2 = 0.0099, p = 0.921; 2011: ?2 = 0.127, p = 0.721). Although the response of insect herbivores to conservation strips varied between sampling methods, both methods clearly showed that conservation strips do not significantly increase herbivore abundance in adjacent crops fields.
Apple:
Effect on pollinators and pollination.
To determine how conservation strips affect pollinators in apple orchards, timed observations were made at each of the fields adjacent to the conservation strips and the control perimeters, recording the identity and number of flower-visiting insects. Unfortunately, similar to the cherry portion of this project, we also experienced problems with the weather during apple bloom and now do not have a full data set from observational sampling. We were able to sample native bees using yellow sticky cards, and compared to the 2009 results, in 2011 in apple orchards we collected a higher proportion of native bees visiting crop flowers (Figure 27). Comparing over a three-year period, the abundance of native bees collected in apple orchards displayed a trend of having higher numbers of bees collected in crop fields adjacent to conservation plantings, but these differences were not significant (Figure 28; 2009: ?2 = 0.0001, p = 0.999; 2010: ?2 = 0.842, p = 0.359; 2011: ?2 = 1.17, p = 0.178).
Also due to unfortunate weather conditions and the common practice of chemically thinning the apple crop, we were only able to successfully measure pollination parameters in apple in 2011. Although not significant, after the third year of this project we measured a trend of higher percent fruit set (Figure 29A; ?2 = 1.72, p = 0.189) and average fruit weight (Figure 29B; ?2 = 1.82, p = 0.178) in apple orchards adjacent to conservation strips. Given the time it takes for the perennial wildflowers to establish and first bloom, and the subsequent time for pollinators to inhabit theses areas, it is expected that with time conservation strips will continue to increase native bees in the agricultural landscape, potentially leading to a significant increase in pollination of adjacent apples.
Natural enemies and herbivores in the crop.
The abundance of insect natural enemies and herbivores were measured in each of the apple orchards adjacent to the conservation strips and in those adjacent to the control perimeters using observational and yellow sticky trap sampling methods. In 2011 we collected a diverse community of natural enemies in crop fields, which included spiders, lady beetles, and green lacewings (Figure 30). Comparing over a three-year period, the abundance of natural enemies observed in the orchards fluctuated from year to year with generally more natural enemies being observed in orchards adjacent to the conservation strips (Figure 31), but this trend was not significant (2009: ?2 = 0.147, p = 0.701; 2010: ?2 = 0.184, p = 0.668; 2011: ?2 = 1.18, p = 0.278). This trend was also found in the abundance data collected using sticky traps in the orchards (Figure 32). As with the observational data, although not significant, the abundances of natural enemies collected via yellow sticky traps were greater in orchards adjacent to conservation strips (Figure 32; 2009: ?2 = 0.083, p = 0.927; 2010: ?2 = 0.609, p = 0.435; 2011: ?2 = 0.487, p = 0.485). Although both observational and sticky trap sampling resulted in no statistically different natural enemy abundance data between orchards adjacent to conservation strips and those adjacent to control perimeters, it is predicted that sufficient amount of time has not passed yet before a measurable affect of conservation strips on natural enemies can be determined.
As with the blueberry and cherry portions of this study, we also measured the community and abundance of insect herbivores in apple orchards adjacent to conservation strips and those adjacent to control perimeters. In 2011 we observed primarily leaf hoppers and aphids (Figure 33), and comparing observed herbivore abundance over a three-year period we found that the abundances of insect herbivores were higher in orchards adjacent to conservation strips in 2009, but increasingly lower in those orchards in 2010 and 2011 than in orchards adjacent to control perimeters (Figure 34). While there appears to be an obvious difference in herbivore abundance between the two treatments this trend was not significant (2009: ?2 = 1.2, p = 0.273; 2010: ?2 = 2.64, p = 0.104; 2011: ?2 = 1.65, p = 0.199).
We also measured herbivore abundance with yellow sticky traps. The trend for herbivore abundance collected in apple orchards adjacent conservation strips and adjacent to control perimeters increased over time (Figure 35). More herbivores were collected in orchards adjacent to control perimeters than those adjacent to conservation strips. In 2009 and 2011 this trend was not significant (Figure 35; 2009: ?2 = 0.159, p = 0.689; 2011: ?2 = 2.85, p = 0.0914), while in 2010 there were significantly fewer herbivores collected in orchards adjacent to the conservation strips (Figure 35; 2010: ?2 = 6.74, p = 0.0094). Although insect herbivores were still present, conservation strips did not significantly increase herbivore abundance in adjacent apple orchards when compared to orchards adjacent to control perimeters.
Biocontrol services.
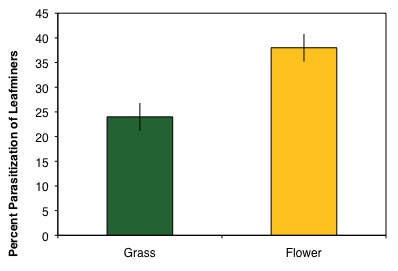
As a method to quantify the effect of wildflower plantings on biocontrol services in apple orchards we collected leaves infested with spotted tentiform leafminer larvae. We found a significantly higher percent parasitization of leafminer larvae in infested leaves collected in orchards adjacent to the conservation strips (Figure 36; ?2 = 7.46, p = 0.0063). While we did not measure a significant difference in natural enemies observed or collected in orchards adjacent to conservation strips, we found higher parasitizm, which indicates that even a slight increase in natural enemies may result in a significant decrease in pest populations.
In order to improve producer and public awareness of using flowering plant diversity in farms to conserve beneficial insects including natural enemies and pollinators, we presented at numerous extension meetings and conferences throughout the duration of this project (details under “Publications/Outreach” heading). These presentations included information about using wildflower plantings to support beneficial insects and current results from this SARE funded project. To evaluate participants’ understanding of the use of flower plants to support beneficial insects and the potential resources to fund this approach, we provided a questionnaire during the meeting and had the participants anonymously answer the questions with a clicker system (Turning Technologies, LLC., Youngstown, OH). Although the percentage of participants at these meetings that have regions of their farm dedicated to insect conservation did not increase over time, the percentage of participants that were currently receiving NRCS or FSA funds did increase (Table 3). While these trends are likely influenced by the different people in attendance at these meetings and may not represent the trends of fruit growers in Michigan on a whole, it is still important to know that growers are dedicating regions of their farms to help conserve beneficial insects and are already receiving funds from NRCS to help with that.
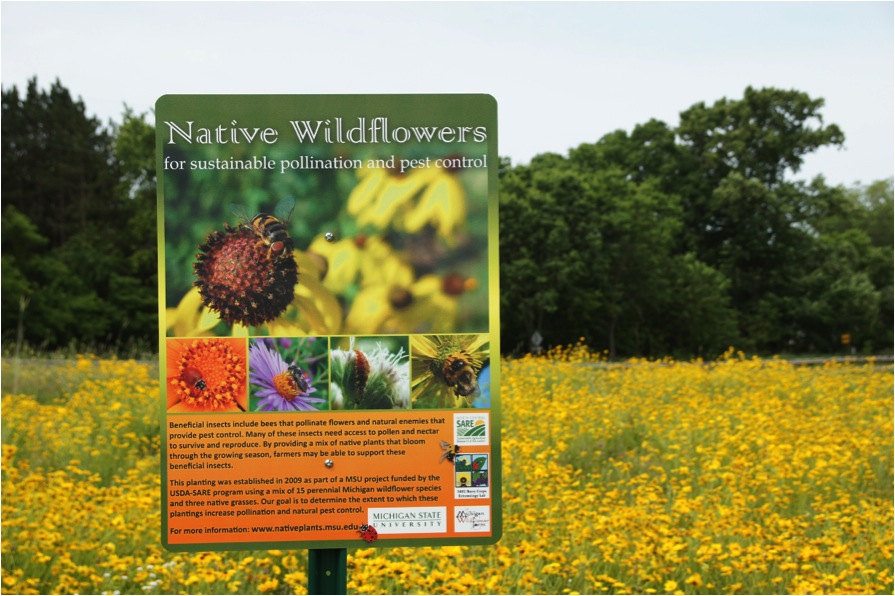
Also, as a way of increasing exposure of our project and spreading information and sources on insect conservation, we created a project sign for our grower cooperators (Figure 37). These signs are displayed near or within the wildflower plantings, so that visitors to the farms can get an introduction to this SARE funded project. We also had an article featured in the January 2011 issue of the Fruit Growers News - http://fruitgrowersnews.com/index.php/magazine/article/using-habitat-to-increase-pollination/ - that gave a brief description of our project and how to conserve pollinators using wildflower plantings.
Throughout the duration of this project to help improve producer and public knowledge of beneficial insect identification and biology, we presented at numerous extension and grower meetings (as mentioned in Objective 2). These presentations included a brief introduction to the identification of beneficial insects and the resources these insects need to thrive in agricultural settings. We also handed out a two-page beneficial insects guide that outlines some of the most beneficial and common natural enemies and pollinators that growers are likely to detect at their farms (Figure 38). This guide is also available to download as a PDF from https://www.msu.edu/~blaauwb1/Beneficial_Insects_pamphlet.pdf.
To evaluate whether participants were learning about beneficial insect identification and biology during our extension and grower meetings, at the 2010 summer field days we provided a questionnaire before and after the meeting to compare the accuracy of the participants in identifying common beneficial insects. At one of our meetings with primarily blueberry growers we measured an increase of 21% in correct responses and for our other meeting with primarily tree fruit growers we measured an increase of 16% (Table 4). The knowledge and the portable guide these growers took away from these meetings will help them successfully identify the beneficial insects on their farms and hopefully a better understanding of why these insects need conserving.
In order to develop guidelines for increasing implementation of wildflower plantings for the conservation of beneficial insects in farmlands we have taken extensive notes on the continuing processes used in establishing maintaining wildflower plots at our farm sites. Establishing wildflower plantings can be an expensive undertaking, so it is very important that we understand costs and benefits before we can best guide growers in adopting this conservation strategy. To make sure our guidelines are clear and remain affordable for growers we also distributed questionnaires to our grower cooperators to determine how much of their time and money was put into helping us establish and maintain the wildflower plantings.
We also created a short video entitled, “A Quick Guide to Establishing Wildflower Plantings for the Conservation of Beneficial Insects,” to give growers and others who are interested in this approach an introduction to the benefits, establishment, and maintenance of wildflower plantings to conserve beneficial insects. The video is posted on the Isaacs Lab webpage - http://www.isaacslab.ent.msu.edu/Videos.html and on YouTube - http://youtu.be/jJSGXb81xbM.
After completing three years of this project and allowing time for wildflowers to grow and establish in the conservation strips, we now have data and results that appear to support our objectives. Our data show that the abundance of beneficial insects, including native bees and insect natural enemies, increases in crop fields adjacent to conservation strips over time. Our data also show that that after three years, pollination was higher in blueberry fields adjacent to conservation strips compared to fields adjacent to control field perimeters. The parameters for pollination were used to calculate the subsequent predicted yield, which, although not statistically significant, was higher in blueberry fields adjacent to conservation strips. With time, this predicted increase in fruit yield along with the measured increase in biocontrol in crop fields adjacent to conservation strips will potentially outweigh the initial costs of establishing wildflowers in agricultural landscapes.
After reviewing the early results from this project, two of our grower cooperators have established or are in the process of establishing another wildflower planting their farms. While presenting at extension and grower meetings we have also received reports of other growers not attached to this project who are currently working with NRCS to establishing wildflower plantings at their farms. This includes one grower who has established an estimated 40 acres of pollinator habitat at his farm within the past couple of years and will soon be working on a project with the Berry Crop Entomology Lab at MSU on the effects of this type of habitat on native bees. Also, Esther Durnwald of the Michigan Wildflower Farm, who provides native wildflower seed for restoration projects, has observed an increase over the past few years in the interest from clientele in purchasing wildflower seeds that can be used to help support insect pollinators. Resulting from this interest, she now produces and sells pollinator specific seed mixes to growers and the public who are interested in supporting beneficial insects.
The results from this project provide evidence supporting the hypothesis that beneficial insects are using the wildflower plantings for resources and then moving to the crop fields to provide pollination and biological control. However, direct evidence of this movement is lacking, and we cannot yet answer the question of how far into a crop planting we can expect these beneficial insects to travel. The knowledge we gained from this SARE funded project was crucial in supporting a successful $25 thousand proposal to MSU’s Project GREEEN led by Dr. Isaacs and Brett Blaauw to focus on using inexpensive immuno-marking methods to answer questions related to the distribution of both beneficial and pest insects in agricultural landscapes in response to wildflower plantings.
This project has also provided some of the information that has supported a successful $1.7 million proposal to the USDA Specialty Crops Research Initiative led by Dr. Isaacs to explore diversification of farms to support greater pollinator diversity.
Economic Analysis
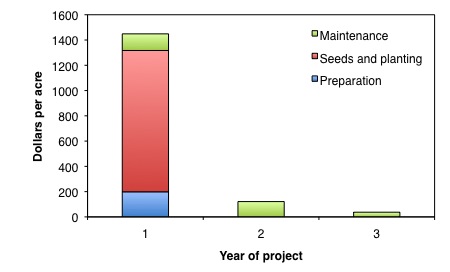
The major cost of establishing a conservation strip is the initial investment in native wildflower seeds. The wildflower seed mix used in this project cost a sum of $875 per acre for a total of four pounds of seed. Because of this high cost, in 2009, the first year of planting, we decided to go with an inexpensive sowing rate of two pounds an acre that cost less than $500. Our seed provider advised us that the density of seedlings that germinated at that seeding rate was not high enough to outcompete the weeds that were also growing in the conservation strips. While the two pound per acre seeding rate was chosen as a low-cost approach, if the wildflowers were overgrown with weeds, it would have ended up being more expensive to redo the whole establishment procedure. With that in mind we re-seeded our conservation strips in 2010 with the same wildflower seed mix at the same seeding rate, resulting in a total of four pounds of seeds being sown per acre (Table 1). The added seed helped reach an ideal seedling density, which resulted in bloom filled conservation strips in 2011 (Figure 2).
Learning from our mistakes we recommend seeding the native wildflower and grass seed mix at a rate of at least four pounds per acre. From this study, if all the site preparation seed purchasing, and seeding are done in the first year, the expenses for years two and three will only be maintenance related (Figure 3). On an average, with that approach, the initial cost of establishing a conservation strip for the first year including site preparation, seeds and seeding, and site maintenance would be roughly $1,450 per acre. This is a costly first step, but on an average, the expenses due to site maintenance for year two drop to roughly $120 per acre and even smaller in year three at about $37 per acre (Figure 3). It is also important to note that there are incentive payments available through government agencies to help cover the cost of establishing these plantings.
Even with an adequate seeding rate, it is important to note that it may take years before the perennial wildflower seeds bloom or even germinate within the conservation strips. Mowing the strips down to 4-6 inches roughly once a month during the first two years of establishment will help combat weeds, but will also inhibit the wildflowers from blooming. Using this approach, during the third year the wildflower plants should be strong and dense enough to produce blooms and outcompete weeds in the strips (Figure 2).
Farmer Adoption
Convinced by the early results from this project, one of our apple grower cooperators has began work on establishing another wildflower planting at his farm in the spring of 2011. Currently, one of our blueberry grower cooperators is working with NRCS to establishing another conservation strip at his farm. Also, our native wildflower seed provider, Esther Durnwald from Michigan Wildflower Farm, has observed an increase over the past few years in the interest from clientele in purchasing wildflower seeds that can be used to help support insect pollinators.
Across Michigan, there is increasing adoption of wildflower plantings for pollinators, in part through the USDA Farm Service Agency SAFE program for pollinators. This now has over 1000 acres enrolled in forb-rich plantings for supporting bees on fruit and vegetable-producing farmland.
Educational & Outreach Activities
Participation summary:
The following are the authors, titles of presentations, and the meetings we presented results and information from this SARE funded project at:
Extension oriented meetings:
Presented a talk on the conservation of beneficial insects to elementary students at Washington Elementary’s Science Day in Charlotte, MI on February 23, 2012.
Brett R. Blaauw, Rufus Isaacs, Nikki Rothwell, and Karen Powers. 2012. The use of wildflower plantings to conserve beneficial insects in Michigan tree fruit. Northwest Michigan Orchard and Vineyard Show in Acme, MI.
Brett R. Blaauw and Rufus Isaacs. 2012. The effect of native wildflower planting size on beneficial insects and their ecosystem services. Science, Practice & Art of Restoring Ecosystems Conference in East Lansing, MI.
Rufus Isaacs, Julianna Tuell, and Brett R. Blaauw. 2011. Integrated Pollinator Management. Van Buren Conservation District’s Farming for the Future workshop, Paw Paw, MI. Oral presentation co-author.
Brett R. Blaauw and Rufus Isaacs. 2011. Enhancing Natural Enemies in Crops Using Flowering Plants. Great Lakes Fruit, Vegetable and Farm Market EXPO in Grand Rapids, MI. Invited oral presentation.
Brett R. Blaauw and Rufus Isaacs. 2011. Conserving Native Bees in Blueberry and Other Small Fruit. Great Lakes Fruit, Vegetable and Farm Market EXPO in Grand Rapids, MI. Invited oral presentation.
Rufus Isaacs, Julianna Tuell, and Brett R. Blaauw. 2011. Habitat manipulation to support integrated crop pollination. Entomological Society of America Annual Meeting in Reno, NV. Oral presentation co-author.
Presented a talk, “Enhancing Beneficial Insects with Wildflowers,” at the Michigan’s Stewardship Network’s, “Please Bug Me!” workshop at Calvin College on June 18, 2011.
Nathanial J. Walton, Brett Blaauw, Anna K. Fiedler, and Rufus Isaacs. 2010. Native plants for conservation of beneficial insects: trials and tribulations on Michigan farms. Entomological Society of America – North Central Branch Annual Meeting in
Louisville, KY. Oral presentation co-author.
Presented at and helped arrange two meetings: Conserving Beneficial Insects for Pest Suppression and Crop Pollination supported by USDA-SARE, MSU Extension, and Michigan Agricultural Experiment Station. These two meetings were designed to help growers learn to identify native bees and natural enemies, establish and maintain wildflower plantings, update on current MSU-SARE research, and inform on cost sharing opportunities that exist to help establish habitats for beneficial insects.
o September 2nd, 2010. Suttons Bay, MI.
o September 9th, 2010. Trevor Nichols Research Complex in Fennville, MI.
Presented a talk on biocontrol and pollination of blueberries to elementary students at Galewood Elementary’s Science Day in Charlotte, MI on November 3, 2009.
Presented a talk on “Native plant conservation strips for sustainable pollination and control in fruit crops,” at Michigan’s Organic Tree Fruit Grower Association’s Organic Apple Field Day at Almar Orchard in Flushing, MI on June 25, 2009.
In collaboration with a professor from Rutgers University, we used the knowledge gained from this project to help write a book chapter on habitat manipulation to help support beneficial insects in agricultural ecoystems:
Cesar Rodriguez-Saona, Brett R. Blaauw and Rufus Isaacs (2012). Manipulation of Natural Enemies in Agroecosystems: Habitat and Semiochemicals for Sustainable Insect Pest Control, Integrated Pest Management and Pest Control - Current and Future Tactics 89-126.
The well established “Native Plants and Ecosystem Services” website from Michigan State University (http://nativeplants.msu.edu/) is continually updated with information on native plants of Michigan and how they can be used to help support ecosystem services, including information and images gained from this project.
Also, as a proof of concept, we started a web page - https://www.msu.edu/~blaauwb1/Main.html – that through a series of photos shows the progression and time it takes to establish conservation strips. This webpage also has pictures of the wildflowers used in this project and some of the common beneficial insects people will likely see visiting those flowers.
Project Outcomes
Areas needing additional study
While we were able to show that conservation strips can help support beneficial insects and the services they provide to adjacent crops, it is very important to further understand the importance of size of the conservation strips and layout within the agricultural landscape. Along similar lines, it is important to also look at how the surrounding landscape affects beneficial insects and their services. An increased understanding of insect dispersal and behavior to and from conservation strips will help better determine the best placement of these habitats and what insects may benefit the most from their establishment in agricultural landscapes.