Final Report for LNC13-352
Project Information
The use of cover crops can decrease soil erosion, weed density, and nitrate leaching while improving soil quality. We investigated nine cover crops, winter rye (Secale cereale L.), winter triticale (× Triticosecale Wittm. ex A. Camus), two winter canola (Brassica napus L.), winter camelina [Camelina sativa (L.) Crantz], spring barley (Hordeum vulgare L.), spring oat (Avena sativa L.), turnip (Brassica rapa L.), and hairy vetch (Vicia villosa Roth), as sole crops and selected binary and trinary mixtures and their influences on subsequent corn (Zea mays L.) productivity. A control treatment of no cover crop was included. Cover crops were no-till drilled immediately after soybean [Glycine max (L.) Merr)] harvest. The study was a randomized complete block conducted in five environments over 2013-2014 and 2014-2015. Across environments, rye and rye mixtures produced the greatest spring aboveground biomass (676 lb a-1), carbon, and nitrogen accumulation, had some of the lowest spring soil nitrate concentrations, and generally produced the lowest corn leaf chlorophyll. Rye accounted for more than 79% of spring aboveground biomass accumulation in rye mixtures. Triticale and camelina monoculture produced approximately 50% less biomass than rye or mixtures with rye. Cover crops in monoculture and mixtures did not influence surface soil temperature, soil P or K concentrations, weed density, weed community, or corn yield. Cover crops had a limited influence on volumetric soil water content. Cover crop mixtures had no advantages over monocultures except for increasing fall stand density. Turnip and vetch had limited winter survival while barley, oat, and canola winterkilled.
Introduction:
The corn-soybean cropping system dominates the Midwest and is one of the most productive cropping systems in the world. The Midwestern state of Iowa often leads the United States in acres of corn and soybeans, with an estimated 13.7 million acres of corn (Zea mays L.) and 9.9 million acres of soybean [Glycine max (L.) Merr.] planted in 2014 (USDA, 2015). Although corn and soybeans are highly productive in Iowa, they are only grown for approximately five to six months of the year. For the remainder of the year most of the cropland in Iowa does not have any actively growing plants. Soil residue cover is often low, especially in systems which use fall tillage. The lack of growing plants and limited ground cover can result in soil erosion, nitrate leaching, decreased soil microbial activity, decreased accumulation of soil organic carbon, and increased weed density. Iowa corn-soybean cropland is losing approximately 20 to 23 pounds N per acre every year through nitrate leaching (Christianson et al., 2012) with the majority of this loss occurring because of a lack of actively growing plants in the late fall or early spring. Iowa cultivated cropland soil is currently being eroded at a rate of approximately 6.07 tons per acre every year through sheet and rill erosion with no decrease in erosion having occurred since 1992 (USDA, 2015).
The addition of cover crops to an agricultural system has great potential to decrease soil erosion, weed density, and nitrate leaching while increasing soil organic carbon (Kaspar et al., 2001; Teasdale, 1996; Strock et al., 2004; Dinnes et al., 2002; Villamil et al., 2006; Kaspar and Singer, 2011). Despite these benefits, approximately 1.9% of Iowa farm ground was planted to cover crops in 2015 (Lenssen, 2015). Of this area, the majority of hectares were planted to winter rye (Secale cereale L.). Winter rye is the most widely used cover crop in Iowa because it establishes easily, produces high quantities of biomass, germinates at approximately 34°F, produces vegetative growth above 38°F, is very winter hardy, and the seed is available and inexpensive (Snapp et al., 2005; Singer, 2008).
Establishment, overwintering, and growth of cover crops planted into standing corn/soybean or after corn/soybean harvest is a major limitation for the implementation of cover crops in the upper Midwest (Johnson et al., 1998; Wilson et al., 2013). Many cover crop species have been shown to be effective in the 7a winterhardiness zone (USDA ARS, 2016) of the mid-Atlantic (Clark et al., 1994), 6a to 7b winterhardiness zone of irrigated soils of Pacific Northwest (Weinert et al., 2002), 8a to 9a winterhardiness zones of southeastern (Sainju et al., 2005), and 9a to 10a winterhardiness zones of the irrigated western (reviewed in Snapp et al., 2005) United States. However, some of these cover crops would not survive the 5a winterhardiness zone that makes up the majority of Iowa (USDA, 2012), in part because of variable snow cover. Many of these cover crops would be far less productive in Iowa than in other areas of the country due to Iowa’s corn-soybean cropping system, shorter cover crop growing season, and lower heat unit accumulation from harvest to planting. Iowa’s colder climate limits viable cover crop options and the potential for successful establishment and growth of cover crops.
Recently, many new cover crops for Iowa have been widely promoted by cover crop seed companies, farm journals, and other commercial sources. Iowa Natural Resource Conservation Service (NRCS) has produced literature with a vast assortment of new cover crop options for Iowa (NRCS, 2013). Despite this interest, limited research has been done on these new cover crops to test their effectiveness in Iowa or the Midwest. Winter rye has been heavily researched and is the predominant cover crop planted in Iowa, but winter rye can sometimes negatively affect corn establishment, growth, and yield possibly due to water use, immobilization of soil nitrogen, interference with planter performance, or fungal disease (Munawar et al., 1990; Tollenaar et al., 1993; Duiker and Curran, 2005; Krueger et al., 2011; Kaspar et al., 2015). Oat (Avena sativa L.) is a potential cover crop for Iowa when overseeded into standing soybeans in August, but oat will not produce any spring growth because it does not overwinter in Iowa (Johnson et al., 1998).
Alternative cover crops such as hairy vetch (Vicia villosa Roth), rapeseed (Brassica napus L.), and white mustard (Sinapis alba L.) have been effective in warmer regions of the United States (Clark et al., 1994; Wilke and Snapp, 2008; Villamil et al., 2006, Weinert et al., 2002), winterhardiness zones 6a to 8b. Brassicaceae are increasingly being utilized as cover crops and can reduce weed populations due to allelophathic breakdown products from glucosinolates (reviewed in Haramoto and Gallandt, 2004). Conventional, non-genetically modified canola (Brassica napus L.) and camelina [Camelina sativa (L.) Crantz], both small-seeded annual Brassicaceae can overwinter in Iowa (Martinez-Feria, et al., 2016; Lenssen, personal observation). Recently, camelina was documented to be an effective fall seeded cash crop in west central Minnesota (Gesch and Cermak, 2011), a 3b winterhardiness zone. Camelina can survive harsh Minnesota and North Dakota (winterhardiness zone 4a) winters (Berti et al., 2015) and has been documented to produce the greatest seed yields when planted in early to Mid-October and then harvested in mid-July (Gesch and Cermak, 2011). They also reported that earlier seeding dates in September produced lower camelina seed yields.
Hairy vetch has sparked interest as an Iowa cover crop due to it’s potential to increase N supply to the following crop, which has been documented in warmer climates than the Upper Midwest (Clark et al., 1994; Sainju and Singh, 2008). Harbur et al. (2009) planted hairy vetch into fallow ground in early September and documented hairy vetch winter survival rates of 0.0% to 73.0% for 12 different hairy vetch ecotypes grown in southern Minnesota, a 4b winterhardiness zone. Hairy vetch ecotypes, which were sourced from Minnesota, had superior survival rates to hairy vetch ecotypes sourced from warmer climate areas (Harbur et al., 2009), demonstrating that hairy vetch seed source selection is an important component of improving winter survival. Hairy vetch mean aboveground biomass accumulation across two years and two locations was 1695 pounds per acre (Harbur et al., 2009).
Despite the interest in new cover crops and cover crop mixes for Iowa, few cover crops can survive the harsh Iowa winters, which limits their potential to accumulate biomass, prevent soil erosion and nitrate losses. Cover crops, and especially winter rye, effectively decrease soil erosion and nitrate losses in many environments including Iowa (reviewed in Kaspar and Singer, 2011; Kaspar et al., 2001; Kaspar et al., 2012). The use of a winter cereal cover crop such as winter rye can provide excellent biomass production and decrease soil erosion (Kaspar et al., 2001; reviewed in Kaspar and Singer, 2011) but can also create management challenges as winter cereal cover crops often result in N immobilization and limit N supply to the following crop (reviewed in Snapp et al., 2005). Release of N from cover crop residues is greatly increased when cover crops are incorporated as opposed to being left on the soil surface (Kuo et al., 1997b). Incorporation of Brassicaceae cover crops in the fall leads to increased soil N loss compared to spring incorporation (Weinert at al., 1997; Haramoto and Gallandt, 2004). Cover crop residue C:N ratio has been documented to be a good predictor of N mineralization and N residue retention (Quemada and Cabrera, 1995). High C:N ratio residues mineralize N at a slower rate and retain more N throughout the growing season, limiting the supply of soil available N to the cash crop (Quemada and Cabrera, 1995).
Cover crops have been documented to suppress weeds primarily through decreasing light transmittance to the soil (Teasdale, 1996). Teasdale et al. (1991) documented that when rye or hairy vetch cover crop residues covered more than 90% of the soil, total weed density was decreased by 78% as compared to a no-cover crop control in a sweet corn crop one month after sweet corn planting. In the same study Teasdale et al. (1991) also documented that increased cover crop biomass was positively correlated with decreased weed density and the relationship was linear. Other mechanisms for weed suppression, such as allelophathic effects from Brassicaceae cover crops, have been studied and are effective in the greenhouse (Haramoto and Gallandt, 2004), but show little evidence for being effective in the field (Haramoto and Gallandt, 2005). Teasdale (1996) reported that cover crop allelopathic effects are inconsistent and often difficult to document in field studies. When a cover crop produces adequate biomass and light interception, early season weed suppression in the crop can be observed (reviewed in Teasdale, 1996). Spring terminated cover crops rarely provide complete weed control later in the season (reviewed in Teasdale, 1996). Cover crops provide limited weed suppression when they are tilled into the soil and cover crops residues are not allowed to remain on the soil surface (Teasdale et al., 1996; Wortman et al., 2013). Wortman et al. (2013) documented that increasing the number of species in a cover crop mix did not decrease weed density or weed biomass in an organic sunflower-soybean-corn rotation when cover crops were planted in late March, terminated in late May, and weed sampling occurred approximately 30 days after cash crop planting.
Cover crops might negatively impact crop development as a result of decreased spring soil temperatures due to light interception and soil shading. Corn emergence rate is highly correlated with the accumulation of growing degree days and soil temperature (Schneider and Gupta, 1985). Increases in soil cover from crop residue in the corn row at the time of planting has been documented as a strong detriment to corn growth rates from the time of planting to V6 stage corn (Swan et al., 1987). Corn row residue coverage of 87% was documented to require an additional 48 growing degree days for corn to reach V6 stage compared to 8% corn row residue coverage (Swan et al., 1987). Increasing cover crop biomass may increase soil cover and reduce soil solar interception, but little research has been published on this topic. Cover crops can have both positive and negative effects on soil available water (Munawar et al. 1990; Liebl et al., 1992; reviewed in Miguez and Bollero, 2005; Unger and Vigil, 1998; Krueger at al., 2011). Cover crops can decrease early season soil available water through transpiration losses but also increase available soil water due to increased soil coverage from cover crop residue remaining on the soil surface (Liebl et al., 1992; reviewed in Miguez and Bollero, 2005). Increased soil water loss through cover crop transpiration could be desirable in areas where heavy, wet spring soils and frequent rainfall limit early season field operations (reviewed in Kaspar and Singer, 2011). Alternately, areas with course textured soils and limited rainfall may experience soil water deficits during the cropping season as a result of cover crop transpiration, if adequate rainfall does not occur after cover crop termination (Unger and Vigil, 1998; reviewed in Kaspar and Singer, 2011). The effect of cover crops on corn yield is highly variable and many contrasting results have been reported (Miguez and Bollero, 2005). Some studies documented that corn yield can be negatively influenced by certain cover crops in some years (Johnson et al., 1998; Krueger et al., 2011; Parr et al., 2011; Kaspar et al., 2012). Other studies documented that certain cover crops have no influence on corn yield in some years (Wortman et al., 2012b; Kaspar et al., 2012). Lastly, some studies documented that certain cover crops have a positive influence on corn yield in some years (Clark et al., 1994; Parr et al., 2011). A meta-analysis of 36 studies from the United States and Canada found on average a 21% increase in corn yield following a biculture winter cover crop, a 37% increase in corn yield following a legume winter cover crop, and no influence on yield of corn which followed a grass winter cover crop (Miguez and Bollero, 2005).
The objective of this study was to evaluate 16 potential cover crop treatments for Iowa, including two- and three-way mixtures. The effects of these 16 cover crops on (a) fall and spring cover crop aboveground biomass, carbon, and nitrogen accumulation, (b) spring soil temperature, (c) soil nutrients, (d) weed community and density, (e) corn population, (f) volumetric soil water content, (g) SPAD corn leaf chlorophyll, and (h) corn yield were examined.
Cooperators
Research
A field study was conducted at five sites in Iowa across two field years; two sites in 2013-2014 (Ames and Lewis) and three sites in 2014-2015 (Boone, Lewis, and Sutherland). Sites were selected for the purpose of capturing a wide range of growing conditions across the state of Iowa. Sites included three major soil groups, as well as significant differences in precipitation, growing degree days, and winter temperatures, but all sites are considered 5a for winterhardiness.
All five sites were in a corn-soybean rotation for over 20 years, but past tillage systems differed. Ames and Boone were conventionally tilled for at least a decade while Lewis and Sutherland had been in a no-till system for seven years or longer. For this study, fall or spring tillage was not conducted at any of the sites. Initial soil samples were collected at Boone, Lewis, and Sutherland in the fall of 2014 and analyzed for available P and K, and pH. Soil P and K levels were optimum (16-20 ppm Mehlich-3 P and 86-120 ppm Mehlich-3 K) or above optimum at every site except Boone, which received P and K in the spring of 2015 prior to planting corn. All other sites did not receive any P or K additions. Following cover crop termination in the spring, nitrogen was applied at all locations in two events with split applications. The first application occurred within a week of corn planting and the second was applied when corn was in the V6 to V8 stage. All N applications were applied as urea ammonium nitrate (UAN) with a side-dress applicator, except the V6-V8 N application at Sutherland, which was applied as dry urea with a Y-Drop system (360 Yield Center, LLC, Morton, IL). Ames site did not receive an initial spring N application due to a product application error. The N application rate at the four other research sites was 180-189 pounds N per acre due to assumed nitrate leaching due to heavy spring rains which occurred at the research sites.
Cover crop treatments were planted at all five sites immediately following soybean harvest in mid to late October (Table 1; Table 2). No tillage occurred after soybean harvest. Soybeans, which preceded cover crops, were adapted varieties with high yield potential. Soybeans were harvested at the time of maturity and as soon as field conditions and farm crew scheduling allowed. Cover crops were no-till drilled with a Tye Pasture Pleaser with row spacing of 8 in and at a seeding depth of 0.5 in. Because the 10-row Tye drill had a total planting width of 6 ft, three passes were made through each plot to plant the entire width of the plot. The Tye drill had two hoppers; a large hopper for large seeded crops such as rye and a small hopper for small seeded crops such as camelina. Cover crop treatments and seeding rates are described in Table 1.
Fall cover crop biomass sampling occurred the second week of November, immediately following a hard killing frost (Table 2). In fall 2013 Lewis cover crop biomass harvest was not done due to minimal growth. Boone fall cover crop biomass harvest was not completed because the cover crops had not emerged. Cover crop biomass harvest was completed at Ames, Lewis-2014, and Sutherland with three of four blocks sampled at each site. Cover crop stand counts were taken. Aboveground biomass of 20 randomly selected cover crop plants was hand clipped from each plot. When cover crop mixtures were sampled, the cover crops were separated by species before drying and weighing. Spring cover crop biomass harvest occurred in late April to early May (Table 2). For spring cover crop biomass samples, species within cover crop mixtures were separated at harvest. Biomass samples were analyzed for total carbon (C) and nitrogen (N) concentrations. Results from the analysis were used to calculate C and N concentration of every species, determine the contribution of each species to the mixture C and N accumulations, and calculate C:N ratios.
Table 1. Cover crop treatments and pure live seed (PLS) seeding rate for five environments in Iowa.
|
Treatment |
Grass |
Brassicaceae |
Vetch |
|
Grass |
Brassicaceae |
Vetch |
|
|
|
________ lb acre-1 ________ |
|
___________ PLS ft-2__________ |
|
||||
|
Control |
0 0 0 |
|
0 |
0 |
0 |
|||
|
Sole Crops |
|
|
|
|
|
|
|
|
|
‘Spooner’ Winter Rye |
60 |
|
|
|
21 |
|
|
|
|
‘Trical102’ Winter Triticale |
60 |
|
|
|
28 |
|
|
|
|
‘Bison’ Camelina |
|
5 |
|
|
|
59 |
|
|
|
‘Purple Top’ B. rapa (Turnip) |
|
5 |
|
|
|
47 |
|
|
|
Hairy Vetch (VNS) |
|
|
15 |
|
|
|
5 |
|
|
‘Sitro’ Canola |
|
5 |
|
|
|
36 |
|
|
|
‘Claremore’ Canola |
|
5 |
|
|
|
36 |
|
|
|
‘Tradition’ Spring Barley |
75 |
|
|
|
21 |
|
|
|
|
Spring Oat (VNS) |
75 |
|
|
|
21 |
|
|
|
|
Rye Mixtures |
|
|
|
|
|
|
|
|
|
Rye-‘Claremore’ Canola |
40 |
5 |
|
|
14 |
36 |
|
|
|
Rye-Camelina |
40 |
5 |
|
|
14 |
59 |
|
|
|
Rye-Vetch |
40 |
|
10 |
|
14 |
|
3 |
|
|
Rye-Camelina-Vetch |
40 |
5 |
10 |
|
14 |
59 |
3 |
|
|
Triticale Mixtures |
|
|
|
|
|
|
|
|
|
Triticale-Camelina |
40 |
5 |
|
|
19 |
59 |
|
|
|
Triticale-Vetch |
40 |
|
10 |
|
19 |
|
3 |
|
|
Triticale-Camelina-Vetch |
40 |
5 |
10 |
|
19 |
59 |
3 |
|
Spring soil sampling occurred the same day or one day after spring cover crop biomass harvest (Table 2). Determination of weed community in cover crops occurred two weeks before spring cover crop biomass harvest at Ames and Lewis in 2014 and the same day as spring cover crop biomass harvest at Boone, Lewis, and Sutherland in 2015. Ames and Sutherland data were not included in the analysis due to very low weed density at these sites. Any plant that was not a cover crop was considered a weed.
Cover crops were chemically terminated within three days of spring cover crop biomass harvest through application of glyphosate. Cover crops at the Boone site were also treated with 2,4-D at termination. Herbicide with residual activity was intentionally omitted from the first spray for subsequent determination of weed community in corn prior to the first in-crop herbicide application.
Corn planting occurred in late April to early May (Table 2). Corn was planted with a no-till Kinze (Kinze Manufacturing, Williamsburg, IA) planter at all sites. Row spacing was 30 in and planting depth was 1.5 to 2 in deep. Each plot contained eight corn rows 20-ft in length. Corn planting population was 32,300 seeds per acre at all sites except Boone, which was planted at 33,800 seeds per acre. Full season, glyphosate tolerant corn varieties were planted at all locations (Table 2).
Table 2. Field operation dates, corn variety, and N fertilizer rates and forms for 5 Iowa research sites. Ames, Lewis 1; 2013-2014. Boone, Lewis2, Sutherland; 2014-2015.
|
Field Operation |
Ames |
Lewis1 |
Boone |
Lewis2 |
Sutherland |
|
|
|
|
|||||
|
Cover Crop Planting |
Oct. 10,11 |
Oct. 17,18 |
Oct. 29 |
Oct. 21 |
Oct. 14,15 |
|
|
Fall Cover Crop Biomass Harvest |
Nov. 9,10 |
na† |
na‡ |
Nov. 12 |
Nov. 13 |
|
|
Spring Weeds in Cover Crop |
Apr. 21 |
Apr. 21 |
May 12 |
Apr. 22 |
Apr. 28 |
|
|
Spring Cover Crop Biomass Harvest |
May 5 |
May 6 |
May 12 |
Apr. 22 |
Apr. 28 |
|
|
Spring Soil Sample |
May 5 |
May 6 |
May 13 |
Apr. 22 |
Apr. 28 |
|
|
Cover Crop Termination |
May 6 |
May 6 |
May 13 |
Apr. 23 |
Apr. 30 |
|
|
Corn Planting |
May 19 |
May 9 |
May 13 |
Apr. 29 |
Apr. 30 |
|
|
Initial Nitrogen Application |
na§ |
May 6 |
May 21 |
Apr. 29 |
May 6 |
|
|
Corn Population Sample |
June 9 |
June 10 |
June 10 |
May 21 |
May 21 |
|
|
Weeds in Corn |
June 3 |
June 10 |
June 1 |
May 21 |
May 21 |
|
|
Post Emergence Herbicide |
June 13 |
June 10 |
June1 |
May 21 |
June 16 |
|
|
In Corn Nitrogen Application |
June 26 |
June 16 |
July 2 |
June 18 |
July 2 |
|
|
Corn Harvest |
na¶ |
Oct. 16 |
Oct. 16 |
Oct. 22 |
Oct. 20 |
|
|
Corn Variety |
Pioneer P0453AM |
Wyffels 6626 |
Pioneer P0453AM |
Pioneer P0937 |
Pioneer P0297 |
|
|
Initial N Application Rate# |
0 |
139 |
120 |
120 |
120 |
|
|
Initial N Application Form |
|
32% UAN†† |
28% UAN |
32% UAN |
28% UAN |
|
|
In Corn N Application Rate |
71 |
50 |
60 |
60 |
60 |
|
|
In Corn N Application Form |
32% UAN |
32% UAN |
32% UAN |
32% UAN |
Dry Urea |
|
†na= not applicable; negligible cover crop emergence, no data collected.
‡ na= not applicable; cover crops did not emerge.
- na= not applicable; initial N application never occurred.
¶ na= not applicable; site abandoned in July, frequent ponding and lack of N fertilizer.
# all N rates are lb N acre-1.
†† UAN= urea ammonium nitrate.
Soil temperature probes were deployed at corn planting at the Boone site in eight selected plots to measure soil temperature to determine if rye or rye mixes influenced soil temperature at corn seed depth in comparison to a no-cover crop control. Corn population was determined at all five sites at approximately V2 stage corn. Weed community was determined at all sites from late May to early June before any post emergence herbicides were applied (Table 2). A post-emergence herbicide was applied to all five sites in late May to early June. Standard and appropriate labeled herbicides were tank mixed with a residual herbicide and were applied to control grass and broadleaf weeds (Table 2).
Soil volumetric water content (VWC) measurements were taken at corn planting, V6 corn, and R1 corn. Measurements were taken at all sites for all three corn stages except at the time of corn planting at Lewis1 due to a miscommunication with the farm manager. All VWC measurements from Ames were not included in the analysis due to four ponding events during the growing season and poor corn growth due to no initial N application. The VWC was sampled for the 0-3 in and 0-8 in depth layers. Corn leaf chlorophyll measurements were taken at V6 and R1 stage corn at all sites except Ames, with a non-destructive SPAD-502 chlorophyll meter (Konica Minolta, Inc., Osaka, Japan). During the V6 sampling each corn plant sampled was marked with brightly colored ribbon so that identical plants could be resampled at R1. Corn harvest occurred in mid to late October (Table 2). Corn yield data were collected with a self-propelled combine equipped with a calibrated yield monitor from the center four rows of every plot. Corn yield data were adjusted to 15.5% moisture.
Data were analyzed with PC-SAS v9.4 using the GLIMMIX procedure (SAS Institute Inc., 2014, Cary, NC, USA). The GLIMMIX procedure was selected due to the missing values discussed in the previous paragraph. Cover crop treatment was considered a fixed effect and was the response variable. Year and location were combined into one factor of ‘environment’ and environment was considered a random effect. Environment, block, and the environment × block interaction were considered random effects. The LSMEANS statement was used to calculate treatment least squares means and the LINES statement was used to determine approximate t-groupings for the treatment least squares means. Differences between means were reported as significant at a P-value of 0.05.
Fall Cover Crop Aboveground Biomass
When fall cover crop stand counts and aboveground biomass harvest were determined at Ames, Lewis, and Sutherland in 2014, the grasses were at two-leaf stage, the Brassicaceae cover crops were at early cotyledon stage, and vetch shoot length was approximately 2 in. Biomass harvest was taken in late fall, at the time of the first killing frost. Biomass harvest did not occur at Boone because the cover crops did not emerge until the following spring. Biomass harvest did not occur at Lewis in fall 2013 because biomass accumulation was negligible with grasses barely emerged. Soybean harvest occurred approximately 1-2 weeks later than in most years due to wet field conditions, which limited available growing degree days for cover crop development due to later planting. Despite cover crops being planted at each site one or two days after combine harvest of soybean, postharvest heat unit accumulation was limited, resulting in poor fall cover crop biomass accumulation at all sites (Table 3). Cover crops had at most three to four weeks to germinate, emerge, and grow before the first hard killing frost (Table 2). Johnson et al. (1998) documented a mean of 393 pounds per acre of fall aboveground biomass when oat and winter rye cover crops were overseeded into soybeans in August in Iowa. The most productive cover crop in our study produced 15% of the fall cover crop biomass of the Johnson et al. (1998) study. Early maturity soybean cultivars which can be harvested earlier, or intercrop cover crop seeding by either aerial application or a high-clearance tractor with drop tubes, may allow cover crops to achieve significantly more biomass accumulation and improved winter survival of canola and hairy vetch cover crops.
Cover crops differed for fall biomass accumulation with rye-camelina mix producing the greatest amount of aboveground biomass, 61 pounds per acre (Table 3). Rye monoculture and rye mixtures did not differ in biomass production. Triticale associated cover crops produced slightly less biomass than rye-associated cover crops. Triticale monoculture and triticale mixtures did not differ in biomass production. These results would lead to the conclusion that fall biomass production was not greater in mixtures than in a monoculture under the conditions and cropping systems of this study. In general, the treatments that included a grass accumulated at least twice as much biomass as the sole crop Brassicaceae treatments (Table 3). Hairy vetch monoculture accumulated 4 pounds per acre, the least biomass of all cover crops and cover crop mixtures, producing 90.1% less biomass than monoculture rye (Table 3). Apparently, hairy vetch must be planted earlier in the fall to allow the accumulation of more growing degree days to increase potential winter survival (Samarappuli et al. 2014). It is also possible that the hairy vetch genotype used in this study may not have sufficient winter hardiness to tolerate harsh Iowa winters with limited snow cover, as occurred in this study.
Table 3. Fall aboveground biomass cover crop associated response variables. Cover crop biomass accumulation, cover crop carbon accumulation, cover crop nitrogen accumulation, cover crop C:N ratio for 3 Iowa sites 2013-2014.
|
Treatment † |
Biomass |
Carbon |
Nitrogen |
C:N ratio |
|
|
|
________ lb acre-1 ________ |
|
|||
|
Sole Crops |
|
|
|
|
|
|
Winter Rye |
50 ab |
22 a |
2.1 ab |
10.7 a |
|
|
Winter Triticale |
37 abcd |
17 abc |
1.7 abc |
10.0 abc |
|
|
Camelina |
18 cdefg |
6 bcde |
0.7 cdef |
9.3 cde |
|
|
Purple Top Turnip |
16 defg |
6 cde |
0.7 cdef |
8.8 fe |
|
|
Hairy Vetch |
4 g |
2 e |
0.3 f |
8.2 f |
|
|
‘Sitro’ Canola |
11 fg |
5 e |
0.4 ef |
9.0 def |
|
|
‘Claremore’ Canola |
12 efg |
4 de |
0.5 def |
8.3 f |
|
|
Spring Barley |
54 ab |
23 a |
2.8 a |
8.1 f |
|
|
Spring Oat |
37 abcde |
16 abc |
1.6 abcd |
9.6 cde |
|
|
Rye Mixtures |
|
|
|
|
|
|
Rye-‘Claremore’ Canola |
41 ab |
21 a |
2.1 ab |
10.2 abc |
|
|
Rye-Camelina |
54 a |
26 a |
2.5 ab |
10.5 ab |
|
|
Rye-Vetch |
48 ab |
24 a |
2.4 ab |
9.9 abc |
|
|
Rye-Camelina-Vetch |
38 abc |
18 a |
1.8 abc |
10.1 abc |
|
|
Triticale Mixtures |
|
|
|
|
|
|
Triticale-Camelina |
41 abcd |
16 abc |
1.6 bcde |
10.6 ab |
|
|
Triticale-Vetch |
35 bcdef |
15 abcd |
1.5 bcde |
9.7 abcd |
|
|
Triticale-Camelina-Vetch |
42 abcd |
16 ab |
1.8 abc |
9.9 abcd |
|
|
Significance |
|
|
|
|
|
|
Treatment |
*** |
*** |
*** |
*** |
|
* Significant at P ≤ 0.05; ** Significant at P ≤ 0.01; *** Significant at P ≤ 0.001.
† Means followed by different lower case letter within a column in a set are significantly different at P ≤ 0.05 by the least square means test.
Fall Cover Crop Stand Density
Cover crop entries differed for stand density; rye-camelina had the greatest stand density. Monoculture rye and monoculture camelina produced stand densities that were 43% and 63% of the stand density of rye-camelina mixture. Rye mixtures and triticale mixtures which included camelina produced the greatest stand densities. These results lead to the conclusion that fall cover crop stand densities can be significantly greater in a mixture than in a monoculture when two productive monoculture cover crops are planted as a mix, as long as seeding rates of either are not greatly decreased.
Fall Cover Crop C and N Accumulation and C:N Ratio
Cover crop entries differed in their aboveground C and N accumulation and C:N ratio (Table 3). Entries that included a grass accumulated the most C and N (Table 3). Among entries, the C:N ratio was generally lowest for the Brassicaceae and vetch sole crops (Table 3). Cover crop residues that remain on the soil surface and have a high C:N ratio decompose and release accumulated N more slowly than low C:N ratio cover crop residues (Quemada and Cabrera, 1995). Despite the statistical significance among species for fall cover crop biomass, C, and N accumulation, cover crop growth was nominal compared to other areas of the United States, different cropping systems, or earlier cover crop planting dates that accumulate more heat units following cover crop planting and the onset of winter (Kuo et al., 1997a,b; Sainju et al., 2005; Sainju and Singh, 2008; Poffenbarger et al., 2105). The most productive cover crop in our study produced 2-10% of the fall cover crop biomass of six different cereal forage crops, which were seeded in August in winterhardiness zones 4b and 5a in Wisconsin (Maloney et al., 1999). Finney et al. (2016) documented that when cover crops were seeded after oat harvest in August in Pennsylvania (winterhardiness zone 6b) fall cover crop biomass accumulations of winter rye and winter rye mixtures all produced at least 10 times greater biomass accumulation than the most productive cover crop in our study.
Spring Cover Crop Aboveground Biomass
The majority of turnip and vetch plants winterkilled and the spring turnip and vetch biomass collected probably came from hard seed, which did not emerge in the previous fall. In southern Minnesota (winterhardiness zone 4b), hairy vetch planted into fallow ground in early to mid-September had survival rates of 0-73% across 12 ecotypes sourced from differing locations in the United States (Harbur et al., 2009). They also documented that all 12 hairy vetch ecotypes winterkilled at one out of six locations across three years of the study, and the average hairy vetch survival rate was approximately 50% (Harbur et al., 2009). Our study had lower hairy vetch survival rates and was planted much later than the Harbur et al. (2009) study. We are not aware of optimal fall developmental growth stage for winter survival of hairy vetch.
Sitro canola, Claremore canola, barley, and oat all winterkilled and produced no spring growth. Oat does not survive the winter in Iowa (Johnson et al., 1998), so it was expected it would winterkill. Gusta and O’Connor (1987) documented that barley at the two-leaf stage does not survive temperatures below 14°F. In our study the barley had just reached two leaf stage in the fall and winter temperatures were far below 14°F. Rife and Zeinali (2003) documented that canola rarely survives temperatures below 10°F. Canola generally doesn’t survive winter unless it has reached rosette stage or has at least 6 fully developed leaves (Great Lakes Canola Association, 2016). In this study, canola plants only reached cotyledon stage and none survived the harsh winters. Temperatures dropped below -20°F on multiple occasions at all sites during the 2013-2014 and 2014-2015 winters, with no snow cover during several of these events. It should be noted that the rye-canola mix contained no canola biomass in the spring due the winterkill of canola (Figure 2). Camelina survived winter well in our study, similar to other reports from winterhardiness zones 3b and 4a in the upper Midwest (Gesch and Cermak, 2011; Gesch and Archer, 2013; Gesch et al. 2014).
Cover crop entries influenced spring cover crop aboveground biomass accumulation (Figure 1). Rye-vetch mixture was composed of 97% rye biomass and produced the most biomass of all cover crops, but it was not significantly different from any other rye-associated treatment or the three-species mixture of triticale-camelina-vetch (Figure 1). Rye and mixtures with rye accumulated the most biomass with a mean of 676 pounds per acre across the five rye treatments. Spring winter rye biomass accumulation was very similar to another recent Iowa study in which ‘Wheeler’ winter rye produced 642 pounds per acre of biomass over a three-year study (Pantoja et al., 2015). Conversely, Kaspar and Bakker (2015) reported mean aboveground biomass yield of 1990 pounds per acre from six winter rye cultivars grown in Iowa over a different four-year period, 2006-2009, a period with greater growing degree days (GDD) accumulation than observed during the period of our study. In a five-year study from 2005-2009, Kaspar et al. (2012) reported average spring biomass accumulation of 1170 pounds per acre for winter rye. As for other annual crops, winter rye biomass accumulation is influenced by environment, cultivar, date of termination, and numerous other factors.
At cover crop termination, rye and triticale mixtures had produced similar biomass to their corresponding monocultures (Figure 1). Both rye and triticale were highly competitive with the intercropped Brassicaceae and vetch (Figure 1). Rye production was greater than 79% and triticale production was greater than 58% of the total biomass in two- and three-way mixtures (Figure 1). These findings are consistent with other studies which have found that cover crop mixes do not produce more biomass than the most productive cover crop monocultures (Finney et al., 2016; Poffenbarger et al., 2015; Wortman et al., 2012a). Other studies have confirmed that rye often dominates biomass production in a mixture (Clark et al., 1994; Finney et al., 2016; Poffenbarger et al., 2015). Poffenbarger et al. (2015) examined cover crop planting ratios for hairy vetch-winter rye mixtures and recommended a hairy vetch:winter rye seeding rate of 27:34 ratio in order to maximize nitrogen content of the cover crop and maintain a relatively low C:N ratio for a cover crop, which was planted in Mid-September to Mid-October in Maryland after a soybean cover crop that was terminated in late August. In the same study, if rye was proportionally greater than a seeding rate of 27:34 ratio of hairy vetch:winter rye, rye biomass dominated the mix for three out of four site years (Poffenbarger et al., 2015). Winter rye/hairy vetch seeding ratio in our study was 45:11 ratio, which would give a strong advantage to the winter rye. Triticale monoculture produced 50% as much biomass as the mean of the rye-associated cover crops (Figure 1). It should be noted that our study only included a single cultivar of winter rye, winter triticale, camelina, hairy vetch, turnip, spring barley, and spring oats so our results may not be representative of each species. Camelina monoculture produced 41% as much biomass as the mean of rye-associated cover crops (Figure 1). Camelina and vetch produced less biomass in a mix than when grown as a monoculture (Figure 1). Turnip and vetch produced 15% and 10% as much biomass as rye-associated cover crops, respectively, and had sparse stand density due to lack of overwintering.
Spring Cover Crop C and N Accumulation and C:N Ratio
Rye-associated cover crops accumulated the most aboveground C and N with a mean of 281 pounds C per acre and 19 pounds N per acre across the five rye-associated treatments (Figures 2,3). Rye mixes did not accumulate more C or N than a rye monoculture (Figures 2,3). Due to their increased biomass production, winter rye cover crops have the potential to contribute more soil organic carbon and accumulate more soil N than the other cover crop treatments included in this study. Kuo et al. (1997a) also documented similar results to our study, demonstrating that winter rye had greater potential to increase soil organic carbon than hairy vetch, canola, or Austrian winter pea [Pisum sativum L. ssp. arvense (L.) Poir.]. On average, approximately 20-23 pounds N per acre is lost from Iowa corn-soybean farm ground every year through nitrate leaching (Christianson et al., 2012). Nitrogen fertilizer recommendations in Iowa assume that nitrate which is present in fall soil samples is lost via leaching or denitrification (Sawyer, 2013). In our study, the five treatments which included a winter rye cover crop accumulated a mean of 19 pounds N per acre in aboveground biomass (Figure 3b), which should reduce the N being lost from Iowa farm ground in the months of October-April when crops are otherwise not growing in Iowa fields. In a three-year field study at four Iowa locations, Pantoja et al. (2015) documented that winter rye cover crops accumulated 19 pounds N per acre, identical to what we report. Camelina and vetch accumulated 36% and 10% as much C and 60% and 13% as much N, respectively, as the mean of the five rye-associated treatments. Camelina and vetch accumulated much less C and N when grown in a mix compared to a monoculture (Figure 3), likely due to competition from rye and triticale.
The C:N ratio of rye-associated cover crops was greater than for all other cover crops and cover crop mixtures, except for triticale monoculture and triticale-vetch. The C:N ratio did not differ between rye monoculture and rye mixtures. Two out of three triticale mixtures had significantly lower C:N ratios than all of the rye-associated cover crops. Camelina monoculture had a lower C:N ratio than all rye and triticale-associated cover crops. Turnip had the lowest C:N ratio (Figure 4), but this was comparatively unimportant as turnip produced limited biomass from seeds that germinated in the spring (Figure 1).
The C:N ratio for rye mixtures were somewhat surprising as we expected rye mixtures to have lower C:N ratios than rye monoculture as previously documented by Sainju et al. (2005). Sainju et al. (2005) planted a fall seeded rye and hairy vetch biculture in Georgia at 50% of the rye and 68% of the hairy vetch monoculture rates. Sainju et al. (2005) documented rye monoculture C:N ratios of 29, 57, and 40 and rye-hairy vetch mixture C:N ratios of 10, 32, and 11 across a three-year study. We had assumed the presence of camelina and vetch with low C:N ratios, would decrease the C:N ratio of the mix. But this was not the case; probably due to the fact that rye accounted for 79% or more of the biomass in rye mixtures, and triticale accounted for 58% or more of the biomass in triticale mixtures. Our results may have been different if seeding ratios would have been adjusted to greatly decrease the seeding rate of rye and triticale, while increasing the seeding rate of hairy vetch and camelina.
The C:N ratio is often a major factor in determining cover crop rate decomposition and N release (reviewed in Blanco-Canqui et al., 2015). All cover crop entries included in this study had C:N ratios less than 14:1, in large part because their growth and development was low due to lack of accumulated heat units prior to their termination for planting corn. Weinert at al. (2002) documented that cover crops with C:N ratios below 16:1 were unlikely to cause N immobilization; therefore, we can assume that although C:N ratio probably affected decomposition rates, cover crop entries in our study did not immobilize soil N. Due to differences in cover crop C:N ratio, cover crop residue N release may have been slower for the rye-associated cover crops, intermediate for the triticale-associated cover crops as well as the vetch, fast in the camelina and turnip, and very fast in the cover crops which did not overwinter. The assumption that winterkilled cover crops released N very fast is supported by Weinert et al. (2002), who documented that cover crops which winterkill release and leach N more quickly than cover crops which overwinter.
Soil Growing Degree Days
Over the 34-day period following corn planting, accumulated soil growing degree days were similar at corn seeding depth for rye, rye-camelina, rye-camelina-vetch, and the no-cover crop control (Table 4). A high percentage of the accumulated rye biomass present at cover crop termination remained on the soil surface, but this did not influence soil growing degree days. Other studies have found that cover crop residues can reduce spring soil temperatures, total seed germination, and negatively influence crop establishment in no-till systems while moderating temperature extremes by decreasing day time high temperatures and increasing night time low temperatures (reviewed in Blanco-Canqui et al., 2015). None of these effects were observed in this study, perhaps due to limited biomass production or relatively high soil residue cover in the no cover crop treatment. Biomass accumulation may have been insufficient to impact radiation interception. It is also possible that rye transpired increased levels of soil water and created a drier soil than the control. Dry soil has the potential to heat and cool more quickly than wet soil (Licht and Al-Kaisi, 2005). Drier soil in the rye treatment may have compensated for decreased solar interception caused by the rye residues shading the soil surface.
Table 4. Spring cover crop (CC) associated response variables not affected by cover crop treatment. Mehlich-3 P at cover crop termination, Mehlich-3 K at cover crop termination, weed density in cover crop at cover crop termination, weed density in V2/V3 corn for 5 Iowa locations 2014-2015. Accumulated soil growing degree days (GDD, corn planting to 34 days after planting) for Boone location 2015.
|
Treatment |
M3P-P |
M3K-K |
Weeds in CC |
Weeds in Corn |
Soil GDD |
|
|
|
______ ppm ______ |
____ weeds ft-2 ____ |
GDD °F† |
|||
|
Control- no cover crop |
16.3 |
145 |
6.4 |
8.2 |
932 |
|
|
Sole Crops |
|
|
|
|
|
|
|
Winter Rye |
17.1 |
151 |
6.2 |
7.0 |
946 |
|
|
Winter Triticale |
19.1 |
145 |
5.6 |
12.4 |
na‡ |
|
|
Camelina |
17.6 |
140 |
4.3 |
9.3 |
na |
|
|
Purple Top Turnip |
21.9 |
151 |
5.1 |
7.4 |
na |
|
|
Hairy Vetch |
19.4 |
149 |
7.0 |
8.2 |
na |
|
|
‘Sitro’ Canola |
19.7 |
146 |
6.4 |
9.2 |
na |
|
|
‘Claremore’ Canola |
20.7 |
143 |
6.4 |
7.4 |
na |
|
|
Spring Barley |
19.1 |
145 |
7.9 |
10.2 |
na |
|
|
Spring Oat |
17.4 |
146 |
7.9 |
8.5 |
na |
|
|
Rye Mixtures |
|
|
|
|
|
|
|
Rye-‘Claremore’ Canola |
17.0 |
148 |
4.8 |
7.4 |
na |
|
|
Rye-Camelina |
19.1 |
148 |
3.4 |
8.9 |
939 |
|
|
Rye-Vetch |
19.1 |
145 |
5.0 |
9.9 |
na |
|
|
Rye-Camelina-Vetch |
19.1 |
150 |
3.3 |
6.8 |
943 |
|
|
Triticale Mixtures |
|
|
|
|
|
|
|
Triticale-Camelina |
16.5 |
146 |
4.5 |
6.3 |
na |
|
|
Triticale-Vetch |
19.7 |
150 |
5.5 |
8.6 |
na |
|
|
Triticale-Camelina-Vetch |
15.4 |
150 |
4.1 |
6.8 |
na |
|
|
Significance |
|
|
|
|
|
|
|
Treatment |
NS§ |
NS |
NS |
NS |
NS |
|
|
P Value |
0.766 |
0.882 |
0.316 |
0.740 |
0.065 |
|
† Cumulative Growing Degree Days °C with Tmin=41°F, Tmax=86°F.
‡ na, not applicable, data not collected. § Not significant.
Spring Soil Nutrients
Cover crops did not influence soil extractable Mehlich-3 P and K concentrations from 0-6 in at the time of cover crop termination and had similar P and K concentrations to the no cover crop control (Table 4). Mean soil P and K concentration was 18 and 147 ppm, respectively. However, cover crops differed in their effect on soil nitrate concentration (Figure 3). Rye, rye mixtures, triticale-camelina, and triticale-camelina-vetch cover crops produced greater biomass than the other cover crop treatments and consequently, soil at 0 to 6 in had significantly lower soil nitrate concentrations than soil in the no cover crop control (Figure 3). Conversely, soil nitrate concentrations where cover crops produced limited or no spring growth did not have significantly different soil nitrate concentrations from the control (Figure 3). At the time of cover crop termination increased cover crop biomass was negatively correlated with soil nitrate concentration in this study (results not presented). In another study conducted in Iowa, Pantoja et al. (2015) documented similar results, finding that a winter rye cover crop had decreased soil nitrate levels at the time of spring cover crop termination.
Weed Community
Weed density and weed community associated with cover crops before cover crop termination was similar among cover crop entries and the control (Table 4). Mean weed density taken at the time of cover crop termination was 5.5 weeds ft-2. Weed community at the time of cover crop termination across all site years contained 42.4% shepherd’s purse [Capsella bursa-pastoris (L.) Medik], 31.0% clover (Trifolium spp.), 7.9% neckweed (Veronica peregrina L.), 6.7% field pennycress (Thlaspi arvense L.), 2.7% West Indian black nightshade (Solanum ptycanthum Dunal), and 9.3% composed of 12 other species.
Weed density and weed community associated with corn was taken approximately 22 days after corn planting and results were similar among cover crop entries and the control (Table 4). Mean weed density associated with corn was 8.4 weeds ft-2. Weed community associated with corn was 83.6% tall waterhemp [Amaranthus tuberculatus (Moq.) Sauer], 5.0% shepherd’s purse [Capsella bursa-pastoris (L.) Medik], 2.3% velvetleaf (Abutilon theophrasti Medik), and 9.1% composed of 24 other species. Weed density among cover crops and the no cover crop control was similar for both sampling events of weeds within cover crops before cover crop termination and also within the growing corn at an average of 22 days after corn planting (Table 4). Weed suppression by cover crops is often determined by the quantity of cover crop biomass produced (Teasdale, 1996; Finney et al., 2016; Smith et al., 2015), which is highly dependent on the accumulation of heat units. Few heat units were accumulated between soybean harvest in the fall and corn planting in the subsequent spring, resulting in limited biomass accumulation of cover crops. Finney et al. (2016) reported that cover crop biomass production which exceeded 4126 ± 454 pounds per acre was the plateau at which nearly 100% weed suppression occurred. The cover crops included in our study achieved far less biomass production than the Finney et al. (2016) study which is a probable explanation for why cover crops had limited influence on weed density or weed community. Smith et al. (2015) documented that different functional or family classifications of cover crops did not serve as directional filters, increasing or decreasing certain weed species, and that cover crop mixtures did not provide better weed suppression than cover crop monocultures. We had hoped to test our cover crops in a similar fashion as the Smith et al. (2015) study, but the cover crops in our study did not significantly influence weed community. Cover crops have a great deal of variation in their influence on weed suppression (Teasdale, 1996; Blanco-Canqui et al., 2015). Brassicaceae cover crops have been reported to suppress weed emergence in greenhouse settings due to the production of toxic glucosinolate breakdown products, (Haramoto and Gallandt, 2004) but these breakdown products show little evidence for being effective in the field (Haramoto and Gallandt, 2005; Teasdale, 1996). Our results support the hypothesis that glucosinolate breakdown products do not suppress weeds in the field, at least for the amount of biomass and glucosinolates accumulated.
Corn Population
Cover crops did not influence corn population as measured in V2-V3 corn; mean corn population was 30,500 plants acre-1 (Table 5). At the one environment where soil temperature was monitored in the seed zone, Boone in 2015, cover crops did not influence corn stand density (results not presented). Pantoja et al. (2015) documented a 5% reduction in corn population following a winter rye cover crop with similar biomass production as our study. Pantoja et al. (2015) reported that the corn population reduction may have been due to incomplete rye residue removal from the corn row and early season insect feeding on corn plants. These problems did not occur in our study. Many climatic factors including soil moisture, soil temperature, and growing degree days contribute to early season corn development so it is difficult to determine exactly why these two studies report different results for the influence of cover crops on corn stand density.
Table 5. Spring corn associated response variables not affected by cover crop treatment. Corn population ×1000, soil volumetric water content (VWC; 0-3 in depth at corn planting, 0-3 in depth at V6 corn, 0-8 in depth at V6 corn, 0-3 in depth at R1 corn, 0-8 in depth at R1 corn), corn grain yield at 15.5% moisture for 4 Iowa locations 2014-2015.
|
Treatment |
Corn Pop |
VWC 0-3” Planting† |
VWC 0-3” V6 |
VWC 0-8” V6 |
VWC 0-3” R1 |
VWC 0-8” R1 |
|
|
||||||
|
|
Plants ac1 |
_______________ Soil VWC % _______________ |
|
|||||||||||
|
Control- no cover crop |
30.3 |
33.7 |
33.5 |
51.8 |
32.9 |
48.5 |
|
|||||||
|
Sole Crops |
|
|
|
|
|
|
|
|||||||
|
Winter Rye |
30.1 |
28.2 |
34.9 |
54.2 |
32.6 |
49.2 |
|
|||||||
|
Winter Triticale |
30.6 |
34.0 |
35.5 |
54.3 |
33.3 |
50.7 |
|
|||||||
|
Camelina |
31.1 |
32.7 |
33.5 |
53.1 |
31.3 |
47.3 |
|
|||||||
|
Purple Top Turnip |
30.8 |
34.0 |
33.8 |
54.5 |
32.1 |
50.4 |
|
|||||||
|
Hairy Vetch |
30.7 |
35.1 |
35.6 |
53.7 |
32.7 |
49.6 |
|
|||||||
|
‘Sitro’ Canola |
30.4 |
34.2 |
33.1 |
52.9 |
32.7 |
49.5 |
|
|||||||
|
‘Claremore’ Canola |
30.2 |
34.6 |
32.3 |
54.0 |
31.2 |
49.1 |
|
|||||||
|
Spring Barley |
30.9 |
32.8 |
30.7 |
51.5 |
31.0 |
48.2 |
|
|||||||
|
Spring Oat |
30.5 |
34.0 |
34.4 |
52.0 |
34.4 |
48.3 |
|
|||||||
|
Rye Mixtures |
|
|
|
|
|
|
|
|||||||
|
Rye-‘Claremore’ Canola |
30.2 |
30.2 |
31.9 |
53.5 |
33.6 |
49.1 |
|
|||||||
|
Rye-Camelina |
29.0 |
28.7 |
32.7 |
54.0 |
31.3 |
48.2 |
|
|||||||
|
Rye-Vetch |
30.2 |
28.4 |
32.3 |
52.4 |
30.4 |
47.9 |
|
|||||||
|
Rye-Camelina-Vetch |
30.1 |
29.7 |
33.1 |
52.6 |
33.7 |
49.3 |
|
|||||||
|
Triticale Mixtures |
|
|
|
|
|
|
|
|
||||||
|
Triticale-Camelina |
30.8 |
31.1 |
33.1 |
53.6 |
32.0 |
49.1 |
|
|||||||
|
Triticale-Vetch |
30.4 |
33.4 |
29.6 |
51.8 |
33.2 |
48.8 |
|
|||||||
|
Triticale-Camelina-Vetch |
30.5 |
29.6 |
32.7 |
53.0 |
32.9 |
47.8 |
|
|||||||
|
Significance |
|
|
|
|
|
|
|
|
||||||
|
Treatment |
NS‡ |
NS |
NS |
NS |
NS |
NS |
|
|||||||
|
P Value |
0.83 |
0.12 |
0.27 |
0.67 |
0.88 |
0.73 |
|
|||||||
† VWC 0-3 in at planting, data only for 3 locations, all in 2015. ‡ Not significant.
Volumetric Soil Water Content
Cover crops did not influence soil VWC at 0-3 in depth at corn planting, 0-3 in depth at V6, 0-8 in depth at V6, 0-3 in depth at R1, or 0-8 in depth at R1 stage corn (Table 5). Cover crops influenced VWC at 0-8 in depth at corn planting (Figure 4). Although VWC at 0-8 in depth at corn planting did not differ between most cover crop entries (rye-vetch mixture was the only entry which was significantly different from the control), a generalization can be made that the cover crops with higher levels of spring biomass accumulation resulted in lower VWC in comparison to the other cover crops and the no-cover crop control (Figure 4). Rye-associated cover crops and triticale mixtures generally had lower VWC than the control at 0-20 cm depth at corn planting (Figure 4). Rye monoculture and rye mixes were similar for VWC (Table 5, Figure 4). Monoculture triticale had significantly greater VWC than triticale mixtures at 0-20 cm depth at corn planting, and it is unclear why this occurred. Gesch and Johnson (2015) reported that camelina used less water than soybean in Minnesota. Nielsen et al. (2015) documented that cover crop monocultures and mixtures used similar amounts of soil water and were similar for water use efficiency (Nielsen et al., 2015). Daigh et al. (2014) documented that even during drought in 2012, rye cover crops either did not affect or increased soil VWC. It should be noted that although VWC was reduced at 0-8 in at corn planting, is it unlikely corn was limited by water availability. All sites received average or above average spring precipitation. Differences in VWC between treatments could generally be described as wet versus very wet soils at four out of five research sites at the time of corn planting.
Corn Leaf Chlorophyll
Cover crops influenced corn leaf chlorophyll content at both V6 and R1 stage corn. At V6, chlorophyll content for rye-associated cover crops was significantly lower than the no-cover crop control (Figure 5). Corn following the triticale-camelina-vetch mixture was the only other treatment which had significantly lower chlorophyll content than the control. SPAD chlorophyll readings indicate leaf greenness and N content (Costa et al., 2001) so it might be concluded that rye cover crops decreased corn N accumulation. This is reasonable to assume as rye-associated cover crops had the highest N accumulation and C:N ratios, leading to slower N release, and lowest soil nitrate concentrations in soil (Figure 4, Figure 5). We observed that corn leaves were visibly less green in some plots which followed a rye cover crop. This would suggest that soil N, which was originally taken up by the rye, may not yet have been returned to the soil in an available form by stage V6. The N was probably retained in slowly decomposing rye residue on the soil surface, a phenomenon that has been observed in previous research (Quemada and Cabrera, 1995).
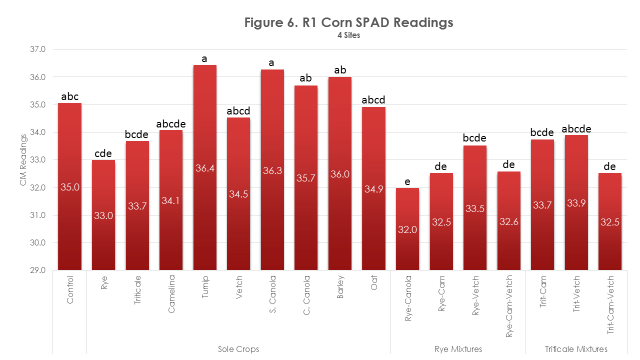
At R1 stage corn, corn leaf chlorophyll content was lower when following rye-canola, rye-camelina, rye-camelina-vetch, and triticale-camelina-vetch cover crops than corn that followed the no-cover crop control (Figure 6). Corn, which followed these four cover crops, also had lower corn leaf chlorophyll content than corn, which followed the no-cover crop control at V6. Lower chlorophyll content throughout the growing season in the aforementioned cover crops was probably a result of increased cover crop uptake of soil N, higher C:N ratios of cover crop residues, and a slow release of N from cover crop residues which limited corn N accumulation through R1 stage corn. These results indicate that reduced corn leaf N content may occur as a result of increased cover crop growth even when N application rates of 150 pounds N acre-1 are exceeded. Alternately, rye may have had an allelopathic effect on corn due to benzoxazinones (Schulz et al., 2013).
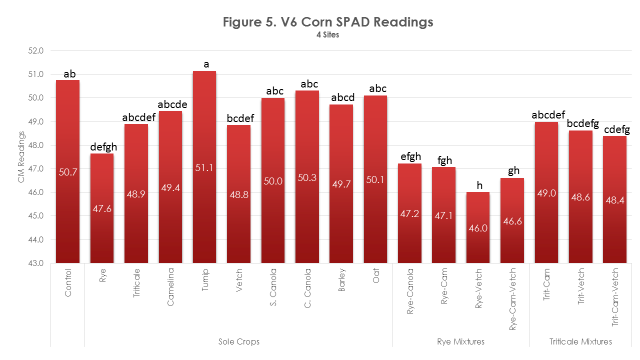
One possible alternative explanation to the lower leaf greenness readings in this study would be to attribute the nitrogen deficiencies to corn root fungal disease damage, which may have occurred in corn which followed a rye cover crop (Bakker, et al., 2015; Kaspar et al., 2015; Acharya et al., 2017) They determined that corn seedlings which followed a winter rye cover crop sometimes exhibited visible fungal disease symptoms on the primary and seminal roots. If corn root pathogens more readily infect seedling roots following a rye cover crop, they could potentially decrease the plants’ nitrogen uptake capability regardless of the nitrogen fertilizer rate applied. In this study we did not investigate fungal disease symptoms on corn roots.
Corn Grain Yield
Cover crops did not influence corn grain yield; mean corn grain yield was 226 bushels acre-1 across all site years and treatments (Table 5). Additionally, although the differences were not significant the winter rye and rye-canola cover crop treatments had an average corn yield of 226 and 229 bushels acre-1, respectively, compared with 223 bushels ha-1 for the no cover crop control. This is somewhat surprising as both V6 and R1 chlorophyll readings suggested that corn was consistently N limited following rye-canola, rye-camelina, rye-camelina-vetch, and triticale-camelina-vetch cover crops (Figures 5,6). The R1 corn SPAD readings have been documented to be highly positively correlated with corn yield (Rorie et al., 2011). This lack of N limitation expressing itself in reduced corn yield may be due to late season cover crop decomposition and release of N, which was previously tied up in cover crop biomass. It is possible that cover crop decomposition between R1 and corn harvest released adequate corn available N to reduce the severity of original N limitation at V6 and R1 stage corn. However, alternate explanations are that the variability of the yield measurements was large enough that small differences in yield could not be detected or that factors other than N affected yield.
References
Acharya, J., M.G. Bakker, T.B. Moorman, T.C. Kaspar, A.W. Lenssen, and A.E. Robertson. Time interval between cover crop termination and planting influences corn seedling disease, plant growth, and yield. Plant Dis.: in press. doi.org/10.1094/pdis-07-16-0975-RE
Bakker, M.T., J. Acharya, T.B. Moorman, A.E. Robertson, and T.C. Kaspar. 2016. The potential for cereal rye cover crops to host corn pathogens. Phytopathol. 106:591-601.
Berti, M., R. Gesch, B. Johnson, U. Ji, W. Seames, and A. Aponte. 2015. Double- and relay-cropping of energy crops in the northern Great Plains, USA. Ind. Crop Prod. 75:26-34.
Blanco-Canqui, H., T.M. Shaver, J.L. Lindquist, C.A. Shapiro, R.W. Elmore, C.A. Francis, and G.W. Hergert. 2015. Cover crops and ecosystem services: Insights from studies in temperate soils. Agron. J. 107:2449–2474.
Christianson, L., M. Castellano, and M. Helmers. 2012. Nitrogen and phosphorus balances in Iowa cropping systems: Sustaining Iowa’s soil. Iowa State University and Iowa Department of Agriculture and Land Stewardship. https://www.legis.iowa.gov/docs/APPS/AR/ 5CDA06E3-F230-4E2B-8FE9-CC1F64BE2CA8/IDALS-Final%20Soil%20Nutrient %20Balance%20Report.pdf (accessed 25 July 2016).
Clark, A.J., A.M. Decker, and J.J. Meisinger. 1994. Seeding rate and kill date effects on vetch-cereal rye cover crop mixtures for corn production. Agron. J. 86:1065–1070.
Costa, C., L.M. Dwyer, P. Dutilleul, D.W. Stewart, B.L. Ma, and D.L. Smith. 2001. Inter-relationships of applied nitrogen, SPAD, and yield of leafy and non-leafy maize genotypes. J. Plant Nutr. 24:1173–1194.
Daigh, A.L., M.J. Helmers, E. Kladivko, X. Zhou, R. Goeken, J. Cavdini, D. Barker, and J. Sawyer. 2014. Soil water during the drought of 2012 as affected by rye cover crops in fields in Iowa and Indiana. J. Soil Water Conserv. 69:564–573.
Dinnes, D.L., D.L. Karlen, D.B. Jaynes, T.C. Kaspar, J.L. Hatfield, T.S. Colvin, and C.A. Cambardella. 2002. Nitrogen management strategies to reduce nitrate leaching in tile-drained midwestern soils. Agron. J. 94:153–171.
Finney, D.M., C.M. White, and J.P. Kaye. 2016. Biomass production and carbon/nitrogen ratio influence ecosystem services from cover crop mixtures. Agron. J. 108:39–52.
Gesch, R.W. and D.W. Archer. 2013. Double-cropping with winter camelina in the northern Corn Belt to produce fuel and food. Ind. Crop Prod. 44:718-725.
Gesch, R.W., D.W. Archer, and M.T. Berti. 2014. Dual cropping winter camelina with soybean in the northern Corn Belt. Agron. J. 106:1735-1745.
Gesch, R.W. and S.C. Cermak. 2011. Sowing date and tillage effects on fall-seeded camelina in the northern Corn Belt. Agron. J. 103:980–987.
Gesch, R.W. and J.M.-F. Johnson. 2015. Water use in camelina-soybean dual cropping systems. Agron. J. 107:1098-1104.
Great Lakes Canola Association. 2016. Seeding and soil preparation. Great Lakes Canola Association, Purdue University Extension. https://www.agry.purdue.edu/ext/canola/seeding.htm (accessed 26 July 2016).
Gusta, L. V. and B.J. O’Connor. 1987. Frost tolerance of wheat, oats, barley, canola and mustard and the role of ice-nucleating bacteria. Can. J. Plant Sci. 67:1155–1165.
Haramoto, E.R. and E.R. Gallandt. 2004. Brassica cover cropping for weed management: A review. Renew. Agric. Food Syst. 19:187–198.
Haramoto, E.R. and E.R. Gallandt. 2005. Brassica cover cropping: 1. Effects on weed and crop establishment. Weed Sci. 53:695–701.
Harbur, M.M., C.C. Sheaffer, K. M. Moncada, and D. L. Wyse. 2009. Selecting hairy vetch ecotypes for winter hardiness in Minnesota. Online. Crop Management. doi:10.1094/CM-2009-0831-01-RS.
Kaspar, T.C., J. Acharya, A. Robertson, M. Bakker, A. Lenssen, and T. Moorman. 2015. Effect of length of interval between cereal rye cover crop termination and corn planting on seedling root disease and corn growth. ASA-CSSA-SSSA International meetings, St. Paul, MN.
Kaspar, T.C., D.B. Jaynes, T.B. Parkin, T.B. Moorman, and J.W. Singer. 2012. Effectiveness of oat and rye cover crops in reducing nitrate losses in drainage water. Agric. Water Manag. 110:25–33.
Kaspar, T.C., J.K. Radke, and J.M. Laflen. 2001. Small grain cover crops and wheel traffic effects on infiltration, runoff, and erosion. J. Soil Water Conserv. 56:160–164.
Kaspar, T.C. and J.W. Singer. 2011. The use of cover crops to manage soil. In: Hatfield, J.L., Sauer, T.J. (Eds.), Soil management: Building a stable base for agriculture. Am. Soc. Agron. Soil.
Krueger, E.S., T.E. Ochsner, P.M. Porter, and J.M. Baker. 2011. Winter rye cover crop management influences on soil water, soil nitrate, and corn development. Agron. J. 103:316–323.
Kuo, S., U.M. Sainju, and E.J. Jellum. 1997a. Winter cover crop effects on soil organic carbon and carbohydrate in soil. Soil Sci. Soc. Am. J. 61:145–152.
Kuo, S., U.M. Sainju, and E.J. Jellum. 1997b. Winter cover cropping influence on nitrogen in soil. Soil Sci. Soc. Am. J. 61:1392–1399.
Lenssen, A.W. 2015. 2015 Midwest Cover Crops Council Iowa report. Ames, IA. Midwest Cover Crops Council. http://www.mccc.msu.edu/meetings/2015/IA%202014%20State%20Report.pdf (accessed 2y July 2016).
Licht, M.A. and M. Al-Kaisi. 2005. Strip-tillage effect on seedbed soil temperature and other soil physical properties. Soil Tillage Res. 80:233–249.
Liebl, R., F. Simmons, L. Wax, and E. Stoller. 1992. Effect of rye (Secale cereale) mulch on weed control and soil moisture in soybean (Glycine max). Weed Technol. 6:838–846.
Maloney, T.S., E.S. Oplinger, and K.A. Albrecht. 1999. Small grains for fall and spring forage. J. Prod. Agric. 12:488–494.
Martinez-Feria, R.A., T.C. Kaspar, and M.H. Wiedenhoeft. 2016. Seeding date affects fall growth of winter canola (Brassica napus L. ‘Baldur’) and its performance as a winter cover crop in central Iowa. Crop Forage Turf Manage. 2: doi: 10.2134/cftm2015.0181
Miguez, F.E. and G.A. Bollero. 2005. Review of corn yield response under winter cover cropping systems using meta-analytic methods. Crop Sci. 45:2318–2329.
Munawar, A., R.L. Blevins, W.W. Frye, and M.R. Saul. 1990. Tillage and cover crop management for soil water conservation. Agron. J. 82:773-777.
Nielsen, D.C., D.J. Lyon, G.W. Hergert, R.K. Higgins, F.J. Calderón, and M.F. Vigil. 2015. Cover crop mixtures do not use water differently than single-species plantings. Agron. J. 107:1025–1038.
NRCS. 2013. Iowa agronomy technical note 38: Cover crop management. USDA, NRCS. http://www.nrcs.usda.gov/Internet/FSE_DOCUMENTS/stelprdb1166106.pdf (accessed 26 July 2016).
Pantoja, J.L., K.P. Woli, J.E. Sawyer, and D.W. Barker. 2015. Corn nitrogen fertilization requirement and corn–soybean productivity with a rye cover crop. Soil Sci. Soc. Am. J. 79:1482–1495.
Parr, M., J.M. Grossman, S.C. Reberg-Horton, C. Brinton, and C. Crozier. 2011. Nitrogen delivery from legume cover crops in no-till organic corn production. Agron. J. 103:1578–1590.
Poffenbarger, H.J., S.B. Mirsky, R.R. Weil, J.E. Maul, M. Kramer, J.T. Spargo, and M.A. Cavigelli. 2015. Biomass and nitrogen content of hairy vetch–cereal rye cover crop mixtures as influenced by species proportions. Agron. J. 107:2069–2082.
Quemada, M. and M.L. Cabrera. 1995. Carbon and nitrogen mineralized from leaves and stems of four cover crops. Soil Sci. Soc. Am. J. 59:471–477.
Reese, C.L., D.E. Clay, S.A. Clay, A.D. Bich, A.C. Kennedy, S.A. Hansen, and J. Moriles. 2014. Winter cover crops impact on corn production in semiarid regions. Agron. J. 106:1479–1488.
Rife, C.L. and H. Zeinali. 2003. Cold tolerance in oilseed rape over varying acclimation durations. Crop Sci. 43:96–100.
Rorie, R.L., L.C. Purcell, M. Mozaffari, D.E. Karcher, C.A. King, M.C. Marsh, and D.E. Longer. Association of “Greenness” in corn with yield and leaf nitrogen concentration. Agron. J. 103:529–535.
Sainju, U.M. and B.P. Singh. 2008. Nitrogen storage with cover crops and nitrogen fertilization in tilled and nontilled soils. Agron. J. 100:619–627.
Sainju, U.M., W.F. Whitehead, and B.P. Singh. 2005. Biculture legume-cereal cover crops for enhanced biomass yield and carbon and nitrogen. Agron. J. 97:1403–1412.
Samarappuli, D.P., B.L. Johnson, H. Kandel, and M.T. Berti. 2014. Biomass yield and nitrogen content of annual energy/forage crops preceded by cover crops. Field Crops Res. 167:31-39.
Sawyer, J.E. 2013. Wet conditions and change in soil profile nitrate. Integrated Crop Management, Iowa State University: Extension and Outreach. http://crops.extension. iastate.edu/cropnews/2013/05/wet-conditions-and-change-soil-profile-nitrate (accessed 26 July 2016).
Schneider, E.C. and S.C. Gupta. 1985. Corn emergence as influenced by soil temperature, matric potential, and aggregate size distribution. Soil Sci. Soc. Am. J. 49:415–422.
Schulz, M., A. Marocco, V. Tabaglio, F.A. Macias, and J.M.G. Molinillo. 2013. Benzoxazinoids in rye allelopathy – from discovery to application in sustainable weed control and organic farming. J. Chem. Ecol. 39:154-174.
Singer, J.W. 2008. Corn Belt assessment of cover crop management and preferences. Agron J. 100:1670-1672.
Smith, R.G., L.W. Atwood, F.W. Pollnac, and N.D. Warren. 2015. Cover-crop species as distinct biotic filters in weed community assembly. Weed Sci. 63:282–295.
Snapp, S.S., S.M. Swinton, R. Labarta, D. Mutch, J.R. Black, R. Leep, J. Nyiraneza, and K. O’Neil. 2005. Evaluating cover crops for benefits, costs and performance within cropping system niches. Agron. J. 97:322–332.
Strock, J.S., P.M. Porter, and M.P. Russelle. 2004. Cover cropping to reduce nitrate loss through subsurface drainage in the northern U.S. Corn Belt. J. Environ. Qual. 33:1010–1016.
Swan, J.B., E.C. Schneider, J.F. Moncrief, W.H. Paulson, and A.E. Peterson. 1987. Estimating corn growth, yield, and grain moisture from air growing degree days and residue cover. Agron. J. 79:53–60.
Teasdale, J.R. 1996. Contribution of cover crops to weed management in sustainable agricultural systems. J. Prod. Agric. 9:475–479.
Teasdale, J.R., C.E. Beste, and W.E. Potts. 1991. Response of weeds to tillage and cover crop residue. Weed Sci. 39:195–199.
Tollenaar, M., M. Mihajlovic, and T.J. Vyn. 1993. Corn growth following cover crops: Influence of cereal cultivar, cereal removal, and nitrogen rate. Agron. J. 85:251-255.
Unger, P.W., and M.F. Vigil. 1998. Cover crop effects on soil water relationships. J. Soil Water Conserv. 53:200-207.
USDA. 2012. Plant hardiness zone map. USDA, ARS, and Oregon State University. http://planthardiness.ars.usda.gov/PHZMWeb/Images/300dpi/All_states_halfzones_title_legend_logos_300dpi.jpg (accessed 26 July 2016).
USDA. 2014. Iowa ag news – 2013 crop production. Des Moines, IA. USDA, NASS. http://www.nass.usda.gov/Statistics_by_State/Iowa/Publications/Crop_Report/2014/IA_Annual_01_14.pdf (accessed 26 July 2016).
USDA. 2015. Summary report: 2012 national resources inventory. Natural Resources Conservation Service, Washington, DC, and Center for Survey Statistics and Methodology, Iowa State University, Ames, IA. http://www.nrcs.usda.gov/Internet/FSE_DOCUMENTS/nrcseprd396218.pdf (accessed 26 July 2016).
USDA, ARS. 2016. Plant hardiness zone map. http://planthardiness.ars.usda.gov/PHZMWeb/InteractiveMap.aspx (accessed 20 November 2016).
Villamil, M.B., G.A. Bollero, R.G. Darmody, F.W. Simmons, and D.G. Bullock. 2006. No-till corn/soybean systems including winter cover crops. Soil Sci. Soc. Am. J. 70:1936–1944.
Weinert, T.L., W.L. Pan, M.R. Moneymaker, G.S. Santo, and R.G. Stevens. 2002. Nitrogen recycling by nonleguminous winter cover crops to reduce leaching in potato rotations. Agron. J. 94:365–372.
Wilke, B.J. and S.S. Snapp. 2008. Winter cover crops for local ecosystems: Linking plant traits and ecosystem function. J. Sci. Food Agric. 88:551-557.
Wilson, M.L., J.M. Baker, and D.L. Allan. 2013. Factors affecting successful establishment of aerially seeded winter rye. Agron. J. 105:1868–1877.
Wortman, S.E., C.A. Francis, M.A. Bernards, E.E. Blankenship, and J.L. Lindquist. 2013. Mechanical termination of diverse cover crop mixtures for improved weed suppression in organic cropping systems. Weed Sci. 61:162–170.
Wortman, S.E., C.A. Francis, and J.L. Lindquist. 2012a. Cover crop mixtures for the western Corn Belt: Opportunities for increased productivity and stability. Agron. J. 104:699–705.
Wortman, S.E., C.A. Francis, M.L. Bernards, R.A. Drijber, and J.L. Lindquist. 2012b. Optimizing cover crop benefits with diverse mixtures and an alternative termination method. Agron. J. 104:1425–1435.
Cover crop biomass accumulation was limited in this study due to late planting dates, poor winter survival, a lack of thermal units, and a very short growing season. Winter rye was the most productive cover crop species included in this study. Rye accounted for more than 79% of the spring aboveground biomass accumulation in rye mixtures. Cover crop entries which included winter rye produced the most fall aboveground biomass, C, and N accumulation (other than barley); the most spring aboveground biomass, C, and N accumulation; had the highest C:N ratios; resulted in some of the lowest soil nitrate concentrations; generally produced the lowest SPAD corn leaf chlorophyll readings; and had no effect on corn yield.
Sitro canola, Claremore canola, barley, and oat are not good cover crop options when drilled in late fall following soybean harvest in Iowa. All four species produced limited fall biomass, winterkilled, and thus produced no spring growth. Turnip and vetch have very limited potential as late fall planted Iowa cover crop as these two species produced negligible amounts of fall biomass, suffered high rates of winterkill, and spring biomass accumulation was minimal. Triticale and camelina have limited potential as late fall planted Iowa cover crops. Triticale and camelina monoculture produced 50% and 41% as much spring aboveground biomass respectively as the rye-associated cover crops. Cover crops did not influence soil temperature, soil P or K concentrations, weed density or weed community, or corn yield. Cover crops had a limited influence on volumetric soil water content at a depth of 0-8 in, but only at the time of corn planting.
Cover crop mixtures did not produce results which were significantly different from the most productive cover crop monocultures. Two exceptions to this statement exist: triticale-camelina mixes had greater fall cover crop stand density than triticale or camelina monocultures, and triticale monoculture had higher soil VWC at corn planting at 0-8 in depth than triticale mixtures. Cover crop mixtures were similar to the most productive cover crop monocultures for fall and spring biomass, N, and C accumulation, fall and spring C:N ratio of cover crop residues, soil N, P, and K concentrations, weed community and weed density, SPAD corn leaf chlorophyll readings, and corn yield. This study does not support the hypothesis that increased cover crop diversity will result in increased productivity, decreased weed density, and increased nutrient retention. Future cover crop research for Iowa and the upper Midwest should focus on selecting and testing cover crops which are very winter hardy. Research should include early seeding methods before harvest to increase fall cover crop growth which should increase the overwintering ability of the cover crops.
Economic Analysis
We did not propose to conduct an economic analysis.
Farmer Adoption
Iowa has about 625,000 acres planted into cover crops in fall of 2016. This project is in part responsible for the increase we've seen in cover crop acres in Iowa.
Educational & Outreach Activities
Participation summary:
Peer-reviewed publications
Appelgate, S., A.W. Lenssen, M. Wiedenhoeft, and T. Kaspar. 2017. Cover crop options and mixes for upper Midwest corn-soybean systems. Agronomy Journal: in press. doi:10.2134/agronj2016.08.0453
Research reports
Appelgate, Seth. 2016. Improved cover crop options for the Midwest Corn Belt. MS Thesis, Crop Production and Physiology, Iowa State University.
Appelgate, S., T.C. Kaspar, M.H. Wiedenhoeft, A.W. Lenssen. 2015. Cover crop options and mixes for the upper Midwest. 15-18 Nov. ASA-CSSA-SSSA International meetings. St. Paul, MN.
Outreach presentations
Appelgate, S., and A. Lenssen. 2015. Alternatives to cereal rye. Webinar with Practical Farmers of Iowa. 9 December 2015. [online] http://www.practicalfarmers.org/farmer-knowledge/farminar-archive/alternatives-to-cereal-rye-and-the-benefits-of-grazing-covers/
Appelgate, S., and A. Lenssen. 2015. Cover crops mixtures for corn production systems. NCRSARE video. [online] https://www.youtube.com/watch?v=pYrRG-fS5cE
Practical Farmers of Iowa report for Improved Cover Crop Options for Corn Belt Farmers Final Report
Project Number: LNC13-352
Type: Research and Education Project
Region: North Central
|
Activity |
Products |
People Reached |
|
Deliverable: 2 PFI Conference Workshops Held two workshops at PFI conference which included discussion about cover crop mixes. |
January 2015 Held a workshop titled: “Top 10 Cover Crops for Iowa” at Practical Farmers of Iowa annual conference. January 2016 held a workshop titled: Top 10 Cover Crop Species for Iowa- 2016 Edition. Two farmers presented with two university experts about their use of mixes and other cover crops in Iowa. |
125 |
|
Deliverable: 8 Media Story Placements Massive statewide media campaign about research and outreach events highlighting cover crop mixes. |
2. http://www.practicalfarmers.org/blog/2016/07/13/research-report-cover-crop-variety-trial-2015-2016/ 3. http://www.practicalfarmers.org/blog/2015/10/29/cover-crops-at-jacob-bolsons-farm-hardin-county/ 5. http://www.practicalfarmers.org/blog/2015/07/21/research-report-cover-crop-variety-trial-2014-15/ 6. http://www.practicalfarmers.org/blog/2016/02/24/if-biodiversity-is-the-goal/#more-20733 7. http://practicalfarmers.org/app/uploads/2015/09/2015-Summer-Newsletter_smaller.pdf Pages 4-5 8. http://www.practicalfarmers.org/news-events/newsroom/news-release-archive/19438/ 15. https://www.iowalearningfarms.org/content/iowa-learning-farms-host-spring-cover-crop-management-workshops
|
1,713,500 |
|
Deliverable: Year 1 and 2 Results shared at 8 Field Days Information was shared at 10 field days and workshops. |
1. 2/11/16 Land Stewardship Project Soil Health Meeting; 2. 2/23/16 Field Day at Sutherland research farm; 3. 2/24/16 Ventura Field Day; 4. 3/2/16 Field Day Oskaloosa; 5. 3/3/16 Lewis research farm; 6. 3/3/16 Gary’s Feed Store workshop; 7. 3/22/16 UMN Production Ag Symposium; 8. 3/29/16 Badger Creek Field Day; 9. 3/30/16 Elk Run Field Day; 10. 4/13/16 Field Day at the Kanawha research farm;
|
715 |
|
Deliverable: 5 On-farm research trials Mixes were evaluated in the 2014-2015 and 2015-2016 cover cropping season at 9 locations.
|
2. http://www.practicalfarmers.org/farmer-knowledge/research-reports/2015/cover-crop-variety-trial-2014-2015/ |
5000 |
|
Deliverable: 1 PFI Cooperator Meeting |
Shared information about research results from ISU research plots at December 2015 field crops farmer group. |
25 |
|
Deliverable: MCCC Decision Making Tool
|
Edited Iowa NRCS Tech notes 38 and 39 to reflect information gained throughout this project. Those edits were also provided to Dean Baas at MSU who updates the MCCC Decision-Making Tool for Iowa. |
|
|
Annual Conference Workshop Evaluations |
Farmers rated the two annual conference sessions for quality of presentation at 4.29/5 and 3.69/5 in 2015 and 2016, respectively. Change in knowledge was rated at:3.73/5 in 2015. Top comments from each session included: “Good visuals. Good mix of information and practical experience. Was my first time having had the privilege of hearing a number of individuals with practical experience on advantages and disadvantages of various cover crops.” “Great panel-good to include row crops/small grain producers alongside vegetable producers.” Overall attendees learned a good deal from these two workshops and better understood which cover crop species and mixes would work for their farms in Iowa. |
|
|
Field Day Evaluation |
The majority of farmers attending these field days and workshops said they began using cover crops only three years ago. Farmers attending field days reported: · Overall quality of field day or workshop was 45% excellent/48% good/6% average/1% fair; · Effectiveness of expert presentations were 44% excellent/44% good/10% average/1% fair/1% poor; · Effectiveness of farmer presentations 50% excellent/35% good/14% average/1%fair. 70% of attendees said they would plant a cover crop and 71% said they would talk to other farmer neighbors or clients about cover crops. 46% reported talking with two or more neighbors/clients. 60% of attendees reported using a single species cover crop while 40% said they were using a mix; However, 45% of farmers using cover crops on over 160 acres were using mixes. |
|
Project Outcomes
Areas needing additional study
Cover crops such as rye, triticale, and wheat increasing root diseases on corn; examine for this effect using crucifers or other broadleaf cover crops.
Seeding cover crops before harvest.