Final Report for LNC14-362
Project Information
Field experiments investigating the effect of cover crops and tillage on muskmelon production and food safety (Iowa State University) and cucumber and acorn squash production (Michigan State University) were conducted. At Iowa State University a split-split-plot design with four replications was used. The main plot factor was cover crop, consisting of cereal rye (R), cereal rye-vetch mixture (R+V), or no cover crop (NC). Sub-plot factor was tillage consisting of conventional tillage (CT) or strip tillage (ST). An additional treatment of Listeria innocua, a non-pathogenic surrogate for the human pathogen Listeria monocytogenes was applied to the soil in Oct. following cover crop seeding or in May before cover crop termination. The experiment was designed to compare the effects of different tillage and cover crops practices on soil fertility and health, weed pressure, plant growth, NO3–-N leaching, marketable yield, fruit quality and frequency of contamination of muskmelon fruit.
In 2015 weed density was unaffected by cover crop treatments but was higher under CT. In 2016, NC treatment produced higher weed biomass than R or R+V, however, tillage had no effect on weed biomass. Soil temperature was increased by CT but only in the early part of growing season. Soil moisture was generally greater in ST. Increased NO3– -N levels were observed in CT treatments in both years. Leaching of NO3–-N was decreased by ST at one sampling date in 2015 and during the early season in 2016. Plant growth was generally greater under CT, with greater vine length in both years and higher SPAD and petiole sap N values in 2016. During both years CT plots produced significantly greater marketable yields, though ST yields were acceptable. In 2016, R and R+V and ST increased total soluble solids and produced more spherically shaped fruits. In R plots, flesh thickness of muskmelon fruit was greater than NC for only one year. Soil microbial biomass carbon (MBC) was greatest under R-CT in 2015 and R+V-CT in 2016. In both years NC-CT had the lowest MBC. Microbial functional diversity, measured with Biolog-EcoPlate® was similar for all treatments in 2015. In 2016, NC had the lowest measures of microbial functional diversity.Winter survival of Oct. applied L. innocua ranged from 88%-100% for all cover × tillage treatments for both years. In 2015, R and R+V treatment significantly decreased the population of soilborne L. innocua as compared to NC treatment, however, treatments had no effect on contamination of fruit for either year, the frequency of contamination ranged from 0%-22%. On farm trial conducted at Glenwood Farms, Albion, IA showed higher winter squash yields in a plasticulture based system as compared to ST, however, average fruit weight was higher for ST.
Research conducted in Michigan consisted of both research farm and on-farm trials evaluating the impact of cover crops (none, rye or rye-vetch) and tillage [Conventional till (CT) or strip-till (ST)] on winter squash and cucumbers. In 2014, cucumber yields were greater in the ST-bare treatment compared to all other treatments except CT+rye. Within ST treatments, both rye and rye-vetch cover crops reduced cucumber yield. In 2015, no effects of either tillage or cover crop on cucumber yields were detected. Tillage and cover crops influenced the emergence and growth of various weed species in both years. In general, an increase in the abundance of horsenettle (a perennial), and large crabgrass (a summer annual) in was observed in ST treatments. A short-term acorn squash trial showed that strip tillage by itself had no effect on acorn squash yield in 2015 or 2016, however, in 2015, strip-tillage combined with a winter rye cover crop reduced crop yields relative to all other treatments. On farm-trial in Michigan at Forgotten Harvest, Fenton, MI showed butternut squash yields from highest to lowest as follows: Plasticulture > ST = CT > No-till. The plasticulture system had higher costs, but fewer weeds and higher N availability than the other treatments. In 2016, yields were ranked as follows: ST > NT = CT.
Studies at Iowa State University and Michigan State University show that rolled cover crop mulch can be an effective way to control weeds, especially in the early part of the growing season. It can also help to produce fruits that are cleaner than conventional tillage systems. Yields in ST vary and largely depend proper management of rye residue (roller crimping, strip-tilling). In this study, microbial measures of soil health were generally not increased under ST, likely because all sampling was done in the tilled in-row area, and did not take into account the no-till conditions of the between-row area. Vegetable growers may find reduced yield under ST acceptable if weed pressure and NO3–-N can be reduced while soil health is improved. Measures of plant growth and soil N indicate that muskmelon and other cucurbit crops under ST may benefit from increased rates of N fertilizer.
Introduction:
Reduced tillage has been widely adopted in production of agronomic crops for its potential to improve soil health and reduce input costs. Despite this vegetable growers continue to rely on conventional tillage (CT) to incorporate crop residue, control weeds, and to prepare a loose seed bed for planting. Conventional tillage may negatively affect water infiltration, soil biodiversity, and increase nitrate leaching, erosion and weed germination. The detrimental effects of CT stems from the inversion and disturbance of soil across the entire field. In contrast, strip-tillage (ST) only disturbs the soil in a narrow 15-30 cm strip where the cash crop will be planted, leaving the unplanted area intact. Most growers utilizing a strip tillage system combine it with the use of cover crops. These cover crops, seeded in the fall and terminated (using a roller crimper) in the spring can offer many benefits including weed suppression, reduction in erosion, addition of organic matter, and cleaner produce. The roller crimper method terminates the cover crop non-chemically, leaving the soil undisturbed, and serves as an excellent biodegradable mulch protecting the soil and suppressing weeds.
Cucurbit growers in the North Central region face several critical challenges including increases in extreme rainfall events, increased soil erosion, decreased soil quality, and increased risks of fruit contamination with soil-borne plant and human pathogens. For example, recent outbreaks associated with foodborne illness threatened livelihood of melon growers, with Listeria monocytogenes and Salmonella killing consumers throughout the United States. Soil-borne fruit pathogens also significantly affect cucurbit production by reducing yields and grower profits. Adoption of reduced tillage practices, coupled with cover crop residues may help buffer cucurbits from rainfall extremes, improve soil quality and health, and also reduce growth and dispersal of both human and plant pathogens. This collaborative study (Iowa State and Michigan State) investigated the use of cover crops combined with strip tillage to 1) moderate soil moisture extremes; 2) reduce soil erosion, runoff and leaching; 3) reduce or eliminate Listeria spp. from contaminated cantaloupe fields and Phytophthora capsisi from winter squash fields; and 4) improve crop profitability. We hypothesize that cover crops mulches left on the soil surface under ST will promote water infiltration, reduce soil splash and leaching, conserve soil moisture, and form a barrier between the fruit and the soil thereby reducing pathogen spread and survival.
This project explored the feasibility of using the strip-till / roller-crimper system in Midwest muskmelon production. The first objective was to determine the effect of tillage and cover crops on the plant growth and yield of muskmelon (cv. Aphrodite). Secondly this project investigated the effects on soil quality and fertility in the root zone.
Additionally, we wanted to determine if rolled cover crop mulch would prevent the spread of Listeria innocua from contaminated soil to the surface of the fruit. L. innocua is a harmless species of bacteria that in the same genus as the pathogenic L. monocytogenes, both share a similar physiology and growth habit. L. innocua has been widely used as a surrogate for L. monocytogenes in studies of food safety and food processing. Research conducted in Michigan consisted of both research farm and on-farm trials evaluating the impact of cover crops (none, rye or rye-vetch) and tillage (CT or ST) on winter squash and cucumbers.
On-farm trials were an integral part of the project at both locations and included commercial cucurbit growers. An important aspect of these trials was to expose growers to conservation tillage and equipment such as roller crimper so that they can experience the technology and make informed decision on soil health and quality at their respective farms. Grower organizations such as Practical Farmers of Iowa, Iowa Fruit and Vegetable Growers Association, and Michigan Vegetable Council partnered to set up on-farm trials and played a key role in information dissemination.
Cooperators
Research
 Cereal rye and hairy vetch biculture at the Horticulture Research Station in Ames, IA on 9 May 2016.
  Muskmelons planted into roller crimped cereal rye at the Horticulture Research Station in Ames, IA on 8 July 2016.
Iowa State University
Plot preparation. The experiment at Iowa State University was conducted at Horticulture Research Station in Gilbert, IA over two growing seasons 2014-15 and 2015-16. Because cover crops needed to be seeded before muskmelon harvest was completed, two different sites were used. Soil at both sites was a Clarion Loam, moderately well drained, fine-loamy, Typic Hapludoll on a 2-6% slope. At the time of cover crop planting soil at the 2014-15 site had pH ranging from 5.6 - 6.3, and soil organic matter ranging from 2.2 – 2.9 %. Before this study, the 2014-15 site was in a rotation of conventionally managed corn (Zea mays) and soybeans (Glycine max). At the time of cover crop planting, soil at the 2015-16 site had pH ranging from 5.1 - 6.5, and soil organic matter ranging from 2.6 – 3.7%. Before the 2015-16 study, a Persian (Carpathian) walnut (Juglans regia L.) trial, removed in 2009, and a rotation of conventionally managed corn and soybeans, from 2009-2014, occupied the site. Sorghum-sudangrass (Sorghum bicolor ssp. drummondii ) cover crop was established in June 2015 and terminated in Aug. 2015 before seeding cover crops for this study in Sept. 2015. A timeline of field operations is summarized in Table 1.
The experimental design was a split-split-plot design with four replications. The whole-plot factor was cover crop with three levels, no cover (NC), a monoculture of R ‘Wheeler’ and a biculture of cereal rye and hairy vetch (R+V) ‘Purple Bounty’. The subplot factor was tillage with two levels, CT and ST. Subsubplots factor was the month plot soil was populated with L. innocua, October-applied or May-applied. Whole-plot dimensions were 12.2 m x 16.8 m in 2014-15. Whole-plot dimensions were increased to 13.7 m x 16.8 m in 2015-16 to include a 1.5 m drive for equipment between subplots. Each subplot was 6.0 m wide, and consisted of two 7.6 m long rows spaced 3.0 m apart on-center, plants were spaced 0.6 m apart within the row. Subsubplots were 3.0m wide, and consisted of a single 7.6 m long row. Row spacing for commercial muskmelon fields is 1.2 - 1.8 m, for this study row spacing was increased to further separate subsubplots to prevent effects of L. innocua in adjacent subsubplots. Experimental units consisted of 13 muskmelon plants in 7.6 m long rows.
On 18 Sept. 2014 and 16 Sept. 2015 the entire field was rototilled with a Terra Force GM102 rotary tiller (Terra Force, Inc., Carrollton, TX). Immediately after tillage cover crops were planted with a 107 cm wide Gandy drop spreader (Anertec & Gandy Co., Owatonna, MN). For plots in a monoculture, R was seeded at 123 kg∙ha-1. Plots in a biculture of R+V were seeded at 100 kg∙ha-1 and 28 kg∙ha-1 respectively. Shortly before planting hairy vetch seeds were inoculated in a slurry of DI water and N-DURE rhizobium inoculant (Rhizobium leguminosarum biovar viceae, INTX Microbials LLC, Kentland, IN) and allowed to air dry. After seeding, the soil was rototilled to a depth of 5 cm to incorporate seeds, and lightly compacted with a 1.5 m cultipacker to optimize seed to soil contact.
For ST plots a Hiniker 6000 strip-tiller (Hiniker Co., Mankato, MN) was used to terminate cover crops and create a 30 cm wide strip on 22 Oct. 2014 and 23 Oct. 2015. By tilling strips in the fall, at the early stages of cover crop establishment, the growth of cover crop in the IR area was reduced. Fall tillage of ST plots increased the efficiency of residue removal from the IR area at the final tillage event in the spring. On 1 June 2015 and 2 June 2016 –two weeks before planting when R was at anthesis, and hairy vetch was at early pod stage - cover crops in ST plots were terminated using a 3.2 m roller crimper (I & J Manufacturing, Gap, PA). Cover crops were rolled a second time one week later to ensure adequate termination. Glyphosate (CropSmart® Glyphosate 41%, Cropsmart LLC., Morrisville NC) was applied to the entire areas of NC-ST plots on 27 May 2015, and 5 June 5, 2016. This post-emergence, broad-spectrum herbicide was applied to terminate weeds that had grown in the absence of a cover crop while maintaining no-till conditions in the BR area of NC-ST plots. After glyphosate injury had become visually apparent, entire NC-ST plots were mowed and treated with Clomazone (Command 3ME, FMC Corporation, Philadelphia, PA), a pre-emergence herbicide on 12 June 2015 and 10 June 2016. The Hiniker 6000 strip-tiller was used to perform the final tillage and create the seedbed for planting for all ST plots on 7 June 2015 and 9 June 2016.
Trickle irrigation was used for all plots, t-tape John Deere T-Tape 502-12-220 (John Deere Irrigation, Moline, IL) was placed 10-12cm below the soil surface in all plots. For ST plots, t-tape was installed by hand on 9 June 2015, and on 9 June 2016 was installed using a custom build implement consisting of a fluted coulter, a shank modified to bury t-tape followed by closing discs. Clomazone was applied to the exposed soil in the tilled strips of all ST plots on 12 June 2015 and 10 June 2016.
For CT plots cover crops and overwintering weeds were terminated using a Rhino flail mower (Alamo Group Inc., Seguin, TX) three weeks before planting on 22 May 2015, and 24 May 2016, and immediately incorporated into the soil using a rototiller. We used plasticulture on all CT plots. The CT plots were rototilled a second time immediately before the installation of t-tape and raised beds covered in polyethylene black plastic mulch on 10 June 2015, and 10 June 2016.
Muskmelon ‘Aphrodite’ seeds treated with Mefenoxam, Thiamethoxam, Azoxystrobin, and Fludioxonil (Syngenta Seeds, Minneapolis, MN) were sown on 21 May 2015, and 10 May 2016, into 72 cell flats filled with LC1 soilless potting mix (Sun Gro Horticulture Canada Ltd, Seba Beach, AB, Canada). Seedlings were fertigated weekly during the first two weeks of growth with a water-soluble fertilizer (15N-2.2P-12.45K-4Ca2Mg; J.R. Peters, Inc., Allentown, PA) and then every five days until transplant. Seedlings were moved outdoors seven days before being transplanted into the field; all transplanting was done by hand on 16 June 2015, and 13 June 2016. All plots received an Imidacloprid (Admire Pro, Bayer CropScience, Research Triangle Park, NC) soil drench the day of transplanting to manage emerging striped cucumber beetle (Acalymma vittata F.).
Fertility requirements were based on pre-plant soil tests performed in April of each year. These values were the basis for determining fertility rates, which were modified from the Midwest Vegetable Production Guide recommendations (Egel et al., 2014). In both years of the study total N requirement was to 112 kg∙ha-1. In 2015 no additional P or K was needed. In 2015 half of the required 112 kg∙ha-1 of N was applied in the form of water-soluble urea (46N-0P-0K) through drip irrigation one week before planting, and the other half was applied four weeks after planting. A Dosmatic SuperDos 20 (Hydro Systems Company, Cincinnati, OH) water-driven proportional fertilizer injector was used for all fertigation. In 2016 half of the required 112 kg∙ha-1 of N was applied in the form of granular urea (46N-0P-0K) and all of the required 112 kg∙ha-1 of P as triple superphosphate (0N-45P-0K). The preplant granular fertilizer was applied by hand after the final tillage, but before installation of plastic mulch in CT and before final strip-tillage in ST. In 2016 the remaining 56 kg∙ha-1 was applied through drip irrigation at 5.6 kg∙ha-1 N per week for ten weeks, alternating between potassium nitrate (13N-0P-46K) and calcium nitrate (15N-0P-0K). Potassium nitrate fertigations fulfilled K requirements in 2016.
Crops were scouted weekly for signs of arthropod and disease pests. In 2016 the MELCAST disease forecasting system (Latin, 2001) was used to determine the timing of preventative fungicide sprays during the first eight weeks of crop growth in the field. Though the system is suitable for forecasting alternaria leaf blight [Alternaria cucumerina (Ellis & Everh.)], anthracnose [Colletotrichum orbiculare (Berk. & Mont.)], and gummy stem blight [Didymella bryoniae (Auersw.)], it is ill-suited for diseases that are typically a problem late in the season and near harvest such as downy mildew [Pseudoperonospora cubensis (Berk. & M.A. Curtis)] and powdery mildew [Sphaerotheca fuliginea (Schlechtend.:Fr.)]. In Aug. 2015 symptoms consistent with powdery mildew were observed. In Aug. and Sept. 2015 symptoms of water-soaked lesions on fruit and fruit rot, consistent with phytopthera fruit blight (Phytophthora capsici L.) were found after periods of heavy rain and wet field conditions. In both years spotted and striped cucumber beetles (Diabrotica undecimpunctata and Acalymma vittatum, respectively) were major arthropod pests. The economic threshold for chemical control of cucumber beetles was an average of 1 beetle per plant.
Cover crop and weed measurements
Cover crop biomass was determined on the day of termination by collecting samples consisting of aboveground plant portions from two 50 x 50-cm quadrats per subplot. Plant samples were dried at 67 °C until samples reached a constant weight before biomass was weighed. After drying whole plant samples were ground (Thomas-Wiley laboratory mill Model #4, Arthur H. Thomas Co., Philadelphia, PA) passed through a 2mm mesh and analyzed for total C and N (ISU Soil and Plant Analysis Lab, Ames, IA). Weed populations were estimated the day of the first weeding event on 8 July 2015, and 15 July 2016. Whole plant samples of the weeds in the BR area of two 25 x 25-cm quadrats were taken from each subplot, and dried at 67 °C until constant weight before weighing.
Soil temperature and moisture
In each subplot, one Hobo Pendant Data Loggers (Onset Computer Corporation, Bourne, MA) was placed 15 cm below the soil surface in the BR area. A second Logger was placed 15 cm below the soil surface between two muskmelon plants in the in IR. Soil Temperature (◦C) was recorded in each subplot every 60 min. Soil Moisture Sensors (10HS, Decagon Devices, Pullman, WA) were installed horizontally into the IR soil profile 15 cm below the soil surface between two muskmelon plants in each subplot. Sensors were connected to data loggers (Emb5 logger, Decagon Devices, Pullman, WA), which recorded volumetric water content (VWC; m3∙m-3) every 60 min.
Measurements of soil nutrients and chemical properties
Three soil sampling events occurred throughout the growing season: at planting, mid-season and at harvest. At each sampling event, four 2.9 x 15 cm soil cores- two from each row- were taken from the IR area of each subplot, the four subsamples combined into a single composite sample representing each subplot. Organic matter was measured by combustion, NO3- and NH4+ were extracted using 2N potassium chloride solution, P and K were extracted using a Mehlich III reagent (Mehlich, 1984).
Nitrate-nitrogen in leachate
Suction Lysimeters (Model 1900; Soil Moisture Equipment Corp., Santa Barbra, CA) were installed vertically within IR area of each subplot to a depth of 61 cm. Below this depth the muskmelon root system is poorly developed and less extensive (Weaver and Bruner, 1927). Lysimeters were installed using a method described in Linden (1977). A 5 cm hole was bored using a soil auger and slurry of deionized water, and silica powder (200 mesh; Soil Moisture Equipment Corp., Santa Barbra, CA) was poured into the hole to provide good hydraulic contact between soil and porous ceramic cup during sampling. The lysimeters were inserted, and the remaining silica powder slurry was then poured into the hole. The hole was then partially filled with bentonite clay pellets (Soil Moisture Equipment Corp., Santa Barbra, CA) which were allowed to absorb water for several minutes before a backfill of previously excavated soil was added and tamped to firmness. A skirt made of plastic sheeting with a diameter of 30 cm was placed around the lysimeters and held in place by soil. The addition of Bentonite clay, tamped soil, and plastic skirt prevented the flow of surface water down the bored lysimeter hole to the sampling area. In 2015, sampling occurred every 7-14 days after a rain or irrigation event. In 2016 samples were collected after each weekly fertigation event. Approximately 24 h after a rain, irrigation or fertigation event a hand pump was used to apply 40 kPa of pressure was applied to each lysimeter to create enough suction to draw soil moisture through the ceramic cup. 24 h after applying the vacuum a thin tube connected to a Buchner flask was inserted into the lysimeter. Using a hand pump, 40 kPa of pressure was applied to the Buchner flask, creating a partial vacuum and drawing all of the collected leachates into the flask. A 60 mL aliquot was collected, and frozen at -20 °C until time of analysis.
Muskmelon plant growth
Vine length (cm) and SPAD measurements were taking on 31 Aug. 2015 and 25 Aug. 2016 . SPAD meters provide a rapid and nondestructive measurement that correlates with extractable chlorophyll content in muskmelon leaves (Azia and Stewart, 2001). A handheld SPAD-502 Plus meter (Konica Minolta Sensing America Inc., Ramsey, NJ) was used to determine leaf chlorophyll content. All SPAD measurements were taken from the most-recently-mature-leaf (MRML) of six plants within each subplot at mid-day on a sunny day. For each MRML the average of five SPAD measurements was recorded. The vine length of two plants from each subplot was determined on by measuring the length from the soil surface to the tip of the most distal leaf, along the longest central vine. On 18 Aug. 2016 the concentration of NO3--N and K+ in the petiole sap was measured from the MRML of twenty-five plants within each subplot following recommended procedures of (Hochmuth et al., 1991). On a sunny day, at midday, MRMLs and petiole portions were collected and immediately transported to the laboratory for analysis. Samples were bagged and kept cool during transportation. Leaf tissue was removed, petioles were cut into 1 cm portions, and pressed with a handheld garlic press. The petiole sap of the twenty-five MRMLs from each subplot was combined into a single composite. The NO3--N and K+ concentration of extracted petiole sap was immediately measured in triplicate using an LAQUA Twin Nitrate Meter and an LAQUA Twin Potassium Meter (Spectrum Technologies, Aurora, IL). The average of the triplicate measurements was recorded.
Muskmelon yield
Muskmelons were harvested at half-slip two to three times per week from 21 Aug. - 15 Sept 2015 for a total of 7 harvests and 12 Aug – 13 Sept. 2016 for a total of 11 harvests. Fruits were classified as marketable or non-marketable, counted, and weighed. In 2015 marketable fruits were weighed in batches, whereas in 2016 marketable fruits were weighed individually. Individual fruits were considered marketable if they were uniform in shape and free from the following defects described in (USDA-AMS, 2008): cracks, bruises, scars, insect damage, soft spots, rot.
Muskmelon fruit quality
On 8-10 Sept. 2015 and 1-3 Sept. 2016 four randomly selected marketable muskmelon fruits from each cover × tillage subplot were brought to the laboratory and assessed for fruit quality within 24 h of harvest. Fruit density was determined by measuring mass as well as the volume of room-temperature water each fruit displaced. Volume was determined by measuring the volume of water each fruit displaced. Fruits were submerged in a 19 L bucket -which had been modified to divert overflow water into a collection container- and displaced water was measured. After fruits were cut in half longitudinally we measured fruit and cavity length (longitudinal diameter) as well as fruit and cavity width (equatorial diameter). Fruit shape (S), a unitless ratio, and flesh thickness (T) were determined using equations from Davis et al. (1967). Soluble solids (brix) of individual muskmelon was determined by using a digital refractometer (Pocket Pal-1 refractometer; Atago, Tokyo, Japan). An equatorial flesh sample of approximately 15 g, directly adjacent and inferior to the seed cavity, was taken from each fruit. From each sample juice was extracted using a handheld garlic press, and immediately measured for SSC.
Microbial biomass carbon
A portion of the soils collected on 16 Sept. 2015 and 14 Sept. 2016 for chemical analysis was also analyzed for microbial biomass carbon (MBC), using a chloroform fumigation-extraction method modified from Vance et al. (1987). After collection from the field, soil samples were kept cool during transport. Within 24 h of sample collection field moist soil was sieved (<4.75mm) rocks, roots, and large organic matter was removed by hand. Immediately after sieving one 50 g subsample was extracted with 0.5 M potassium sulfate (K2SO4) in sterile water, one 50 g subsample was fumigated with ethanol-free chloroform for 24 h before K2SO4 extraction, and one 10g subsample was dried at 100 °C for 48 h to determine volumetric water content. Extracts were transferred to 60 mL plastic bottles, one drop of phosphoric acid was added before storage at -20 °C until the time of analysis. Fumigated and non-fumigated extracts were analyzed for Total Organic Carbon (TOC) using a Torch Combustion TOC/TN Analyzer (Teledyne Tekmar, Mason, OH). A correction factor (k=0.33) was used to calculate MBC (Sparling and West, 1988).
Microbial functional diversity
The microbial funtional diversity of the soil was assessed by developing a community level physiological profile (CLPP) from the soil samples that had been taken 16 Sept. 2015 and 14 Sept. 2016 and sieved for microbial biomass carbon analysis. Using Biolog-EcoPlate® (BOLOG Inc., CA, USA), the sole-C-source utilization of culturable heterotrophic soil microbes was characterized by the method of Nair and Ngouajio (2012). Briefly, 10 g of field moist soil was combined with 90 mL of a sterile 0.85% sodium chloride (NaCl) solution, shaken and then incubated for 18 h before being brought to a final dilution of 10-3 in sterile 0.85% NaCl. A 150 µl aliquot was pipetted into each of the 96 wells of the Biolog-EcoPlate®. The 96 well Biolog-EcoPlate® consist of three replications of 31 individual C sources, and a blank that serves as a control. The reduction of a tetrazolium dye which turns purple indicates the C substrate utilization rate of the inoculated microbes. Immediately after plating (day 0) color change was recorded as optical density (OD) at 590 nm, with a spectrophotometer (Bio-Rad iMark; Bio-Rad Laboratories, Hercules, CA). For 7 d thereafter OD was recorded every 24 h, and day 0 reading was subtracted from each subsequent reading to account for any background coloration. Additionally, the OD value of the blank well was subtracted from the response of the 31 C sources in each replicate. Substrate richness (S), the number of substrates utilized by soil microbes in each sample is a count of the positive OD measurements. Average well color development (AWCD), a combined measure of the diversity and quantity of soil microbes was calculated for each sample on days 1-7. The Shannon-Wiener diversity index (H) and Evenness (E) were used as measures of soil microbial diversity.
Listeria innocua inoculation and analysis
Fields were with L. innocua shortly after cover crop planting on 15 Oct. 2014 and 1 Oct. 2015 for Oct.-applied subsubplots, and before cover crop termination on 15 May 2015 and 20 May 2016 for May-applied subsubplots. Preparation and application of the inoculation solution was similar for Oct.- and May-applied subsubplots. The L. innocua cells were combined with DI water to obtain a 3.1 ± 0.2 log CFU∙mL-1 (mean ±standard deviation) inoculation solution. The inoculation solution was applied using a modified 7.6 L handheld garden sprayer (Smith Performance Sprayers, New York Mills, New York). Walking down the center of each 7.6 m long subsubplot, we made approximately 10 evenly spaced applications along the 3.0 m width of the subsubplot. This process was repeated approximately every 0.7 m along the 7.6 m length of the subsubplot. For each individual application the nozzle of the sprayer was put in direct contact with the soil before inoculation solution was expelled. Field soil from each subsubplot then was analyzed 3 d after applying the L. innocua inoculation solution to ensure successful inoculation. Averaged across both years for all treatments, mean inoculum levels 3 d after application for all treatments were 2.7±0.2 log CFU∙mL-1 Detection and quantification of L. innocua for all sample types (i.e. soil, cover crop residue, and muskmelon rind) followed the same general procedure of collection, enrichment, detection, and enumeration of positive samples by direct plating on Listeria spp. selective agar. From the surface of each subsubplot approximately 120 g of soil was collected into sterile bags (write-on sterile sampling bags, 3M Inc., St Paul, MN) using sanitized plastic spoons. From this composite soil sample 10 g of soil was stomached for 1 min. with 90 mL of VIDAS® UP Listeria broth (LPT; bioMérieux, Marcy-l’Etoile, France) in a stomacher bag (3M Inc., St Paul, MN), and incubated at 30°C for 24-26 h. After incubation, a 0.5 mL aliquot was pipetted into each well of VIDAS UP Listeria strips (bioMérieux, Marcy-l’Etoile, France), and placed on VIDAS® Heat & Go for 5 min. Prepared VIDAS UP Listeria strips were then assayed using a VIDAS® automated immunoassay system. Soil samples which returned a positive result from the VIDAS® assay were subsequently plated for enumeration. For soil, 10 g received a serial dilution in buffered peptone water (HiMedia) and was directly plated onto modified Oxford agar (MOX; Difco, BD, Sparks, MD) with TSA overlay. The inoculated plates were then incubated at 35° C for 24 h. Colonies which were round in shape, black in color and surrounded by a black zone were counted. Using the same method, winter survival of L. innocua from each Oct.-applied subsubplot was determined on 14 May 2015 and 23 May 2016. The summer survival of L. innocua from each May-applied subsubplot was determined on 15 June, 15 July, and 18 Aug. 2015. Because of high cost of detection and enumeration, summer survival of May-applied soilborne L. innocua was only considered during the 2014-15 season.
On 15 Sept. 2015 and 6 Sept. 2016 muskmelon fruits were analyzed for the presence of L. innocua on the exterior rind using a method modified from Svoboda et al. (2016). Two marketable, mature fruits from each subsubplot were harvested and placed into individual plastic bags, we used a new pair of latex gloves for each fruit harvested. In 2015 fruits were immediately transported to the laboratory for analysis, in 2016 fruits were stored at 2 °C for 18 h before being transported to the laboratory for analysis. Muskmelon rind was sampled by removing cores of ring and flesh using a steel apple corer (Mercer Cutlery, Deer Park, NY), orange and green flesh was removed with a sterilized knife and discarded. The two fruits from each subsubplot were analyzed as a single sample. From the two fruits, 50 g of muskmelon rind was collected, mixed, and segregated into two 25 g samples. One 25 g sample was stored in a sterile plastic bag for subsequent enumeration. In a sanitized commercial blender (Oster, Sunbeam Products, Boca Raton, FL) the second 25 g rind sample was homogenized with 225 mL of VIDAS® UP Listeria broth for 1 min. The homogenate was then poured into a stomacher bag and incubated at 30 °C for 24-26 h. Similar to the soil samples, detection of L. innocua was performed on muskmelon rind homogenate using the VIDAS® automated immunoassay system, and positive results were plated for enumeration. For enumeration the unused 25 g sample was placed in a sanitized commercial blender and homogenized with 225 mL of buffered peptone water for 1 min., serial diluted in buffered peptone water and immediately plated.
The same day fruits were analyzed, samples of cover crop mulch were taken to the lab or detection of L. innocua. For R-ST and R+V-ST, four cover crop mulch samples were collected from a 20 × 20 cm area from each subsubplot and combined into a single sample. Similar to soil samples, 10 g of cover crop mulch was placed into a stomacher bag with 90 mL of VIDAS® UP Listeria broth for 1 min. and stomached for 1 mon. before VIDAS® automated immunoassay system detection and enumeration by plating on selective MOX agar.
Statistical analysis
All data were analyzed using SAS (version 9.4; SAS Institute, Cary, NC). For all data with numerical independent variables (i.e. yield and fruit quality), analysis of variance (ANOVA) was performed using proc GLIMMIX with type three sums of squares and the Satterthwaite adjustment was used for degrees of freedom. Means separation was carried out using the “lsmeans” and “pdiff” statement. Significance values were <0.05 for all variables. Because there were significant interactions with year, the data from each year were analyzed and presented separately. Cover crop, soil temperature, soil moisture, soil nutrients, nitrate-nitrogen leachate, weed density, microbial biomass carbon, and microbial functional diversity data were initially analyzed as a split-split-plot design, block was included as a random factor, tillage, cover crop, and inoculation month were considered fixed. As expected, there was no effect of inoculation month (subsubplot factor). These data were then analyzed and are presented as a split-plot design, irrespective of inoculation month, block is included as a random factor, tillage, cover crop are considered fixed.
Binary categorical responses (positive or negative) from detection of L. innocua on fruit, on cover crop, and in soil with cover crop, tillage, and inoculation month as explanatory variables were analyzed using proc LOGISTIC in SAS (Agresti, 1996). This logistic regression procedure was performed to determine if distributions of incidences were different (P < 0.05) as a result of cover crop, tillage, and inoculation month. The option SELECTION=FORWARD was used to identify significant main effects and interactions. Statistical separation of frequencies was accomplished using contrasts.
Michigan State University
MI long-term tillage trial.
The impacts of tillage (CT vs ST) and cover crops (none, rye and rye-vetch) on pickling cucumbers and soil characteristics were evaluated in a long-term research farm trial at the South West Michigan Research and Extension Center (SWMREC) in Benton Harbor, MI. Treatments were initiated in 2009 and 2010 in two adjacent fields, both with a sweet corn-snap bean-cucurbit rotation. In fall of 2013 and 2014, cover crops were sown in the September following sweet corn harvest, in anticipation of cucumber production in the summers of 2014 and 2015. In the spring, cover crops were sprayed with glyphosate and flail mowed prior to tillage. In CT treatments, pre-planting tillage included moldboard plowing, disking and field cultivation. In ST treatments, a Hiniker 6000 strip-tiller was used to prepare 10-12 inch wide tilled strips at 30” between row spacing. Cucumbers were direct-seeded in the tilled strips according to standard grower practice. Weeds were managed with standard herbicides (Strategy applied pre-emergence and Select applied post-emergence). Responses monitored in the study included: soil moisture; soil-splash onto developing leaves following rainfall events; soil organic matter; soil inorganic nitrogen dynamics; weed emergence and growth; cucumber emergence; incidence of insect and disease pests; and cucumber quality and yield.
MI winter squash trial.
The impacts of tillage (CT vs ST) and cover crops (none vs rye) on Acorn winter squash were evaluated in a short-term trial conducted in fields neighboring the long-term SWMREC tillage trial described above. Cover crop and tillage practices were as described in the long-term tillage trial. Responses included winter squash emergence, yield and quality.
MI on-farm winter squash trial, Forgotten Harvest Farm, Fenton, MI.
On-farm trials and demonstrations were conducted at Forgotten Harvest Farm in Fenton, MI in both 2015 and 2016. In 2015, strip-tillage was compared to no-till, plasticulture and disked treatments for production of Butternut squash. Strip-tillage treatments were added to a planned no-till vs plasticulture experiment funded in part through a USDA-Specialty Crop Block Grant awarded to collaborators Ben Phillips and Michael Yancho. For this trial, cereal rye was sown across the entire experimental area in the fall of both 2014 and 2015. The following spring, ST was accomplished with a one-row Unververth 120 strip-tiller equipped with row-cleaners, berming disk and rolling basket. In 2015, S-metolachlor was used pre-emergence to manage weeds. In 2015, herbicides included Curbit + Command + Sandea applied as a pre-emergence tank-mix. Responses measured included soil moisture, soil inorganic nitrogen, and butternut squash yield and quality. In 2016 only, various rates and forms of N fertilizer were also evaluated as subplots within the tillage main plot treatments.
MI on-farm strip till, cover crop and cultivation demonstrations, Zilke’s Vegetable Farm, Milan, MI. At Zilke’s Farm, in 2015 we demonstrated and evaluated a roller-crimper in a thick stand of a cereal rye-hairy vetch mixture. We had planned to transplant winter squash into the crimped stand, but heavy rains throughout the spring and early summer resulted in a flooded, un-plantable field, so the trial was abandoned. In 2016, we demonstrated our Unverferth strip-tiller in a field that had a rye-vetch mixture sown the previous fall. Strip-tilled and disked areas within this field were planted with both beans and summer squash. We also tested various in-row cultivation tools within the strip tilled zones including finger weeders and torsion weeders, used alone or in combination. In a neighboring field, the grower planted various cover crop seeds that we provided including buckwheat, yellow mustard, sorghum sudangrass, and forage turnip. Twilight meetings were held in September of both 2015 and 2016 to discuss cover crops, tillage and cultivation tools.
SARE-Final-Report-2017-Figures-and-tables
Iowa State University
Weather
In Feb. 2015 the average monthly air temperature was 5.8 °C lower than the 30-year average of -4.4 °C (Fig. 1). This deviation from the 30-year average can largely be accounted for by several short periods of cold air temperatures near the end of Feb. In 2015, during the months the muskmelon crop was growing, the air temperature was comparable to the 30-year average. From the time cover crops were planted for the 2015-16 study in Sept. 2015, until the cessation of muskmelon harvest in Sept. 2016 the average monthly air temperature was consistently greater than the 30-year average. During both years of the study total monthly precipitation for the months of July and Aug. were greater than the 30-year average. This increased rainfall resulted in saturated soil at the beginning of muskmelon fruit harvest.
Cover crop measurements
There was no significant (P < 0.05 ) effect of treatments on cover crop dry weight biomass during either year of the study (Table. 2). In both years of the R-ST plots surpassed the recommendation of 8 Mg∙ha-1 dry weight biomass necessary to suppress annual weed germination in reduced tillage systems from Mirsky et al. (2013). However, R+V-ST plots only exceeded that recommended value in 2016.
There was a significant cover × tillage interaction effect on cover crop C % in 2016. In 2016, R+V-CT (36.7%) had lower percent C than R+V-ST, R-CT, and R-ST with means of 43.7%, 43.4%, and 41.5% respectively. In 2016, R+V had greater N % than R. Since plant samples from R+V plots were ground and analyzed as a mixture, the increased percent N can be attributed to fixation of atmospheric N by the hairy vetch.
In 2016 there were significant main effects of both cover crop and tillage on cover crop C:N ratio. Because of the increased N content in the leguminous hairy vetch plant tissue, R had a C:N ratio 22% of R+V. Cover crops from ST plots had a C:N ratio 18% greater than cover crops from CT plots. As R approaches anthesis lignin, cellulose, and hemicellulose accumulate in the plant tissue at greater concentrations, causing a dilution of N in plant tissue (Wagger, 1989). The earlier termination date of cover crops in CT plots prevented the additional accumulation of C in the R tissue. In 2015, there was an increased C:N ratio in R and in ST treatments, though the differences were not significant. The 2016 data confirms our hypothesis R+V biculture will reduce C:N ratio.
Weed biomass
In 2015 ST lowered weed biomass by 81% compared to CT (Fig. 2). In 2016 weed biomass in NC plots was higher than R and R+V plots. In 2016, there was a significant cover × tillage interaction effect on weed biomass, NC-ST plots [243.0 ±121.2 g∙m-2 (mean ± standard error)] was higher than the aggregate mean of all other cover × tillage treatments (31.5 ± 18.8 g∙m-2).
The critical weed-free period for muskmelons is described as 4-6 w after emergence by Nerson (1989). A study found that the minimum critical weed-free period resulting in no more than a 10% loss was 3.9 w (Terry et al., 1997). In 2015 weed samples were collected 3 w after muskmelon transplanting and 4 w after in 2016. The low weed biomass in R–ST and R+V-ST plots indicate that a rolled cover crop much may be an effective means of controlling weed competition during the critical weed-free period of muskmelons. The absence of significant cover × tillage interactions that separated R-ST and R+V-ST from all other treatments indicate that a rolled cover crop mulch can suppress early season weed growth equally if no better than tillage or herbicide. Weeds that emerge through cover crop mulch may show little competition with the current year’s crop. But if weed seeds are dispersed pressure is likely to increase in subsequent years. For these reason growers practicing ST may need to periodically use CT or herbicide to prevent long-term weed problems. Innovations in weed management for ST vegetable crops will be very beneficial and encourage adoption among growers. Both pre and post-emergence herbicides were used to control weeds in NC-ST plots, and in 2016 weed pressure was significantly greater in NC-ST plots. This indicated that exclusive dependence on herbicide for weed management might be ineffective for growers, compared to cover crops or mechanical weed control.
Soil temperature
In both years of the study, CT increased IR soil temperatures throughout the season; this difference was not significant during the 2016 late period (Table 3). This increase in IR soil temperature was due to the absorption of solar radiation by the black plastic mulch as well as the mulch’s ability to insulate the soil. All CT plots used raised beds covered with black plastic mulch, whereas ST plots had bare soil exposed in the IR area.
The difference in soil temperatures between tillage treatments was greatest during the early period. Throughout the 2015 and 2016 growing seasons, CT increased soil temperature over ST by an average of 2.5 °C and 1.3 °C respectively. Soon after transplanting, young muskmelon plants will undergo rapid growth and vines can quickly cover the IR area. During the mid and late periods, the muskmelon canopy likely intercepted most of the solar radiation in the IR area, allowing less surface interception. This reduction in solar radiation could have led to less difference among the soil temperatures for ST and CT treatments during the mid and late periods.
In both years, NC plots had a higher soil temperature than R and R+V during the early period. As shown in Table 3, significant cover × tillage interactions were observed at each period during the 2015 growing season, but at no point in 2016. Generally, soil temperature in 2015 was greatest for CT plots, lowest for R-ST and R+V-ST, and NC-ST was an intermediary. This numeric trend was seen throughout the 2015 season and during the mid and late periods of the 2016 season. This exact trend was only reflected in the statistical grouping of means for the early period of the 2015 season. Our hypothesis was confirmed in that ST and cover crops reduced soil temperature. It would be expected that among ST plots, NC plots would have higher soil temperatures because the cover crop mulch in R and R+V plots would reflect more solar radiation than bare soil. Reduced IR soil temperature may be a limiting factor for vegetable crop production systems utilizing a rolled cover crop mulch.
Soil moisture
There was no significant main effect of cover crop on soil moisture (VWC) during either year of the study (Table 4). For the late period in 2015, ST increased soil moisture by 0.04 m3∙m-3. In 2016 ST increased soil moisture by an average of 0.04 m3∙m-3 for each period. The trend of increased soil moisture under ST is consistent with previous findings (Licht and Al-Kaisi, 2005). In our study, there are likely several factors that likely contributed to decreases in soil moisture levels in CT plots compared to ST: the use of raised beds in CT which can promote drainage, changes in soil porosity as a result of varying levels of tillage intensity, and cover crop residue on the soil surface.
Soils under reduced tillage maintain a greater proportion of micropores capable of retaining plant-available water, while CT soils tend towards macropores which encourage drainage (Azooz et al., 1996). In this study soil moisture was measured in the IR area at a depth of 15 cm. Soil in the IR area was tilled in both the CT and ST treatments. The Hiniker 6000 strip-tiller, which performed all tillage for ST plots, utilized a single shank which tilled to a depth of 23 cm. Though soil porosity was not measured in this study, it was likely affected by rototilling performed in CT plots. A shift towards a greater proportion of macropores in CT plots could encourage drainage and reduce soil moisture.
The absence of plant residue on the soil surface can increase the rate of soil water evaporation (Bond and Willis, 1969). Fortin (1993) found that no-till corn plots had a higher IR soil moisture level than both CT plots and no-till plots with IR reside removed. Surprisingly, we found that the absence of cover crop residue in the BR area of NC-ST plots did not affect soil moisture in the IR area. Though we did not measure soil moisture in the BR area, the absence of crop reside in NC-ST plots and CT all plots likely lowered soil moisture compared to R-ST and R+V-ST plots. (Fortin, 1993) found that no-till corn plots with BR residue removal and CT plots had lower BR soil moisture compared to no-till plots with BR residue. The use of trickle irrigation in this study to avoid drought stress and deliver fertilizer may have masked differences between soil moisture of NC-ST plot and R-ST and R+V-ST plots.
Soil nutrient measurements
In 2015 CT increased concentrations of soil NO3--N at each sampling date (Table 5). Levels of soil NH4+-N were low in 2015, and there were no significant differences. For the 2016 end of season sampling, CT increased soil concentrations of NH4+-N by 0.8 mg∙kg-1 and concentrations of NO3--N by 3.9 mg∙kg-1. These higher concentrations of inorganic N among CT plots was the result of greater mineralization of organic N. Mineralization of organic N can increase with temperature (MacDonald et al., 1995). The increased soil temperatures in CT plots (Table 3) likely facilitated mineralization of organic N from cover crops and from soil. Additionally, cover crop C:N ratio was lower among CT plots. The lower C:N ratio allowed organic N from cover crop tissue to be more readily mineralized and released to the soil. In 2016 concentrations of soil NH4+-N from R+V plots were 3.3 mg∙kg-1 greater than NC plots. After termination of cover crops, the mineralization of organic N from the leguminous hairy vetch tissue caused an increase in soil NH4+-N.
In 2016 a main effect of cover crop on P was observed only for the end of season sampling. The end of season sampling in 2016 had highest soil P levels in R+V plots, lowest P levels in NC plots, and R was intermediate and statistically indistinguishable from NC and R+V. Winter cover crops have been shown to cause an increase in P uptake by a subsequently planted sweetcorn, and increased populations of mycorrhizal fungi (Kabir and Koide, 2002). The authors concluded that the increase in P uptake could have resulted from either increased P availability as a result of mycorrhizal fungi, or through the release of P from cover crop residue. Though P uptake by either the cover crops or muskmelon plants was not measured, it is possible that P accumulated in the R+V tissue was released throughout the season causing increased soil P concentration.
The main effect of cover crops on soil K observed for the 2015 end of season sampling was likely due to plot effects which were present before the establishment of treatments. Soil samples taken at the time of cover crop planting, before any treatments had been established, indicate that on average, R plots already had soil K concentrations 60% greater than NC and 32% greater than R+V.
In 2016, R and R+V had greater concentrations of soil K than NC for the mid-season sampling date. In the top 5 cm of soil, R has been shown to increase soil K on both a silt loam and a silty clay (Eckert, 1991). Using nitrification inhibitors with NO3- fertilizers has been shown to reduce K leaching in a sandy loam (Wu et al., 2007). The nitrification inhibitor caused a reduction in levels of the NO3- ion which promotes K movement. Dynamic interactions between soil N and K have been well documented (Zhang et al., 2010). It is possible the absence of NO3- immobilization by cover crop reside in NC plots increased K leaching, and resulted in reduced levels of soil K.
In 2016 CT increased soil concentrations of K over ST for both the mid-season and end of season sampling dates. Contrary to our results, Shao et al. (2016) reported that reduced tillage practices increased soil levels of K over CT. We found that for the end of season sampling, CT also increased levels of both NO3-- N and NH4+-N. Because NH4+ has a similar charge and hydrated ion diameter to K+, NH4+ inhibits K+ uptake by roots (Wang et al., 1996). In contrast to the NH4+ cation, the mobile NO3- anion serves to accompany K+ during uptake (Pettersson, 1984). Greater concentration of either forms of inorganic N in the soil could have affected the leaching and the uptake of soil K, leading to depletion of soil K. The precise cause of the differences in level of P and K are not fully understood.
Nitrate-nitrogen in leachate
During both years of the study concentrations of NO3- -N in leachate for all treatments was higher in the June and July (Table 6). In 2015 there was a significant main effect of tillage at one sampling date, CT increased NO3- -N concentrations in leachate on 12 Aug. In 2016 there were three consecutive dates where CT significantly increased NO3- -N concentrations in leachate, 6 July, 13 July, and 22 July. There was no significant cover × tillage interaction effect of NO3- -N leaching during either year of the study. The effect of ST in reducing NO3- -N leaching, even in the absence of a cover crop suggests that physical changes to the soil as a result of tillage methods also affect NO3- -N leaching. Though not directly measured, N immobilization likely contributed to reductions in NO3--N leaching by ST. When present, cover crop tissue is in ST plots had a greater C:N ratio. A high C:N ratios among cover crops can increase N immobilization (Kuo and Sainju, 1998). Jokela and Nair (2016) found that early season NO3- -N leaching was reduced under no-till and ST organic pepper plots compared to CT.
Samples collected on 16 Aug. 2016 shown a significant effect of cover crop on the concentration of NO3- -N in leachate, NC plots was highest, R+V was the lowest and NO3--N concentrations were only 24% of NC plots. However, the other cover crop treatment R had a concentration of NO3- -N in leachate 66% of NC and was statistically indistinguishable from either NC or R+V. As with the main effect of tillage on NO3--N leaching, increased immobilization of inorganic N under R+V likely reduced leaching compared to NC plots. The results confirmed our hypothesis that cover crops and ST would reduce NO3--N leaching. The effect was not consistent throughout the season and was not seen at each sampling date.
Muskmelon plant growth
In 2015 and 2016 vine length for plants grown in ST plots were 82% and 85% respectively of those grown in CT plots Table 7). Tillman et al. (2015) similarly found that ST reduced vine length of muskmelon plants. Reduced vine length in ST plots is likely a result of cooler soil temperatures and less plant available N.
There was a significant main effect of tillage on SPAD, a unitless measurement, during both years of the study. In 2015 ST increased SPAD by 5.5, however in 2016 ST decreased SPAD by 3.1. In Aug. 2015 symptoms of foliar diseases were observed in all treatments, but for unknown reason appeared to be more severe in CT plots. This led to high incidences of necrotic lesions on the leaves on plants in CT plots. We believe that the lesions may have affected measurement, and caused a decrease in SPAD values among CT plots.
In 2016 concentrations of NO3- -N and K+ in petiole sap were measured as harvest began for all treatments. A significant cover × tillage interaction showed that petioles from NC plots had sufficient concentrations of NO3- -N, regardless of tillage (Table 7; Fig. 3). However in the presence of either cover crop, petioles from ST and CT plots achieved only 20% and 64% of the median of the sufficiency range described in Hochmuth et al. (1991). This is likely due to the varying degrees of N immobilization across cover and tillage treatments. The absence of cover crop residue in NC plots limited soil N immobilization and optimized NO3- -N concentrations regardless of tillage. The statistical separation of tillage treatments within the two cover crop treatments indicates that treatments differences in cover crop C:N ratio (Table 2) affected petiole sap NO3- -N concentrations, likely through differences in N immobilization. The increased C:N ratio of cover crop tissue observed in ST plots, likely increased N immobilization compared to R-CT and R+V-CT. There was no significant difference between R and R+V main effects, despite R+V biomass having a lower C:N ratio. In 2016 all plots received a weekly application of water-soluble NO3- fertilizer delivered through drip irrigation. It is possible that this fertility management masked any possible effect of the legume cover crop on measures of NO3- -N concentration in petiole sap.
Significant main effects of both cover and tillage on concentrations of K+ in petiole sap showed a reduction for NC treatments as well as CT treatments (Table 7). There was no significant cover × tillage interaction. Petiole sap from NC plots had reduced K+ concentration; CT and ST were 48% and 82% respectively of the median of the sufficiency range. Soil samples taken 19 July 2016 show that NC plots had significantly less soil K than R and R+V, possibly as a result of leaching. Leaching of soil K could have limited the amount of K available to muskmelon plants, and explain the reduced concentration of K in petiole sap observed on 18 Aug. 2016. The same 19 July 2016 soil sample showed significantly higher concentrations of K in among CT plots. These data do not align with our previously proposed hypothesis of K leaching, because there was a significantly lower K concentration in CT petiole sap. Contrary to our hypothesis measure of plant growth in ST treatments was less than CT, and both cover crop and tillage has significant effects on K+ concentration. As with soil K, the cause of the main effects on petiole sap K+ concentrations is not fully understood and warrants further research.
Muskmelon yield
In both years of the study, CT increased both marketable weight and total weight of fruits by an average of 28% (Table 8). This finding is contrary to our hypothesis that integration of ST and cover crops would not result in yield reductions. Our findings are consistent with previous studies which found that ST decreased muskmelon yield (Lilley and Sánchez, 2016, Tillman et al., 2015). Increased soil temperature, more vigorous plant growth, and greater availability of mineralized N in CT plots likely led to increased yields.
In 2015 marketable yield was a lower proportion of total yield compared to 2016. We attribute the loss of marketable yield to several factors: higher populations of striped cucumber beetles, and higher incidences of foliar disease, and saturated field conditions near harvest led to soft spots and cracking on fruits. In 2016, cucumber beetle pressure was much lower, and our disease management program used the MELCAST disease forecasting system (Latin, 2001) to optimize the timing of fungicide application. Though ST reduced yields, we estimate that vegetable growers would find 2016 ST yield numbers acceptable for their production.
In 2016 only, there was a significant main effect of cover crop on total weight, marketable number, and total number of fruits. Generally, NC and R+V were greater than R for these values. It is unclear why there were significant differences between R and R+V for marketable number and total number of fruits. While it is reasonable to speculate that this is a result of increased muskmelon plant growth due to greater percent N in leguminous hairy vetch tissue, other data do not support this mechanism.
Muskmelon fruits quality
There were no differences in fruit density, fruit shape, flesh thickness, or soluble solids concentration (SSC) in 2015 (Table 9). In 2016, muskmelon fruits harvested from R and R+V plots had a more spherical shape than those from no-cover crop plot as indicated by the values for fruit shape. Values for fruit shape of CT were 0.05 greater than ST. The flesh thickness of muskmelon fruits harvested from R plots was 0.6 cm greater than those harvested NC plots. Compared to 2015, TSS was greater for all treatments in 2016. Fruits from R and R+V had a combined TSS 0.9 greater than fruits from no-cover. ST increased TSS of muskmelon fruits by 1.2% over CT.
In our study, ST produced more spherical-shaped fruits with a higher SSC, as did the use of a R or R+V cover crop. Flesh thickness for R was increased over NC. More rounded fruits, thicker flesh, and higher SSC are desirable for growers and consumers. Vegetable breeders have pursued the development of round-shaped melons in the past. Round fruits appear more symmetrical to consumers and pack well into boxes. While flesh thickness is difficult for consumers to assess when purchasing whole-muskmelons, this quality may be important in the fresh-cut market. For honeydew melon (Cucumis melo L. inororous group) SSC correlates highly with sensory panel rating of sweetness and flavor, main indicators of quality (Lester and Shellie, 1992). These results show that despite a reduction in yield ST holds the potential for improved fruit quality, as does the use of a winter cover crop. The specific mechanisms of these changes in fruit quality are unknown. We speculate that changes in soil conditions as a result of cover crop and tillage treatments affected plant growth, flower growth, and ultimately physio-chemical aspects of fruit development which enhanced fruit quality. In Iowa many growers rely on direct market sales, and providing a high-quality product is important. In addition to the conservation benefits, ST and cover crops can improve fruit quality for growers in the upper Midwest.
Microbial biomass carbon
In both years of the study, there was a significant cover × tillage interaction on MBC (Fig. 4). In 2015 R-CT plots resulted in the greatest MBC, and NC-CT has the lowest MBC. All other treatments were statistically indistinguishable from R-CT and NC-CT in 2015. In 2016 R-CT and R+V-CT had a greater MBC than their respective ST plots, as well as both NC-ST and NC-CT. The lowest MBC value was observed in NC-CT plots, but this value was not statistically different from NC-ST or R-ST.
A general trend was observed during both years of the study that there was greater MBC in CT plots when there was either R or R+V cover crop, but MBC for NC-CT plots was less that NC-ST plots. This trend is likely due to the amount of cover crop residue incorporated into the soil, combined with the effect of plastic mulch on soil microclimate.
We found that plastic mulch in CT plots significantly increased soil temperature of the IR area compared to ST (Table 3). Warmer temperatures can increase the rate of metabolic processes among soil microbiota, and possible increase soil MBC. A study in China found that plastic mulch left in place throughout the growing season can increase MBC (Li et al., 2004). Tillman et al. (2015) found that CT which utilized plasticulture occasionally increased MBC over ST in conventionally managed muskmelon production with cover crops.
In both years of the study, there was no significant difference between NC-ST and NC-CT, though NC-CT has the lowest mean in both years. In the absence of a cover crop, plasticulture may ineffective in increasing MBC. The cover crop biomass in CT plots was fully incorporated into the soil and more exposed to the chemical and biological factors that would promote rapid decomposition. Whereas in ST plots only the roots of cover crop plants were fully exposed to soil, and aboveground biomass was in limited contact with the soil surface. This difference in spatial distribution of cover crop residue could explain the increased MBC in CT plots with a cover crop.
Accumulation of crop residue and reduced tillage increases SOM near the soil surface. Reicosky et al. (1995) found that in the top 1.5 cm of soil, SOM increased at a rate of 2.3 Mg∙ha-1 per year after the adoption of no-till practices. Fungal decomposition retains more C as biomass and results in less CO2 loss through respiration compared to bacterial decomposition (Adu and Oades, 1978). This efficiency results is a greater proportion of residue derived C being assimilated to SOM. Holland and Coleman (1987) found a greater fungal abundance in the soil when wheat straw residue was left on the surface compared to soils where residue was disked into the soil. They concluded that the extensive hyphal structure allows fungi simultaneous access to soil N and C stored in the surface residue. Tillage systems that retain residue on the soil surface, such as ST, can promote soil health by encouraging fungal populations that increase soil organic matter. Because fungal communities play a unique role in affecting SOM and soil health of reduced tillage systems, quantification of fungi may be important. We recommend that future studies on reduced tillage make an effort to segregate the contribution of fungal populations to the soil community.
Microbial functional diversity
All data for microbial funtional diversity were derived from measures of the optical density of Biolog-ecoplates® which indicate C substrate utilization. Shannon-Weiner index, species evenness, and species richness are separate indicators of diversity, whereas AWCD is a measure of both diversity and abundance. Values shown in Table 9 are calculated from measurements of optical density after 7 d (168 h) of incubation. Measurements were taken at 0 h and every 24 h thereafter. Values from days 1-6 are not shown, and there were no significant differences during either year. There were no significant treatments effects in 2015. In 2016 values for Shannon-Weiner Index and species evenness for R and R+V were significantly greater than NC plots (Table 10). Species Richness and AWCD were unaffected by treatments in 2016.
Our hypothesis was that both cover crops and ST would increase measures of microbial functional diversity, though there were no significant effects of tillage on the results. For this study measures of microbial functional diversity were taken from 2.9 x 15 cm soil cores collected from the IR area. Because the BR area of ST plots under R and R+V maintained a cover crop residue and no-till soil conditions, differences in microbial communities as a result of tillage treatments may have been more pronounced. Jokela and Nair (2016) used Biolog-ecoplates® to compare AWCD of the IR and BR area of both ST and CT plots at two different depths, 0-7.5 cm and 7.5-15cm. In the BR area of ST plots, where cover crop residue was covering the soil, AWCD was greater only at the shallow depth. Lupwayi et al. (1998) found that measures of microbial diversity were increased for reduced tillage practices in the BR area only, but diversity was unaffected by tillage in the IR area.
Survival of soilborne Listeria innocua
Survival of October-applied L. innocua. When tested the following May, there were no effects of treatments on winter survival of L. innocua Oct.-applied (Table 11). By factor, survival in 2015 ranged from 88% - 100% of plots testing positive. In 2016 100% of plots which were inoculated in October tested positive for L. innocua the following May. Innoculum levels were much lower in 2015 than in 2016. After direct plating with no dilution only eight of the samples grew colonies, and the maximum number of colonies formed was two. In contrast, inoculum levels were much greater in 2016, average was 2.8±0.1 log CFU∙mL-1. Our results show that during the winter in Iowa, soilborne L. innocua is capable of surviving, and is not affected by cover crop management. A study in Maryland, USA found when organic fields were populated with L. innocua in the fall, the bacteria persisted and were recoverable the following spring (Reed-Jones et al., 2016). Contaminated water and animal manure are likely sources of human pathogens in produce fields. After a contamination even leaving a field fallow for several months over the winter may not guarantee the absence of human pathogens, and other mitigation strategies should be employed.
Survival of May-applied L. innocua. In 2015, 3 d after inoculating soil with L. innocua, 100% of plots tested positive, and initial inoculum levels were 2.7±0.1 log CFU∙mL-1 (Table 12). In June, July, and Aug. there were effects of cover crop on survival of soilborne L. innocua; NC plots had a greater frequency of detecting L. innocua than did R and R+V. In June 2015 mean inoculum levels for NC, R, and R+V were 1.6, 1.5, and 1.6 log CFU∙mL-1. No R or R+V plots sampled in July or Aug. 2015 tested positive for L. innocua. In July and Aug. inoculum levels for NC plots were 1.7±0.1 and 1.6±0.4 log CFU∙mL-1, respectively.
Data collected only in 2015 showed that among May inoculated subsubplots, a stark decline in L. innocua populations occurred in plots where a cover crop was present, but there was no effect of tillage. In July and Aug. of 2015, there was no L. innocua detected in any R or R+V plots. In contrast, Reed-Jones et al. (2016) found that in one year of their study L. innocua in R and R+V plots persisted for the several weeks after inoculation, while a vetch monoculture and bare ground plots showed an immediate decline. In the second year of the same study, vetch monoculture and R+V plots had significantly higher populations of soilborne L. innocua than R monoculture plots. In our study, L. innocua seemed to have been eliminated from both R and R+V plots. We believe that this observation was caused by at least one of three mechanisms: increased microbial competition, R allelopathy, or changes is basic cation saturation ratio. Buyer et al. (2010) found that cover crop increased the soil microbial biomass (quantity) and soil microbial community composition (diversity), but decreased the proportion of gram-positive bacteria in the soil. Listeria spp. are gram-positive. The authors concluded that gram-positive bacteria were less active in accessing cover crop derived carbon, favoring other microbial groups. Sterilization of soil does encourage the growth of L. monoctogenes, likely by eliminating competition. In one of the first studies on survival of L. monocytogenes in soil, researchers were unable to detect the pathogen in soil samples after inoculation, and were then forced to sterilize soil samples before inoculation (Welshimer, 1960). To confirm that increased survival of L. monocytogenes was not due to release of nutrients during autoclaving, McLaughlin et al. (2011a) reconstituted sterile soil samples aerobic bacteria. They found lower L. monocytogenes survival in reconstituted sterilized soil samples compared to sterilized soil samples, confirming the influence of competition. After we had terminated cover crops, R and R+V could have impacted soil microbial communities and made L. innocua, a gram-positive bacterium, less competitive. Locatelli et al. (2013) determined that soil chemistry was the primary factor determining the short-term survival of L. monocytogenes. At 7 and 14 d after inoculation, 55.4 % and 44.7 % respectively, of the variability of L. monocytogenes survival was explained by basic cation saturation ratio. It is possible that in our study, after termination, cover crops changed basic cations saturation ratio and discouraged L. innocua survival. Rye, wheat (Triticum aestivum L.), and corn contain a group of allelochemicals called benzoxazinoids, which are known to exhibit toxicity against plants, bacteria, and fungi (Schulz et al., 2013). After rye termination benzoxazinoids within plant tissue undergo a cascade of transformations in the soil, resulting in different degradants with varying toxicity and persistence in the soil. The degradation process is dependent on soil microbes and does not occur in sterilized soil, or in soils where benzoxazinoids containing crops have not been recently grown (Macías et al., 2004). One compound that results from benzoxazinoids degradation, 2-amino-3H-phenoxazin-3-one (APO), was found to have persisted in the soil for 90 d with little variation (Macías et al., 2004). Considered one of the more toxic rye allelochemicals, APO has bactericidal properties. In fact, APO has been described as an antibiotic and referred to as Questiomycin A (Anzai et al., 1960, Gerber and Lechevalier, 1964, Atwal et al., 1992). The elimination of L. innocua from the soil by rye allelochemicals is an attractive hypothesis because the decline and eventual absence of positive detections of L. innocua in R and R+V plots could conceivably align with the degradation of benzoxazinoids and the appearance of the bactericidal APO compound.
Presence of Listeria innocua on muskmelon fruit and cover crop mulch
There were no significant main effects or interactions for the frequency of detecting L. innocua on the surface of muskmelon fruits at harvest (Table 13). For both years and across all factors, frequencies of positive detection ranged from 0% - 20%. Positive melon samples in 2015 had an average L. innocua level of 3.5±0.2 log CFU∙mL-1 and in 2016 average levels were 5.5±0.3 log CFU∙mL-1. In 2015 L. innocua was positively detected on a single sample of cover crop mulch (data not shown). Similarly, in 2016 L. innocua was positively detected on a single sample of cover crop mulch. Both of these cover crop mulch samples were from R-ST plots with May-applied L. innocua. The levels of L. innocua on these cover crop samples were 3.7 log CFU∙ml-1 in 2015 and 5.5 log CFU∙mL-1 in 2016.
The similar frequencies of fruit contamination by soilborne L. innocua across treatments disproved our hypothesis that a rolled cover crop mulch would prevent contamination. Contamination frequency was low for each year and each treatment. As previously discussed, fruits from R-ST and R+V-ST appeared to be cleaner than fruits which were sitting directly on the soil surface but were not completely free from soil. Soil splash during heavy rainfall events is likely responsible for the limited quantities of soil present on fruits from R-ST and R+V-ST plots. It is unlikely that a cover crop mulch will completely prevent the transfer of soilborne human pathogens to the surface of muskmelon fruits. In 2015 no soil samples collected from R or R+V plots tested positive for L. innocua in July and Aug. Despite this, in Sept. 2015 L. innocua was recovered from the surface of muskmelon fruits grown in cover crop plots. This surprising observation suggests that cover crop mulch in ST and limited cover crop surface residue in CT may be acting as a reserve for L. innocua. May-applied L. innocua could have transferred to cover crop surface residue after termination and avoided soil conditions which eliminated the soilborne populations. Surface residue harboring L. innocua could have contamination muskmelon fruits. This explanation is supported by the fact that during both years of the study some samples of cover crop mulch from ST plots did test positive for L. innocua.
Michigan State University
MI long-term tillage trial
The effects of tillage and cover crops on cucumber yield varied by year (Figure M.1 A and B). In 2014, cucumber yields were greater in the ST-bare treatment compared to all other treatments except CT+rye. Within ST treatments, both rye and rye-vetch cover crops reduced cucumber yield. The reason for this suppression was likely a combination of planter-interference, N-immobilization or allelopathy from the rye, which resulted in visible chlorosis and stunting in some patches within rye and rye-vetch treatments (Figure M.2). Increased yields due to ST in the no-cover crop treatments may have been due to reduced soil erosion (Figure M.3), improved moisture retention (Figure M.4) or long-term improvements in soil health, as reflected in increases in soil organic matter at 0-4” depth in ST compared to CT treatments (Figure M.5). In 2015, no effects of either tillage or cover crop on cucumber yields were detected (Figure M.1 B). Tillage and cover crops influenced the emergence and growth of various weed species in both years (Table M.1). In general, we have observed an increase in the abundance of horsenettle (a perennial), and large crabgrass (a summer annual) in ST treatments. Herbicides have prevented these species from causing major yield reductions, but may contribute to increased herbicide or handweeding costs in the long-run. In contrast, emergence and growth of summer annual broadleaf species was sometimes reduced under strip tillage (e.g. Powell amaranth, 2015). In both years, the ST-bare treatment was most profitable due to reductions in tillage costs relative to CT-bare, and reductions in seed costs relative to ST-rye or CT-rye treatments.
MI short-term Acorn squash trial
Strip tillage by itself had no effect on Acorn squash yield in either year (Figure M.6). However, in 2015, strip-tillage combined with a winter rye cover crop reduced crop yields relative to all other treatments. As with the cucumber trial, we suspect that this yield reduction was due to a combination of rye interference with planting, and reduced N-mineralization, which we have documented in other ST trials. The ST-bare treatment was most profitable due to reductions in tillage costs relative to CT-bare, and reductions in seed costs relative to ST-rye or CT-rye treatments. on-farm winter squash trial, Forgotten Harvest Farm, Fenton, MI. At Forgotten Harvest in 2015, butternut squash yields from highest to lowest were as follows: Plasticulture > ST = CT > No-till. The plasticulture system had higher costs, but fewer weeds and higher N availability then the other treatments. In 2016, yields were ranked as follows: ST > NT = CT (Table M.2). In 2016, both the no-till and conventional till treatments suffered from poor stand establishment relative to ST, presumably because the row cleaners and tillage in the planting zone of ST reduced interference from the rye. Weeds were well controlled without need for handweeding in both the NT and ST treatments (Figure M.7), but not the conventionally tilled treatment, resulting in the need for subsequent cultivation and hand weeding. Overall, ST resulted in higher yields, cleaner fruit and lower costs than CT, and the grower was impressed with the system. Additional details of this trial can be found at: https://ag.purdue.edu/hla/fruitveg/pages/mvvtrb.aspx
MI on-farm strip till, cover crop and cultivation demonstrations, Zilke’s Vegetable Farm, Milan, MI.
In 2015, following roller-crimping, our planned experiment was abandoned due to flooding which made planting impossible. In 2016, strip tillage resulted in a good seedbed, and both snap beans and squash established reasonably well, although both became somewhat chlorotic and stunted relative to those in adjacent disked areas, presumably due to some combination of inadequate nitrogen, interference from the rye residue, or weed competition. Perennial weeds were particularly problematic in this trial. In retrospect, this field was probably a poor choice to attempt organic strip tillage because it had been untilled the previous year and patchy cover crop growth allowed perennials (mostly perennial sowthistle and Canada thistle) to establish. Nonetheless, it provided a good opportunity to test “in-row” finger and torsion weeders for compatability with strip-tillage systems. In brief, finger weeders performed reasonably well, while torsion weeders did not. Torsion weeders had a tendency to get caught in rye residue, or slip out of adjustment and damage developing seedlings. Because of their rolling action, and flexible tips, finger weeders were much less prone to interference from residues, and less damaging to the crop. However, both tools require relatively small weeds (<2 lf), and a well-established crop for optimal performance. In other related trials, we have found that Lilliston-type rolling cultivators are also useful for managing weeds near or between rows where residues are present, and likely would have been helpful (though perhaps not sufficient) for managing the perennial species between rows.
SARE-cover-crop-Infographic-02.28.2017
Iowa. The research was highlighted during the 2015 and 2016 Fruit and Vegetable Field Day at the Horticulture Research Station, Ames, IA in partnership with Practical Farmers of Iowa and Iowa Fruit and Vegetable Growers Association. The field day held on 11 August 2015 and 15 August
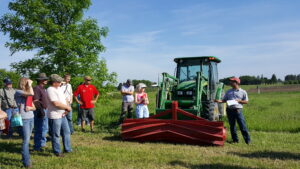 Roller crimper field day
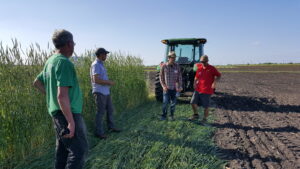
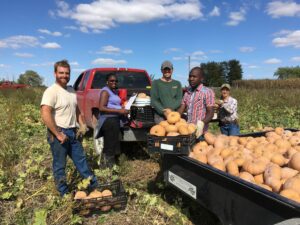 Squash harvest at grower collaborator plot in 2016
 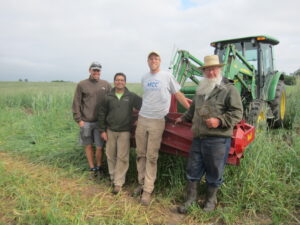 Roller crimping at Phil Funk's farm in 2015
 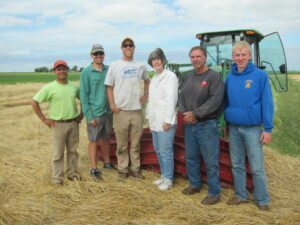 Roller crimping at Darrell Geisler's farm in 2015.
 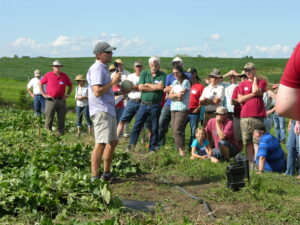 SARE research presented at Fruit and Vegetable Field Day.
in 2016 was attended by 120 and 94 participants, respectively, including growers, extension personnel, industry personnel, graduate students, and researchers. As part of the project, three on-farm trial were conducted: 1) Hilltop Farms owned by Phil Funk, Dallas Center, IA in 2015, 2) Darrell Geisler’s Farm (Growing Family Fun Farms, Bondurant, IA) in 2015, and 3) Glenwood Farms, Albion, IA in 2016. Trials demonstrated the use and efficacy of roller crimper in killing a cereal rye cover crop and production of several cucurbit crops (pumpkin, muskmelon, and winter squash). Cover crop kill in the roller crimper plot was similar to the kill obtained by using herbicides. Results from the project were discussed with growers at Great Plains Growers Conference, St. Joseph, MO and Iowa Fruit and Vegetable Growers Association Annual Conference, Ankeny, IA in 2015 and 2016. A Field Day was organized in partnership with Practical Farmers of Iowa in June 2016 at George Naylor's farm to highlight the use of roller crimper in soybean production system. A roller crimper field day was organized at the Horticulture Research Station in May 2016 to demonstrate the working of roller crimper. The event was attended by 35 people representing growers, educators, and extension staff.
Research poster and presentation on the project were presented at the American Society for Horticultural Science Conference, Atlanta in 2016 (~750 attendees), Ontario Fruit and Vegetable Conference in Niagara Falls, ON in 2017. (~200 attendees), Great Lakes Vegetable Working Group Meeting, St. Paul, MN in 2017, Rhode Island Vegetable Growers Meeting, Kingstown, RI in 2017, Illinois Specialty Crop Conference, Springfield, IL in 2017, and Indiana Melon Growers Conference, French Lick, IN in 2017. A team presentation of research and on-farm trials was presented by Dr. Ajay Nair and Mr. Wade Dooley (Glenwood Farms) at Midwest Cover Crop Council Meeting, Grand Rapids, MI in 2017. In addition the graduate student presented results from this project at several graduate school events at Iowa State University, Department of Horticulture Research Retreat, Graduate Program in Sustainable Agriculture Research Symposium, Practical Farmers of Iowa Conference, and Great Lakes Fruit and Vegetable Expo, Grand Rapids, MI.
Michigan. In 2015, two field days highlighting our research were conducted: one at the Forgotten Harvest Farm (~20 grower attendees) and one at Zilke’s Vegetable Farm (~40 grower attendees). In 2016, a twilight meeting was held at Zilke’s Vegetable Farm (~25 grower attendees). These meetings included discussions of soil health, cover cropping and tillage practices, as well as equipment demonstrations and visits to research sites. In 2015, grower-collaborators Tom Zilke and Mike Yancho discussed their experiences at the Great Lakes Fruit and Vegetable Expo in Grand Rapids, MI. Zilke was part of a grower panel in the “Soil Health” session (~95 attendees), and Yancho and Ben Phillips presented results from the trial at Forgotten Harvest in the “Vine Crops” session (~103 growers). Brainard also discussed results from our research as part of talks in three sessions (Sustainable Horticulture; Soil Health; Vegetables) at the Ontario Fruit and Vegetable Conference in Niagara Falls, ON, (~200 attendees).
Economic Analysis
Enterprise budgets were prepared to estimate costs and returns for each combination of cover and tillage combination, irrespective of L. innocua application. Direct market price ($3.70 per marketable fruit) is the average price of individual cantaloupe from ten Iowa farmers’ markets (USDA-AMS, 2016). Input costs consist of cover crop seed, muskmelon seed, seedling trays, potting mix, drip-tape, plastic mulch, fertilizer, herbicide, insecticide, and fungicide costs. Equipment and ownership costs include farm machinery, greenhouse overhead, irrigation equipment, and land-rent. Land-rent price ($575 per ha) was based on 2016 state averages for Iowa (Plastina et al., 2016). Data was collected on time elapsed during transplanting, fertigation, and weeding events to determine pre-harvest labor costs. To reflect differences in marketable yields between treatments, harvest costs per kg-marketable fruit were adjusted to $0.222 (Ogbuchiekwe et al., 2004). Interest expense was based on a 6 month loan for input costs, equipment and ownership costs, pre-harvest labor, and harvest costs at 5.5% interest. Wholesale and direct market profit was determined by subtracting costs from respective gross revenue.
In 2015 wholesale profit was greatest for the rye-CT ($996/ha.) and was lowest for no-cover crop-ST treatment (-$2,735/ha.; Table 14). The only other system resulting in a positive return for wholesale was rye-vetch-CT ($278/ha.). In 2015, the rye-ST treatment produced the greatest direct market profit ($2,995/ha.). In 2016, no cover-CT resulted in the greatest profit for both wholesale ($1,019/ha.) and direct market ($6,292/ha.), whereas no cover-ST resulted in the lowest profit for both wholesale ($-2,789/ha.) and direct market ($420/ha.; Table). For wholesale, rye-CT and rye-ST both resulted in negative profits of -$720/ha. and -$438/ha., respectively. Though rye-vetch produced positive wholesale profits for both CT and ST, values were much less than for no cover-CT. Between rye and rye-vetch, CT increased direct market profits by an average of $1,784/ha. over ST. Results from this study are mixed as cover crop systems gave higher wholesale and direct market profits in year one but performed poorly as compared to no cover crop treatment in year two. However, benefits from cover crops such as contribution to soil organic matter; reduced erosion, weed pressure, and herbicide application; and enhanced soil biology are difficult to quantify. There is a direct relation between these aspects and economic return but multiple years of cover cropping practice would be needed to get consistent results.
Farmer Adoption
On-farm trials played a critical role in exposing growers to fundamentals of conservation tillage, cover crops, and soil health. A direct outcome of the on-farm trial conducted at Darrell Geisler's farm, is the adoption of roller crimping at his farm. Darrell raises 15-20 acres of pumpkin and has been using strip tillage system for 4-5 years but was terminating cereal rye with herbicide. Results from the on-farm trial at Darrell's farm convinced him of the efficacy of cereal rye termination using roller crimper. Darrell bought a roller crimper that will be used in his pumpkin fields in 2017.
A replicated on-farm trial on roller crimping and strip tillage in butternut squash was conducted at Wade Dooley's farm (Glenwood Farms, Albion, IA) in 2016. Based on results from the study, Wade will be converting all his butternut squash production in 2017 to strip tillage system. He also working with the Iowa State team to fine tune the use of strip-tiller to minimize clogging at the time of strip tilling in the spring.
Impact of this project was observed beyond vegetable crops. Billy Sammons and George Naylor adopted the roller crimping system in their soybean production system. Results from an an on-farm trial conducted in 2016, showed significant cost savings adopting the roller crimper with only slight reduction in yields. Billy Sammons is continuing the study to evaluate the use of roller crimper in terminating a hairy vetch cover crop before corn in 2017.
Educational & Outreach Activities
Participation summary:
Advisory Panel. Two advisory panel meetings were organized. The first one (March 2015) was a video conference which was attended by growers, researchers, graduate students, staff from Leopold Center, and representatives from Iowa Fruit and Vegetable Growers Association and Practical Farmers of Iowa. This advisory panel meeting decided the protocol of experiments and field day activities. The second advisory panel meeting was held face-to-face during the Great Lakes Fruit and Vegetable Expo, Grand Rapids, MI (9 Dec., 2015). The final meeting took place at the Great Lakes Fruit and Vegetable Expo in Grand Rapids, MI in December 2016.
Project Evaluation. An evaluation was conducted in December 2015 by Ms. Arlene Enderton, Project Evaluator, Leopold Center for Sustainable Agriculture. This evaluation was conducted to understand the nature of the collaboration between farmers and researchers for this project and answer the question of whether the discoveries made through this research are impacting farmer behaviors. Four researchers and five farmers were interviewed, with the following results:
Not surprisingly, both farmers and researchers learned new things through the research, including:
o Establishing a strong stand of a cover crop is essential, but may not be sufficient, for good weed suppression.
o Monitoring soil nutrient levels during the crop season is important for obtaining optimal yields.
o A roller crimper is a “good tool to have in the toolbox,” but not a panacea.
o A mitigation step is necessary to eliminate listeria from infected soil.
o Cover crop mulch does not protect melons from contamination from listeria in the soil.
The project brought together individuals that knew of one another, but had never worked together before. Thus, the project is strengthening the network between horticultural researchers and between researchers and farmers. When these social networks are strong, it allows people to learn from one another, avoid duplicating one another’s work, conduct research that is important to farmers, and utilize a feedback loop allowing researchers to know if and how their research is impacting the farming community.
Farmers and researcher described working together in true collaborative fashion. Interviewees described working together to solve problems, designing future trials together and learning from each other. They also collaborated in educating other farmers about their research through field days and conference presentations, reaching an estimated 233 attendees.
Farmer collaborators are implementing new sustainable practices on their farms as a result of collaborating in research. Two farmers have added purchasing a roller crimper to their long term plan, which will keep one from growing vegetables on bare soil and the other from using an herbicide to terminate his cover crop in the spring. A third farmer is going to use oats as a cover crop and mulch on his farm for the first time in 2016.
No collaborating farmer has experienced financial benefit from participating in cover crop research and two experienced reductions in yields, thus losing potential revenue. Yet, four out of five plan to continue experimenting with cover crops on their farm, whether formally a part of research or informally on their own, and expect it to become financially beneficial in the future. The fact that they are continuing to experiment with cover crops despite financial benefit indicates these farmers are making decisions they believe will be beneficial over the long term and are assigning value to the health of their soil.
A follow-up survey was conducted in December 2016 on participants who attended the 2015 Fruit and Vegetable Field day. Survey results show that 50% of attendants planted cover crop for the first time based on the information they gathered at the event.
The only interviewee that mentioned food safety was the researcher who conducted that part of the research, who learned that a cover crop does not protect fruit from contamination with soil borne pathogens. Yet, collaborating farmers saw that crops grown with cover crop mulch appeared cleaner than those grown on bare soil, which may give them false security regarding the food safety of those fruits or vegetables. Therefore, researchers are encouraged to further engage collaborating farmers in the food safety aspect of the research, whether that be through informing them of results or involving them in further research.
In 2016, project convinced two growers: Billy Sammons and George Naylor, Churdan, IA, and Darrell Geisler, Bondurant, IA, invest in roller crimper and eliminate the use of herbicides to terminate cereal rye.
The project facilitated interaction between Dr. Nair and Billy Sammons which led to submission of a successful SARE Farmer Rancher grant in 2016.
An extension publication was developed on commercial melon production which highlighted the use of conservation tillage ( https://store.extension.iastate.edu/Product/Commercial-Melon-Production)
Two peer reviewed publications will soon be submitted to Soil and Tillage Research and HortScience
Project Outcomes
Areas needing additional study
- Weed management within rows is still a challenge in strip tillage and needs to be further investigated.
- Nutrient management in conservation tillage systems is also an area that need to be further evaluated.
- Development of suitable cover crops that can facilitate conservation tillage.