Final report for LNC15-375
Project Information
This project addresses two problems. First, science-based information on the potential return on investment at the farm-level associated with the use of cover crops by Cornbelt farmers is very limited. We provide the first set of partial budgets to evaluate the private economic returns to cover crops in Midwest row crop farming. Second, row crop farming in the Midwest has been increasingly singled out as a major non-point source of nitrate pollution in waterways. We provide an evaluation of the potential impacts of cover crop adoption in nitrate leaching and soil erosion, and the cost saving potential for local water treatment plants. If aggregate cost savings in drinking water treatment plants stemming from reduced nitrate levels and soil erosion are greater than the sum of potential net losses across cover crop adopters, then economic theory suggests that a reallocation of resources from water treatment plants to cover crop users might improve social welfare.
Contrary to our expectations, we found that cover crops typically induce negative net returns in Midwest row crop systems. Using the cover crop biomass for grazing livestock or harvesting it for forage is the most likely source of additional revenue (or cost savings in a crop/livestock system) that would result in positive net returns to cover crops.
Our long term agronomic simulations suggest that using cover crops every year in a corn/soybean rotation for two decades would result in higher average soybean yields, similar corn yields, and lower nitrate leaching and soil erosion than in a comparable crop system without cover crops.
However, the potential of cover crops to save costs to water treatment plants in the Midwest is limited by the relatively small annual operating costs for removing nitrates from untreated water sources. Therefore, and contrary to our expectations, the societal benefits defined in this very narrow way would be insufficient to offset the negative returns to Midwest farmers associated with large scale adoption of cover crops.
Introduction:
Row crop farming in the Midwest has been increasingly singled out as a major non-point source of nitrate pollution in waterways, putting pressure on farmers to adopt conservation practices. One of the promising conservation practices is the use of cover crops, which is known to promote many aspects of soil and water sustainability (Kaspar & Singer, 2011; Chatterjee, 2013). For instance, preliminary results from simulations based on a long-term cover crop study in Iowa suggest that nitrate concentration in tile drainage can be reduced by 54% when a winter rye cover crop is added to corn-soybean acres (Miguez, Basche, and Archontoulis, 2013). Moreover, the Iowa Nutrient Reduction Strategy (2014), Illinois Nutrient Loss Reduction Strategy (2015) and Minnesota Nutrient Reduction Strategy (2014) all list cover crops as one of the practices with the greatest potential for nitrate-N reduction. However, despite the considerable benefits the cropping systems can accrue, adoption of cover crops is very low in the Midwest. Singer, Nusser, and Alf (2007) found that in 2006, only 11% of farmers surveyed in Illinois, Iowa, Minnesota and Indiana had grown a cover crop within the previous five years. An analysis by the National Wildlife Federation of seed dealer data calculated that in 2011, less than 2% of the total cropland acreage in the Mississippi River Basin was planted to cover crops (Bryant, Stockwell, and White, 2013). Rundquist and Carlson (2017), using satellite imagery, report that in 2015 cover crops were incorporated into corn and soybean rotations in 2.3% of Illinois cropland, 7.1% of Indiana cropland and 2.65% of Iowa cropland.
It has long been recognized that lack of familiarity with novel approaches in agriculture can inhibit adoption of conservation practices (Nassauer, et al. 2011). The top cover crop challenges farmers reported across four annual cover crop surveys (Watts and Myers 2013, 2014, 2015, and 2016) were establishment, time or labor required and increased management, and species selection. Farmers’ perceptions that cover crops are costly is also found to be a major barrier to their adoption: 74% of the respondents to the Iowa farm and Rural Life Poll (Arbuckle, 2015) report that potential economic impacts have moderate to very strong influence on changes in their management practices, and 57% agree with the statement that “pressure to make profit margins makes it difficult to invest in conservation practices”. During the 2014 National Conference on Cover Crops and Soil Health, participants highlighted the need for economic analyses to document short- and long-term impacts of cover crops (Sustainable Agriculture Research and Education 2014). Roesch-McNally, et al. (2017) found that despite having successfully planted cover crops, farmers tended to believe that greater economic incentives would be needed to spur more widespread adoption of the practice. The U.S Department of Agriculture Natural Resource Conservation Service (2017) estimated that Iowa farmers planted more than 353,000 acres of cover crops with financial assistance from the Iowa Department of Agriculture and Land Stewardship (through the Iowa Water Quality Initiative, state cost-share, and local watershed project) and federal conservation programs (through the Environmental Quality Incentives Program (EQIP), Conservation Stewardship Program (CSP), and Regional Conservation Partnership Program (RCPP)) in the fall of 2016 – nearly 18 percent more than the previous year.
Science-based information on the potential return on investment at the farm-level associated with the use of cover crops by Midwest farmers is very limited. A handful of papers evaluate the economic impact of cover crops on different cash crops including Reddy (2009) with soybeans in Mississippi; Mahama, et al. (2016) with corn in Kansas; and Roberts, et al. (1998) with no-till corn in Tennessee. However, those studies are based on field experiments set up to evaluate agronomic factors, and the resulting estimates of economic returns might not apply to real farms where management practices do not follow an experimental design. Roberts and Swinton (1995) use actual data from 15 farms growing corn in Michigan in 1994 to explore the relationship between operating costs and crop diversity, and they concluded that cover crops reduce non-point source pollution without significantly reducing net returns. However, the small sample size limits the robustness of the results. Snapp, et al. (2005) provided a summary of the potential benefits and costs from the cover crops, both external and internal to the farm, and report qualitative findings from focus group discussions with eight Michigan potato farmers.
There is a gap in the literature on the actual changes in economic costs and revenues faced by farmers who choose to use cover crops in their corn-soybean rotations in the Midwest. This project addressed the limited availability of science-based economic evaluations of cover crops in Midwest row crop systems by engaging farmers in developing and promoting the use of partial budgets for cover crops. Partial budgets capture the net annual private economic benefit or loss associated with the use of cover crops by identifying and monetizing the differences in management practices across production systems with and without cover crops. We provide a suite of partial budgets for cover crops in Midwest row crop production systems (by cover crop species, location, planting and termination method, tillage practices, cash crop rotation, and years of experience with cover crops) that serve both as benchmarks to current and potential cover crop users, and ground-truthing for agricultural and environmental policy design.
Cover crops may provide soil conservation benefits in the reduction of on-site erosion. Soil erosion represents a cost to land owners, farmers and society as a whole. Duffy (2012) estimated the value of soil erosion to landowners in Iowa at approximately 4.8% of the adjusted 2011 land values.
USDA/NRCS (2009, 2010) studies reported that each ton of soil eroded contained the equivalent of 2.32 pounds of nitrogen and 1 pound of phosphorous. The estimated costs per pound of nitrogen and phosphorous for Iowan farmers in 2015 were $0.47 and $0.48, respectively (Plastina, 2015). One way to value soil loss from the farmer’s perspective is in terms of the value of lost fertilizer, and that results in $1.57 per ton of soil loss. This approach is fraught with shortcomings, and more farm-specific economic valuations for farmers (as the one discussed in this proposal) are needed.
The USDA/NRCS (2009, 2010) studies also estimated a per-ton benefit of $4.93 per acre for improved water quality benefits. Summing the values of soil loss saved for the farmer ($1.57 per ton of soil saved) and water quality benefits ($4.93 per ton of soil saved), participation in the Environmental Quality Incentives Program (EQIP) creates benefits for farmers and society at large, valued at $6.50 per ton of soil. Using the estimated 8.6 tons per acre reduction in soil erosion for land in EQIP, enrollment in EQIP saves soil valued at $55.90 per acre.
Hansen and Ribaudo (2008) estimate the total annual water-related benefits from soil erosion abatement in the Corn Belt at $2.77 per ton of soil saved; and the reduction of municipal water treatment costs due to reduced turbidity at $0.18 per ton of soil saved. These estimates focus on the benefits stemming from reduced sediments in waterways, but exclude the benefits stemming from reduced nitrogen load on tile drainage.
Des Moines Water Works (DMWW), a regional water utility providing drinking water to approximately 500,000 Iowans, reported having incurred approximately $900,000 in treatment costs and lost revenues when nitrate levels in the Raccoon and Des Moines Rivers were record high in 2013; and another $540,000 in operations and additional expenses between December 2014 and March 2015. DMWW (2015) claimed that “record high nitrate concentrations will require future capital investments of $76-183 million to remove the pollutant and provide safe drinking water to a growing central Iowa.” On March 10, 2015, DMWW filed a lawsuit against the Boards of Supervisors of three Iowa counties for the discharge of nitrate pollutants into the Raccoon River, and requested that they be recognized and held accountable as a point source polluter. This lawsuit is currently inactive (Center for Agricultural Law and Taxation, 2017), but served as a starting point for our investigation into the operating costs incurred by water treatment plants in Iowa, Illinois, and Minnesota to remove nitrates and reduce turbidity stemming from agricultural land. If aggregate cost savings in drinking water treatment plants stemming from reduced nitrate levels and soil erosion were greater than the sum of potential net losses across cover crop adopters, then economic theory would suggest that a reallocation of resources from water treatment plants to cover crop adopters might improve social welfare.
Our societal economic evaluation was based on the analysis of existing long-term field trial data collected by Practical Farmers of Iowa and simulations of farm-specific yield and soil erosion estimates using the Agricultural Production System Simulator (APSIM), along with the operating costs incurred by water treatment plants to treat nitrates and turbidity. Due to the costs associated with generating data from numerous field research sites, simulations are used to develop best estimates of the impact of cover crops on nitrate leaching and soil erosion. This method provides much better estimates than off-the-shelf values from the literature alone, and allowed us to avoid large-scale experimentation which is costly and impractical. By providing a science-based report on the potential reduction in soil erosion and nutrient loading stemming from cover crops use, we expect to heighten awareness about the benefits of this practice in sustaining and improving the environmental quality and natural resource base for agriculture.
As expected, our findings indicate that cover crops generate clear environmental benefits (although with regional differences), but contrary to our expectations, individual, regional, and state-wide partial budgets suggest that farmers who use cover crops tend to incur in annual net losses when the operation cannot benefit from livestock feed savings through grazing or harvesting the cover crop biomass for forage. These findings are robust across cover crop species, location, planting and termination method, tillage practices, cash crop rotation, and years of experience with cover crops; and take into account cost-share payments.
The societal economic evaluation, given the annual negative net returns to cover crops and the minor costs (if any) to operate equipment to remove nitrates in water treatment plants, and the small potential influence of cover crops use in reducing water turbidity, suggests that additional cost-share funding for cover crop expansion cannot be justified based solely on water treatment plant savings. However, it must be noted that our approach excludes other environmental benefits (Tang et al. 2018) from the calculation that if included could provide a solid rationale for a more extensive support to cost-share programs.
References
Arbuckle Jr., J.G. (2012). Attitudes towards Cover Crops in Iowa: Benefits and Barriers. Iowa Farm and Rural Life Poll, Iowa State University Extension and Outreach, PMR 1010, March.
Bryant, L., R. Stockwell, and T. White. (2013). Counting Cover Crops. National Wildlife Federation. Available at: https://www.nwf.org/~/media/PDFs/Media%20Center%20-%20Press%20Releases/10-1-13_CountingCoverCrops-FINALlowres.ashx
Carlson, S. and R. Stockwell. (2013). Research priorities for advancing adoption of cover crops in agriculture-intensive regions. Journal of Agriculture, Food Systems and Community Development. Advance online publication. http://dx.doi.org/10.5304/jafscd.2013.034.017
Center for Agricultural Law and Taxation. 2017. Des Moines Water Works Litigation Resources. Available at: https://www.calt.iastate.edu/article/des-moines-water-works-litigation-resources Last accessed Feb 2, 2018.
Chatterjee, A. (2013). North-Central US: Introducing cover crops in the rotation. Crops and Soils, 46(1): 14-15.
Des Moines Water Works (DMWW). (2015). Board of Water Works Trustees Votes to Pursue Lawsuit Against Drainage Districts. Available at: http://www.dmww.com/about-us/announcements/board-of-water-works-trustees-votes-to-pursue-lawsuit-against-drainage-districts.aspx
Duffy, M. (2012). Value of Soil Erosion to the Land Owner. Ag Decision Maker File A1-75. Available at: www.extension.iastate.edu/agdm/crops/html/a1-75.html
Hansen, L. and M. Ribaudo. (2008). “Economic Measures of Soil Conservation Benefits, Regional Values for Policy Assessment,” USDA/ERS, Technical Bulletin 1922.
Kaspar, T., and J. Singer. (2011). The Use of Cover Crops to Manage Soil. In Soil Management: Building a Stable Base for Agriculture. Ed. J.L. Hatfield and T.J. Sauer. Madison: American Society of Agronomy and Soil Science Society of America.
Miguez, F., A. Basche and S. Archontoulis. (2013). Predicting long-term cover crop impacts on soil quality using a cropping systems model. Leopold Center for Sustainable Agriculture. Available at: http://www.leopold.iastate.edu/grants/e2013-19
Nassauer, J., J. Dowdell, Z. Wang, D. McKahn, B. Chilcott, C.Kling and S. Secchi. (2011). Iowa Farmers’ responses to transformative scenarios for Corn Belt agriculture. Journal of Soil and Water Conservation, 66(1): 18A-24A.
Natural Resource Conservation Service (NRCS) of Iowa. (2012). Practices Improving Soil Health Also Reduce Erosion. Available at: http://www.nrcs.usda.gov/wps/portal/nrcs/detail/ia/home/?cid=STELPRDB1097491
Plastina, A. (2015). Estimated Costs of Crop Production in Iowa. Ag Decision Maker File A1-20. Available at: www.extension.iastate.edu/agdm/crops/html/a1-20.html
SARE. (2013). 2012-2013 Cover Crop Survey: June 2013 Survey Analysis. North Central SARE and Conservation Technology Information Center: https://northcentral.sare.org/Educational-Resources/From-the-Field/Cover-Crops-Survey-Analysis
SARE. (2014). “Preliminary draft report from the National Conference on Cover Crops and Soil Health,” Omaha, NE, Feb 17-19.
Singer, J., S. Nusser, and C.Alf. (2007). Are cover crops being used in the US corn belt? Journal of Soil and Water Conservation, 62(5): 353–358.
Tang, C., G.E. Lade, D.A. Keiser, C.L. Kling, Y. Ji, and Y-H. Shr. “Economic Benefits of Nitrogen Reductions in Iowa.” Iowa State University, Center for Agricultural and Rural Development. February 2018. Available at https://www.card.iastate.edu/products/publications/texts/water-quality-report.pdf. Last accessed Feb 27, 2018.
SDA/NRCS. (2009). Summary Report: 2007 National Resources Inventory, Natural Resources Conservation Service, Washington, DC, and Center for Survey Statistics and Methodology, Iowa State University, Ames, Iowa. 123 pages.
USDA/NRCS. (2010). Final Benefit-Cost Analysis for the Environmental Quality Incentives Program (EQIP), Natural Resources Conservation Service, Washington, DC, May 10.
This project had two objectives: to address the limited availability of science-based economic evaluations of cover crops in Midwest row crop systems through partial budgets; and to evaluate the long-term impacts of cover crop adoption in nitrate leaching and soil erosion (and the resulting cost saving potential for local water treatment plants) through long-term agronomic simulations.
An entire suite of partial budgets for cover crops in Midwest row crop production (by cover crop species, location, planting and termination method, tillage practices, cash crop rotation, and years of experience with cover crops) was developed based on: farmer focus groups conducted in Iowa, Illinois, and Minnesota; online survey responses from 11 states; hard-copy survey responses from Iowa; and analyses of existing data from multi-year field trials from Practical Farmer of Iowa.
The Agricultural Production System Simulator (APSIM) model was used to simulate the long-term effects of cover crop adoption on soil erosion and nitrate leaching for a variety of locations, soil types, and alternative management practices. The APSIM model follows the Natural Resource Conservation Services’ Revised Universal Soil Loss Equation (RUSLE2).
Estimating the private and social cost of soil erosion is extremely difficult and subject to a variety of assumptions. We focused on estimating only a portion of all possible social costs of soil erosion, namely those related to increased costs of drinking water treatment due to increased turbidity and/or nitrogen load. We interviewed water treatment plant managers in Iowa, Illinois, and Minnesota, to learn about the technology available to reduce nitrates and turbidity in drinking water caused by cropland soil erosion.
Cooperators
Research
- Hypothesis 1: the net returns to cover crops in Midwest row crop production are positive.
- Hypothesis 2: large scale adoption of cover crops in the Midwest has the potential to generate sufficient cost savings to water treatment plants to justify expanding incentives to farmers to adopt cover crops.
Hypothesis 1: To test the first hypothesis, we use partial budgets.
Partial budgets capture the net annual private economic benefit or loss associated with the use of cover crops by identifying and monetizing the differences in management practices across production systems with and without cover crops.
In 2016, we developed a methodological framework and an accompanying survey questionnaire to create partial budgets for cover crops for different soil types, cover crop mixes, and farm management practices; as well as to implement socio-economic and agronomic impact analyses.
The development of the methodological framework and the survey questionnaire required extensive interaction between team members, farmers, and researchers. Three focus group with experienced cover crops farmers were conducted in Iowa, Minnesota, and Illinois to discuss reasons for adoption, required changes in practices, and resulting changes in costs and revenues. They served as the basis to identify relevant production practices and variables that influence cover crop use. Based on that information and a comprehensive literature review, a first draft of the survey questionnaire was developed. Focus group participants were asked to provide feedback on the survey questionnaire. Farmers were duly compensated for their time and effort.
In January 2017, electronic invitations to participate in the online survey were sent to more than 20,000 farmers, including members of PFI, the Midwest Cover Crops Council, National Wildlife Federations’ Cover Crops Champions Program, and the American Society of Agronomy among other regional associations.
In February 2017, a hard copy version of the same survey questionnaire was implemented in Iowa through the Upper Midwest Office of the National Agricultural Statistical Service (NASS) of the U.S. Department of Agriculture. The stratified random sample selected by NASS consisted of about 1,250 farm operators who reported planting 10 or more acres of cover crops on the 2012 Census of Agriculture, had 50 or more acres of cropland, and reported harvesting one or more field crops. The sample was stratified by small, medium, and large size operations, based on cropland.
Hypothesis 2: to test the second hypothesis, we use a combination of long-term agronomic simulations and interviews with water treatment plant managers.
We used the Agricultural Production Systems Simulator (APSIM) model to understand the effects of cover crops on a number of variables of interest, by simulating the behavior of production and environmental components on cropping systems without cover crops (baseline), and on cropping systems with cover crops (treatment). APSIM is a powerful cropping systems model which can generate estimates on crop growth and soil-water dynamics on a daily basis and can take into account variables at the individual field level. Since our focuses are corn yield and nitrogen loss, we replicated the simulations for 4 nitrogen application rates, 3 soil series, and 13 locations across the Midwest from 1980 to 2014, which include variations in the corresponding weather data.
The simulated variables include corn yield, corn biomass, soil loss, surface runoff, subsurface drainage, and Nitrogen loss through drainage. We calculated nitrate leaching as the concentration of nitrate (No3) loss through drainage in mg/L as nitrate load divided by subsurface drainage times 100.
In an attempt to understand the costs incurred by water treatment plants due to high nitrate concentrations and turbidity in raw water, we conducted three in-person interviews with water treatment plant managers in Des Moines (Iowa), Cedar Rapids (Iowa), and Fairmont (Minnesota), and exchanged emails with water treatment plant managers in Bloomington (Illinois) and the City of Decatur (Illinois). During the in-person interviews, we first presented a summary of our findings from the APSIM model, and then followed a structured questionnaire to guide the discussion and help us discern variable operational costs associated with nitrate removal and turbidity from fixed costs (depreciation of equipment in use) and sunk costs (planned replacement of equipment in use, building of new facilities).
Hypothesis 1:
Results from regional online survey:
More than 300 responses were received from farmers in 11 states, but only 79 responses were used in the calculation of partial budgets, after excluding responses from: (1) farmers who were interested in cover crops but had no hands-on experience; (2) farmers that did not plant cover crops in 2015; (3) farmers that planted cover crops in 2015 on all their acres; (4) farmers that in 2016 planted a different cash crop on acres following cover crops than on acres left fallow during winter; and (5) incomplete responses. This selection process reduces the sample size, but improves the validity of the results by focusing on the changes in costs and revenues associated with cover crop use controlling for the farm manager effect and the macroeconomic conditions prevalent in 2015-2016.
More than two-thirds of the respondents operated farms in Minnesota, Iowa, or Illinois, and nearly 80 percent of the farms were larger than 500 acres in size (Table 1). The single most frequently used cover crop species among survey respondents was cereal rye, but nearly half of the respondents used cover crop mixes composed of three or more cover crop seeds. The most commonly used planting method was drilling, followed by aerial seeding.
The average number of farmers’ years of experience with cover crops was 3.94 years, and the range of responses went from 0.2 to 15 years, with a median of 4 years (Table 2). The average cumulative cover crop acreage per farmer was 1,483 acres, but the median was 540 acres, indicating that while a few large farms are captured in the data, most farms tend to be much smaller than the average.
The mean changes in revenues, costs and profits per acre across partial budgets suggests that cover crops induce net losses in the absence of cost-share programs (Table 3); and only cover crops winterkilled, or terminated with herbicides before planting soybeans tend to break even when cost-share payments are present (Tables 4-7). There is substantial variability in the net returns to cover crops, driven by the difference in yields obtained in fields with and without cover crops, planting costs, and cost-share program payments. For most farmers, cost-share payments are insufficient to cover all private costs associated with cover crop use, but are a critical incentive to support this practice. This study suffers from several limitations related to the self-selection bias of survey respondents, the potential unrepresentativeness of the sample, and the limited number of responses included in the partial budgets. However, it is the first study to attempt to generate partial budgets using field data (instead of experimental plots) from farmers that manage row crop production on acres with cover crops and on acres with no cover crops.
Table 1. Farm characteristics.
|
Factors |
Factor levels |
Count of farms |
Percent in sample |
|
Cover crop mix |
Cereal rye |
34 |
43.04 |
|
Annual Ryegrass |
4 |
5.06 |
|
|
Cereal Rye + Oats |
2 |
2.53 |
|
|
Annual ryegrass + crimson clover + oilseed radish |
5 |
6.33 |
|
|
Annual ryegrass + crimson clover + oilseed radish + rapeseed |
2 |
2.53 |
|
|
Oats + oilseed radish + buckwheat |
1 |
1.27 |
|
|
Crimson clover + oilseed radish |
3 |
3.80 |
|
|
Oats + oilseed radish + turnip |
1 |
1.27 |
|
|
Other |
27 |
34.18 |
|
|
Subtotal |
79 |
100 |
|
|
Size of farms (acres) |
50-99 |
1 |
1.27 |
|
100-199 |
5 |
6.33 |
|
|
200-499 |
11 |
13.92 |
|
|
500-999 |
19 |
24.05 |
|
|
1000-1999 |
20 |
25.32 |
|
|
2000+ |
23 |
29.11 |
|
|
Subtotal |
79 |
100 |
|
|
Farm location |
Illinois |
12 |
15.19 |
|
Iowa |
21 |
26.58 |
|
|
Minnesota |
24 |
30.38 |
|
|
Other states^ |
22 |
27.84 |
|
|
Subtotal |
79 |
100 |
|
|
Planting method |
Drilling |
50 |
56.82 |
|
Aerial |
20 |
22.73 |
|
|
Broadcast |
5 |
5.68 |
|
|
Other |
13 |
14.77 |
|
|
Subtotal |
88 |
100 |
^Other states: North Dakota (11 farms), Indiana (3 farms), Nebraska (2 farms), Ohio (2 farms), Michigan (1 farm), Missouri (1 farm), South Dakota (1 farm), and Wisconsin (1 farm)
Table 2. Farmers’ experience with cover crops
|
Variable |
Mean |
Standard deviation |
Median |
Min |
Max |
|
Number of years planting cover crops |
3.94 |
2.64 |
4 |
1 |
15 |
|
Cumulative cover crop acreage |
1483 |
3783 |
540 |
5 |
30000 |
Table 3. Summary of Results: Mean changes in revenues, costs and profits by calculated partial budget.
|
Sources of changes in net profits |
Cover crops terminated with herbicides followed by corn for grain ($/acre) |
Cover crops terminated with herbicides followed by soybeans ($/acre) |
Cover crops terminated with herbicides in corn-soybean rotation ($/acre) |
Cover crops winterkilled followed by corn or soybeans($/acre) |
|
A. Changes in revenue: |
|
|
|
|
|
1. Cash Crop Yield |
-9.18 |
31.74 |
-1.80 |
-8.25 |
|
2. Cost-share program |
25.33 |
28.07 |
31.14 |
43.83 |
|
Subtotal |
16.16 |
59.81 |
29.34 |
35.58 |
|
B. Changes in costs: |
|
|
|
|
|
1. Cover crop planting |
31.84 |
31.14 |
33.60 |
32.06 |
|
2. Herbicide expenses |
4.05 |
3.82 |
6.94 |
-0.33 |
|
3. Other Costs |
1.02 |
-0.27 |
0.57 |
-2.57 |
|
Subtotal |
36.91 |
34.69 |
41.12 |
29.16 |
|
Net change in profit (A-B): |
-20.76 |
25.13 |
-11.78 |
6.43 |
|
Net change in profit without Cost-Share |
-46.09 |
-2.95 |
-42.92 |
-37.41 |
Table 4. Partial budget for cover crops terminated with herbicides followed by corn for grain:
|
Sources of changes in net profits |
Mean ($/acre) |
1st Quartile ($/acre) |
Median ($/acre) |
3rd Quartile ($/acre) |
N |
|
A. Changes in revenue: |
|
|
|
|
|
|
3. Corn Yield (valued @ $3.35/bushel) |
-9.18 |
-33.50 |
0.00 |
18.36 |
21 |
|
4. Cost-share program |
25.33 |
17.00 |
25.00 |
25.00 |
6 |
|
Subtotal |
16.16 |
-16.50 |
25.00 |
43.36 |
|
|
B. Changes in costs: |
|
|
|
|
|
|
4. Cover crop planting |
31.84 |
39.86 |
29.88 |
23.05 |
|
|
a. Seeds |
16.33 |
21.00 |
14.00 |
12.00 |
21 |
|
b. Planting (excluding seeds) (weighted average of i-ii) |
15.51 |
18.86 |
15.88 |
11.05 |
|
|
i. Custom work |
17.50 |
19.00 |
16.00 |
15.00 |
8 |
|
ii. Non-Custom |
14.44 |
18.78 |
15.82 |
8.95 |
15 |
|
5. Herbicide expenses (weighted average of a-b) |
4.05 |
7.38 |
0.72 |
0.72 |
|
|
a. For farmers that did not apply herbicides before planting corn in baseline |
15.06 |
15.06 |
15.06 |
15.06 |
1 |
|
i. Herbicide cost to terminate cover crops |
9.00 |
9.00 |
9.00 |
9.00 |
1 |
|
ii. Application (Non-custom ) |
6.06 |
6.06 |
6.06 |
6.06 |
1 |
|
b. For farmers that applied herbicides before planting corn in baseline |
3.50 |
7.00 |
0.00 |
0.00 |
20 |
|
i. Additional herbicide costs on top of regular weed control program* |
3.50 |
7.00 |
0.00 |
0.00 |
20 |
|
ii. Labor costs to apply herbicides on top of regular weed control program* |
|
|
|
|
0 |
|
6. Other Costs (sum of a-k) |
1.02 |
1.41 |
0.30 |
0.00 |
|
|
a. Corn seed costs |
0.00 |
0.00 |
0.00 |
0.00 |
21 |
|
b. Corn planting costs (excluding seeds) |
0.71 |
0.00 |
0.00 |
0.00 |
21 |
|
c. Nitrogen costs |
0.26 |
0.00 |
0.00 |
0.00 |
21 |
|
d. P & K costs |
0.00 |
0.00 |
0.00 |
0.00 |
21 |
|
e. Manure costs |
0.00 |
0.00 |
0.00 |
0.00 |
21 |
|
f. Insecticide costs |
0.90 |
0.00 |
0.00 |
0.00 |
21 |
|
g. Fungicide costs |
0.00 |
0.00 |
0.00 |
0.00 |
21 |
|
h. Soil testing costs |
0.00 |
0.00 |
0.00 |
0.00 |
21 |
|
i. Management ($15 per hour) |
1.24 |
1.41 |
0.30 |
0.00 |
15 |
|
j. Cash rent |
-1.43 |
0.00 |
0.00 |
0.00 |
14 |
|
k. Soil erosion repairs |
-0.67 |
0.00 |
0.00 |
0.00 |
21 |
|
Subtotal |
36.91 |
48.65 |
30.90 |
23.77 |
|
|
Net change in profit (A-B): |
-20.76 |
-65.15 |
-5.90 |
19.59 |
|
|
Net change in profit without Cost-Share |
-46.09 |
-82.15 |
-30.90 |
-5.41 |
|
N = number of responses per row; *values for farmers who used herbicide on both cover crop and non-cover acres
Table 5. Partial budget for cover crops terminated with herbicides followed by soybeans:
|
Sources of changes in net profits |
Mean ($/acre) |
1st Quartile ($/acre) |
Median ($/acre) |
3rd Quartile ($/acre) |
N |
|
A. Changes in revenue: |
|
|
|
|
|
|
1. Soybean Yield (valued @ $9.95/bushel) |
31.74 |
0.00 |
4.78 |
57.30 |
34 |
|
2. Cost-share program |
28.07 |
20.00 |
25.00 |
30.00 |
14 |
|
Subtotal |
59.81 |
20.00 |
29.78 |
87.30 |
|
|
B. Changes in costs: |
|
|
|
|
|
|
1. Cover crop planting |
31.14 |
35.95 |
29.77 |
24.82 |
|
|
a. Seeds |
15.11 |
17.00 |
13.50 |
11.00 |
34 |
|
b. Planting (excluding seeds) (weighted average of i-ii) |
16.02 |
18.95 |
16.27 |
13.82 |
|
|
i. Custom work |
13.61 |
15.00 |
14.50 |
11.50 |
14 |
|
ii. Non-Custom |
17.44 |
21.25 |
17.31 |
15.17 |
24 |
|
2. Herbicide expenses (weighted average of a-b) |
3.82 |
5.50 |
4.05 |
2.33 |
|
|
a. For farmers that did not apply herbicides before planting soybeans in baseline |
16.85 |
23.38 |
17.23 |
9.91 |
8 |
|
i. Herbicide cost to terminate cover crops |
11.25 |
16.50 |
11.00 |
6.00 |
8 |
|
ii. Application (weighted average a-b) |
5.60 |
6.88 |
6.23 |
3.91 |
8 |
|
(a) Custom work |
6.17 |
7.00 |
6.50 |
5.00 |
3 |
|
(b) Non-Custom |
5.26 |
6.81 |
6.06 |
3.25 |
5 |
|
b. For farmers that applied herbicides before planting soybeans in baseline |
-0.19 |
0.00 |
0.00 |
0.00 |
26 |
|
i. Additional herbicide costs on top of regular weed control program* |
-0.19 |
0.00 |
0.00 |
0.00 |
26 |
|
ii. Labor costs to apply herbicides on top of regular weed control program* |
|
|
|
|
0 |
|
3. Other Costs (sum of a-k) |
-0.27 |
1.41 |
0.27 |
0.00 |
|
|
a. Soybean seed costs |
0.21 |
0.00 |
0.00 |
0.00 |
34 |
|
b. Soybean planting costs (excluding seeds) |
1.18 |
0.00 |
0.00 |
0.00 |
34 |
|
c. Nitrogen costs |
0.00 |
0.00 |
0.00 |
0.00 |
34 |
|
d. P & K costs |
0.00 |
0.00 |
0.00 |
0.00 |
34 |
|
e. Manure costs |
0.53 |
0.00 |
0.00 |
0.00 |
34 |
|
f. Insecticide costs |
-0.21 |
0.00 |
0.00 |
0.00 |
34 |
|
g. Fungicide costs |
-0.38 |
0.00 |
0.00 |
0.00 |
34 |
|
h. Soil testing costs |
0.00 |
0.00 |
0.00 |
0.00 |
34 |
|
i. Management ($15 per hour) |
0.97 |
1.41 |
0.27 |
0.00 |
24 |
|
j. Cash rent |
-2.50 |
0.00 |
0.00 |
0.00 |
20 |
|
k. Soil erosion repairs |
-0.06 |
0.00 |
0.00 |
0.00 |
34 |
|
Subtotal |
34.69 |
42.86 |
34.09 |
27.15 |
|
|
Net change in profit (A-B): |
25.13 |
-22.86 |
-4.31 |
60.15 |
|
|
Net change in profit without Cost-Share |
-2.95 |
-42.86 |
-29.31 |
30.15 |
|
N = number of responses; *values for farmers who used herbicide on both cover crop and non-cover acres
Table 6. Annual average partial budget for cover crops terminated with herbicides in corn-soybean rotation:
|
Sources of changes in net profits |
Mean ($/acre) |
1st Quartile ($/acre) |
Median ($/acre) |
3rd Quartile ($/acre) |
N |
|
A. Changes in revenue: |
|
|
|
|
|
|
1. Cash crop yield (corn @ $3.35/bu; soy @ $9.95/bu) |
-1.80 |
-26.19 |
0.81 |
24.06 |
55 |
|
2. Cost-share program |
31.14 |
21.31 |
29.76 |
31.55 |
55 |
|
Subtotal |
29.34 |
-4.88 |
30.57 |
55.61 |
|
|
B. Changes in costs: |
|
|
|
|
|
|
1. Cover crop planting |
33.60 |
40.79 |
31.72 |
25.31 |
|
|
a. Seeds |
16.81 |
20.63 |
14.63 |
12.31 |
55 |
|
b. Planting (excluding seeds) (weighted average of i-ii) |
16.80 |
20.16 |
17.09 |
13.01 |
|
|
i. Custom work |
17.38 |
18.96 |
16.70 |
14.83 |
22 |
|
ii. Non-Custom |
16.47 |
20.84 |
17.31 |
11.98 |
39 |
|
2. Herbicide expenses (weighted average of a-b) |
6.94 |
9.04 |
5.36 |
4.96 |
|
|
a. For farmers that did not apply herbicides before planting cash crop in baseline |
32.58 |
34.65 |
32.78 |
30.31 |
9 |
|
i. Herbicide cost to terminate cover crops |
23.41 |
24.89 |
23.34 |
21.94 |
9 |
|
ii. Application (weighted average a-b) |
9.17 |
9.76 |
9.44 |
8.38 |
8 |
|
(a) Custom work |
6.17 |
7.00 |
6.50 |
5.00 |
3 |
|
(b) Non-Custom |
10.67 |
11.13 |
10.91 |
10.07 |
6 |
|
b. For farmers that applied herbicides before planting cash crop in baseline |
1.93 |
4.03 |
0.00 |
0.00 |
46 |
|
i. Additional herbicide costs on top of regular weed control program* |
1.93 |
4.03 |
0.00 |
0.00 |
46 |
|
ii. Labor costs to apply herbicides on top of regular weed control program* |
|
|
|
|
0 |
|
3. Other Costs (sum of a-k) |
0.57 |
1.49 |
0.30 |
0.00 |
|
|
a. Cash crop seed costs |
0.08 |
0.00 |
0.00 |
0.00 |
55 |
|
b. Cash crop planting costs (excluding seeds) |
0.94 |
0.00 |
0.00 |
0.00 |
55 |
|
c. Nitrogen costs |
0.17 |
0.00 |
0.00 |
0.00 |
55 |
|
d. P & K costs |
0.00 |
0.00 |
0.00 |
0.00 |
55 |
|
e. Manure costs |
0.21 |
0.00 |
0.00 |
0.00 |
55 |
|
f. Insecticide costs |
0.51 |
0.00 |
0.00 |
0.00 |
55 |
|
g. Fungicide costs |
-0.15 |
0.00 |
0.00 |
0.00 |
55 |
|
h. Soil testing costs |
0.00 |
0.00 |
0.00 |
0.00 |
55 |
|
i. Management ($15 per hour) |
1.20 |
1.49 |
0.30 |
0.00 |
39 |
|
j. Cash rent |
-1.93 |
0.00 |
0.00 |
0.00 |
34 |
|
k. Soil erosion repairs |
-0.46 |
0.00 |
0.00 |
0.00 |
55 |
|
Subtotal |
41.12 |
51.31 |
37.38 |
30.27 |
|
|
Net change in profit (A-B): |
-11.78 |
-56.19 |
-6.81 |
25.33 |
|
|
Net change in profit without Cost-Share |
-42.92 |
-77.50 |
-36.58 |
-6.22 |
|
N = number of responses; *values for farmers who used herbicide on both cover crop and non-cover acres
Table 7. Partial budget for cover crops winterkilled followed by corn or soybeans:
|
Sources of changes in net profits |
Mean ($/acre) |
1st Quartile ($/acre) |
Median ($/acre) |
3rd Quartile ($/acre) |
N |
|
A. Changes in revenue: |
|
|
|
|
|
|
1. Cash crop yield (corn @ $3.35/bu; soy @ $9.95/bu) |
-8.25 |
-18.00 |
0.00 |
0.00 |
24 |
|
2. Cost-share program |
43.83 |
40.00 |
46.50 |
48.00 |
6 |
|
Subtotal |
35.58 |
22.00 |
46.50 |
48.00 |
|
|
B. Changes in costs: |
|
|
|
|
|
|
1. Cover crop planting |
32.06 |
42.43 |
29.15 |
19.69 |
|
|
a. Seeds |
18.23 |
23.50 |
15.50 |
10.00 |
24 |
|
b. Planting (excluding seeds) (weighted average of i-ii) |
13.83 |
18.93 |
13.65 |
9.69 |
|
|
i. Custom work |
9.50 |
11.50 |
10.00 |
7.50 |
8 |
|
ii. Non-Custom |
16.31 |
23.17 |
15.73 |
10.94 |
14 |
|
2. Herbicide expenses |
-0.33 |
0.00 |
0.00 |
0.00 |
|
|
a. Additional herbicide costs on top of regular weed control program* |
-0.33 |
0.00 |
0.00 |
0.00 |
24 |
|
b. Labor costs to apply herbicides on top of regular weed control program* |
|
|
|
|
0 |
|
3. Other Costs (sum of a-k) |
-2.57 |
0.97 |
0.30 |
0.00 |
|
|
a. Cash crop seed costs |
-0.63 |
0.00 |
0.00 |
0.00 |
24 |
|
b. Cash crop planting costs (excluding seeds) |
0.00 |
0.00 |
0.00 |
0.00 |
24 |
|
c. Nitrogen costs |
-2.54 |
0.00 |
0.00 |
0.00 |
24 |
|
d. P & K costs |
-0.25 |
0.00 |
0.00 |
0.00 |
24 |
|
e. Manure costs |
1.25 |
0.00 |
0.00 |
0.00 |
24 |
|
f. Insecticide costs |
0.00 |
0.00 |
0.00 |
0.00 |
24 |
|
g. Fungicide costs |
0.00 |
0.00 |
0.00 |
0.00 |
24 |
|
h. Soil testing costs |
0.00 |
0.00 |
0.00 |
0.00 |
24 |
|
i. Management ($15 per hour) |
0.70 |
0.97 |
0.30 |
0.00 |
21 |
|
j. Cash rent |
-1.11 |
0.00 |
0.00 |
0.00 |
9 |
|
k. Soil erosion repairs |
0.00 |
0.00 |
0.00 |
0.00 |
24 |
|
Subtotal |
29.16 |
43.39 |
29.45 |
19.69 |
|
|
Net change in profit (A-B): |
6.43 |
-21.39 |
17.05 |
28.31 |
|
|
Net change in profit without Cost-Share |
-37.41 |
-61.39 |
-29.45 |
-19.69 |
|
N = number of responses; *values for farmers who used herbicide on both cover crop and non-cover acres; responses from 11 farms that planted corn, and 13 farms that planted soybean in 2016.
Results from hard copy survey in Iowa:
A total of 674 responses were received, of which 440 reported planting cover crops in 2015. After filtering out all responses according to the criteria 1-5 described in the previous paragraph, partial budgets were developed for different combinations of: cover crop mix and following cash crop, crop reporting district (location), cover crop planting and termination method, tillage method, and years of experience with cover crops.
The average area planted to cover crops in 2015 by our survey respondents amounted to 268 acres (Table 8). Respondents had, on average, 7.9 years of experience with cover crops. However, half (two-thirds) of them had 5 (8) years of experience or less. The cumulative number of cover crop acres planted through all the years of experience averaged 870 acres per operator.
Eighty-three percent of the respondents operated farms between 200 and 2,000 acres in size, and the median farm size was 500-999 acres (Table 9). The most frequently planted cover crop among our survey respondents was cereal rye (typically by itself, and to a lesser extent mixed with oats), followed in a distant second place by annual ryegrass. The most extensively used planting method was drilling (76%), followed by aerial and broadcast (4%) seeding (19% and 4%, respectively). Two-thirds of the respondents used herbicides to terminate cover crops, and the other third chose tillage, mowing, or winter kill as termination method. Three in 5 respondents planted corn for grain or seed following cover crops, while the other cover croppers typically planted soybeans in 2016.
The average calculated changes in net returns stemming from the use of cover crops terminated with herbicides, across all cover crops, all planting methods, and all tillage methods were positive: $8.59 per acre for cover crops followed by corn (Table 10) and $14.25 per acre for cover crops followed by soybeans (Table 11). However, those averages include in their calculations the cost savings in livestock feed from farmers that use cover crops for grazing or forage: an average of $35 per acre for cover crops followed by corn across 9 farms, and $32.54 per acre for cover crops followed by soybeans across 13 farms. When those cost savings in livestock feed are excluded from the calculations, the resulting changes in net returns average losses of $26.41 for cover crops followed by corn, and $18.29 for cover crops followed by soybeans. Furthermore, the net returns to cover crops in the absence of both savings on livestock feed and cost-share payments average net losses of $48.82 for cover crops followed by corn, and $38.42 for cover crops followed by soybeans. Finally, the average reduction in yields following cover crops (comparing yields across a field with cover crops and another similar field without cover crops operated by the same farmer) was 2 bushels for corn, and 0.1 bushel for soybeans. Although the median yield differences were null in Tables 3 and 4, the same qualitative results are derived when analyzing median changes instead of average changes in net returns due to cover crops use.
The major cost drivers in Tables 10 and 11 are planting costs, which add up to $33 per acre, composed in nearly equal parts by seed costs and planting costs (excluding seeds). It is interesting to note that the reported rates paid to hire custom planting of cover crop seeds come very close, on average, to the calculated costs of using farmers’ own planting machinery based on Cartwright and Kirwan (2014).
Termination costs depend on whether the operator sprays all his or her acres with herbicides as part of the pre-plant treatment. About 80% of the farms in Tables 10 and 11 applied a pre-plant burn down across all their acres, and their extra herbicide costs (on top of the typical pre-plan burn down) to terminate cover crops averaged less than $1 per acre. The reported extra termination costs for these farmers were related to higher concentrations of active ingredients, or in some cases an extra field pass when the first herbicide application was not effective to fully terminate the cover crop. However, note that the median extra termination costs for this group of farmers are null in Tables 3 and 4.
For the minority of farmers that do not apply herbicides as part of their pre-plant program, termination of cover crops with herbicides represent a major additional expense: $16.82 for cover crops followed by corn, and $18.54 for cover crops followed by soybeans, on average. Furthermore, for the subset of farmers that custom hire the termination of cover crops with herbicides, the average custom rate paid is nearly twice higher than the cost of using their own sprayers.
Finally, while farmers who planted cover crops followed by corn experienced, on average, small savings in nitrogen, manure, insecticide, fungicide, soil testing, soil repair costs, and cash rents due to cover crops use, some farmers experienced large cost savings and others experienced increases in those categories (see the ranges in Tables 10). However, the median change in cost in each and all “other costs” category was null. Similarly, the average changes in other costs for operators who planted cover crops followed by soybeans were small, and the median changes were null (Table 11).
In order to explore the relationship between years of experience with cover crops and net returns, we developed partial budgets across all cover crop species terminated with herbicides and followed by corn production, across all planting methods, and all tillage methods for operators with: (a) up to 3 years of experience (Table 12); (b) 4 to 9 years of experience (Table 13); and (c) 10 or more years of experience (Table 14). While the average yield drag on corn production due to cover crops was smaller for farmers in (b) than for farmers in (a) (-0.1 bushels versus -5 bushels); and farmers in (c) experienced an average 0.5 yield increase due to cover crops, the net returns to cover crops excluding savings in livestock feed due to grazing or forage were negative for all experience levels. The average changes in net returns due to cover crops use followed by corn for operators in (a), (b), and (c) amounted, respectively, to -$37.12 (Table 12), -$18.59 (Table 13), and -$14.97 (Table 14).
A comparable analysis for cover crops followed by soybeans resulted in similar qualitative and quantitative results. The average changes in net returns due to cover crops use followed by soybeans excluding savings in livestock feed due to grazing or forage for operators with up to 3 years of experience, with 4 to 9 years of experience, and with 10 or more years of experience amounted, respectively, to -$24.36 (Table 15), -$11.70 (Table 16), and -$21.04 (Table 17). An important difference between Tables 8-10 and Tables 5-7 from the agronomic (although not from the economic) standpoint is that while the average corn yield drag from cover crops declined with experience, the opposite trend was observed in the average soybean yield drag from cover crops. The average change in soybean yields due to cover crops use was 0.43 bushels for farmers with up to 3 years of experience, 0.25 bushels for farmers with 4 to 9 years of experience, and -0.09 bushels for farmers with 10 or more years of experience.
In order to explore the relationship between tillage practices and net returns to cover crops use, we developed partial budgets for cereal rye terminated with herbicides and followed by corn, across all planting methods, for no-till (Table 18), reduced-till (Table 19), and conventional- or vertical-till (Table 20) operations. The number of respondents using no-till practices is almost twice the number of respondents using reduced-till, conventional- or vertical-till.
While the three partial budgets have similar average planting costs for cereal rye, they differ in the average costs to terminate cereal rye. Those differences are driven by the extra labor hours required to terminate cereal rye with herbicides among farmers that apply a pre-plant burn down in all acres; and the custom rate paid by farmers that hire custom sprayers to terminate the cereal rye. The median (which is less affected by extreme values than the average) change in total costs in the no-till budget is similar to the change in total costs in the reduced-till budget ($34.83 and $33.85, respectively), but lower than in the conventional-till budget ($46.26). Furthermore, the median cost-share payments received by reduced-till farmers ($27.00) were higher than the corresponding payments received by no-till, and conventional-till farmers ($20.00 and $17.50, respectively). Consequently, the net losses from cereal rye use (excluding savings in livestock feed from grazing or forage) were the smallest for reduced-till operations (-$6.80), followed by no-till operations (-$14.83), and conventional-till operations (-$28.76).
The net returns for alternative planting methods (drilling and aerial seeding) for cover crops were calculated across all cover crop species for no-till operations. The average changes in costs due to cover crops use followed by corn were similar across planting methods: $40.55 for operations using drills (Table 21), and $42.59 for operations using aerial seeding (Table 22). In both partial budgets, the average change in yields due to cover crop use was negative (around 3 bushels per acre), and nearly one third of the operators received cost-share payments. The average net losses due to cover crops use followed by corn (excluding savings in livestock feed from grazing or forage) was slightly lower in operations drilling cover crop seeds (-$26.99) than in operations using aerial seeding (-$34.53).
The average changes in costs due to cover crops use followed by soybeans were similar across planting methods: $37.45 for operations using drills (Table 23), and $39.12 for operations using aerial seeding (Table 24). Contrary to the changes in corn yields observed in Tables 14 and 15, average changes in soybean yields are positive for both panting methods: 0.28 extra bushels in fields where cover crops were planted with drills (Table 23), and 0.50 extra bushels in fields aerial seeded (Table 24). A larger proportion of farmers using aerial seeding received cost-share payments than of farmers using drills (65% versus 38%), but the average payments were similar: $18.55 (Table 24) and $16.70 (Table 23). The average net losses due to cover crops use followed by soybeans (excluding savings in livestock feed from grazing or forage) were slightly lower in operations using aerial seeding (-$15.58, Table 24) than in operations using drills (-$17.95, Table 23). Note that the calculated net losses from cover crops followed by soybeans are, on average, smaller than the net losses from cover crops followed by corn.
The net returns for alternative termination methods (herbicide application and tillage) for cover crops planted using drills and followed by corn were calculated across all cover crop species for operations using conventional- or vertical-till. In order to avoid large biases in the average measures caused by extreme values among few observations, the following discussion focuses only on median (instead of average) values. The median cost of planting cover crops using drill planters is slightly higher for operations that used herbicide termination than for operations that used tillage to terminate cover crops: $33.50 (Table 25) and $28.51 (Table 26), respectively. While the median extra cost to terminate cover crops was null for those farmers that applied the termination method to all their acreage (with and without cover crops) as part of the spring pre-plant soil conditioning, it amounted to $15.54 for farmers that only applied herbicides in spring to their acres with cover crops (Table 25). The resulting net losses due to cover crops (excluding savings in livestock feed from grazing or forage) were slightly lower for operations using tillage than for operations using herbicides as the selected termination method: -$13.01 (Table 26) and -$20.61 (Table 25).
This study suffers from several limitations related to the self-selection bias of survey respondents and the potential unrepresentativeness of the sample. However, it provides a variety of partial budgets based on field data (instead of experimental plots) from farmers that manage row crop production on acres with cover crops and on acres with no cover crops, that can be used as benchmarks for current and potential cover croppers, as well as ground-truth references for agricultural and conservation policy design.
Table 8. Characteristics of operators surveyed
|
Variable |
Mean |
Median |
Range |
#Obs. |
|
Acres of cover crops planted in fall 2015 |
268 |
80 |
[5, 7500] |
227 |
|
Total number of acres planted to cover crops since starting using cover crops |
870 |
360 |
[4, 10000] |
230 |
|
Number of years of experience with cover crops |
7.9 |
6 |
[1, 45] |
233 |
Table 9. Survey responses by farm size, cover crop species, planting method, termination method, and following cash crop
|
Farm Characteristic |
#Obs. |
Percent |
|
Farm Size |
|
|
|
1 to 49 acres |
1 |
0.43 |
|
50-99 acres |
1 |
0.43 |
|
100-199 acres |
14 |
6.03 |
|
200-499 acres |
54 |
23.28 |
|
500-999 acres |
76 |
32.76 |
|
1000-1999 acres |
63 |
27.16 |
|
2000 acres or more |
23 |
9.91 |
|
Total |
232 |
100 |
|
Cover crop species |
|
|
|
Cereal Rye |
164 |
71.00 |
|
Cereal Rye + Oats |
11 |
4.76 |
|
Annual Ryegrass |
12 |
5.19 |
|
Annual ryegrass + crimson clover + oilseed radish |
3 |
1.30 |
|
Annual ryegrass + crimson clover + oilseed radish + rapeseed |
2 |
0.87 |
|
Oats + oilseed radish + buckwheat |
1 |
0.43 |
|
Oats + oilseed radish + turnip |
4 |
1.73 |
|
Other |
34 |
14.72 |
|
Total |
231 |
100 |
|
Planting method |
|
|
|
Aerial Seeding |
40 |
18.87 |
|
Broadcast Seeding |
9 |
4.25 |
|
Drilling |
161 |
75.94 |
|
Other |
2 |
0.94 |
|
Total |
212 |
100 |
|
Termination method |
|
|
|
Herbicide |
154 |
66.38 |
|
Tillage |
36 |
15.52 |
|
Mowing |
21 |
9.05 |
|
Winter kill |
18 |
7.76 |
|
Other |
3 |
1.29 |
|
Total |
232 |
100 |
|
Following cash crop |
|
|
|
Corn for grain or seed |
135 |
58.70 |
|
Soybeans |
87 |
37.83 |
|
Oats for grain |
1 |
0.43 |
|
Other |
7 |
3.04 |
|
Total |
230 |
100 |
|
Hired custom planting of cover crops |
|
|
|
Yes for all |
69 |
30 |
|
Yes for some |
24 |
10.43 |
|
No |
137 |
59.57 |
|
Total |
230 |
100 |
Table 10. Overall changes in net returns due to cover crop use followed by corn, for all cover crop species, all planting methods, terminated with herbicides.
|
Sources of changes in net profits |
Mean |
Median |
Range |
#Obs. |
|
$/acre |
||||
|
A) Changes in Revenues |
||||
|
1. Cost-share program |
22.41 |
20.00 |
[5; 80] |
39 |
|
2. Value of change in following corn yield* |
-8.06 |
0.00 |
[-108; 80] |
69 |
|
3. Savings or extra revenue from grazing or harvesting cover crop for forage |
35.00 |
22.00 |
[3; 100] |
9 |
|
Subtotal A. Changes in Revenue |
49.35 |
42.00 |
||
|
B) Changes in Costs |
||||
|
1. Cover Crop Planting |
||||
|
a. Seeds |
17.70 |
16.00 |
[5; 47] |
76 |
|
b. Planting (excluding seeds). Weighted average of custom and non-custom work. |
14.82 |
16.15 |
||
|
i. Custom work |
14.39 |
15.00 |
[4; 30] |
41 |
|
ii. Non-Custom |
15.14 |
16.99 |
[2.42; 25.33] |
56 |
|
Subtotal B.1 |
32.52 |
32.15 |
||
|
2. Cover Crop Termination |
||||
|
a. Extra expenses for farmers that applied herbicides to all acres (with and without cover crops) |
8.07 |
0.00 |
68 |
|
|
i. Extra herbicide cost on top of regular weed control program |
0.56 |
0.00 |
[0; 17] |
68 |
|
ii. Extra labor costs to apply herbicides on top of regular weed control program^ |
5.54 |
0.00 |
[0; 130] |
68 |
|
iii. Other termination expenses |
1.97 |
0.00 |
[0; 40] |
68 |
|
b. Extra expenses for farmers that did not apply herbicides before planting corn in acres without cover crops. |
16.82 |
15.54 |
|
16 |
|
i. Herbicide cost to terminate cover crops |
9.50 |
8.00 |
[4; 24] |
16 |
|
ii. Herbicide application cost. Weighted average of custom and non-custom work. |
7.32 |
7.54 |
[3.06; 15.4] |
|
|
1. Custom Work |
14.20 |
14.00 |
[6; 30] |
5 |
|
2. Non-Custom |
5.02 |
5.38 |
[2.08; 10.53] |
15 |
|
Subtotal B.2 (weighted average of B.2.a and B.2.b) |
9.74 |
2.96 |
||
|
3. Changes in other costs~ |
||||
|
a. Nitrogen Costs |
-0.18 |
0.00 |
[-20; 5] |
83 |
|
b. Manure Costs |
-0.09 |
0.00 |
[-10; 2.5] |
83 |
|
c. Insecticide Costs |
-0.11 |
0.00 |
[-12; 3] |
83 |
|
d. Fungicide Costs |
-0.13 |
0.00 |
[-14; 3.5] |
83 |
|
e. Soil Testing Costs |
-0.14 |
0.00 |
[-16; 4] |
83 |
|
f. Costs to Repair Soil Erosion |
-0.16 |
0.00 |
[-18; 4.5] |
83 |
|
g. Change in Cash Rent due to Cover Crops Use |
-0.68 |
0.00 |
[-20; 0] |
44 |
|
Subtotal B.3 |
-1.50 |
0.00 |
|
|
|
Subtotal B. Changes in Costs |
40.76 |
35.11 |
|
|
|
C. Net Change in Profits (C=A-B) |
8.59 |
6.89 |
|
|
|
C.1. Net Change in Profits excluding grazing/forage (C.1 = C - A.3) |
-26.41 |
-15.11 |
|
|
* Reported changes in corn yields following cover crops due to cover crops use ranged from -27 to 20 bushels per acre, with an average loss of 2 bushels. The median farmer reported no change in corn yields.
^ Reported changes in labor hours per acre to terminate cover crops with herbicides ranged from 0 to 10 hours, and averaged 0.43 hours. The median farmer reported no extra labor to terminate cover crops .
~ No respondent indicated changes in cash crop seed costs, cash crop planting costs (excluding seeds), P and K costs, or management time due to cover crops use.
Table 11. Overall changes in net returns due to cover crop use followed by soybeans, for all cover crop species, all planting methods, terminated with herbicides.
|
Sources of changes in net profits |
Mean |
Median |
Range |
#Obs. |
|
$/acre |
||||
|
A) Changes in Revenues |
||||
|
1. Cost-share program |
20.13 |
15.00 |
[7; 46] |
23 |
|
2. Value of change in following soybean yield* |
-1.07 |
0.00 |
[-100; 50] |
56 |
|
3. Savings or extra revenue from grazing or harvesting cover crop for forage |
32.54 |
20.00 |
[2; 150] |
13 |
|
Subtotal A. Changes in Revenue |
51.60 |
35.00 |
||
|
B) Changes in Costs |
||||
|
1. Cover Crop Planting |
||||
|
a. Seeds |
16.34 |
15.00 |
[2; 50] |
50 |
|
b. Planting (excluding seeds). Weighted average of custom and non-custom work. |
16.47 |
16.95 |
||
|
i. Custom work |
16.52 |
16.00 |
[6; 32] |
21 |
|
ii. Non-Custom |
16.45 |
17.47 |
[3.59; 24.17] |
38 |
|
Subtotal B.1 |
32.81 |
31.95 |
||
|
2. Cover Crop Termination |
||||
|
a. Extra expenses for farmers that applied herbicides to all acres (with and without cover crops)^ |
2.63 |
0.00 |
|
49 |
|
i. Extra herbicide cost on top of regular weed control program |
0.29 |
0.00 |
[-11; 12] |
49 |
|
ii. Extra labor costs to apply herbicides on top of regular weed control program |
1.33 |
0.00 |
[0; 39] |
49 |
|
iii. Other termination expenses |
1.02 |
0.00 |
[0; 20] |
49 |
|
b. Extra expenses for farmers that did not apply herbicides before planting soybean in acres without cover crops. |
18.54 |
14.55 |
|
9 |
|
i. Herbicide cost to terminate cover crops |
11.56 |
10.00 |
[2; 30] |
9 |
|
ii. Herbicide application cost. Weighted average of custom and non-custom work. |
6.99 |
4.55 |
[4.16; 13.53] |
|
|
1. Custom Work |
13.67 |
8.00 |
[8; 25] |
3 |
|
2. Non-Custom |
4.48 |
3.25 |
[2.72; 9.23] |
8 |
|
Subtotal B.2 (weighted average of B.2.a and B.2.b) |
5.10 |
2.26 |
|
|
|
3. Changes in other costs~ |
||||
|
a. Cash crop seed costs |
-0.18 |
0.00 |
[-11; 0] |
61 |
|
b. Costs to Repair Soil Erosion |
-0.02 |
0.00 |
[-1; 0] |
61 |
|
c. Change in Cash Rent due to Cover Crops Use |
-0.37 |
0.00 |
[-10; 0] |
27 |
|
Subtotal B.3 |
-0.57 |
0.00 |
|
|
|
Subtotal B. Changes in Costs |
37.34 |
34.21 |
|
|
|
C. Net Change in Profits (C=A-B) |
14.25 |
0.79 |
|
|
|
C.1. Net Change in Profits excluding grazing/forage (C.1 = C - A.3) |
-18.29 |
-19.21 |
|
|
* Reported changes in soybean yields following cover crops due to cover crops use ranged from -10 to 5 bushels per acre, with an average loss of 0.11 bushels. The median farmer reported no change in soybean yields.
^ Reported changes in labor hours per acre to terminate cover crops with herbicides ranged from 0 to 3 hours, and averaged 0.10 hours. The median farmer reported no extra labor to terminate cover crops.
~ No respondent indicated changes in soybean planting costs (excluding seeds); N, P or K costs; manure, insecticide, fungicide, or soil testing costs; or management time due to cover crops use.
Table 12. Changes in net returns due to cover crop use followed by corn, for all cover crop species, all planting methods, terminated with herbicides. Farmers with up to 3 years of experience with cover crops.
|
Sources of changes in net profits |
Mean |
Median |
Range |
#Obs. |
|
$/acre |
||||
|
A) Changes in Revenues |
||||
|
1. Cost-share program |
20.83 |
20.00 |
[15; 30] |
6 |
|
2. Value of change in following corn yield* |
-20.00 |
-20.00 |
[-60; 0] |
9 |
|
3. Savings or extra revenue from grazing or harvesting cover crop for forage |
80.00 |
80.00 |
[80; 80] |
1 |
|
Subtotal A. Changes in Revenue |
80.83 |
80.00 |
||
|
B) Changes in Costs |
||||
|
1. Cover Crop Planting |
||||
|
a. Seeds |
15.60 |
15.00 |
[8; 30] |
10 |
|
b. Planting (excluding seeds). Weighted average of custom and non-custom work. |
15.09 |
14.20 |
||
|
i. Custom work |
18.50 |
15.50 |
[13; 30] |
4 |
|
ii. Non-Custom |
13.14 |
13.46 |
[9.79; 15.82] |
7 |
|
Subtotal B.1 |
30.69 |
29.20 |
||
|
2. Cover Crop Termination |
||||
|
a. Extra expenses for farmers that applied herbicides to all acres (with and without cover crops) |
5.00 |
0.00 |
7 |
|
|
i. Extra herbicide cost on top of regular weed control program |
0.00 |
0.00 |
[0; 0] |
7 |
|
ii. Extra labor costs to apply herbicides on top of regular weed control program |
0.00 |
0.00 |
[0; 0] |
7 |
|
iii. Other termination expenses |
5.00 |
0.00 |
[0; 20] |
7 |
|
b. Extra expenses for farmers that did not apply herbicides before planting corn in acres without cover crops. |
15.17 |
15.54 |
|
2 |
|
i. Herbicide cost to terminate cover crops |
8.00 |
8.00 |
[8; 8] |
2 |
|
ii. Herbicide application cost. Weighted average of custom and non-custom work. |
7.17 |
7.54 |
[5.06; 8.91] |
|
|
1. Custom Work |
14.00 |
14.00 |
[14; 14] |
1 |
|
2. Non-Custom |
4.89 |
5.38 |
[2.08; 7.21] |
3 |
|
Subtotal B.2 (weighted average of B.2.a and B.2.b) |
7.26 |
3.45 |
||
|
3. Changes in other costs~ |
||||
|
a. Nitrogen Costs |
0.00 |
0.00 |
[0; 0] |
11 |
|
b. Change in Cash Rent due to Cover Crops Use |
0.00 |
0.00 |
[0; 0] |
4 |
|
Subtotal B.3 |
0.00 |
0.00 |
|
|
|
Subtotal B. Changes in Costs |
37.95 |
32.65 |
|
|
|
C. Net Change in Profits (C=A-B) |
42.88 |
47.35 |
|
|
|
C.1. Net Change in Profits excluding grazing/forage (C.1 = C - A.3) |
-37.12 |
-32.65 |
|
|
* Reported changes in corn yields following cover crops due to cover crops use ranged from -15 to 0 bushels per acre, with an average and median loss of 5 bushels.
~ No respondent indicated changes in corn planting costs; N, P, K, manure, insecticide, fungicide, or soil testing costs; or changes in costs to repair soil erosion; or changes in management time due to cover crops use.
Table 13. Changes in net returns due to cover crop use followed by corn, for all cover crop species, all planting methods, terminated with herbicides. Farmers with 4 to 9 years of experience with cover crops.
|
Sources of changes in net profits |
Mean |
Median |
Range |
#Obs. |
|
$/acre |
||||
|
A) Changes in Revenues |
||||
|
1. Cost-share program |
24.60 |
20.00 |
[7; 80] |
20 |
|
2. Value of change in following corn yield* |
-0.41 |
0.00 |
[-32; 28] |
29 |
|
3. Savings or extra revenue from grazing or harvesting cover crop for forage |
35.00 |
20.00 |
[10; 100] |
5 |
|
Subtotal A. Changes in Revenue |
59.19 |
40.00 |
||
|
B) Changes in Costs |
||||
|
1. Cover Crop Planting |
||||
|
a. Seeds |
16.85 |
16.00 |
[9; 25] |
41 |
|
b. Planting (excluding seeds). Weighted average of custom and non-custom work. |
14.56 |
16.11 |
||
|
i. Custom work |
13.92 |
15.00 |
[5; 25] |
24 |
|
ii. Non-Custom |
15.07 |
16.99 |
[2.42; 25.33] |
30 |
|
Subtotal B.1 |
31.41 |
32.11 |
||
|
2. Cover Crop Termination |
||||
|
a. Extra expenses for farmers that applied herbicides to all acres (with and without cover crops) |
10.79 |
0.00 |
34 |
|
|
i. Extra herbicide cost on top of regular weed control program |
0.97 |
0.00 |
[0; 17] |
34 |
|
ii. Extra labor costs to apply herbicides on top of regular weed control program^ |
7.65 |
0.00 |
[0; 130] |
34 |
|
iii. Other termination expenses |
2.18 |
0.00 |
[0; 40] |
34 |
|
b. Extra expenses for farmers that did not apply herbicides before planting corn in acres without cover crops. |
17.42 |
14.82 |
|
11 |
|
i. Herbicide cost to terminate cover crops |
9.27 |
8.00 |
[4; 24] |
11 |
|
ii. Herbicide application cost. Weighted average of custom and non-custom work. |
8.15 |
6.82 |
[3.79; 15.4] |
|
|
1. Custom Work |
17.00 |
14.00 |
[7; 30] |
3 |
|
2. Non-Custom |
5.20 |
4.42 |
[2.72; 10.53] |
9 |
|
Subtotal B.2 (weighted average of B.2.a and B.2.b) |
12.41 |
3.62 |
||
|
3. Changes in other costs~ |
||||
|
a. Nitrogen Costs |
0.11 |
0.00 |
[0; 5] |
47 |
|
b. Change in Cash Rent due to Cover Crops Use |
-1.15 |
0.00 |
[-20; 0] |
26 |
|
Subtotal B.3 |
-1.05 |
0.00 |
|
|
|
Subtotal B. Changes in Costs |
42.78 |
35.73 |
|
|
|
C. Net Change in Profits (C=A-B) |
16.41 |
4.27 |
|
|
|
C.1. Net Change in Profits excluding grazing/forage (C.1 = C - A.3) |
-18.59 |
-15.73 |
|
|
* Reported changes in corn yields following cover crops due to cover crops use ranged from -8 to 7 bushels per acre, with an average loss of 0.1 bushels. The median farmer reported no change in corn yields.
^ Reported changes in labor hours per acre to terminate cover crops with herbicides ranged from 0 to 10 hours, and averaged 0.59 hours. The median farmer reported no extra labor to terminate cover crops.
~ No respondent indicated changes in corn planting costs; P, K, manure, insecticide, fungicide, or soil testing costs; or changes in costs to repair soil erosion; or changes in management time due to cover crops use.
Table 14. Changes in net returns due to cover crop use followed by corn, for all cover crop species, all planting methods, terminated with herbicides. Farmers with 10 or more years of experience with cover crops.
|
Sources of changes in net profits |
Mean |
Median |
Range |
#Obs. |
|
$/acre |
||||
|
A) Changes in Revenues |
||||
|
1. Cost-share program |
17.00 |
16.00 |
[10; 25] |
3 |
|
2. Value of change in following corn yield* |
2.00 |
0.00 |
[0; 16] |
8 |
|
3. Savings or extra revenue from grazing or harvesting cover crop for forage |
28.50 |
28.50 |
[22; 35] |
2 |
|
Subtotal A. Changes in Revenue |
47.50 |
44.50 |
||
|
B) Changes in Costs |
||||
|
1. Cover Crop Planting |
||||
|
a. Seeds |
16.75 |
15.50 |
[10; 28] |
8 |
|
b. Planting (excluding seeds). Weighted average of custom and non-custom work. |
15.12 |
17.21 |
||
|
i. Custom work |
13.33 |
15.00 |
[10; 15] |
3 |
|
ii. Non-Custom |
15.71 |
17.95 |
[3.59; 19.29] |
9 |
|
Subtotal B.1 |
31.87 |
32.71 |
||
|
2. Cover Crop Termination |
||||
|
a. Extra expenses for farmers that applied herbicides to all acres (with and without cover crops) |
1.55 |
0.00 |
11 |
|
|
i. Extra herbicide cost on top of regular weed control program |
0.00 |
0.00 |
[0; 0] |
11 |
|
ii. Extra labor costs to apply herbicides on top of regular weed control program^ |
1.18 |
0.00 |
[0; 13] |
11 |
|
iii. Other termination expenses |
0.36 |
0.00 |
[0; 4] |
11 |
|
b. Extra expenses for farmers that did not apply herbicides before planting corn in acres without cover crops. |
8.25 |
8.25 |
|
1 |
|
i. Herbicide cost to terminate cover crops |
4.00 |
4.00 |
[4; 4] |
1 |
|
ii. Herbicide application cost. Weighted average of custom and non-custom work. |
4.25 |
4.25 |
[3.12; 5.38] |
|
|
1. Custom Work |
0.00 |
0.00 |
[0; 0] |
0 |
|
2. Non-Custom |
4.25 |
4.25 |
[3.12; 5.38] |
2 |
|
Subtotal B.2 (weighted average of B.2.a and B.2.b) |
2.10 |
0.69 |
||
|
3. Changes in other costs~ |
||||
|
a. Nitrogen Costs |
0.00 |
0.00 |
[0; 0] |
13 |
|
b. Change in Cash Rent due to Cover Crops Use |
0.00 |
0.00 |
[0; 0] |
4 |
|
Subtotal B.3 |
0.00 |
0.00 |
|
|
|
Subtotal B. Changes in Costs |
33.97 |
33.40 |
|
|
|
C. Net Change in Profits (C=A-B) |
13.53 |
11.10 |
|
|
|
C.1. Net Change in Profits excluding grazing/forage (C.1 = C - A.3) |
-14.97 |
-17.40 |
|
|
* Reported changes in corn yields following cover crops due to cover crops use ranged from 0 to 4 bushels per acre, with an average increase of 0.5 bushels. The median farmer reported no change in corn yields.
^ Reported changes in labor hours per acre to terminate cover crops with herbicides ranged from 0 to 1 hour, and averaged 0.09 hours. The median farmer reported no extra labor to terminate cover crops.
~ No respondent indicated changes in corn planting costs; N, P, K, manure, insecticide, fungicide, or soil testing costs; or changes in costs to repair soil erosion; or changes in management time or cash rent paid due to cover crops use.
Table 15. Changes in net returns due to cover crop use followed by soybeans, for all cover crop species, all planting methods, terminated with herbicides. Farmers with up to 3 years of experience with cover crops.
|
Sources of changes in net profits |
Mean |
Median |
Range |
#Obs. |
|
$/acre |
||||
|
A) Changes in Revenues |
||||
|
1. Cost-share program |
15.00 |
15.00 |
[15; 15] |
4 |
|
2. Value of change in following soybean yield* |
4.29 |
0.00 |
[-40; 50] |
7 |
|
3. Savings or extra revenue from grazing or harvesting cover crop for forage |
31.00 |
31.00 |
[31; 31] |
1 |
|
Subtotal A. Changes in Revenue |
50.29 |
46.00 |
||
|
B) Changes in Costs |
||||
|
1. Cover Crop Planting |
||||
|
a. Seeds |
14.17 |
15.00 |
[10; 17] |
6 |
|
b. Planting (excluding seeds). Weighted average of custom and non-custom work. |
15.99 |
15.74 |
||
|
i. Custom work |
15.33 |
15.00 |
[15; 16] |
3 |
|
ii. Non-Custom |
17.95 |
17.95 |
[17.95; 17.95] |
1 |
|
Subtotal B.1 |
30.16 |
30.74 |
||
|
2. Cover Crop Termination |
||||
|
a. Extra expenses for farmers that applied herbicides to all acres (with and without cover crops)^ |
6.60 |
0.00 |
|
5 |
|
i. Extra herbicide cost on top of regular weed control program |
0.00 |
0.00 |
[0; 0] |
5 |
|
ii. Extra labor costs to apply herbicides on top of regular weed control program |
2.60 |
0.00 |
[0; 13] |
5 |
|
iii. Other termination expenses |
4.00 |
0.00 |
[0; 20] |
5 |
|
b. Extra expenses for farmers that did not apply herbicides before planting soybean in acres without cover crops. |
24.96 |
25.63 |
|
3 |
|
i. Herbicide cost to terminate cover crops |
19.33 |
20.00 |
[8; 30] |
3 |
|
ii. Herbicide application cost. Weighted average of custom and non-custom work. |
5.63 |
5.63 |
[5.63; 5.63] |
|
|
1. Custom Work |
8.00 |
8.00 |
[8; 8] |
2 |
|
2. Non-Custom |
3.25 |
3.25 |
[3.25; 3.25] |
2 |
|
Subtotal B.2 (weighted average of B.2.a and B.2.b) |
13.48 |
9.61 |
|
|
|
3. Changes in other costs~ |
||||
|
a. Cash crop seed costs |
0.00 |
0.00 |
[0; 0] |
8 |
|
b. Change in Cash Rent due to Cover Crops Use |
0.00 |
0.00 |
[0; 0] |
3 |
|
Subtotal B.3 |
0.00 |
0.00 |
|
|
|
Subtotal B. Changes in Costs |
43.64 |
40.35 |
|
|
|
C. Net Change in Profits (C=A-B) |
6.64 |
5.65 |
|
|
|
C.1. Net Change in Profits excluding grazing/forage (C.1 = C - A.3) |
-24.36 |
-25.35 |
|
|
* Reported changes in soybean yields following cover crops due to cover crops use ranged from -5 to 4 bushels per acre, with an average increase of 0.43 bushels. The median farmer reported no change in soybean yields.
^ Reported changes in labor hours per acre to terminate cover crops with herbicides ranged from 0 to 1 hours, and averaged 0.20 hours. The median farmer reported no extra labor to terminate cover crops.
~ No respondent indicated changes in corn planting costs; N, P, K, manure, insecticide, fungicide, or soil testing costs; or changes in costs to repair soil erosion; or changes in management time or cash rent paid due to cover crops use.
Table 16. Changes in net returns due to cover crop use followed by soybeans, for all cover crop species, all planting methods, terminated with herbicides. Farmers with 4 to 9 years of experience with cover crops.
|
Sources of changes in net profits |
Mean |
Median |
Range |
#Obs. |
|
$/acre |
||||
|
A) Changes in Revenues |
||||
|
1. Cost-share program |
22.63 |
15.00 |
[10; 46] |
8 |
|
2. Value of change in following soybean yield* |
2.50 |
0.00 |
[-70; 40] |
20 |
|
3. Savings or extra revenue from grazing or harvesting cover crop for forage |
30.71 |
20.00 |
[5; 83] |
7 |
|
Subtotal A. Changes in Revenue |
55.84 |
35.00 |
||
|
B) Changes in Costs |
||||
|
1. Cover Crop Planting |
||||
|
a. Seeds |
18.00 |
14.00 |
[8; 50] |
23 |
|
b. Planting (excluding seeds). Weighted average of custom and non-custom work. |
18.04 |
16.76 |
||
|
i. Custom work |
17.50 |
16.00 |
[6; 32] |
10 |
|
ii. Non-Custom |
19.84 |
19.29 |
[17.95; 22.29] |
3 |
|
Subtotal B.1 |
36.04 |
30.76 |
||
|
2. Cover Crop Termination |
||||
|
a. Extra expenses for farmers that applied herbicides to all acres (with and without cover crops)^ |
0.95 |
0.00 |
|
22 |
|
i. Extra herbicide cost on top of regular weed control program |
0.41 |
0.00 |
[-11; 12] |
22 |
|
ii. Extra labor costs to apply herbicides on top of regular weed control program |
0.00 |
0.00 |
[0; 0] |
22 |
|
iii. Other termination expenses |
0.55 |
0.00 |
[0; 12] |
22 |
|
b. Extra expenses for farmers that did not apply herbicides before planting soybean in acres without cover crops. |
14.00 |
14.06 |
|
2 |
|
i. Herbicide cost to terminate cover crops |
8.00 |
8.00 |
[6; 10] |
2 |
|
ii. Herbicide application cost. Weighted average of custom and non-custom work. |
6.00 |
6.06 |
[2.72; 9.23] |
|
|
1. Custom Work |
0.00 |
0.00 |
[0; 0] |
0 |
|
2. Non-Custom |
6.00 |
6.06 |
[2.72; 9.23] |
3 |
|
Subtotal B.2 (weighted average of B.2.a and B.2.b) |
2.04 |
1.17 |
|
|
|
3. Changes in other costs~ |
||||
|
a. Cash crop seed costs |
-0.42 |
0.00 |
[-11; 0] |
26 |
|
b. Change in Cash Rent due to Cover Crops Use |
-0.83 |
0.00 |
[-10; 0] |
12 |
|
Subtotal B.3 |
-1.26 |
0.00 |
|
|
|
Subtotal B. Changes in Costs |
36.83 |
31.93 |
|
|
|
C. Net Change in Profits (C=A-B) |
19.01 |
3.07 |
|
|
|
C.1. Net Change in Profits excluding grazing/forage (C.1 = C - A.3) |
-11.70 |
-16.93 |
|
|
* Reported changes in soybean yields following cover crops due to cover crops use ranged from -5 to 4 bushels per acre, with an average increase of 0.43 bushels. The median farmer reported no change in soybean yields.
^ Reported changes in labor hours per acre to terminate cover crops with herbicides ranged from 0 to 1 hours, and averaged 0.20 hours. The median farmer reported no extra labor to terminate cover crops.
~ No respondent indicated changes in corn planting costs; N, P, K, manure, insecticide, fungicide, or soil testing costs; or changes in costs to repair soil erosion; or changes in management time or cash rent paid due to cover crops use.
Table 17. Changes in net returns due to cover crop use followed by soybeans, for all cover crop species, all planting methods, terminated with herbicides. Farmers with 10 or more years of experience with cover crops.
|
Sources of changes in net profits |
Mean |
Median |
Range |
#Obs. |
|
$/acre |
||||
|
A) Changes in Revenues |
||||
|
1. Cost-share program |
15.75 |
15.00 |
[8; 25] |
4 |
|
2. Value of change in following soybean yield* |
-0.91 |
0.00 |
[-50; 40] |
11 |
|
3. Savings or extra revenue from grazing or harvesting cover crop for forage |
43.75 |
10.00 |
[5; 150] |
4 |
|
Subtotal A. Changes in Revenue |
58.59 |
25.00 |
||
|
B) Changes in Costs |
||||
|
1. Cover Crop Planting |
||||
|
a. Seeds |
16.33 |
14.50 |
[10; 30] |
12 |
|
b. Planting (excluding seeds). Weighted average of custom and non-custom work. |
16.22 |
16.12 |
||
|
i. Custom work |
17.67 |
15.00 |
[10; 28] |
3 |
|
ii. Non-Custom |
15.86 |
16.41 |
[7.91; 21.93] |
12 |
|
Subtotal B.1 |
32.55 |
30.62 |
||
|
2. Cover Crop Termination |
||||
|
a. Extra expenses for farmers that applied herbicides to all acres (with and without cover crops)^ |
2.17 |
0.00 |
|
12 |
|
i. Extra herbicide cost on top of regular weed control program |
0.25 |
0.00 |
[0; 3] |
12 |
|
ii. Extra labor costs to apply herbicides on top of regular weed control program |
1.08 |
0.00 |
[0; 13] |
12 |
|
iii. Other termination expenses |
0.83 |
0.00 |
[0; 10] |
12 |
|
b. Extra expenses for farmers that did not apply herbicides before planting soybean in acres without cover crops. |
10.32 |
10.32 |
|
2 |
|
i. Herbicide cost to terminate cover crops |
6.00 |
6.00 |
[2; 10] |
2 |
|
ii. Herbicide application cost. Weighted average of custom and non-custom work. |
4.32 |
4.32 |
[3.25; 5.38] |
|
|
1. Custom Work |
0.00 |
0.00 |
[0; 0] |
0 |
|
2. Non-Custom |
4.32 |
4.32 |
[3.25; 5.38] |
2 |
|
Subtotal B.2 (weighted average of B.2.a and B.2.b) |
3.33 |
1.47 |
|
|
|
3. Changes in other costs~ |
||||
|
a. Cash crop seed costs |
0.00 |
0.00 |
[0; 0] |
14 |
|
b. Change in Cash Rent due to Cover Crops Use |
0.00 |
0.00 |
[0; 0] |
5 |
|
Subtotal B.3 |
0.00 |
0.00 |
|
|
|
Subtotal B. Changes in Costs |
35.88 |
32.09 |
|
|
|
C. Net Change in Profits (C=A-B) |
22.71 |
-7.09 |
|
|
|
C.1. Net Change in Profits excluding grazing/forage (C.1 = C - A.3) |
-21.04 |
-17.09 |
|
|
* Reported changes in soybean yields following cover crops due to cover crops use ranged from -5 to 4 bushels per acre, with an average loss of -0.09 bushels. The median farmer reported no change in soybean yields.
^ Reported changes in labor hours per acre to terminate cover crops with herbicides ranged from 0 to 1 hours, and averaged 0.08 hours. The median farmer reported no extra labor to terminate cover crops.
~ No respondent indicated changes in corn planting costs; N, P, K, manure, insecticide, fungicide, or soil testing costs; or changes in costs to repair soil erosion; or changes in management time or cash rent paid due to cover crops use.
Table 18. Changes in net returns due to cereal rye use followed by corn, for all planting methods, terminated with herbicides. Operations in rotational or continuous no-till only.
|
Sources of changes in net profits |
Mean |
Median |
Range |
#Obs. |
|
$/acre |
||||
|
A) Changes in Revenues |
||||
|
1. Cost-share program |
24.69 |
20.00 |
[10; 80] |
13 |
|
2. Value of change in following corn yield* |
-14.17 |
0.00 |
[-108; 28] |
35 |
|
3. Savings or extra revenue from grazing or harvesting cover crop for forage |
17.33 |
20.00 |
[10; 22] |
3 |
|
Subtotal A. Changes in Revenue |
27.85 |
40.00 |
||
|
B) Changes in Costs |
||||
|
1. Cover Crop Planting |
||||
|
a. Seeds |
17.03 |
15.00 |
[8; 30] |
32 |
|
b. Planting (excluding seeds). Weighted average of custom and non-custom work. |
15.12 |
16.07 |
||
|
i. Custom work |
15.16 |
15.00 |
[5; 30] |
19 |
|
ii. Non-Custom |
15.08 |
16.99 |
[2.42; 25.33] |
22 |
|
Subtotal B.1 |
32.15 |
31.07 |
||
|
2. Cover Crop Termination |
||||
|
a. Extra expenses for farmers that applied herbicides to all acres (with and without cover crops) |
5.31 |
0.00 |
26 |
|
|
i. Extra herbicide cost on top of regular weed control program |
0.69 |
0.00 |
[0; 17] |
26 |
|
ii. Extra labor costs to apply herbicides on top of regular weed control program^ |
1.50 |
0.00 |
[0; 13] |
26 |
|
iii. Other termination expenses |
3.12 |
0.00 |
[0; 40] |
26 |
|
b. Extra expenses for farmers that did not apply herbicides before planting corn in acres without cover crops. |
17.59 |
15.98 |
|
8 |
|
i. Herbicide cost to terminate cover crops |
8.63 |
6.50 |
[4; 24] |
8 |
|
ii. Herbicide application cost. Weighted average of custom and non-custom work. |
8.97 |
9.48 |
[7.27; 11.01] |
|
|
1. Custom Work |
30.00 |
30.00 |
[30; 30] |
1 |
|
2. Non-Custom |
4.76 |
5.38 |
[2.72; 7.21] |
5 |
|
Subtotal B.2 (weighted average of B.2.a and B.2.b) |
8.20 |
3.76 |
||
|
3. Changes in other costs~ |
||||
|
a. Nitrogen Costs |
0.00 |
0.00 |
[0; 0] |
35 |
|
b. Change in Cash Rent due to Cover Crops Use |
-1.11 |
0.00 |
[-20; 0] |
18 |
|
Subtotal B.3 |
-1.11 |
0.00 |
|
|
|
Subtotal B. Changes in Costs |
39.24 |
34.83 |
|
|
|
C. Net Change in Profits (C=A-B) |
-11.38 |
5.17 |
|
|
|
C.1. Net Change in Profits excluding grazing/forage (C.1 = C - A.3) |
-28.72 |
-14.83 |
|
|
* Reported changes in corn yields following cover crops due to cover crops use ranged from -28 to 7 bushels per acre, with an average loss of 3.54 bushels. The median farmer reported no change in corn yields.
^ Reported changes in labor hours per acre to terminate cover crops with herbicides ranged from 0 to 1 hours, and averaged 0.12 hours. The median farmer reported no extra labor to terminate cover crops.
~ No respondent indicated changes in corn planting costs (including seeds); N, P, K, manure, insecticide, fungicide, or soil testing costs; or changes in costs to repair soil erosion; or changes in management time due to cover crops use.
Table 19. Changes in net returns due to cereal rye use followed by corn, for all planting methods, terminated with herbicides. Operations in reduced-till only.
|
Sources of changes in net profits |
Mean |
Median |
Range |
#Obs. |
|
$/acre |
||||
|
A) Changes in Revenues |
||||
|
1. Cost-share program |
29.00 |
27.00 |
[15; 45] |
3 |
|
2. Value of change in following corn yield* |
4.57 |
0.00 |
[-8; 40] |
7 |
|
3. Savings or extra revenue from grazing or harvesting cover crop for forage |
0.00 |
0.00 |
[0; 0] |
0 |
|
Subtotal A. Changes in Revenue |
33.57 |
27.00 |
||
|
B) Changes in Costs |
||||
|
1. Cover Crop Planting |
||||
|
a. Seeds |
18.17 |
19.00 |
[9; 25] |
6 |
|
b. Planting (excluding seeds). Weighted average of custom and non-custom work. |
12.94 |
13.38 |
||
|
i. Custom work |
11.33 |
12.00 |
[10; 12] |
3 |
|
ii. Non-Custom |
14.15 |
14.42 |
[9.79; 17.95] |
4 |
|
Subtotal B.1 |
31.11 |
32.38 |
||
|
2. Cover Crop Termination |
||||
|
a. Extra expenses for farmers that applied herbicides to all acres (with and without cover crops) |
2.80 |
0.00 |
5 |
|
|
i. Extra herbicide cost on top of regular weed control program |
0.00 |
0.00 |
[0; 0] |
5 |
|
ii. Extra labor costs to apply herbicides on top of regular weed control program^ |
2.60 |
0.00 |
[0; 13] |
5 |
|
iii. Other termination expenses |
0.20 |
0.00 |
[0; 1] |
5 |
|
b. Extra expenses for farmers that did not apply herbicides before planting corn in acres without cover crops. |
8.84 |
8.84 |
|
1 |
|
i. Herbicide cost to terminate cover crops |
4.00 |
4.00 |
[4; 4] |
1 |
|
ii. Herbicide application cost. Weighted average of custom and non-custom work. |
4.84 |
4.84 |
[4.29; 5.38] |
|
|
1. Custom Work |
0.00 |
0.00 |
[0; 0] |
0 |
|
2. Non-Custom |
4.84 |
4.84 |
[4.29; 5.38] |
2 |
|
Subtotal B.2 (weighted average of B.2.a and B.2.b) |
3.81 |
1.47 |
||
|
3. Changes in other costs~ |
||||
|
a. Nitrogen Costs |
0.00 |
0.00 |
[0; 0] |
7 |
|
b. Change in Cash Rent due to Cover Crops Use |
0.00 |
0.00 |
[0; 0] |
3 |
|
Subtotal B.3 |
0.00 |
0.00 |
|
|
|
Subtotal B. Changes in Costs |
34.91 |
33.85 |
|
|
|
C. Net Change in Profits (C=A-B) |
-1.34 |
-6.85 |
|
|
|
C.1. Net Change in Profits excluding grazing/forage (C.1 = C - A.3) |
-1.34 |
-6.85 |
|
|
* Reported changes in corn yields following cover crops due to cover crops use ranged from -2 to 10 bushels per acre, with an average loss of 1.14 bushels. The median farmer reported no change in corn yields.
^ Reported changes in labor hours per acre to terminate cover crops with herbicides ranged from 0 to 1 hours, and averaged 0.20 hours. The median farmer reported no extra labor to terminate cover crops.
~ No respondent indicated changes in corn planting costs (including seeds); N, P, K, manure, insecticide, fungicide, or soil testing costs; or changes in costs to repair soil erosion; or changes in management time due to cover crops use.
Table 20. Changes in net returns due to cereal rye use followed by corn, for all planting methods, terminated with herbicides. Operations in conventional- or vertical-tillage only.
|
Sources of changes in net profits |
Mean |
Median |
Range |
#Obs. |
|
$/acre |
||||
|
A) Changes in Revenues |
||||
|
1. Cost-share program |
19.00 |
17.50 |
[7; 35] |
6 |
|
2. Value of change in following corn yield* |
-7.20 |
0.00 |
[-40; 0] |
10 |
|
3. Savings or extra revenue from grazing or harvesting cover crop for forage |
70.00 |
80.00 |
[30; 100] |
3 |
|
Subtotal A. Changes in Revenue |
81.80 |
97.50 |
||
|
B) Changes in Costs |
||||
|
1. Cover Crop Planting |
||||
|
a. Seeds |
15.88 |
17.00 |
[10; 21] |
8 |
|
b. Planting (excluding seeds). Weighted average of custom and non-custom work. |
14.04 |
14.10 |
||
|
i. Custom work |
14.20 |
15.00 |
[8; 20] |
5 |
|
ii. Non-Custom |
13.93 |
13.46 |
[7.55; 19.38] |
7 |
|
Subtotal B.1 |
29.92 |
31.10 |
||
|
2. Cover Crop Termination |
||||
|
a. Extra expenses for farmers that applied herbicides to all acres (with and without cover crops) |
44.50 |
14.50 |
6 |
|
|
i. Extra herbicide cost on top of regular weed control program |
2.50 |
0.00 |
[0; 10] |
6 |
|
ii. Extra labor costs to apply herbicides on top of regular weed control program^ |
36.83 |
13.00 |
[0; 130] |
6 |
|
iii. Other termination expenses |
5.17 |
1.50 |
[0; 20] |
6 |
|
b. Extra expenses for farmers that did not apply herbicides before planting corn in acres without cover crops. |
17.40 |
16.16 |
|
4 |
|
i. Herbicide cost to terminate cover crops |
10.25 |
10.00 |
[6; 15] |
4 |
|
ii. Herbicide application cost. Weighted average of custom and non-custom work. |
7.15 |
6.16 |
[5.06; 11.52] |
|
|
1. Custom Work |
10.50 |
10.50 |
[7; 14] |
2 |
|
2. Non-Custom |
5.81 |
4.42 |
[4.29; 10.53] |
5 |
|
Subtotal B.2 (weighted average of B.2.a and B.2.b) |
33.66 |
15.16 |
||
|
3. Changes in other costs~ |
||||
|
a. Nitrogen Costs |
0.45 |
0.00 |
[0; 5] |
11 |
|
b. Change in Cash Rent due to Cover Crops Use |
-2.00 |
0.00 |
[-10; 0] |
5 |
|
Subtotal B.3 |
0.00 |
0.00 |
|
|
|
Subtotal B. Changes in Costs |
34.91 |
33.85 |
|
|
|
C. Net Change in Profits (C=A-B) |
-1.34 |
-6.85 |
|
|
|
C.1. Net Change in Profits excluding grazing/forage (C.1 = C - A.3) |
-1.34 |
-6.85 |
|
|
* Reported changes in corn yields following cover crops due to cover crops use ranged from -10 to 0 bushels per acre, with an average loss of 1.80 bushels. The median farmer reported no change in corn yields.
^ Reported changes in labor hours per acre to terminate cover crops with herbicides ranged from 0 to 10 hours, and averaged 2.83 hours. The median farmer reported 1 extra labor hour to terminate cover crops.
~ No respondent indicated changes in corn planting costs (including seeds); P, K, manure, insecticide, fungicide, or soil testing costs; or changes in costs to repair soil erosion; or changes in management time due to cover crops use.
Table 21. Changes in net returns due to cover crops use followed by corn, for all cover crop species, terminated with herbicides, in no-till systems. Planting method: drilling.
|
Sources of changes in net profits |
Mean |
Median |
Range |
#Obs. |
|
$/acre |
||||
|
A) Changes in Revenues |
||||
|
1. Cost-share program |
27.10 |
20.50 |
[15; 80] |
10 |
|
2. Value of change in following corn yield* |
-13.55 |
0.00 |
[-108; 28] |
31 |
|
3. Savings or extra revenue from grazing or harvesting cover crop for forage |
13.33 |
10.00 |
[10; 20] |
3 |
|
Subtotal A. Changes in Revenue |
26.88 |
30.50 |
||
|
B) Changes in Costs |
||||
|
1. Cover Crop Planting |
||||
|
a. Seeds |
18.03 |
17.00 |
[5; 35] |
35 |
|
b. Planting (excluding seeds). Weighted average of custom and non-custom work. |
15.94 |
16.28 |
||
|
i. Custom work |
16.00 |
15.00 |
[5; 30] |
16 |
|
ii. Non-Custom |
15.90 |
16.99 |
[7.86; 25.33] |
29 |
|
Subtotal B.1 |
33.97 |
33.28 |
||
|
2. Cover Crop Termination |
||||
|
a. Extra expenses for farmers that applied herbicides to all acres (with and without cover crops) |
4.90 |
0.00 |
29 |
|
|
i. Extra herbicide cost on top of regular weed control program |
0.79 |
0.00 |
[0; 17] |
29 |
|
ii. Extra labor costs to apply herbicides on top of regular weed control program^ |
0.90 |
0.00 |
[0; 13] |
29 |
|
iii. Other termination expenses |
3.21 |
0.00 |
[0; 40] |
29 |
|
b. Extra expenses for farmers that did not apply herbicides before planting corn in acres without cover crops. |
20.54 |
18.27 |
|
8 |
|
i. Herbicide cost to terminate cover crops |
11.25 |
9.00 |
[5; 24] |
8 |
|
ii. Herbicide application cost. Weighted average of custom and non-custom work. |
9.29 |
9.27 |
[3.81; 14.81] |
|
|
1. Custom Work |
18.00 |
18.00 |
[6; 30] |
2 |
|
2. Non-Custom |
4.93 |
4.90 |
[2.72; 7.21] |
4 |
|
Subtotal B.2 (weighted average of B.2.a and B.2.b) |
8.28 |
3.95 |
||
|
3. Changes in other costs~ |
||||
|
a. Nitrogen Costs |
-0.54 |
0.00 |
[-20; 0] |
37 |
|
b. Costs to Repair Soil Erosion |
-0.11 |
0.00 |
[-4; 0] |
37 |
|
c. Change in Cash Rent due to Cover Crops Use |
-1.05 |
0.00 |
[-20; 0] |
19 |
|
Subtotal B.3 |
-1.70 |
0.00 |
|
|
|
Subtotal B. Changes in Costs |
40.55 |
37.23 |
|
|
|
C. Net Change in Profits (C=A-B) |
-13.66 |
-6.73 |
|
|
|
C.1. Net Change in Profits excluding grazing/forage (C.1 = C - A.3) |
-26.99 |
-16.73 |
|
|
* Reported changes in corn yields following cover crops due to cover crops use ranged from -27 to 7 bushels per acre, with an average loss of 3.39 bushels. The median farmer reported no change in corn yields.
^ Reported changes in labor hours per acre to terminate cover crops with herbicides ranged from 0 to 1 hours, and averaged 0.07 hours. The median farmer reported no extra labor to terminate cover crops.
~ No respondent indicated changes in cash crop planting costs (including seeds); P, K, manure, insecticide, fungicide, or soil testing costs; or changes in management time due to cover crops use.
Table 22. Changes in net returns due to cover crops use followed by corn, for all cover crop species, terminated with herbicides, in no-till systems. Planting method: aerial.
|
Sources of changes in net profits |
Mean |
Median |
Range |
#Obs. |
|
$/acre |
||||
|
A) Changes in Revenues |
||||
|
1. Cost-share program |
19.20 |
16.00 |
[5; 45] |
5 |
|
2. Value of change in following corn yield* |
-11.14 |
0.00 |
[-100; 4] |
14 |
|
3. Savings or extra revenue from grazing or harvesting cover crop for forage |
15.00 |
20.00 |
[3; 22] |
3 |
|
Subtotal A. Changes in Revenue |
23.06 |
36.00 |
||
|
B) Changes in Costs |
||||
|
1. Cover Crop Planting |
||||
|
a. Seeds |
19.31 |
20.00 |
[10; 26] |
13 |
|
b. Planting (excluding seeds). Weighted average of custom and non-custom work. |
16.00 |
15.61 |
||
|
i. Custom work |
16.33 |
15.00 |
[10; 25] |
15 |
|
ii. Non-Custom |
15.01 |
17.44 |
[3.59; 25.33] |
5 |
|
Subtotal B.1 |
35.31 |
35.61 |
||
|
2. Cover Crop Termination |
||||
|
a. Extra expenses for farmers that applied herbicides to all acres (with and without cover crops) |
5.45 |
0.00 |
11 |
|
|
i. Extra herbicide cost on top of regular weed control program |
0.00 |
0.00 |
[0; 0] |
11 |
|
ii. Extra labor costs to apply herbicides on top of regular weed control program^ |
2.36 |
0.00 |
[0; 13] |
11 |
|
iii. Other termination expenses |
3.09 |
0.00 |
[0; 15] |
11 |
|
b. Extra expenses for farmers that did not apply herbicides before planting corn in acres without cover crops. |
13.97 |
14.42 |
|
3 |
|
i. Herbicide cost to terminate cover crops |
9.67 |
10.00 |
[4; 15] |
3 |
|
ii. Herbicide application cost. Weighted average of custom and non-custom work. |
4.31 |
4.42 |
[3.12; 5.38] |
|
|
1. Custom Work |
0.00 |
0.00 |
[0; 0] |
0 |
|
2. Non-Custom |
4.31 |
4.42 |
[3.12; 5.38] |
3 |
|
Subtotal B.2 (weighted average of B.2.a and B.2.b) |
7.28 |
3.09 |
||
|
3. Changes in other costs~ |
||||
|
a. Nitrogen Costs |
0.00 |
0.00 |
[0; 0] |
15 |
|
b. Costs to Repair Soil Erosion |
0.00 |
0.00 |
[0; 0] |
15 |
|
c. Change in Cash Rent due to Cover Crops Use |
0.00 |
0.00 |
[0; 0] |
6 |
|
Subtotal B.3 |
0.00 |
0.00 |
|
|
|
Subtotal B. Changes in Costs |
42.59 |
38.70 |
|
|
|
C. Net Change in Profits (C=A-B) |
-19.53 |
-2.70 |
|
|
|
C.1. Net Change in Profits excluding grazing/forage (C.1 = C - A.3) |
-34.53 |
-22.70 |
|
|
* Reported changes in corn yields following cover crops due to cover crops use ranged from -25 to 1 bushels per acre, with an average loss of 2.79 bushels. The median farmer reported no change in corn yields.
^ Reported changes in labor hours per acre to terminate cover crops with herbicides ranged from 0 to 1 hours, and averaged 0.18 hours. The median farmer reported no extra labor to terminate cover crops.
~ No respondent indicated changes in cash crop planting costs (including seeds); N, P, K, manure, insecticide, fungicide, or soil testing costs; or changes in costs to repair soil erosion; or changes in management time or cash rent paid due to cover crops use.
Table 23. Changes in net returns due to cover crop use followed by soybeans, for all cover crop species, terminated with herbicides, in no-till systems. Planting method: drilling.
|
Sources of changes in net profits |
Mean |
Median |
Range |
#Obs. |
|
$/acre |
||||
|
A) Changes in Revenues |
||||
|
1. Cost-share program |
16.70 |
15.00 |
[7; 38] |
10 |
|
2. Value of change in following soybean yield* |
2.80 |
0.00 |
[-20; 40] |
25 |
|
3. Savings or extra revenue from grazing or harvesting cover crop for forage |
15.00 |
17.00 |
[2; 31] |
7 |
|
Subtotal A. Changes in Revenue |
34.50 |
32.00 |
||
|
B) Changes in Costs |
||||
|
1. Cover Crop Planting |
||||
|
a. Seeds |
16.67 |
13.50 |
[6; 32] |
24 |
|
b. Planting (excluding seeds). Weighted average of custom and non-custom work. |
17.82 |
18.53 |
||
|
i. Custom work |
21.50 |
22.00 |
[10; 32] |
4 |
|
ii. Non-Custom |
17.21 |
17.95 |
[8.34; 24.17] |
24 |
|
Subtotal B.1 |
34.49 |
32.03 |
||
|
2. Cover Crop Termination |
||||
|
a. Extra expenses for farmers that applied herbicides to all acres (with and without cover crops)^ |
2.43 |
0.00 |
|
23 |
|
i. Extra herbicide cost on top of regular weed control program |
0.00 |
0.00 |
[-11; 8] |
23 |
|
ii. Extra labor costs to apply herbicides on top of regular weed control program |
1.13 |
0.00 |
[0; 13] |
23 |
|
iii. Other termination expenses |
1.30 |
0.00 |
[0; 20] |
23 |
|
b. Extra expenses for farmers that did not apply herbicides before planting soybean in acres without cover crops. |
13.99 |
14.66 |
|
3 |
|
i. Herbicide cost to terminate cover crops |
9.33 |
10.00 |
[8; 10] |
3 |
|
ii. Herbicide application cost. Weighted average of custom and non-custom work. |
4.66 |
4.66 |
[4.48; 4.83] |
|
|
1. Custom Work |
8.00 |
8.00 |
[8; 8] |
1 |
|
2. Non-Custom |
2.99 |
2.99 |
[2.72; 3.25] |
2 |
|
Subtotal B.2 (weighted average of B.2.a and B.2.b) |
3.77 |
1.69 |
|
|
|
3. Changes in other costs~ |
||||
|
a. Costs to Repair Soil Erosion |
-0.04 |
0.00 |
[-1; 0] |
26 |
|
b. Change in Cash Rent due to Cover Crops Use |
-0.77 |
0.00 |
[-10; 0] |
13 |
|
Subtotal B.3 |
-0.81 |
0.00 |
|
|
|
Subtotal B. Changes in Costs |
37.45 |
33.72 |
|
|
|
C. Net Change in Profits (C=A-B) |
-2.95 |
-1.72 |
|
|
|
C.1. Net Change in Profits excluding grazing/forage (C.1 = C - A.3) |
-17.95 |
-18.72 |
|
|
* Reported changes in soybean yields following cover crops due to cover crops use ranged from -2 to 4 bushels per acre, with an average increase of 0.28 bushels. The median farmer reported no change in soybean yields.
^ Reported changes in labor hours per acre to terminate cover crops with herbicides ranged from 0 to 1 hours, and averaged 0.09 hours. The median farmer reported no extra labor to terminate cover crops.
~ No respondent indicated changes in soybean planting costs (including seeds); N, P or K costs; manure, insecticide, fungicide, or soil testing costs; or management time due to cover crops use.
Table 24. Changes in net returns due to cover crop use followed by soybeans, for all cover crop species, terminated with herbicides, in no-till systems. Planting method: aerial.
|
Sources of changes in net profits |
Mean |
Median |
Range |
#Obs. |
|
$/acre |
||||
|
A) Changes in Revenues |
||||
|
1. Cost-share program |
18.55 |
15.00 |
[10; 35] |
11 |
|
2. Value of change in following soybean yield* |
5.00 |
0.00 |
[-60; 40] |
14 |
|
3. Savings or extra revenue from grazing or harvesting cover crop for forage |
15.00 |
10.00 |
[5; 30] |
3 |
|
Subtotal A. Changes in Revenue |
38.55 |
25.00 |
||
|
B) Changes in Costs |
||||
|
1. Cover Crop Planting |
||||
|
a. Seeds |
18.06 |
15.00 |
[10; 32] |
16 |
|
b. Planting (excluding seeds). Weighted average of custom and non-custom work. |
18.18 |
15.73 |
||
|
i. Custom work |
19.46 |
16.00 |
[12; 35] |
13 |
|
ii. Non-Custom |
14.00 |
14.86 |
[8.34; 17.95] |
4 |
|
Subtotal B.1 |
36.24 |
30.73 |
||
|
2. Cover Crop Termination |
||||
|
a. Extra expenses for farmers that applied herbicides to all acres (with and without cover crops)^ |
1.53 |
0.00 |
|
15 |
|
i. Extra herbicide cost on top of regular weed control program |
0.00 |
0.00 |
[0; 0] |
15 |
|
ii. Extra labor costs to apply herbicides on top of regular weed control program |
0.87 |
0.00 |
[0; 13] |
15 |
|
iii. Other termination expenses |
0.67 |
0.00 |
[0; 10] |
15 |
|
b. Extra expenses for farmers that did not apply herbicides before planting soybean in acres without cover crops. |
12.99 |
12.99 |
|
2 |
|
i. Herbicide cost to terminate cover crops |
10.00 |
10.00 |
[10; 10] |
2 |
|
ii. Herbicide application cost. Weighted average of custom and non-custom work. |
2.99 |
2.99 |
[2.72; 3.25] |
|
|
1. Custom Work |
0.00 |
0.00 |
[0; 0] |
0 |
|
2. Non-Custom |
2.99 |
2.99 |
[2.72; 3.25] |
2 |
|
Subtotal B.2 (weighted average of B.2.a and B.2.b) |
2.88 |
1.53 |
|
|
|
3. Changes in other costs~ |
||||
|
a. Costs to Repair Soil Erosion |
0.00 |
0.00 |
[0; 0] |
17 |
|
b. Change in Cash Rent due to Cover Crops Use |
0.00 |
0.00 |
[0; 0] |
8 |
|
Subtotal B.3 |
0.00 |
0.00 |
|
|
|
Subtotal B. Changes in Costs |
39.12 |
32.26 |
|
|
|
C. Net Change in Profits (C=A-B) |
-0.58 |
-7.26 |
|
|
|
C.1. Net Change in Profits excluding grazing/forage (C.1 = C - A.3) |
-15.58 |
-17.26 |
|
|
* Reported changes in soybean yields following cover crops due to cover crops use ranged from -6 to 4 bushels per acre, with an average increase of 0.50 bushels. The median farmer reported no change in soybean yields.
^ Reported changes in labor hours per acre to terminate cover crops with herbicides ranged from 0 to 1 hours, and averaged 0.07 hours. The median farmer reported no extra labor to terminate cover crops.
~ No respondent indicated changes in soybean planting costs (including seeds); N, P or K costs; manure, insecticide, fungicide, or soil testing costs; or changes in costs to repair soil erosion; or changes in management time or cash rent paid due to cover crops use.
Table 25. Changes in net returns due to cover crops use followed by corn, for all cover crop species, planted with drills in conventional or vertical tillage systems. Termination method: herbicides.
|
Sources of changes in net profits |
Mean |
Median |
Range |
#Obs. |
|
$/acre |
||||
|
A) Changes in Revenues |
||||
|
1. Cost-share program |
16.75 |
16.00 |
[7; 28] |
4 |
|
2. Value of change in following corn yield* |
-8.00 |
0.00 |
[-40; 0] |
5 |
|
3. Savings or extra revenue from grazing or harvesting cover crop for forage |
80.00 |
80.00 |
[80; 80] |
1 |
|
Subtotal A. Changes in Revenue |
88.75 |
96.00 |
||
|
B) Changes in Costs |
||||
|
1. Cover Crop Planting |
||||
|
a. Seeds |
17.40 |
19.00 |
[10; 21] |
5 |
|
b. Planting (excluding seeds). Weighted average of custom and non-custom work. |
14.50 |
14.50 |
||
|
i. Custom work |
14.33 |
15.00 |
[13; 15] |
3 |
|
ii. Non-Custom |
14.57 |
14.28 |
[9.79; 19.38] |
7 |
|
Subtotal B.1 |
31.90 |
33.50 |
||
|
2. Cover Crop Termination |
||||
|
a. Extra expenses for farmers that applied herbicides to all acres (with and without cover crops) |
13.25 |
0.00 |
4 |
|
|
i. Extra herbicide cost on top of regular weed control program |
0.00 |
0.00 |
[0; 0] |
4 |
|
ii. Extra labor costs to apply herbicides on top of regular weed control program^ |
3.25 |
0.00 |
[0; 13] |
4 |
|
iii. Other termination expenses |
10.00 |
0.00 |
[0; 20] |
4 |
|
b. Extra expenses for farmers that did not apply herbicides before planting corn in acres without cover crops. |
15.26 |
15.54 |
|
1 |
|
i. Herbicide cost to terminate cover crops |
8.00 |
8.00 |
[8; 8] |
1 |
|
ii. Herbicide application cost. Weighted average of custom and non-custom work. |
7.26 |
7.54 |
[6.72; 7.54] |
|
|
1. Custom Work |
14.00 |
14.00 |
[14; 14] |
1 |
|
2. Non-Custom |
5.02 |
5.38 |
[4.29; 5.38] |
3 |
|
Subtotal B.2 (weighted average of B.2.a and B.2.b) |
13.65 |
3.11 |
||
|
3. Changes in other costs~ |
||||
|
Subtotal B.3 |
0.00 |
0.00 |
[0; 0] |
8 |
|
Subtotal B. Changes in Costs |
45.55 |
36.61 |
|
|
|
C. Net Change in Profits (C=A-B) |
43.20 |
59.39 |
|
|
|
C.1. Net Change in Profits excluding grazing/forage (C.1 = C - A.3) |
-36.80 |
-20.61 |
|
|
* Reported changes in corn yields following cover crops due to cover crops use ranged from -10 to 0 bushels per acre, with an average loss of 2.00 bushels. The median farmer reported no change in corn yields.
^ Reported changes in labor hours per acre to terminate cover crops with herbicides ranged from 0 to 1 hours, and averaged 0.25 hours. The median farmer reported no extra labor to terminate cover crops.
~ No respondent indicated changes in cash crop planting costs (including seeds); N, P, K, manure, insecticide, fungicide, or soil testing costs; or changes in costs to repair soil erosion; or changes in management time or cash rent paid due to cover crops use.
Table 26. Changes in net returns due to cover crops use followed by corn, for all cover crop species, terminated with herbicides, in conventional or vertical tillage systems. Termination method: tillage.
|
Sources of changes in net profits |
Mean |
Median |
Range |
#Obs. |
|
$/acre |
||||
|
A) Changes in Revenues |
||||
|
1. Cost-share program |
15.50 |
15.50 |
[11; 20] |
2 |
|
2. Value of change in following corn yield* |
9.00 |
0.00 |
[0; 52] |
8 |
|
3. Savings or extra revenue from grazing or harvesting cover crop for forage |
41.00 |
20.00 |
[15; 88] |
3 |
|
Subtotal A. Changes in Revenue |
65.50 |
35.50 |
||
|
B) Changes in Costs |
||||
|
1. Cover Crop Planting |
||||
|
a. Seeds |
20.20 |
16.50 |
[5; 45] |
10 |
|
b. Planting (excluding seeds). Weighted average of custom and non-custom work. |
13.54 |
12.01 |
||
|
i. Custom work |
27.00 |
27.00 |
[27; 27] |
1 |
|
ii. Non-Custom |
12.04 |
10.34 |
[7.59; 18.61] |
9 |
|
Subtotal B.1 |
33.74 |
28.51 |
||
|
2. Cover Crop Termination |
||||
|
a. Extra expenses for farmers that used conventional till in all acres (with and without cover crops) |
4.90 |
0.00 |
10 |
|
|
i. Extra labor costs to till cover crop acres on top of regular costs to till no cover crop acres^ |
3.90 |
0.00 |
[0; 13] |
10 |
|
ii. Other termination expenses |
1.00 |
0.00 |
[0; 5] |
10 |
|
Subtotal B.2 |
4.90 |
0.00 |
||
|
3. Changes in other costs~ |
||||
|
a. Opportunity cost of management time~ |
0.30 |
0.00 |
[0; 30] |
10 |
|
Subtotal B.3 |
0.30 |
0.00 |
|
|
|
Subtotal B. Changes in Costs |
38.34 |
28.51 |
|
|
|
C. Net Change in Profits (C=A-B) |
26.56 |
6.99 |
|
|
|
C.1. Net Change in Profits excluding grazing/forage (C.1 = C - A.3) |
-14.44 |
-13.01 |
|
|
* Reported changes in corn yields following cover crops due to cover crops use ranged from 0 to 13 bushels per acre, with an average gain of 2.25 bushels. The median farmer reported no change in corn yields.
^ Reported changes in labor hours per acre to terminate cover crops with herbicides ranged from 0 to 1 hours, and averaged 0.30 hours. The median farmer reported no extra labor to terminate cover crops.
~ No respondent indicated changes in cash crop planting costs (including seeds); N, P, K, manure, insecticide, fungicide, or soil testing costs; or changes in costs to repair soil erosion; or changes in cash rent paid due to cover crops use. Only one operator reported 2 extra management hours required per acre per year to manage cover crops.
Hypotheses 2: results from agronomic simulations.
Table 27 reports the marginal effects of cover crop use, soil type, nitrogen rate, and location on corn yields, corn biomass, soil loss, runoff, nitrate load, subsurface drainage, and nitrate leaching. The baseline scenario is a crop system with Tama soil, in region CC in Iowa, with Nitrogen application rate of 150 kg/ha, and without cover crop. The average annual marginal effects of cover crop use (after accounting for soil type, nitrogen rate, and location) over the 20-year simulation periods are to:
- increase corn yields by 1.1 bushels per acre
- increase corn biomass by 83 kg/ha
- reduce soil loss by a quarter of a ton per hectare
- reduce water runoff by 1.6 mm
- reduce nitrate load by 37% (6 kg/ha)
- reduce nitrate leaching by 27% (0.025 mg/L).
In order to explore the temporal pattern of the reduction in nitrate leaching due to cover crops use, the daily average concentration of nitrate leaching was evaluated across the 20 simulation years. Cover crop reduces nitrate concentration significantly in the spring when nitrate concentration is typically high. Although cover crop use results in slightly higher concentrations over the winter, the baseline concentration level is lower than the typical peak period without cover crops (Figure 1). Between day-of-the-year (doy) 180 and 300, the difference between the two systems with cover crops and without cover crops is negligible, since both nitrate load and drainage are low when a cash crop (typically corn or soybeans) is in the ground.
During our interviews with water treatment plant managers, we learned that water treatment plants are more concerned with peak levels of nitrate concentration than with overall average levels. We calculated the average number of days in a year (over 20 simulated years) when the nitrate concentration levels exceeded the 10.4 mg/L effective safety limit of drinking water set by the EPA are relevant (Figure 2). On average, the use of cover crops reduces the number of peak days by 3 over the year, and such reduction is significant at the 5% significance level.
A summary of results from complementary tests conducted on agronomic simulations including 4 nitrogen application rates (100, 150, 200, and 250 kg/ha), 3 soil types (Canisteo, Webster, and Tama), and 4 states (Iowa, Illinois, Indiana, and Minnesota) and their agricultural districts, indicates that:
- mean corn yields are higher (+1 bu/acre) with cover crops than without cover crops for all observations across all locations, nitrogen rates, and soil types (5% significance level);
- mean corn yields are higher (+2 bu/acre) with cover crops than without cover crops for a nitrogen rate application of 100 kg/ha, across all locations and soil types (5% significance level);
- mean corn yields in Iowa are higher (+2 bu/acre) with cover crops than without cover crops, across all nitrogen rate applications and soil types (5% significance level);
- mean nitrate leaching (concentration) is lower (-0.239 x 100ppm) with cover crops than without cover crops, for all observations across all locations, nitrogen rates, and soil types (5% significance level);
- mean nitrate leaching (concentration) is lower with cover crops than without cover crops in Iowa, Indiana, and Illinois (10% significance level), but the mean difference is not significant at the 10% level for Minnesota.
- the simulations for the following agricultural districts indicated that mean nitrate leaching (concentration) is lower with cover crops than without cover crops in Central-East, Central-Central, Central-West, South-Central, South-East, and South-West regions in Iowa; North-East region in Iowa (5% significance level). No significant differences (at 10% level of significance) were found for North-West and North-Central and regions in Iowa; or South-East and South-West regions in Minnesota.
- mean nitrate leaching (concentration) is lower with cover crops than without cover crops in Tama, Canisteo and Webster soils (5% significance level).
- mean soil loss is lower (-0.284 kg/ha) with cover crops than without cover crops, for all nitrogen application rates across all locations (5% significance level).
- mean soil loss is lower with cover crops than without cover crops in Iowa, Illinois, and Minnesota (5% significance level), but no significant difference (at 10% significance level) was found in Indiana.
- the simulations for the following agricultural districts indicated that mean soil loss is lower with cover crops than without cover crops in South-West, Central-East, Central-Central, Central-West and South-Central (5% significance level); North-West and North-Central (10% significance level) regions in Iowa; South-East, and South-West (10% significance level) regions in Minnesota. No difference for North-East and South-East regions in Iowa (10% significance level).
- mean soil loss is lower with cover crops than without cover crops, for Tama, Canisteo and Webster soils (5% significance level).
Using linear regression techniques on simulations from the APSIM model, the following sets of marginal effects of cover crops were calculated:
- Marginal effects on soil loss using no cover, Nitrogen application rate 150 kg/ha, Tama soil in Iowa as baseline:
- Average soil loss in Baseline=1.53 kg/ha (1% significance level)
- Cover crops reduce soil loss by 0.26 kg/ha (1% significance level) after accounting for all regional differences
- Soil loss in Minnesota is 0.732 kg/ha lower than in Baseline (1% significance level)
- Soil loss in Illinois is 0.182 kg/ha higher than in Baseline (5% significance level)
- No significant difference in soil loss across different Nitrogen application levels.
- No significant difference in soil loss across Tama, Canisteo, or Webster soils.
- No significant difference in soil loss between Indiana and Baseline.
- Marginal effects on corn yields using no cover, Nitrogen application rate 150 kg/ha, Tama soil in Iowa as baseline:
- Mean corn yield in Baseline=165.6 bushels per acre (1% significance level)
- Cover crops increase corn yields by 1.117 bushels (1% significance level) after accounting for all regional differences
- Nitrogen application levels affect yields in baseline as expected (1% significance level)
- Mean corn yield in Webster soils is 1.20 bushels higher than in Baseline (5% significance level).
- No significant yield difference between Canisteo soils and Baseline.
- Corn yields 6.01 bushels higher in Minnesota than in Baseline (1% significance level)
- Corn yields 4.06 bushels lower in Illinois than in Baseline (1% significance level)
- No significant yield difference between Indiana and Baseline.
- Marginal effects on nitrate leaching using no cover, Nitrogen application rate 150 kg/ha, Tama soil in Iowa as baseline:
- Mean leaching in Baseline=0.085 mg/L (1% significance level)
- Cover crops reduce leaching by 0.025 mg/L (1% significance level) after accounting for all regional differences.
- N levels have the expected effects on leaching (1% significance level)
- Mean leaching in Webster soils is 0.047 higher than in Baseline (1% significance level)
- No leaching difference between Canisteo soils and Baseline.
- Mean leaching in Minnesota is 0.006 mg/L lower than in Baseline (5% significance level)
- Mean leaching in Indiana is 0.012 mg/L lower than in Baseline (1% significance level).
- No significant difference in mean leaching between Illinois and Baseline.
A similar analysis was conducted focusing on soybean yields in a corn/soybean rotations, but only for Canisteo soils and a Nitrogen application rate of 150 kg/ha. Our findings suggest that:
- mean soybean yields are higher (+1.66 bu/acre) with cover crops than without cover crops for all observations across all locations (5% significance level);
- mean soybean yields in Iowa are higher (+1.71 bu/acre) with cover crops than without cover crops (5% significance level);
- no significant mean soybean yield differences exists between systems with cover crops and without cover crops for Illinois, Indiana, or Minnesota, or within agricultural districts in Iowa or Minnesota.
An analysis of the marginal effects of cover crops on soybean yields in Canisteo soils in Central Iowa, using a Nitrogen application rate of 150 kg/ha as the baseline, suggest that:
- Mean soybean yield in Baseline=56.80 bushels (1% significance level)
- Cover crops increase soybean yields by 1.85 bushels (5% significance level) after accounting for all regional differences.
- Mean soybean yields are 3.88 bushels lower in South-East Minnesota than in Baseline (5% significance level)
- Mean soybean yields are 11.12 bushels lower in South-West Minnesota than in Baseline (1% significance level)
- Mean soybean yields are 5.24 bushels lower in Indiana than in Baseline (5% significance level)
- Mean soybean yields are 9.95 bushels lower in Illinois than in Baseline (5% significance level)
- Mean soybean yields are lower in southern Iowa regions and in Central-East and Central West Iowa regions than in Baseline.
- No significant yield difference exists between northern Iowa regions and Baseline.
Table 27. Marginal effects of cover crop use, soil type, nitrogen rate, and location on corn yields, corn biomass, soil loss, runoff, nitrate load, subsurface drainage, and nitrate leaching
|
Yield |
Biomass |
Soil loss |
Runoff |
Nitrate load |
Subs. Drain |
Nitrate Leaching (Concentration) |
|
|
|
bu/acre |
kg/ha |
ton/ha |
mm |
kg/ha |
mm |
mg/L |
|
(Intercept) |
165.6*** |
19478** |
1.237*** |
44.79*** |
15.97*** |
136.9*** |
0.093*** |
|
(0.891) |
(77.5) |
(0.080) |
(1.395) |
(0.912) |
(5.477) |
(0.004) |
|
|
Cover crop |
1.112*** |
83.27** |
-0.257*** |
-1.655** |
-5.998*** |
-5.794** |
-0.025*** |
|
(0.417) |
(36.3) |
(0.037) |
(0.653) |
(0.427) |
(2.565) |
(0.002) |
|
|
Nrate=100 kg/ha |
-9.726*** |
-903*** |
0.076 |
0.8917 |
-5.95*** |
0.622 |
-0.028*** |
|
(0.593) |
(51.6) |
(0.053) |
(0.929) |
(0.608) |
(3.648) |
(0.003) |
|
|
Nrate=200 kg/ha |
3.231*** |
302*** |
-0.018 |
-0.1687 |
6.293*** |
-2.162 |
0.03*** |
|
(0.586) |
(51.0) |
(0.052) |
(0.918) |
(0.600) |
(3.604) |
(0.003) |
|
|
Nrate=250 kg/ha |
4.295*** |
405*** |
-0.039 |
-0.3675 |
13.31*** |
-2.028 |
0.063*** |
|
(0.586) |
(51.0) |
(0.052) |
(0.918) |
(0.6010) |
(3.606) |
(0.003) |
|
|
Canisteo |
-0.843* |
-77.2* |
0.030 |
-1.1454 |
-10.27*** |
-114.3*** |
0.003 |
|
(0.510) |
(44.4)) |
(0.046) |
(0.798) |
(0.522) |
(3.135) |
(0.002) |
|
|
Webster |
1.223** |
105** |
0.024 |
-0.3746 |
37.62*** |
279.5*** |
0.047*** |
|
(0.510) |
(44.4) |
(0.046) |
(0.798) |
(0.522) |
(3.136) |
(0.002) |
|
|
IA-CE |
-1.422 |
-98.03 |
0.088 |
-3.182* |
-3.547*** |
-34.24*** |
0.005 |
|
(1.066) |
(92.7) |
(0.095) |
(1.667) |
(1.0910) |
(6.548) |
(0.005) |
|
|
IA-CW |
-1.422 |
-98.03 |
0.08765 |
-3.182* |
-3.547*** |
-34.24*** |
0.005 |
|
(1.065) |
(92.7) |
(0.095) |
(1.667) |
(1.0910) |
(6.548) |
(0.005) |
|
|
IA-NC |
11.62*** |
1294*** |
-0.349*** |
-9.412*** |
-3.491*** |
-7.216 |
-0.02*** |
|
(1.047) |
(91.1) |
(0.094) |
(1.640) |
(1.072) |
(6.439) |
(0.005) |
|
|
IA-NE |
7.388*** |
989*** |
0.104 |
2.762* |
-3.613*** |
17.5*** |
-0.023*** |
|
(1.036) |
(90.2) |
(0.093) |
(1.623) |
(1.061) |
(6.373) |
(0.005) |
|
|
IA-NW |
4.549*** |
829*** |
-0.359*** |
-11.96*** |
-7.679*** |
-61.23*** |
-0.01** |
|
(1.074) |
(93.5) |
(0.096) |
(1.682) |
(1.10) |
(6.604) |
(0.005) |
|
|
IA-SC |
-5.041*** |
-478*** |
1.173*** |
16.93*** |
-1.584 |
13.08** |
-0.016*** |
|
(1.049) |
(91.3) |
(0.094) |
(1.642) |
(1.074) |
(6.449) |
(0.005) |
|
|
IA-SE |
-7.615*** |
-766*** |
0.828*** |
9.815*** |
-0.944 |
19.8*** |
-0.015*** |
|
(1.039) |
(90.5) |
(0.093) |
(1.628) |
(1.065) |
(6.393) |
(0.005) |
|
|
IA-SW |
-7.860*** |
-891*** |
0.975*** |
16.337*** |
-1.336 |
-8.339 |
0.001 |
|
(1.037) |
(90.3) |
(0.093) |
(1.624) |
(1.062) |
(6.377) |
(0.005) |
|
|
IL |
-4.091*** |
-414*** |
0.477*** |
2.1883 |
0.430 |
35.73*** |
-0.01** |
|
(1.051) |
(91.5) |
(0.094) |
(1.646) |
(1.077) |
(6.466) |
(0.005) |
|
|
IN |
0.764 |
104.97 |
0.303*** |
-2.5861 |
2.43** |
66.09*** |
-0.021*** |
|
(1.032) |
(89.8) |
(0.092) |
(1.616) |
(1.057) |
(6.345) |
(0.005) |
|
|
MN-SE |
4.868*** |
961*** |
-0.187** |
-1.9514 |
-3.429*** |
21.27*** |
-0.022*** |
|
(1.055) |
(91.8) |
(0.094) |
(1.652) |
(1.081) |
(6.488) |
(0.005) |
|
|
MN-SW |
7.263*** |
1290*** |
-0.698*** |
-16.64*** |
-7.941*** |
-55.47*** |
-0.007 |
|
(1.065) |
(92.7) |
(0.095) |
(1.668) |
(1.091) |
(6.552) |
(0.005) |
|
|
Adjusted |
|
|
|||||
|
R-squared |
0.134 |
0.203 |
0.080 |
0.080 |
0.524 |
0.640 |
0.168 |
Significant codes: ***0.01, **0.05, *0.1
Figure 1. Nitrate concentration, load, and drainage averaged across locations and years for soil series Webster. For reference, doy 100 is April 10th, doy 180 is June 29th, and doy 300 is Oct 17th.
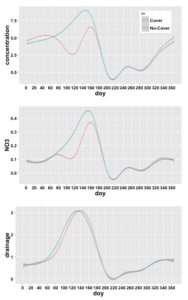
Figure 2. Number of days when nitrate concentrations exceed 10.4 mg/L, by nitrogen application rate and cover crop adoption status.
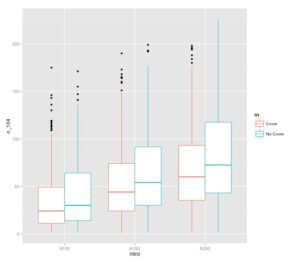
Hypotheses 2: results from interviews with water treatment plant managers.
Different water treatment plants use different methods to maintain nitrates below the federally mandated level of 10 mg/L. While all interviewed water treatment plants use blending of water from different sources as the most cost-effective way to provide safe drinking water, some plants solely rely on this method. Most interviewed plants have access to alternative ground water systems, while some rely mostly on surface water. Usually, large ground water systems (deep wells) are well maintained, fill up with naturally filtered water (through rocks, sand, etc.), and seldom observe spikes in nitrate concentration near or above the safety threshold level. When that occurs, water treatment plants blend such water with water from other wells with lower nitrate concentration to dilute nitrate levels per liter back to safe levels. For these plants, the costs associated with treating nitrates and turbidity stemming from agricultural production tend to be negligible, since blending decisions are made on a daily basis to maintain about three dozen parameters within drinking water standards and nitrate concentration and turbidity tend to be of secondary relevance (because most blending decisions are made based on other safety indicators).
For water treatment plants that rely on surface water (rivers or lakes), nitrate concentration and turbidity tend to carry more relevance for choosing treatment methods than for plants that rely on ground water. Blending remains the top choice whenever at least one source of raw water has low concentration levels. However, when blending is not an option, and nitrate removal specific equipment (ion-exchange or reverse osmosis) is available, a portion of the untreated water goes through such equipment and the output is blended with untreated water to produce a minimum cost blend of nitrate compliant raw water. Then, this blend continues the treatment process to achieve the remaining drinking water safety standards.
Des Moines Water Works (DMWW) in Iowa operates a reverse osmosis system in one location and an ion-exchange system in another location. Since reverse osmosis is not nitrate-specific, and the decision to use this equipment is never driven by nitrate levels or turbidity, we found no reason to impute the operational costs of this equipment solely to nitrate removal or turbidity. Only the ion-exchange system is nitrate-specific and is only turned on when blending and reverse osmosis are insufficient. Therefore, all operational costs of the ion-exchange are attributed to nitrate removal efforts: $644,896 in 2013; $325,912 in 2014; $1,401,308 in 2015; and $633,335 in 2016. DMWW serves about half a million customers, so a quick calculation assuming an annual cost of nitrate removal of $1.5 million would results in a monthly cost per customer of $0.25 per month. The cost to replace the existing equipment or expand the treatment facilities were not included in our calculations because we consider that those decisions are more related to the size of the customer base and normal depreciation of productive assets than to observed nitrate levels. The City of Decatur (Illinois) operates an ion-exchange system, but we were not able to have access to operational costs.
Combining the information from our interviews with water treatment plants and the partial budget results, we can approximate the additional acres that could be planted to cover crops if a sum equivalent to the highest observed annual costs to remove nitrates ($1.5 million) could be added to the existing pool of cost-share programs and new cover croppers would be willing to receive a $20 payment per acre to plant cover crops (despite the fact that on average farmers will see their net returns decline by around $15-$20 if cover crops are not used for grazing livestock or forage): $1.5 million / $20 per acre = 75,000 acres. Although 75,000 additional acres would result in a double-digit growth rate in cover crop acres for Iowa, they only represent 1.17% of all acres in the Raccoon River Watershed (6.4 million acres). In conclusion, and contrary to our expectations, potential savings in water treatment plants would be insufficient to scale up cover crop use even within a limited watershed. The focus of our analysis is very narrow by design, and many other environmental benefits from cover crops are not considered that could justify a heightened effort to expand the use of cover crops. Finally, it must be noted that results from our interviews with large water treatment plants do not apply to small communities facing high nitrate concentrations in small wells, and no alternative sources of water to blend.
- There is substantial variability in the net returns to cover crops, driven by the difference in yields obtained in fields with and without cover crops, planting and termination costs, and cost-share program payments.
- General agronomic and economic recommendations for all types of cover crops in Midwestern row crop production systems should be avoided, and instead recommendations should be issued for a specific region and a specific cover crop mix.
- For most farmers, cost-share payments are insufficient to cover all private costs associated with cover crop use, but are a critical incentive to support this practice.
- Grazing cover crops or harvesting them for forage is likely to generate sufficient additional revenue (or cost savings in an integrated crop/livestock production system) to result in overall positive returns to cover crops.
- Although partial budgets based on survey data suffer from several limitations related to the self-selection bias of survey respondents and the potential unrepresentativeness of the sample, they provide valuable information for farmers and policy makers. The calculated returns are based on field data (instead of experimental plots) from farmers that manage row crop production on acres with cover crops and on acres with no cover crops, and can be used as benchmarks for current and potential cover croppers, as well as ground-truth references for agricultural and conservation policy design.
- Agronomic simulations suggest that sustained cover crop use is likely to result in soybean yield increases, and generates positive environmental externalities: reduced nitrate leaching and soil erosion.
- However, additional economic incentives to scale up cover crop adoption cannot be currently justified by the potential cost savings to water treatment plants.
- The results of the present study (particularly those comparing net returns across different levels of experience with cover crops), in conjunction with a lack of market valuations for actual soil health, suggest that the necessary conditions to substantially scale up the use of cover crops are currently missing.
- Potential measures to improve the economic viability of cover crops without increasing government transfers to cover croppers include (1) the development of a more competitive market for cover crop seeds (offering high quality seed adapted to local conditions, at low cost); (2) promoting the use of cover crops for livestock grazing or forage; and (3) developing and promoting location-specific guidelines to facilitate the decision-making process for farmers, seed companies, and implement dealers, but particularly to minimize the yield drag on corn and soybeans, while containing planting and termination costs. An obvious but likely unsustainable alternative (due to federal and state budget constraints) to reduce the net losses derived from cover crop use is to increase the flow of public monies to adopters of the practice through cost-share payments, subsidized seed bags, discounted crop insurance premiums, tax credits, or similar incentives.
- It is critical for cover crop advocates to understand that cover crops cannot be scaled up to mainstream agriculture if the practice does not at least break-even in the short term. Given the potential short term losses if cover crop management is poor, cover crop advocates should not expect farmers to massively adopt cover crops solely based on their long-term effects on soil and water quality.
Education
- The findings of our project were communicated to farmers as stand-alone presentations or integrated into broader presentations during field days, workshops, and conferences.
- Stand-alone presentations to academic audiences were conducted through selected posters and selected posters at professional conferences.
- A stand-alone presentation of our results to undergraduate students of Advanced Farm Management (ECON330) in the Department of Economics at Iowa State University was conducted in Fall 2017.
Project Activities
Educational & Outreach Activities
3 Research Reports
Participation summary:
Field Days:
- Cover Crop Field Day-Rock Creek. Osage. Sep-21, 2017. Attendance: 30
- Cover Crop Field Day. Eagle Grove. Sep-22, 2017. Attendance: 35
- Watershed Academy. Boone. Oct-25, 2017. Attendance: 40
- Cover Crops for Risk Management. Corning. Nov-13, 2017. Attendance: 40
- Cover Crops for Source Water Training. Ames. Nov-14, 2017. Attendance: 3
- Cover Crops for Risk Management. Slater. Nov-21, 2017. Attendance: 55
- Cover crops for Crop Insurance. regional. Nov-28, 2017. Attendance: 200
- National Cover Crop Conference. Indianapolis. Dec-07, 2017. Attendance: 30
- Iowa Learning Farms Cover Crop Workshop. Oakland. Dec-13, 2017. Attendance: 40
- Cover Crops for Corn and Soybeans. Iowa Falls. Jan-02, 2018. Attendance: 40
- Cover crops for corn and soybeans. Yankton, SD. Jan-05, 2018. Attendance: 40
Webinars:
- “Cover Crop Economics: Thoughts and Data.” Cover Crop Working Group Webinar. August 1, 2017.http://www.practicalfarmers.org/farmer-knowledge/farminar-archive/cover-crop-economics-thoughts-data/ 97 archived views on PFI site; 222 views on Youtube (This presentation was not live, it was only recorded, so there were no live viewers and we have no survey feedback)
- “Integrating Livestock and Cover Crops for Profit in Nebraska.” Farminar. December 19, 2017. http://www.practicalfarmers.org/farmer-knowledge/farminar-archive/integrating-livestock-cover-crops-profit-nebraska/ 19 live viewers; 56 archived views
- “Integrating Livestock and Cover Crops for profit in Kansas.” Farminar. December 13, 2017. http://www.practicalfarmers.org/farmer-knowledge/farminar-archive/integrating-livestock-cover-crops-profit-kansas/ 24 live viewers; 53 archived views.
Presentations to Agricultural Professionals:
- Carlson, S. "Cover crops for corn and soybeans." NRCS field staff training. Des Moines, IA. Feb 15, 2018. 120 attendees.
- Carlson, S. “Keep Your Farmer Customers Happy With Better Cover Crop Recommendations.” Ag Industry & Crop Management Conference, Agribusiness Association of Iowa. Des Moines, IA. Feb 13, 2018. 45 attendees.
- Plastina, A., Miguez, F., Liu, F., Sawadgo, W., Carlson, S., and G. Marcillo. “How do cover crops affect whole farm profitability?” Practical Farmers of Iowa Annual Conference. Ames, IA. Jan 18, 2018. 80 attendees.
- Carlson, S. "Economics of Cover Crops." Pisces Foundation Water Quality Funders Meeting. Washington, DC. Jan-11, 2018. 12 attendees.
- Plastina, A., Miguez, F., Liu, F., Sawadgo, W., Carlson, S., and G. Marcillo. “How do cover crops affect whole farm profitability?” Integrated Crop Management Conference, Iowa State University Extension and Outreach. Ames, IA. Nov 29, 2017. 268 attendees.
- Gailans, S. “Soil fertility and nitrogen dynamics with a rye cover crop.” Crop Advantage Series, Iowa State University. Iowa City, IA. Jan 25, 2017. 50 attendees.
- Gailans, S. “Results from on-farm cover crop research projects and ideas for maximizing cover crop benefits.” Iowa Learning Farms Cover Crop Workshop. Oakland, IA. Dec 13, 2017. 40 attendees.
- Plastina, A. “Economic Evaluation of Cover Crops in Midwest Row Crop Farming.” USDA/NASS Upper Midwest Office. Des Moines, IA. Feb 27, 2017. 20 attendees.
Presentations at Professional Meetings (* indicates presenter):
- Marcillo, G. (*), and F. Miguez. 2017. "Towards sustainability in maize systems: A modeling evaluation of cover crops on US maize production." Selected Paper for XXII Latin American Maize Conference (XXII Reunión Latinoamericana de Maíz). Quevedo, Ecuador. September 27-29.
- Plastina, A. (*), Liu, F., Sawadgo, W., Miguez, F., and S. Carlson. 2017. "Partial budgets for cover crops in Midwest row crop farming." Conservation Infrastructure (CI) - Cover Crops Working Group. Iowa Farm Bureau Federation - West Des Moines. August 4. Available at: https://www.card.iastate.edu/products/presentations/files/cover_crop_economics_-_plastina.pdf
- Plastina, A. and F. Liu (*). 2016. “Comprehensive Partial Budgets for Cover crops in Midwest Row Crop Agriculture.” Selected Poster, Agricultural and Applied Economics Association and West & Western Agricultural Economics Association Joint Annual Meeting. Boston, MA. July 30 - Aug 2.
- Plastina, A., Miguez (*), F., Carlson, S., and F. Liu. 2016. “Economic Evaluation of Cover Crops in Midwest Row Crop Farming.” Invited Presentation, SARE Advisory Committee. Ames, IA. June 24.
Educational Tools:
- Edwards, W., and A. Plastina. Economics of Cover Crops: Projected Costs and Returns without Grazing. Decision Tool to be published in Ag Decision Maker Website and linked from Practical Farmers of Iowa's website.
Press articles:
- Plastina, A. “Figuring cost vs. return for cover crops.” Wallaces Farmer, Timely Tips Section. Feb 27, 2018. http://www.wallacesfarmer.com/management/figuring-cost-vs-return-cover-crops
- Alisha Bower. “Cover Crop Economics Survey: Participate Today!” Practical Farmers Blog. February 14, 2017. http://practicalfarmers.org/blog/2017/02/14/participate-today-cover-crop-economics-survey/
- Alisha Bower. “Making cover crop mixes pay off.” Wallaces Farmer. Mar 20, 2017. http://www.wallacesfarmer.com/cover-crops/making-cover-crop-mixes-pay
- Alisha Bower. “Weed suppression and cover crops finding the facts.” Wallaces Farmer. Feb 16, 2017. http://www.wallacesfarmer.com/cover-crops/weed-suppression-and-cover-crops-finding-facts
Peer Reviewed Publications:
- Plastina, A., Liu, F., Miguez, F., and S. Carlson. 2018. “Partial budgets for cover crops in Midwest row crop farming.” Journal of the American Society of Farm Managers and Rural Appraisers (in press).
- Plastina, A., Liu, F., Miguez, F., and S. Carlson. “Cover Crops Use in Midwestern U.S. Agriculture: Net Returns versus Perceived Benefits.” Renewable Agriculture and Food Systems. Under review.
- Plastina, A., Liu, F., Sawadgo, W., Carlson, S., Miguez, F., and G. Marcillo. “Annual Net Returns to Cover Crops in Iowa” Journal of Applied Farm Economics. Under review.
Research Reports (Practical Farmers of Iowa conducted economic analyses in each of the following on-farm trials solely because of the results of the regional survey):
- “RESEARCH REPORT: N Fertilizer Strategies for Corn Following Cover Crop.” Practical Farmers Blog. Stefan Gailans. November 20, 2017. http://www.practicalfarmers.org/blog/2017/11/20/research-report-n-fertilizer-strategies-corn-following-cover-crop/
- “Winter Cereal Rye Cover Crop Effect on Cash Crop Yield, Year 9.” Practical Farmers Blog. Stefan Gailans. November 30, 2017. http://www.practicalfarmers.org/blog/2017/11/30/winter-cereal-rye-cover-crop-effect-cash-crop-yield-year-9/
- “RESEARCH REPORT: Roll-Crimping Cover Crops and Soybean Seeding Date.” Practical Farmers Blog. Stefan Gailans. December 4, 2017. http://www.practicalfarmers.org/blog/2017/12/04/research-report-roll-crimping-cover-crops-soybean-seeding-date/
Learning Outcomes
- economic evaluation of cover crops
- cover crop/livestock integration
- enterprise diversification
Project Outcomes
- Follow up evaluation surveys were conducted among viewers of our two farminars:
- 87.5% reported a moderate to large change in knowledge.
- 37.5% reported they will make a change in production practices (62.5% reported N/A, 0% said "no").
- Comments included "Will add some diversity to my fall seeded cover crops that I use for grazing and will plant as early as I can;" and " I'll add oats as late summer cover crop."
2. The Conservation Infrastructure Initiative recommended to the Iowa Department of Agriculture and Land Stewardship an evaluation of the funding for conservation practices, in particular an evaluation of cover crop adoption and cost share practices.